Apache vs Immigrants from Albania Disability Age 5 to 17
COMPARE
Apache
Immigrants from Albania
Disability Age 5 to 17
Disability Age 5 to 17 Comparison
Apache
Immigrants from Albania
6.4%
DISABILITY AGE 5 TO 17
0.0/ 100
METRIC RATING
313th/ 347
METRIC RANK
5.5%
DISABILITY AGE 5 TO 17
83.1/ 100
METRIC RATING
147th/ 347
METRIC RANK
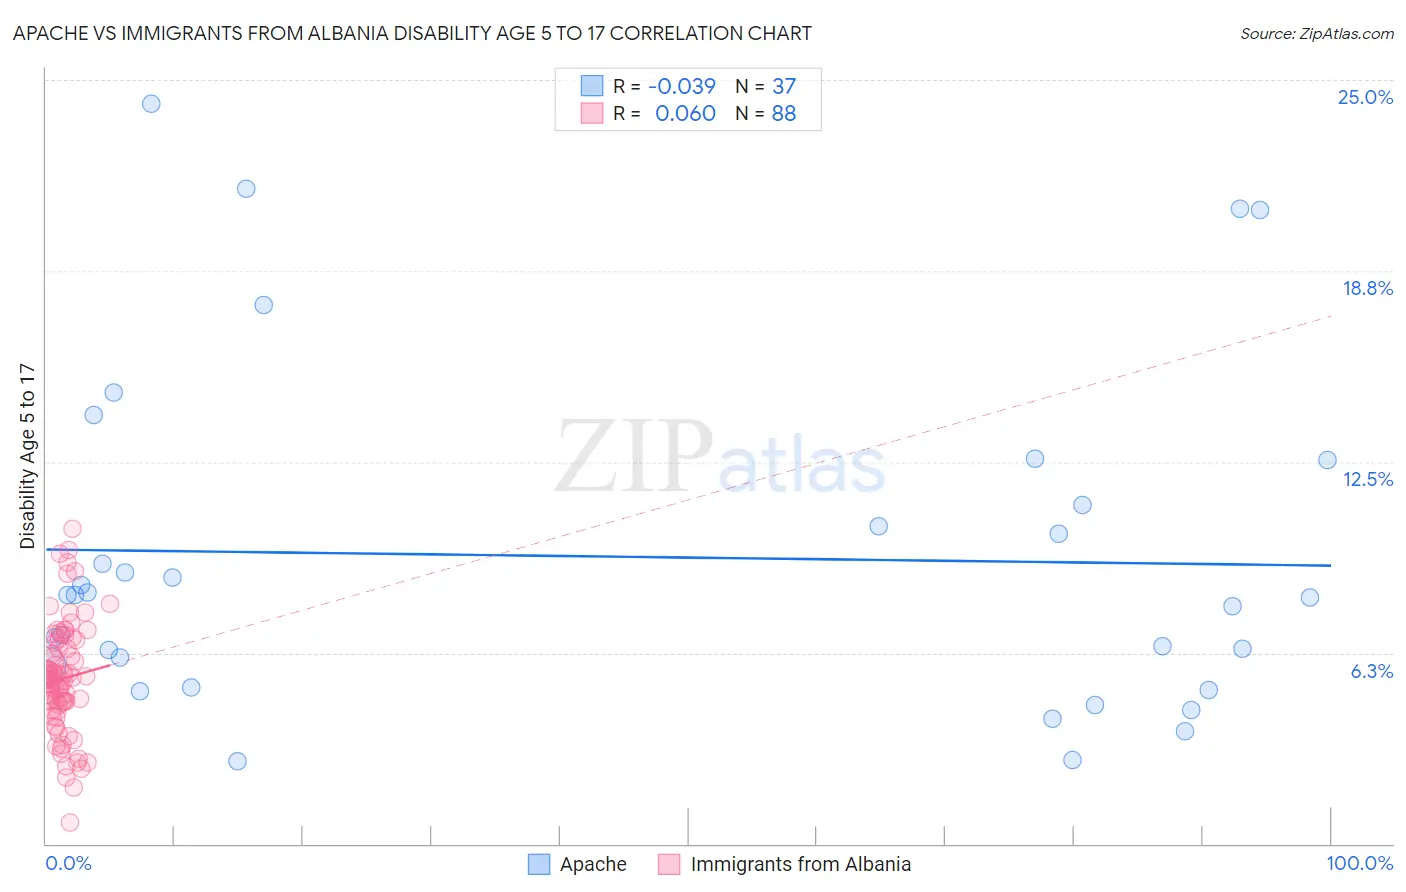
Apache vs Immigrants from Albania Disability Age 5 to 17 Correlation Chart
The statistical analysis conducted on geographies consisting of 229,980,606 people shows no correlation between the proportion of Apache and percentage of population with a disability between the ages 5 and 17 in the United States with a correlation coefficient (R) of -0.039 and weighted average of 6.4%. Similarly, the statistical analysis conducted on geographies consisting of 119,036,367 people shows a slight positive correlation between the proportion of Immigrants from Albania and percentage of population with a disability between the ages 5 and 17 in the United States with a correlation coefficient (R) of 0.060 and weighted average of 5.5%, a difference of 16.2%.
Disability Age 5 to 17 Correlation Summary
| Measurement | Apache | Immigrants from Albania |
| Minimum | 2.7% | 0.68% |
| Maximum | 24.2% | 10.3% |
| Range | 21.6% | 9.6% |
| Mean | 9.4% | 5.4% |
| Median | 8.2% | 5.4% |
| Interquartile 25% (IQ1) | 5.5% | 4.6% |
| Interquartile 75% (IQ3) | 11.8% | 6.5% |
| Interquartile Range (IQR) | 6.3% | 1.9% |
| Standard Deviation (Sample) | 5.5% | 1.8% |
| Standard Deviation (Population) | 5.4% | 1.8% |
Similar Demographics by Disability Age 5 to 17
Demographics Similar to Apache by Disability Age 5 to 17
In terms of disability age 5 to 17, the demographic groups most similar to Apache are Bermudan (6.4%, a difference of 0.38%), Immigrants from Dominica (6.3%, a difference of 0.49%), French (6.4%, a difference of 0.51%), Alaskan Athabascan (6.3%, a difference of 0.54%), and Hmong (6.3%, a difference of 0.67%).
| Demographics | Rating | Rank | Disability Age 5 to 17 |
| Immigrants | Nonimmigrants | 0.0 /100 | #306 | Tragic 6.3% |
| Bahamians | 0.0 /100 | #307 | Tragic 6.3% |
| Scotch-Irish | 0.0 /100 | #308 | Tragic 6.3% |
| Hmong | 0.0 /100 | #309 | Tragic 6.3% |
| Alaskan Athabascans | 0.0 /100 | #310 | Tragic 6.3% |
| Immigrants | Dominica | 0.0 /100 | #311 | Tragic 6.3% |
| Bermudans | 0.0 /100 | #312 | Tragic 6.4% |
| Apache | 0.0 /100 | #313 | Tragic 6.4% |
| French | 0.0 /100 | #314 | Tragic 6.4% |
| Immigrants | Portugal | 0.0 /100 | #315 | Tragic 6.4% |
| Immigrants | Dominican Republic | 0.0 /100 | #316 | Tragic 6.4% |
| Kiowa | 0.0 /100 | #317 | Tragic 6.4% |
| Comanche | 0.0 /100 | #318 | Tragic 6.4% |
| Delaware | 0.0 /100 | #319 | Tragic 6.5% |
| Africans | 0.0 /100 | #320 | Tragic 6.5% |
Demographics Similar to Immigrants from Albania by Disability Age 5 to 17
In terms of disability age 5 to 17, the demographic groups most similar to Immigrants from Albania are Albanian (5.5%, a difference of 0.060%), Samoan (5.5%, a difference of 0.10%), Central American (5.5%, a difference of 0.13%), Guatemalan (5.5%, a difference of 0.13%), and Estonian (5.5%, a difference of 0.20%).
| Demographics | Rating | Rank | Disability Age 5 to 17 |
| Immigrants | Netherlands | 90.5 /100 | #140 | Exceptional 5.4% |
| South American Indians | 89.3 /100 | #141 | Excellent 5.5% |
| Colombians | 88.0 /100 | #142 | Excellent 5.5% |
| Immigrants | Hungary | 87.9 /100 | #143 | Excellent 5.5% |
| Pakistanis | 87.3 /100 | #144 | Excellent 5.5% |
| Immigrants | Guatemala | 86.6 /100 | #145 | Excellent 5.5% |
| Albanians | 83.7 /100 | #146 | Excellent 5.5% |
| Immigrants | Albania | 83.1 /100 | #147 | Excellent 5.5% |
| Samoans | 81.9 /100 | #148 | Excellent 5.5% |
| Central Americans | 81.6 /100 | #149 | Excellent 5.5% |
| Guatemalans | 81.5 /100 | #150 | Excellent 5.5% |
| Estonians | 80.8 /100 | #151 | Excellent 5.5% |
| Ute | 80.6 /100 | #152 | Excellent 5.5% |
| Ecuadorians | 79.7 /100 | #153 | Good 5.5% |
| Australians | 78.8 /100 | #154 | Good 5.5% |