Apache vs Immigrants from Singapore Disability Age 5 to 17
COMPARE
Apache
Immigrants from Singapore
Disability Age 5 to 17
Disability Age 5 to 17 Comparison
Apache
Immigrants from Singapore
6.4%
DISABILITY AGE 5 TO 17
0.0/ 100
METRIC RATING
313th/ 347
METRIC RANK
4.7%
DISABILITY AGE 5 TO 17
100.0/ 100
METRIC RATING
16th/ 347
METRIC RANK
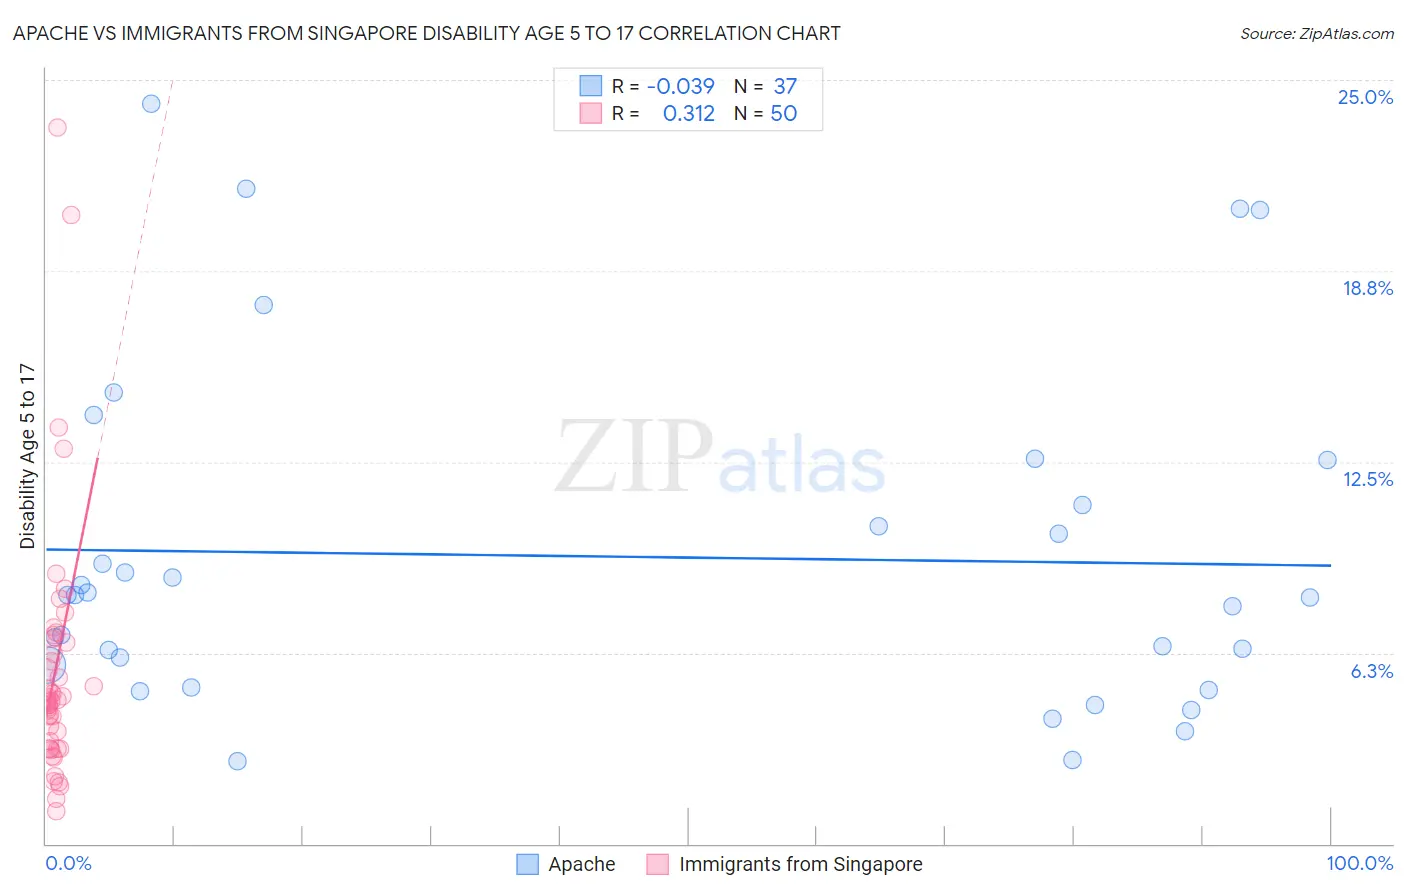
Apache vs Immigrants from Singapore Disability Age 5 to 17 Correlation Chart
The statistical analysis conducted on geographies consisting of 229,980,606 people shows no correlation between the proportion of Apache and percentage of population with a disability between the ages 5 and 17 in the United States with a correlation coefficient (R) of -0.039 and weighted average of 6.4%. Similarly, the statistical analysis conducted on geographies consisting of 136,920,724 people shows a mild positive correlation between the proportion of Immigrants from Singapore and percentage of population with a disability between the ages 5 and 17 in the United States with a correlation coefficient (R) of 0.312 and weighted average of 4.7%, a difference of 35.3%.
Disability Age 5 to 17 Correlation Summary
| Measurement | Apache | Immigrants from Singapore |
| Minimum | 2.7% | 1.1% |
| Maximum | 24.2% | 23.4% |
| Range | 21.6% | 22.4% |
| Mean | 9.4% | 5.6% |
| Median | 8.2% | 4.7% |
| Interquartile 25% (IQ1) | 5.5% | 3.1% |
| Interquartile 75% (IQ3) | 11.8% | 6.6% |
| Interquartile Range (IQR) | 6.3% | 3.5% |
| Standard Deviation (Sample) | 5.5% | 4.2% |
| Standard Deviation (Population) | 5.4% | 4.1% |
Similar Demographics by Disability Age 5 to 17
Demographics Similar to Apache by Disability Age 5 to 17
In terms of disability age 5 to 17, the demographic groups most similar to Apache are Bermudan (6.4%, a difference of 0.38%), Immigrants from Dominica (6.3%, a difference of 0.49%), French (6.4%, a difference of 0.51%), Alaskan Athabascan (6.3%, a difference of 0.54%), and Hmong (6.3%, a difference of 0.67%).
| Demographics | Rating | Rank | Disability Age 5 to 17 |
| Immigrants | Nonimmigrants | 0.0 /100 | #306 | Tragic 6.3% |
| Bahamians | 0.0 /100 | #307 | Tragic 6.3% |
| Scotch-Irish | 0.0 /100 | #308 | Tragic 6.3% |
| Hmong | 0.0 /100 | #309 | Tragic 6.3% |
| Alaskan Athabascans | 0.0 /100 | #310 | Tragic 6.3% |
| Immigrants | Dominica | 0.0 /100 | #311 | Tragic 6.3% |
| Bermudans | 0.0 /100 | #312 | Tragic 6.4% |
| Apache | 0.0 /100 | #313 | Tragic 6.4% |
| French | 0.0 /100 | #314 | Tragic 6.4% |
| Immigrants | Portugal | 0.0 /100 | #315 | Tragic 6.4% |
| Immigrants | Dominican Republic | 0.0 /100 | #316 | Tragic 6.4% |
| Kiowa | 0.0 /100 | #317 | Tragic 6.4% |
| Comanche | 0.0 /100 | #318 | Tragic 6.4% |
| Delaware | 0.0 /100 | #319 | Tragic 6.5% |
| Africans | 0.0 /100 | #320 | Tragic 6.5% |
Demographics Similar to Immigrants from Singapore by Disability Age 5 to 17
In terms of disability age 5 to 17, the demographic groups most similar to Immigrants from Singapore are Chinese (4.7%, a difference of 0.42%), Arapaho (4.7%, a difference of 0.46%), Immigrants from South Central Asia (4.7%, a difference of 0.48%), Immigrants from Korea (4.7%, a difference of 0.63%), and Immigrants from Uzbekistan (4.8%, a difference of 0.97%).
| Demographics | Rating | Rank | Disability Age 5 to 17 |
| Immigrants | Eastern Asia | 100.0 /100 | #9 | Exceptional 4.6% |
| Immigrants | India | 100.0 /100 | #10 | Exceptional 4.6% |
| Armenians | 100.0 /100 | #11 | Exceptional 4.6% |
| Iranians | 100.0 /100 | #12 | Exceptional 4.6% |
| Thais | 100.0 /100 | #13 | Exceptional 4.7% |
| Immigrants | Korea | 100.0 /100 | #14 | Exceptional 4.7% |
| Chinese | 100.0 /100 | #15 | Exceptional 4.7% |
| Immigrants | Singapore | 100.0 /100 | #16 | Exceptional 4.7% |
| Arapaho | 100.0 /100 | #17 | Exceptional 4.7% |
| Immigrants | South Central Asia | 100.0 /100 | #18 | Exceptional 4.7% |
| Immigrants | Uzbekistan | 100.0 /100 | #19 | Exceptional 4.8% |
| Burmese | 100.0 /100 | #20 | Exceptional 4.8% |
| Yup'ik | 100.0 /100 | #21 | Exceptional 4.8% |
| Asians | 100.0 /100 | #22 | Exceptional 4.8% |
| Immigrants | Bolivia | 100.0 /100 | #23 | Exceptional 4.8% |