Costa Rican vs Immigrants from Liberia Disability Age 5 to 17
COMPARE
Costa Rican
Immigrants from Liberia
Disability Age 5 to 17
Disability Age 5 to 17 Comparison
Costa Ricans
Immigrants from Liberia
5.6%
DISABILITY AGE 5 TO 17
50.0/ 100
METRIC RATING
174th/ 347
METRIC RANK
6.1%
DISABILITY AGE 5 TO 17
0.1/ 100
METRIC RATING
278th/ 347
METRIC RANK
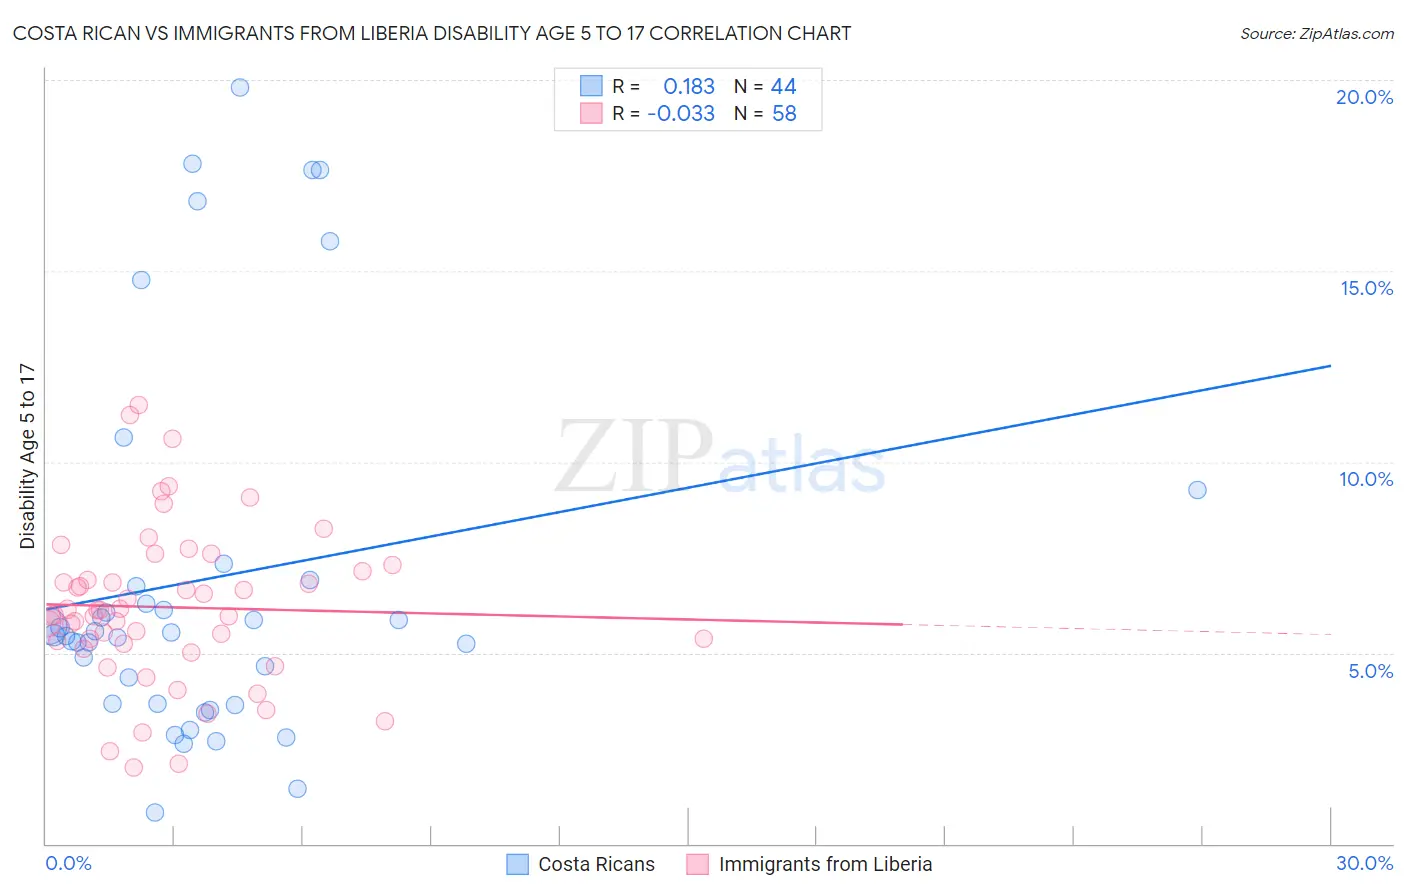
Costa Rican vs Immigrants from Liberia Disability Age 5 to 17 Correlation Chart
The statistical analysis conducted on geographies consisting of 252,489,466 people shows a poor positive correlation between the proportion of Costa Ricans and percentage of population with a disability between the ages 5 and 17 in the United States with a correlation coefficient (R) of 0.183 and weighted average of 5.6%. Similarly, the statistical analysis conducted on geographies consisting of 135,071,303 people shows no correlation between the proportion of Immigrants from Liberia and percentage of population with a disability between the ages 5 and 17 in the United States with a correlation coefficient (R) of -0.033 and weighted average of 6.1%, a difference of 8.9%.
Disability Age 5 to 17 Correlation Summary
| Measurement | Costa Rican | Immigrants from Liberia |
| Minimum | 0.81% | 2.0% |
| Maximum | 19.8% | 11.5% |
| Range | 19.0% | 9.5% |
| Mean | 6.9% | 6.2% |
| Median | 5.5% | 6.0% |
| Interquartile 25% (IQ1) | 3.7% | 5.3% |
| Interquartile 75% (IQ3) | 6.8% | 7.1% |
| Interquartile Range (IQR) | 3.2% | 1.9% |
| Standard Deviation (Sample) | 4.9% | 2.0% |
| Standard Deviation (Population) | 4.8% | 2.0% |
Similar Demographics by Disability Age 5 to 17
Demographics Similar to Costa Ricans by Disability Age 5 to 17
In terms of disability age 5 to 17, the demographic groups most similar to Costa Ricans are Shoshone (5.6%, a difference of 0.030%), Immigrants from Central America (5.6%, a difference of 0.030%), Uruguayan (5.6%, a difference of 0.050%), Ukrainian (5.6%, a difference of 0.080%), and Immigrants from Western Europe (5.6%, a difference of 0.11%).
| Demographics | Rating | Rank | Disability Age 5 to 17 |
| Immigrants | Burma/Myanmar | 59.3 /100 | #167 | Average 5.6% |
| Iraqis | 56.0 /100 | #168 | Average 5.6% |
| Immigrants | Norway | 55.7 /100 | #169 | Average 5.6% |
| Serbians | 54.0 /100 | #170 | Average 5.6% |
| Immigrants | Iraq | 53.9 /100 | #171 | Average 5.6% |
| Ukrainians | 51.5 /100 | #172 | Average 5.6% |
| Uruguayans | 51.0 /100 | #173 | Average 5.6% |
| Costa Ricans | 50.0 /100 | #174 | Average 5.6% |
| Shoshone | 49.4 /100 | #175 | Average 5.6% |
| Immigrants | Central America | 49.4 /100 | #176 | Average 5.6% |
| Immigrants | Western Europe | 47.8 /100 | #177 | Average 5.6% |
| Immigrants | Trinidad and Tobago | 47.6 /100 | #178 | Average 5.6% |
| Immigrants | Barbados | 40.5 /100 | #179 | Average 5.6% |
| Immigrants | Uruguay | 37.7 /100 | #180 | Fair 5.6% |
| Immigrants | England | 36.4 /100 | #181 | Fair 5.6% |
Demographics Similar to Immigrants from Liberia by Disability Age 5 to 17
In terms of disability age 5 to 17, the demographic groups most similar to Immigrants from Liberia are Puget Sound Salish (6.1%, a difference of 0.080%), Immigrants from Jamaica (6.1%, a difference of 0.14%), Portuguese (6.1%, a difference of 0.28%), Scottish (6.1%, a difference of 0.53%), and German (6.1%, a difference of 0.78%).
| Demographics | Rating | Rank | Disability Age 5 to 17 |
| Immigrants | Zaire | 0.2 /100 | #271 | Tragic 6.0% |
| Finns | 0.2 /100 | #272 | Tragic 6.0% |
| Alaska Natives | 0.2 /100 | #273 | Tragic 6.0% |
| Cheyenne | 0.2 /100 | #274 | Tragic 6.0% |
| Dutch | 0.2 /100 | #275 | Tragic 6.0% |
| Japanese | 0.1 /100 | #276 | Tragic 6.1% |
| Puget Sound Salish | 0.1 /100 | #277 | Tragic 6.1% |
| Immigrants | Liberia | 0.1 /100 | #278 | Tragic 6.1% |
| Immigrants | Jamaica | 0.1 /100 | #279 | Tragic 6.1% |
| Portuguese | 0.1 /100 | #280 | Tragic 6.1% |
| Scottish | 0.0 /100 | #281 | Tragic 6.1% |
| Germans | 0.0 /100 | #282 | Tragic 6.1% |
| Ugandans | 0.0 /100 | #283 | Tragic 6.2% |
| Sub-Saharan Africans | 0.0 /100 | #284 | Tragic 6.2% |
| English | 0.0 /100 | #285 | Tragic 6.2% |