Cuban vs Immigrants from Liberia Disability Age 5 to 17
COMPARE
Cuban
Immigrants from Liberia
Disability Age 5 to 17
Disability Age 5 to 17 Comparison
Cubans
Immigrants from Liberia
5.3%
DISABILITY AGE 5 TO 17
97.8/ 100
METRIC RATING
115th/ 347
METRIC RANK
6.1%
DISABILITY AGE 5 TO 17
0.1/ 100
METRIC RATING
278th/ 347
METRIC RANK
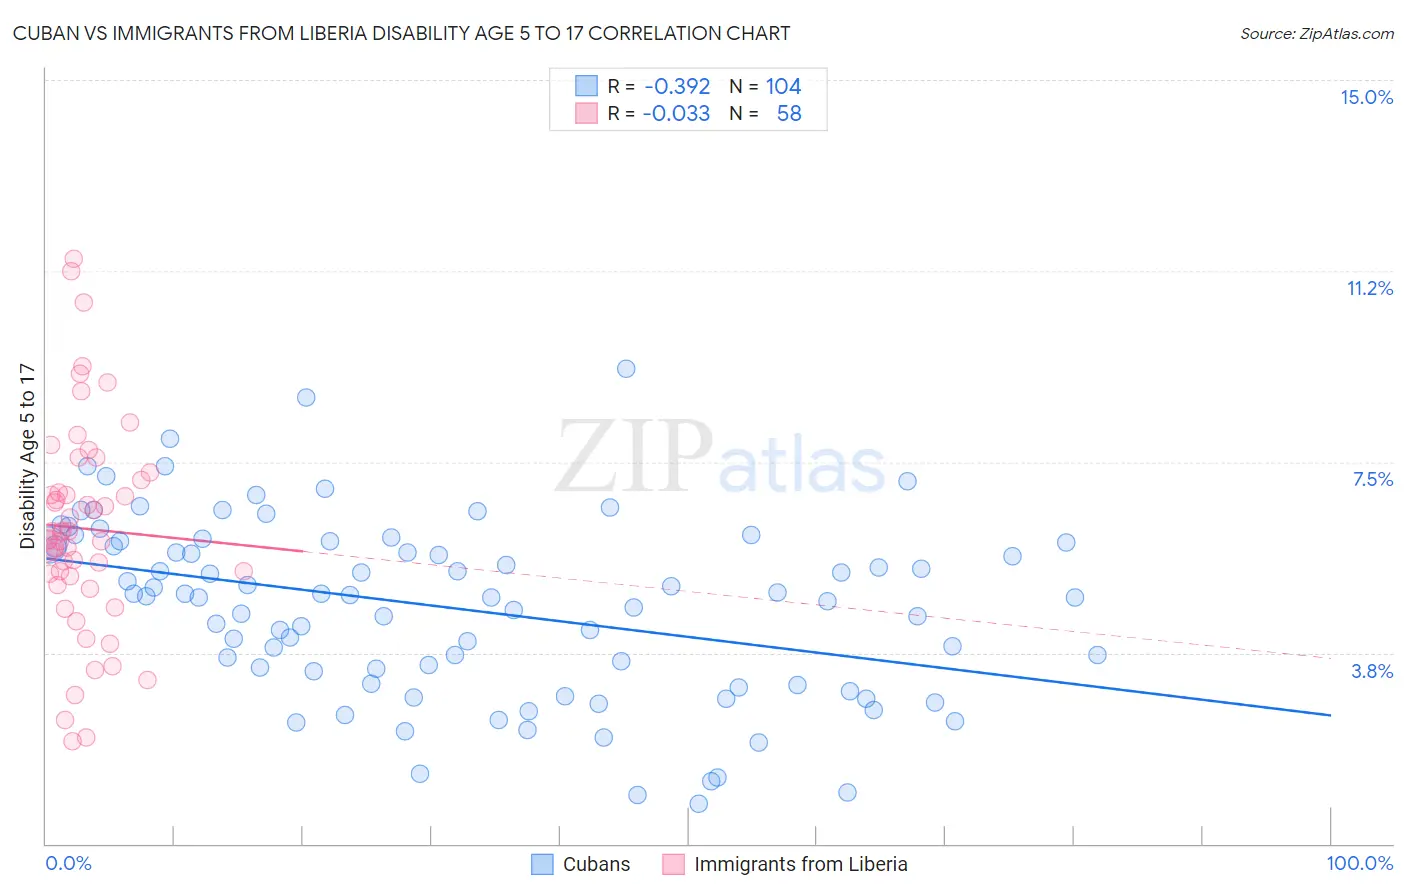
Cuban vs Immigrants from Liberia Disability Age 5 to 17 Correlation Chart
The statistical analysis conducted on geographies consisting of 444,786,844 people shows a mild negative correlation between the proportion of Cubans and percentage of population with a disability between the ages 5 and 17 in the United States with a correlation coefficient (R) of -0.392 and weighted average of 5.3%. Similarly, the statistical analysis conducted on geographies consisting of 135,071,303 people shows no correlation between the proportion of Immigrants from Liberia and percentage of population with a disability between the ages 5 and 17 in the United States with a correlation coefficient (R) of -0.033 and weighted average of 6.1%, a difference of 14.3%.
Disability Age 5 to 17 Correlation Summary
| Measurement | Cuban | Immigrants from Liberia |
| Minimum | 0.78% | 2.0% |
| Maximum | 9.3% | 11.5% |
| Range | 8.5% | 9.5% |
| Mean | 4.6% | 6.2% |
| Median | 4.9% | 6.0% |
| Interquartile 25% (IQ1) | 3.3% | 5.3% |
| Interquartile 75% (IQ3) | 5.9% | 7.1% |
| Interquartile Range (IQR) | 2.6% | 1.9% |
| Standard Deviation (Sample) | 1.8% | 2.0% |
| Standard Deviation (Population) | 1.8% | 2.0% |
Similar Demographics by Disability Age 5 to 17
Demographics Similar to Cubans by Disability Age 5 to 17
In terms of disability age 5 to 17, the demographic groups most similar to Cubans are Immigrants from Northern Europe (5.3%, a difference of 0.010%), Aleut (5.3%, a difference of 0.040%), Cypriot (5.3%, a difference of 0.060%), Immigrants from Latvia (5.3%, a difference of 0.080%), and Ethiopian (5.3%, a difference of 0.10%).
| Demographics | Rating | Rank | Disability Age 5 to 17 |
| Immigrants | South Africa | 98.1 /100 | #108 | Exceptional 5.3% |
| Immigrants | Northern Africa | 98.1 /100 | #109 | Exceptional 5.3% |
| Immigrants | Eritrea | 98.0 /100 | #110 | Exceptional 5.3% |
| Ethiopians | 97.9 /100 | #111 | Exceptional 5.3% |
| Immigrants | Latvia | 97.9 /100 | #112 | Exceptional 5.3% |
| Aleuts | 97.8 /100 | #113 | Exceptional 5.3% |
| Immigrants | Northern Europe | 97.8 /100 | #114 | Exceptional 5.3% |
| Cubans | 97.8 /100 | #115 | Exceptional 5.3% |
| Cypriots | 97.7 /100 | #116 | Exceptional 5.3% |
| Immigrants | Afghanistan | 97.4 /100 | #117 | Exceptional 5.3% |
| South Americans | 97.1 /100 | #118 | Exceptional 5.4% |
| Immigrants | South America | 97.1 /100 | #119 | Exceptional 5.4% |
| Immigrants | Immigrants | 97.0 /100 | #120 | Exceptional 5.4% |
| Maltese | 96.0 /100 | #121 | Exceptional 5.4% |
| Chileans | 95.8 /100 | #122 | Exceptional 5.4% |
Demographics Similar to Immigrants from Liberia by Disability Age 5 to 17
In terms of disability age 5 to 17, the demographic groups most similar to Immigrants from Liberia are Puget Sound Salish (6.1%, a difference of 0.080%), Immigrants from Jamaica (6.1%, a difference of 0.14%), Portuguese (6.1%, a difference of 0.28%), Scottish (6.1%, a difference of 0.53%), and German (6.1%, a difference of 0.78%).
| Demographics | Rating | Rank | Disability Age 5 to 17 |
| Immigrants | Zaire | 0.2 /100 | #271 | Tragic 6.0% |
| Finns | 0.2 /100 | #272 | Tragic 6.0% |
| Alaska Natives | 0.2 /100 | #273 | Tragic 6.0% |
| Cheyenne | 0.2 /100 | #274 | Tragic 6.0% |
| Dutch | 0.2 /100 | #275 | Tragic 6.0% |
| Japanese | 0.1 /100 | #276 | Tragic 6.1% |
| Puget Sound Salish | 0.1 /100 | #277 | Tragic 6.1% |
| Immigrants | Liberia | 0.1 /100 | #278 | Tragic 6.1% |
| Immigrants | Jamaica | 0.1 /100 | #279 | Tragic 6.1% |
| Portuguese | 0.1 /100 | #280 | Tragic 6.1% |
| Scottish | 0.0 /100 | #281 | Tragic 6.1% |
| Germans | 0.0 /100 | #282 | Tragic 6.1% |
| Ugandans | 0.0 /100 | #283 | Tragic 6.2% |
| Sub-Saharan Africans | 0.0 /100 | #284 | Tragic 6.2% |
| English | 0.0 /100 | #285 | Tragic 6.2% |