Apache vs Immigrants from Liberia In Labor Force | Age 25-29
COMPARE
Apache
Immigrants from Liberia
In Labor Force | Age 25-29
In Labor Force | Age 25-29 Comparison
Apache
Immigrants from Liberia
79.2%
IN LABOR FORCE | AGE 25-29
0.0/ 100
METRIC RATING
336th/ 347
METRIC RANK
85.9%
IN LABOR FORCE | AGE 25-29
100.0/ 100
METRIC RATING
29th/ 347
METRIC RANK
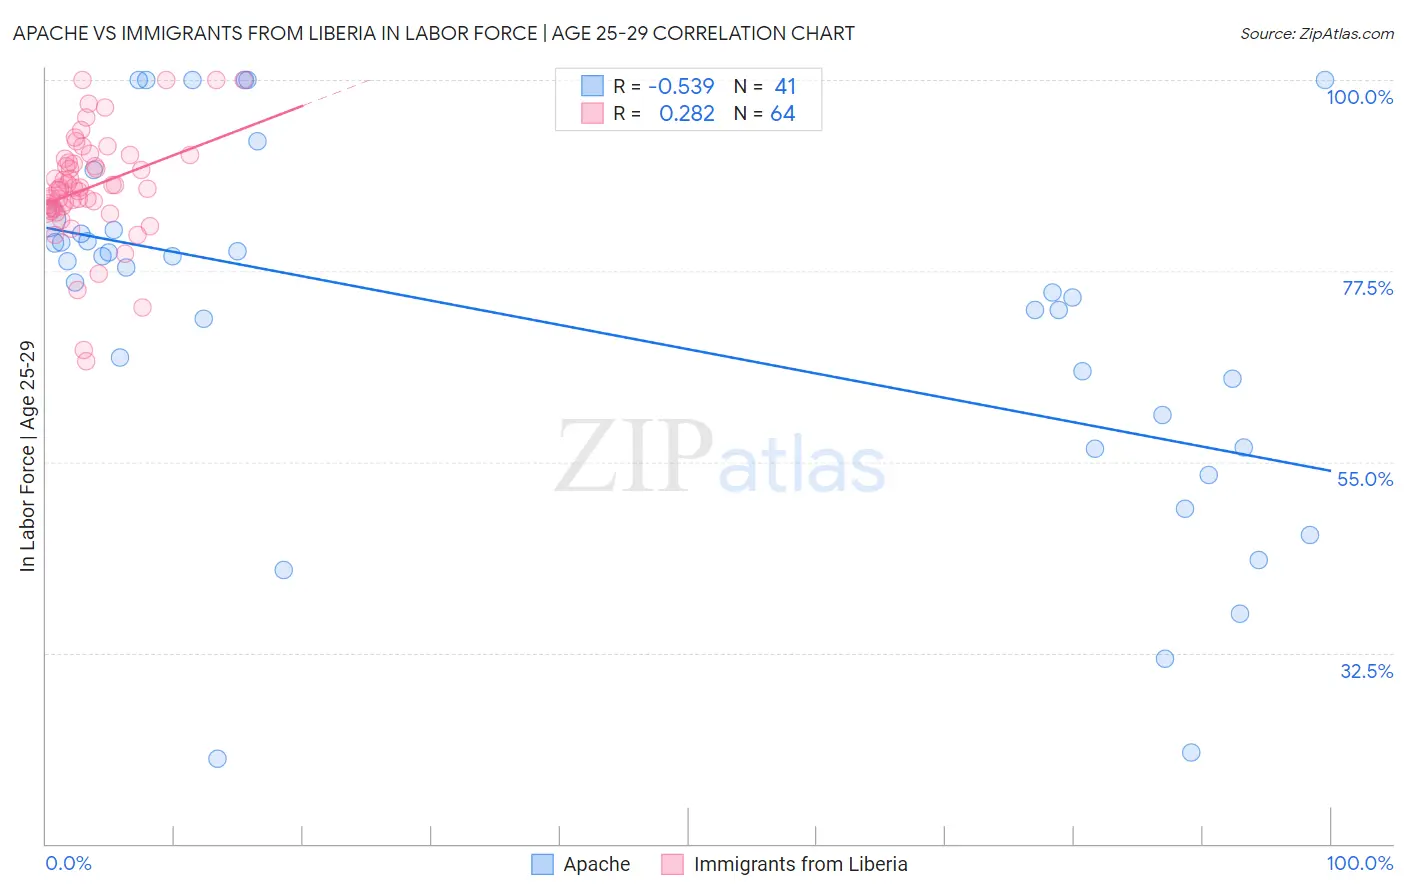
Apache vs Immigrants from Liberia In Labor Force | Age 25-29 Correlation Chart
The statistical analysis conducted on geographies consisting of 231,063,738 people shows a substantial negative correlation between the proportion of Apache and labor force participation rate among population between the ages 25 and 29 in the United States with a correlation coefficient (R) of -0.539 and weighted average of 79.2%. Similarly, the statistical analysis conducted on geographies consisting of 135,263,214 people shows a weak positive correlation between the proportion of Immigrants from Liberia and labor force participation rate among population between the ages 25 and 29 in the United States with a correlation coefficient (R) of 0.282 and weighted average of 85.9%, a difference of 8.4%.
In Labor Force | Age 25-29 Correlation Summary
| Measurement | Apache | Immigrants from Liberia |
| Minimum | 20.0% | 66.9% |
| Maximum | 100.0% | 100.0% |
| Range | 80.0% | 33.1% |
| Mean | 70.9% | 87.3% |
| Median | 76.2% | 87.2% |
| Interquartile 25% (IQ1) | 56.6% | 84.9% |
| Interquartile 75% (IQ3) | 82.1% | 90.5% |
| Interquartile Range (IQR) | 25.5% | 5.6% |
| Standard Deviation (Sample) | 21.4% | 6.5% |
| Standard Deviation (Population) | 21.2% | 6.4% |
Similar Demographics by In Labor Force | Age 25-29
Demographics Similar to Apache by In Labor Force | Age 25-29
In terms of in labor force | age 25-29, the demographic groups most similar to Apache are Native/Alaskan (79.3%, a difference of 0.070%), Yuman (79.3%, a difference of 0.16%), Sioux (79.7%, a difference of 0.57%), Inupiat (79.8%, a difference of 0.68%), and Crow (78.6%, a difference of 0.76%).
| Demographics | Rating | Rank | In Labor Force | Age 25-29 |
| Yakama | 0.0 /100 | #329 | Tragic 80.6% |
| Puerto Ricans | 0.0 /100 | #330 | Tragic 80.4% |
| Cheyenne | 0.0 /100 | #331 | Tragic 80.3% |
| Inupiat | 0.0 /100 | #332 | Tragic 79.8% |
| Sioux | 0.0 /100 | #333 | Tragic 79.7% |
| Yuman | 0.0 /100 | #334 | Tragic 79.3% |
| Natives/Alaskans | 0.0 /100 | #335 | Tragic 79.3% |
| Apache | 0.0 /100 | #336 | Tragic 79.2% |
| Crow | 0.0 /100 | #337 | Tragic 78.6% |
| Lumbee | 0.0 /100 | #338 | Tragic 78.3% |
| Immigrants | Yemen | 0.0 /100 | #339 | Tragic 78.2% |
| Paiute | 0.0 /100 | #340 | Tragic 78.1% |
| Tohono O'odham | 0.0 /100 | #341 | Tragic 77.5% |
| Pueblo | 0.0 /100 | #342 | Tragic 77.5% |
| Arapaho | 0.0 /100 | #343 | Tragic 76.6% |
Demographics Similar to Immigrants from Liberia by In Labor Force | Age 25-29
In terms of in labor force | age 25-29, the demographic groups most similar to Immigrants from Liberia are Ugandan (85.9%, a difference of 0.0%), Paraguayan (85.9%, a difference of 0.010%), Immigrants from North Macedonia (85.9%, a difference of 0.020%), Immigrants from Serbia (85.9%, a difference of 0.040%), and German Russian (85.8%, a difference of 0.050%).
| Demographics | Rating | Rank | In Labor Force | Age 25-29 |
| Cambodians | 100.0 /100 | #22 | Exceptional 86.0% |
| Immigrants | Uganda | 100.0 /100 | #23 | Exceptional 86.0% |
| Immigrants | Eastern Africa | 100.0 /100 | #24 | Exceptional 86.0% |
| Sudanese | 100.0 /100 | #25 | Exceptional 85.9% |
| Immigrants | North Macedonia | 100.0 /100 | #26 | Exceptional 85.9% |
| Paraguayans | 100.0 /100 | #27 | Exceptional 85.9% |
| Ugandans | 100.0 /100 | #28 | Exceptional 85.9% |
| Immigrants | Liberia | 100.0 /100 | #29 | Exceptional 85.9% |
| Immigrants | Serbia | 100.0 /100 | #30 | Exceptional 85.9% |
| German Russians | 100.0 /100 | #31 | Exceptional 85.8% |
| Slovaks | 100.0 /100 | #32 | Exceptional 85.8% |
| Immigrants | Bulgaria | 100.0 /100 | #33 | Exceptional 85.8% |
| Lithuanians | 99.9 /100 | #34 | Exceptional 85.8% |
| Cypriots | 99.9 /100 | #35 | Exceptional 85.8% |
| Immigrants | Nepal | 99.9 /100 | #36 | Exceptional 85.8% |