Apache vs Ecuadorian Self-Care Disability
COMPARE
Apache
Ecuadorian
Self-Care Disability
Self-Care Disability Comparison
Apache
Ecuadorians
2.7%
SELF-CARE DISABILITY
0.0/ 100
METRIC RATING
282nd/ 347
METRIC RANK
2.6%
SELF-CARE DISABILITY
4.7/ 100
METRIC RATING
213th/ 347
METRIC RANK
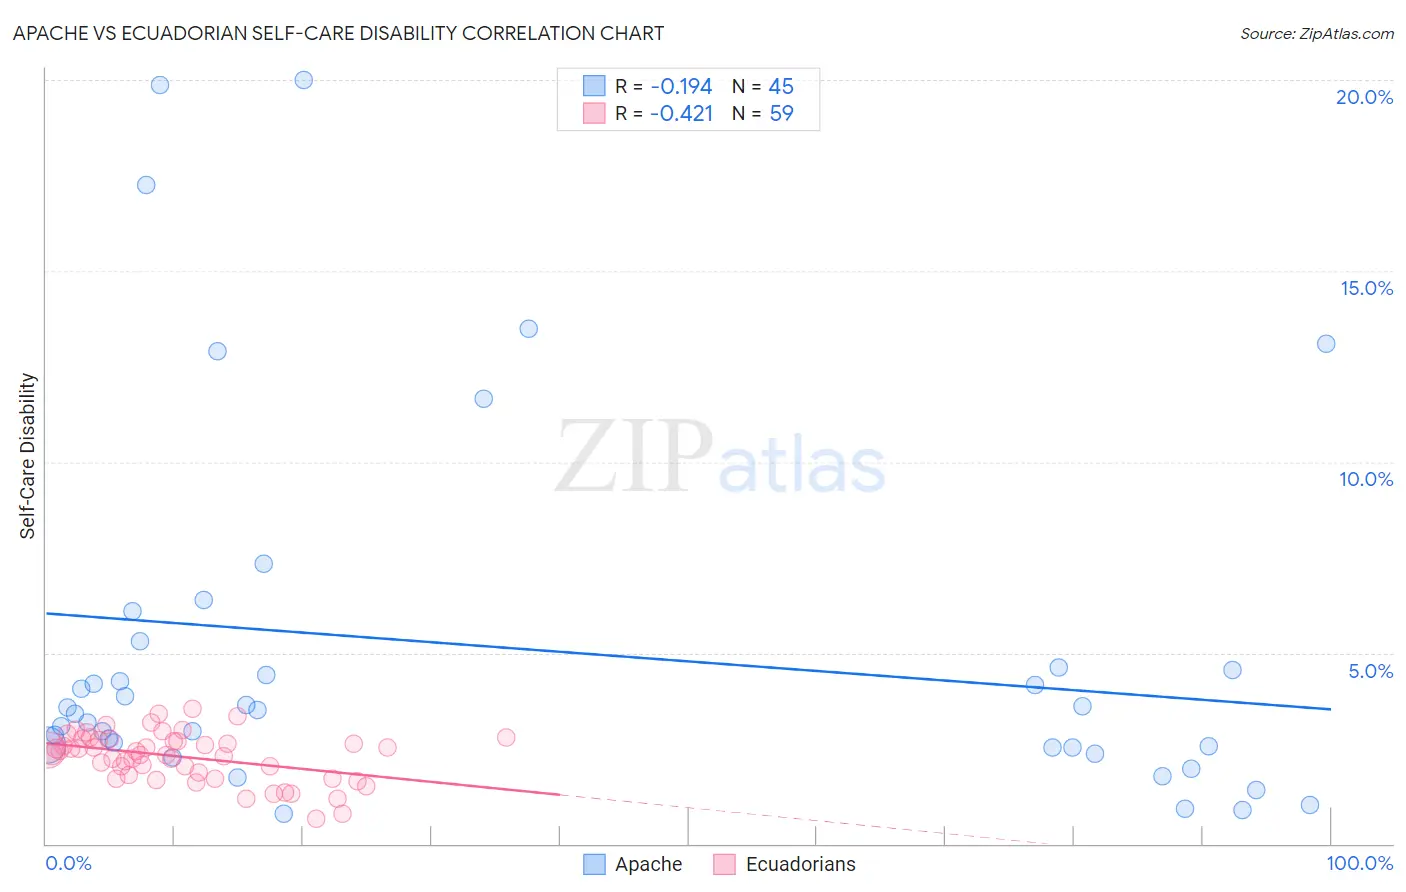
Apache vs Ecuadorian Self-Care Disability Correlation Chart
The statistical analysis conducted on geographies consisting of 230,868,082 people shows a poor negative correlation between the proportion of Apache and percentage of population with self-care disability in the United States with a correlation coefficient (R) of -0.194 and weighted average of 2.7%. Similarly, the statistical analysis conducted on geographies consisting of 317,436,326 people shows a moderate negative correlation between the proportion of Ecuadorians and percentage of population with self-care disability in the United States with a correlation coefficient (R) of -0.421 and weighted average of 2.6%, a difference of 5.4%.
Self-Care Disability Correlation Summary
| Measurement | Apache | Ecuadorian |
| Minimum | 0.78% | 0.65% |
| Maximum | 20.0% | 3.5% |
| Range | 19.2% | 2.9% |
| Mean | 5.1% | 2.3% |
| Median | 3.5% | 2.4% |
| Interquartile 25% (IQ1) | 2.5% | 1.8% |
| Interquartile 75% (IQ3) | 5.0% | 2.7% |
| Interquartile Range (IQR) | 2.4% | 0.89% |
| Standard Deviation (Sample) | 4.9% | 0.64% |
| Standard Deviation (Population) | 4.8% | 0.63% |
Similar Demographics by Self-Care Disability
Demographics Similar to Apache by Self-Care Disability
In terms of self-care disability, the demographic groups most similar to Apache are Immigrants from Iraq (2.7%, a difference of 0.020%), Delaware (2.7%, a difference of 0.070%), Fijian (2.7%, a difference of 0.12%), Jamaican (2.7%, a difference of 0.16%), and Hispanic or Latino (2.7%, a difference of 0.17%).
| Demographics | Rating | Rank | Self-Care Disability |
| Immigrants | Trinidad and Tobago | 0.1 /100 | #275 | Tragic 2.7% |
| Japanese | 0.1 /100 | #276 | Tragic 2.7% |
| Immigrants | Ukraine | 0.1 /100 | #277 | Tragic 2.7% |
| Ottawa | 0.1 /100 | #278 | Tragic 2.7% |
| Iroquois | 0.1 /100 | #279 | Tragic 2.7% |
| Hispanics or Latinos | 0.1 /100 | #280 | Tragic 2.7% |
| Immigrants | Iraq | 0.0 /100 | #281 | Tragic 2.7% |
| Apache | 0.0 /100 | #282 | Tragic 2.7% |
| Delaware | 0.0 /100 | #283 | Tragic 2.7% |
| Fijians | 0.0 /100 | #284 | Tragic 2.7% |
| Jamaicans | 0.0 /100 | #285 | Tragic 2.7% |
| French American Indians | 0.0 /100 | #286 | Tragic 2.7% |
| Immigrants | Jamaica | 0.0 /100 | #287 | Tragic 2.7% |
| Immigrants | Barbados | 0.0 /100 | #288 | Tragic 2.7% |
| Africans | 0.0 /100 | #289 | Tragic 2.7% |
Demographics Similar to Ecuadorians by Self-Care Disability
In terms of self-care disability, the demographic groups most similar to Ecuadorians are Immigrants from Honduras (2.6%, a difference of 0.0%), Immigrants from Thailand (2.6%, a difference of 0.050%), White/Caucasian (2.6%, a difference of 0.070%), Celtic (2.6%, a difference of 0.090%), and Samoan (2.6%, a difference of 0.10%).
| Demographics | Rating | Rank | Self-Care Disability |
| Alaskan Athabascans | 10.4 /100 | #206 | Poor 2.5% |
| French | 9.9 /100 | #207 | Tragic 2.5% |
| Central Americans | 8.7 /100 | #208 | Tragic 2.5% |
| Malaysians | 7.7 /100 | #209 | Tragic 2.5% |
| Panamanians | 6.4 /100 | #210 | Tragic 2.5% |
| Native Hawaiians | 5.1 /100 | #211 | Tragic 2.6% |
| Samoans | 5.1 /100 | #212 | Tragic 2.6% |
| Ecuadorians | 4.7 /100 | #213 | Tragic 2.6% |
| Immigrants | Honduras | 4.7 /100 | #214 | Tragic 2.6% |
| Immigrants | Thailand | 4.5 /100 | #215 | Tragic 2.6% |
| Whites/Caucasians | 4.4 /100 | #216 | Tragic 2.6% |
| Celtics | 4.4 /100 | #217 | Tragic 2.6% |
| Scotch-Irish | 4.1 /100 | #218 | Tragic 2.6% |
| Immigrants | Moldova | 4.0 /100 | #219 | Tragic 2.6% |
| Sub-Saharan Africans | 4.0 /100 | #220 | Tragic 2.6% |