Apache vs Irish Self-Care Disability
COMPARE
Apache
Irish
Self-Care Disability
Self-Care Disability Comparison
Apache
Irish
2.7%
SELF-CARE DISABILITY
0.0/ 100
METRIC RATING
282nd/ 347
METRIC RANK
2.5%
SELF-CARE DISABILITY
28.7/ 100
METRIC RATING
187th/ 347
METRIC RANK
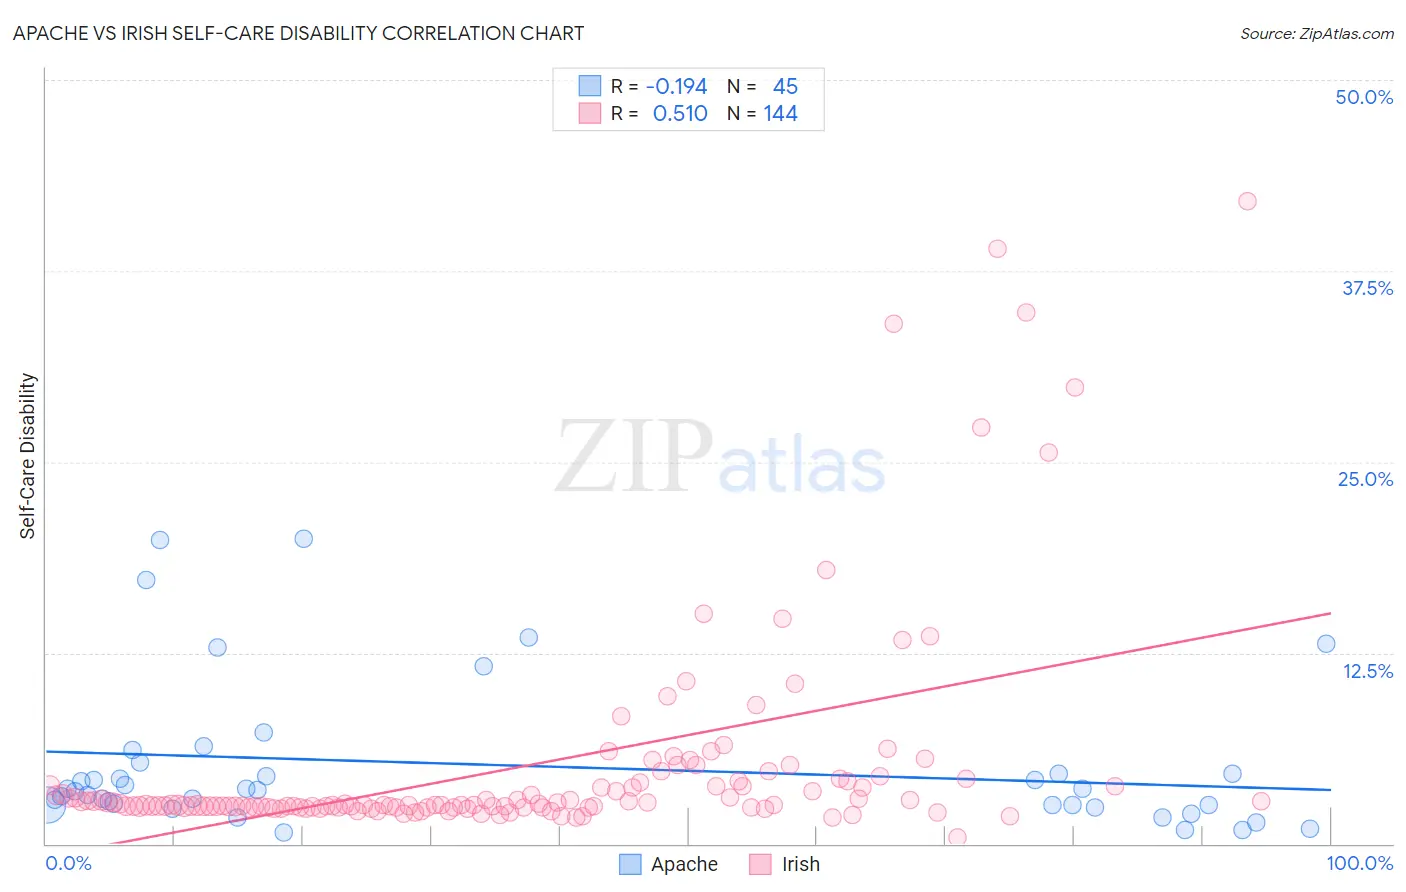
Apache vs Irish Self-Care Disability Correlation Chart
The statistical analysis conducted on geographies consisting of 230,868,082 people shows a poor negative correlation between the proportion of Apache and percentage of population with self-care disability in the United States with a correlation coefficient (R) of -0.194 and weighted average of 2.7%. Similarly, the statistical analysis conducted on geographies consisting of 577,353,633 people shows a substantial positive correlation between the proportion of Irish and percentage of population with self-care disability in the United States with a correlation coefficient (R) of 0.510 and weighted average of 2.5%, a difference of 8.0%.
Self-Care Disability Correlation Summary
| Measurement | Apache | Irish |
| Minimum | 0.78% | 0.44% |
| Maximum | 20.0% | 42.0% |
| Range | 19.2% | 41.6% |
| Mean | 5.1% | 5.0% |
| Median | 3.5% | 2.6% |
| Interquartile 25% (IQ1) | 2.5% | 2.4% |
| Interquartile 75% (IQ3) | 5.0% | 3.9% |
| Interquartile Range (IQR) | 2.4% | 1.5% |
| Standard Deviation (Sample) | 4.9% | 7.0% |
| Standard Deviation (Population) | 4.8% | 7.0% |
Similar Demographics by Self-Care Disability
Demographics Similar to Apache by Self-Care Disability
In terms of self-care disability, the demographic groups most similar to Apache are Immigrants from Iraq (2.7%, a difference of 0.020%), Delaware (2.7%, a difference of 0.070%), Fijian (2.7%, a difference of 0.12%), Jamaican (2.7%, a difference of 0.16%), and Hispanic or Latino (2.7%, a difference of 0.17%).
| Demographics | Rating | Rank | Self-Care Disability |
| Immigrants | Trinidad and Tobago | 0.1 /100 | #275 | Tragic 2.7% |
| Japanese | 0.1 /100 | #276 | Tragic 2.7% |
| Immigrants | Ukraine | 0.1 /100 | #277 | Tragic 2.7% |
| Ottawa | 0.1 /100 | #278 | Tragic 2.7% |
| Iroquois | 0.1 /100 | #279 | Tragic 2.7% |
| Hispanics or Latinos | 0.1 /100 | #280 | Tragic 2.7% |
| Immigrants | Iraq | 0.0 /100 | #281 | Tragic 2.7% |
| Apache | 0.0 /100 | #282 | Tragic 2.7% |
| Delaware | 0.0 /100 | #283 | Tragic 2.7% |
| Fijians | 0.0 /100 | #284 | Tragic 2.7% |
| Jamaicans | 0.0 /100 | #285 | Tragic 2.7% |
| French American Indians | 0.0 /100 | #286 | Tragic 2.7% |
| Immigrants | Jamaica | 0.0 /100 | #287 | Tragic 2.7% |
| Immigrants | Barbados | 0.0 /100 | #288 | Tragic 2.7% |
| Africans | 0.0 /100 | #289 | Tragic 2.7% |
Demographics Similar to Irish by Self-Care Disability
In terms of self-care disability, the demographic groups most similar to Irish are Immigrants from Oceania (2.5%, a difference of 0.030%), Immigrants from Eastern Europe (2.5%, a difference of 0.040%), Immigrants from El Salvador (2.5%, a difference of 0.23%), Sioux (2.5%, a difference of 0.25%), and Slavic (2.5%, a difference of 0.31%).
| Demographics | Rating | Rank | Self-Care Disability |
| Indonesians | 41.2 /100 | #180 | Average 2.5% |
| Ghanaians | 40.4 /100 | #181 | Average 2.5% |
| Maltese | 37.5 /100 | #182 | Fair 2.5% |
| Salvadorans | 36.4 /100 | #183 | Fair 2.5% |
| Yugoslavians | 36.1 /100 | #184 | Fair 2.5% |
| Slavs | 34.3 /100 | #185 | Fair 2.5% |
| Immigrants | El Salvador | 33.0 /100 | #186 | Fair 2.5% |
| Irish | 28.7 /100 | #187 | Fair 2.5% |
| Immigrants | Oceania | 28.3 /100 | #188 | Fair 2.5% |
| Immigrants | Eastern Europe | 28.0 /100 | #189 | Fair 2.5% |
| Sioux | 24.6 /100 | #190 | Fair 2.5% |
| Moroccans | 22.9 /100 | #191 | Fair 2.5% |
| Soviet Union | 22.2 /100 | #192 | Fair 2.5% |
| Ukrainians | 21.4 /100 | #193 | Fair 2.5% |
| Immigrants | Germany | 17.9 /100 | #194 | Poor 2.5% |