Houma vs Ecuadorian Self-Care Disability
COMPARE
Houma
Ecuadorian
Self-Care Disability
Self-Care Disability Comparison
Houma
Ecuadorians
3.0%
SELF-CARE DISABILITY
0.0/ 100
METRIC RATING
334th/ 347
METRIC RANK
2.6%
SELF-CARE DISABILITY
4.7/ 100
METRIC RATING
213th/ 347
METRIC RANK
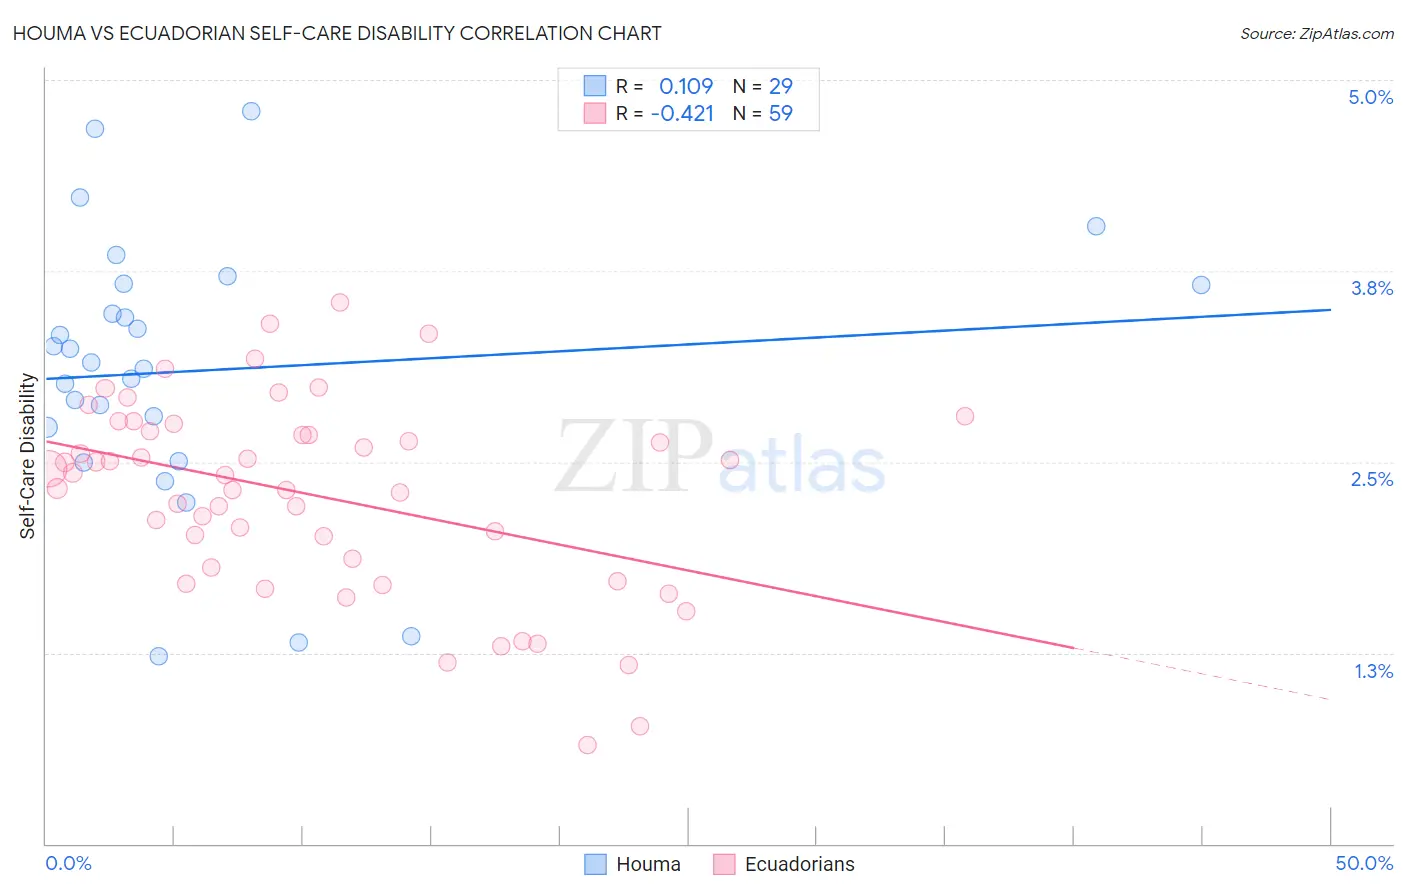
Houma vs Ecuadorian Self-Care Disability Correlation Chart
The statistical analysis conducted on geographies consisting of 36,783,442 people shows a poor positive correlation between the proportion of Houma and percentage of population with self-care disability in the United States with a correlation coefficient (R) of 0.109 and weighted average of 3.0%. Similarly, the statistical analysis conducted on geographies consisting of 317,436,326 people shows a moderate negative correlation between the proportion of Ecuadorians and percentage of population with self-care disability in the United States with a correlation coefficient (R) of -0.421 and weighted average of 2.6%, a difference of 16.9%.
Self-Care Disability Correlation Summary
| Measurement | Houma | Ecuadorian |
| Minimum | 1.2% | 0.65% |
| Maximum | 4.8% | 3.5% |
| Range | 3.6% | 2.9% |
| Mean | 3.1% | 2.3% |
| Median | 3.1% | 2.4% |
| Interquartile 25% (IQ1) | 2.6% | 1.8% |
| Interquartile 75% (IQ3) | 3.7% | 2.7% |
| Interquartile Range (IQR) | 1.0% | 0.89% |
| Standard Deviation (Sample) | 0.88% | 0.64% |
| Standard Deviation (Population) | 0.86% | 0.63% |
Similar Demographics by Self-Care Disability
Demographics Similar to Houma by Self-Care Disability
In terms of self-care disability, the demographic groups most similar to Houma are Immigrants from the Azores (3.0%, a difference of 0.050%), Dutch West Indian (3.0%, a difference of 0.070%), Immigrants from Yemen (3.0%, a difference of 0.21%), Kiowa (3.0%, a difference of 0.30%), and Lumbee (3.0%, a difference of 0.66%).
| Demographics | Rating | Rank | Self-Care Disability |
| Blacks/African Americans | 0.0 /100 | #327 | Tragic 2.9% |
| Hopi | 0.0 /100 | #328 | Tragic 2.9% |
| Cajuns | 0.0 /100 | #329 | Tragic 2.9% |
| Nepalese | 0.0 /100 | #330 | Tragic 3.0% |
| Lumbee | 0.0 /100 | #331 | Tragic 3.0% |
| Kiowa | 0.0 /100 | #332 | Tragic 3.0% |
| Dutch West Indians | 0.0 /100 | #333 | Tragic 3.0% |
| Houma | 0.0 /100 | #334 | Tragic 3.0% |
| Immigrants | Azores | 0.0 /100 | #335 | Tragic 3.0% |
| Immigrants | Yemen | 0.0 /100 | #336 | Tragic 3.0% |
| Choctaw | 0.0 /100 | #337 | Tragic 3.0% |
| Cape Verdeans | 0.0 /100 | #338 | Tragic 3.0% |
| Immigrants | Dominican Republic | 0.0 /100 | #339 | Tragic 3.0% |
| Immigrants | Cabo Verde | 0.0 /100 | #340 | Tragic 3.1% |
| Dominicans | 0.0 /100 | #341 | Tragic 3.1% |
Demographics Similar to Ecuadorians by Self-Care Disability
In terms of self-care disability, the demographic groups most similar to Ecuadorians are Immigrants from Honduras (2.6%, a difference of 0.0%), Immigrants from Thailand (2.6%, a difference of 0.050%), White/Caucasian (2.6%, a difference of 0.070%), Celtic (2.6%, a difference of 0.090%), and Samoan (2.6%, a difference of 0.10%).
| Demographics | Rating | Rank | Self-Care Disability |
| Alaskan Athabascans | 10.4 /100 | #206 | Poor 2.5% |
| French | 9.9 /100 | #207 | Tragic 2.5% |
| Central Americans | 8.7 /100 | #208 | Tragic 2.5% |
| Malaysians | 7.7 /100 | #209 | Tragic 2.5% |
| Panamanians | 6.4 /100 | #210 | Tragic 2.5% |
| Native Hawaiians | 5.1 /100 | #211 | Tragic 2.6% |
| Samoans | 5.1 /100 | #212 | Tragic 2.6% |
| Ecuadorians | 4.7 /100 | #213 | Tragic 2.6% |
| Immigrants | Honduras | 4.7 /100 | #214 | Tragic 2.6% |
| Immigrants | Thailand | 4.5 /100 | #215 | Tragic 2.6% |
| Whites/Caucasians | 4.4 /100 | #216 | Tragic 2.6% |
| Celtics | 4.4 /100 | #217 | Tragic 2.6% |
| Scotch-Irish | 4.1 /100 | #218 | Tragic 2.6% |
| Immigrants | Moldova | 4.0 /100 | #219 | Tragic 2.6% |
| Sub-Saharan Africans | 4.0 /100 | #220 | Tragic 2.6% |