Apache vs Ecuadorian Male Disability
COMPARE
Apache
Ecuadorian
Male Disability
Male Disability Comparison
Apache
Ecuadorians
14.0%
MALE DISABILITY
0.0/ 100
METRIC RATING
322nd/ 347
METRIC RANK
10.5%
MALE DISABILITY
99.2/ 100
METRIC RATING
69th/ 347
METRIC RANK
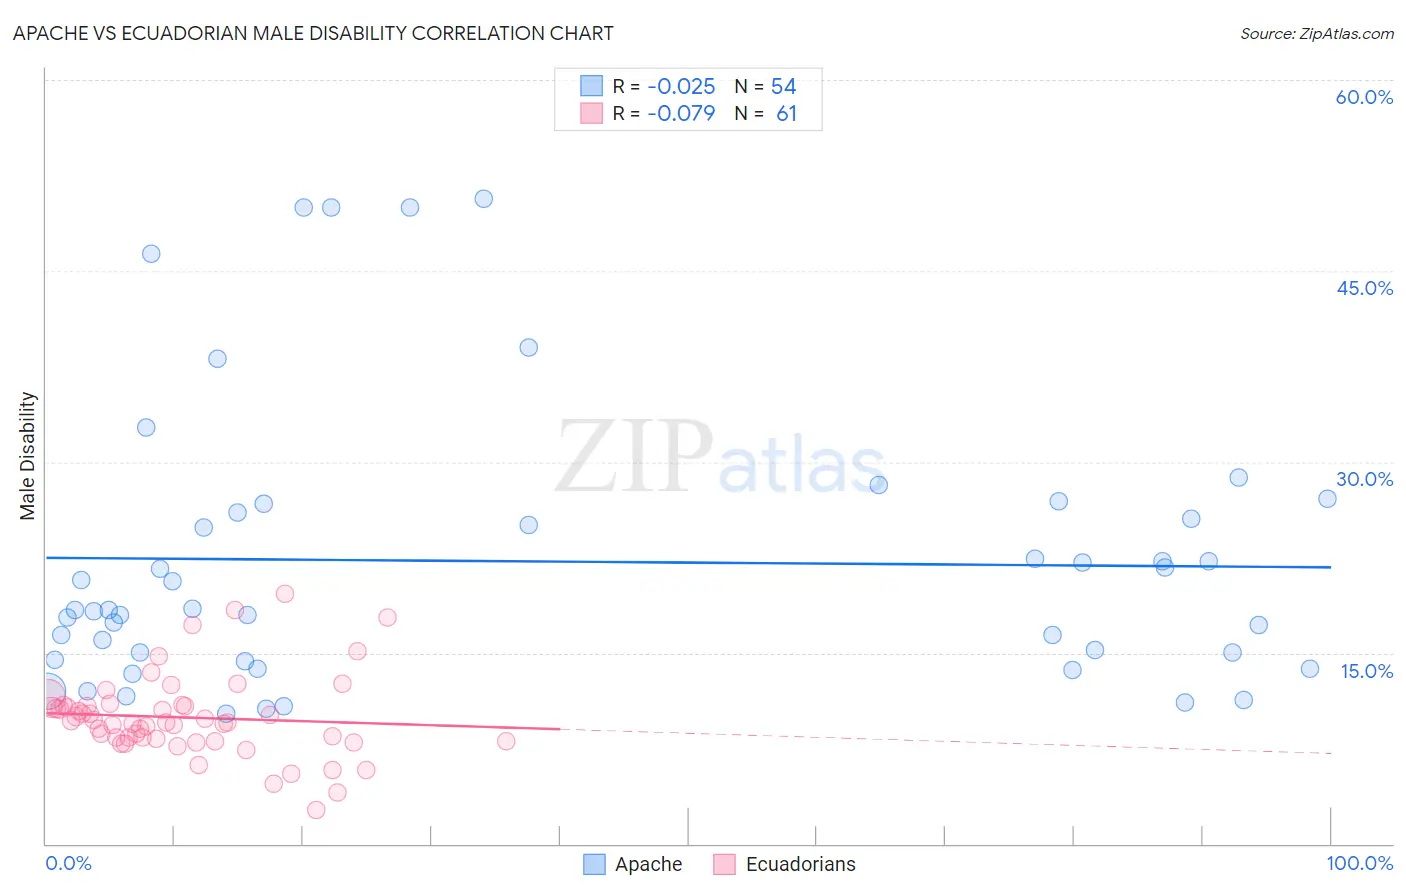
Apache vs Ecuadorian Male Disability Correlation Chart
The statistical analysis conducted on geographies consisting of 231,062,399 people shows no correlation between the proportion of Apache and percentage of males with a disability in the United States with a correlation coefficient (R) of -0.025 and weighted average of 14.0%. Similarly, the statistical analysis conducted on geographies consisting of 317,801,764 people shows a slight negative correlation between the proportion of Ecuadorians and percentage of males with a disability in the United States with a correlation coefficient (R) of -0.079 and weighted average of 10.5%, a difference of 33.7%.
Male Disability Correlation Summary
| Measurement | Apache | Ecuadorian |
| Minimum | 10.2% | 2.6% |
| Maximum | 50.7% | 19.6% |
| Range | 40.5% | 17.0% |
| Mean | 22.2% | 9.9% |
| Median | 18.3% | 9.5% |
| Interquartile 25% (IQ1) | 14.5% | 8.2% |
| Interquartile 75% (IQ3) | 26.0% | 10.8% |
| Interquartile Range (IQR) | 11.6% | 2.7% |
| Standard Deviation (Sample) | 11.0% | 3.2% |
| Standard Deviation (Population) | 10.9% | 3.2% |
Similar Demographics by Male Disability
Demographics Similar to Apache by Male Disability
In terms of male disability, the demographic groups most similar to Apache are Osage (14.0%, a difference of 0.070%), Comanche (14.1%, a difference of 0.40%), Ottawa (14.1%, a difference of 0.51%), Shoshone (13.8%, a difference of 1.1%), and Tlingit-Haida (13.8%, a difference of 1.2%).
| Demographics | Rating | Rank | Male Disability |
| Iroquois | 0.0 /100 | #315 | Tragic 13.6% |
| Alaska Natives | 0.0 /100 | #316 | Tragic 13.6% |
| Paiute | 0.0 /100 | #317 | Tragic 13.7% |
| Cree | 0.0 /100 | #318 | Tragic 13.7% |
| Americans | 0.0 /100 | #319 | Tragic 13.8% |
| Tlingit-Haida | 0.0 /100 | #320 | Tragic 13.8% |
| Shoshone | 0.0 /100 | #321 | Tragic 13.8% |
| Apache | 0.0 /100 | #322 | Tragic 14.0% |
| Osage | 0.0 /100 | #323 | Tragic 14.0% |
| Comanche | 0.0 /100 | #324 | Tragic 14.1% |
| Ottawa | 0.0 /100 | #325 | Tragic 14.1% |
| Natives/Alaskans | 0.0 /100 | #326 | Tragic 14.2% |
| Potawatomi | 0.0 /100 | #327 | Tragic 14.2% |
| Chippewa | 0.0 /100 | #328 | Tragic 14.3% |
| Cajuns | 0.0 /100 | #329 | Tragic 14.4% |
Demographics Similar to Ecuadorians by Male Disability
In terms of male disability, the demographic groups most similar to Ecuadorians are Colombian (10.5%, a difference of 0.0%), Immigrants from Afghanistan (10.5%, a difference of 0.10%), Immigrants from Grenada (10.5%, a difference of 0.11%), Guyanese (10.5%, a difference of 0.11%), and Jordanian (10.5%, a difference of 0.13%).
| Demographics | Rating | Rank | Male Disability |
| Immigrants | Ecuador | 99.3 /100 | #62 | Exceptional 10.4% |
| Immigrants | Belarus | 99.3 /100 | #63 | Exceptional 10.4% |
| Jordanians | 99.3 /100 | #64 | Exceptional 10.5% |
| Immigrants | Grenada | 99.2 /100 | #65 | Exceptional 10.5% |
| Guyanese | 99.2 /100 | #66 | Exceptional 10.5% |
| Immigrants | Afghanistan | 99.2 /100 | #67 | Exceptional 10.5% |
| Colombians | 99.2 /100 | #68 | Exceptional 10.5% |
| Ecuadorians | 99.2 /100 | #69 | Exceptional 10.5% |
| Immigrants | Bulgaria | 99.1 /100 | #70 | Exceptional 10.5% |
| Immigrants | Cameroon | 99.0 /100 | #71 | Exceptional 10.5% |
| Immigrants | Serbia | 99.0 /100 | #72 | Exceptional 10.5% |
| Immigrants | Lithuania | 98.9 /100 | #73 | Exceptional 10.5% |
| Immigrants | Lebanon | 98.8 /100 | #74 | Exceptional 10.5% |
| Sierra Leoneans | 98.7 /100 | #75 | Exceptional 10.5% |
| Immigrants | Sierra Leone | 98.7 /100 | #76 | Exceptional 10.5% |