Apache vs Immigrants from Eastern Africa Self-Care Disability
COMPARE
Apache
Immigrants from Eastern Africa
Self-Care Disability
Self-Care Disability Comparison
Apache
Immigrants from Eastern Africa
2.7%
SELF-CARE DISABILITY
0.0/ 100
METRIC RATING
282nd/ 347
METRIC RANK
2.3%
SELF-CARE DISABILITY
99.9/ 100
METRIC RATING
38th/ 347
METRIC RANK
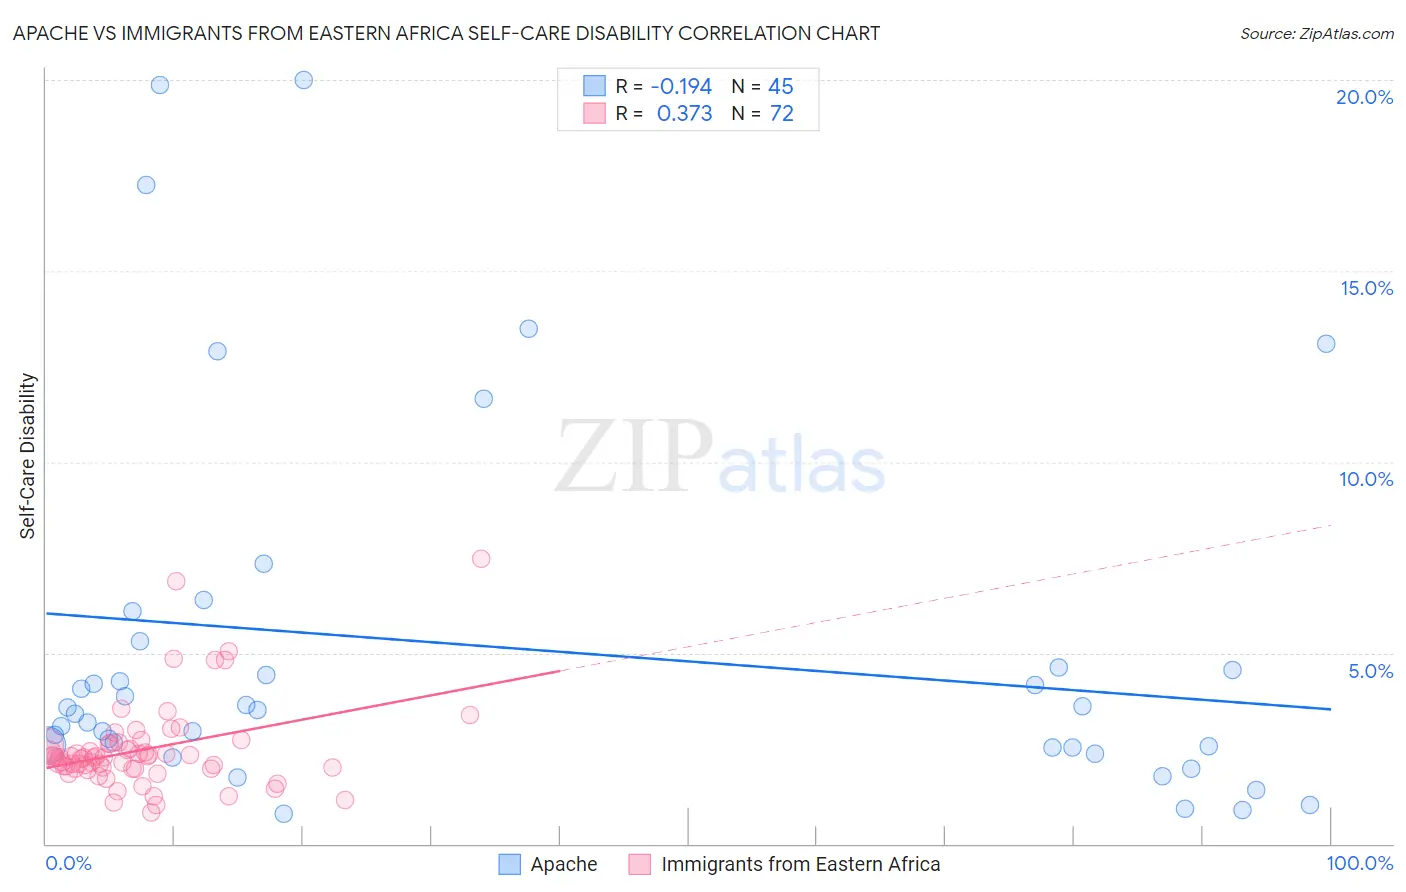
Apache vs Immigrants from Eastern Africa Self-Care Disability Correlation Chart
The statistical analysis conducted on geographies consisting of 230,868,082 people shows a poor negative correlation between the proportion of Apache and percentage of population with self-care disability in the United States with a correlation coefficient (R) of -0.194 and weighted average of 2.7%. Similarly, the statistical analysis conducted on geographies consisting of 354,752,249 people shows a mild positive correlation between the proportion of Immigrants from Eastern Africa and percentage of population with self-care disability in the United States with a correlation coefficient (R) of 0.373 and weighted average of 2.3%, a difference of 18.4%.
Self-Care Disability Correlation Summary
| Measurement | Apache | Immigrants from Eastern Africa |
| Minimum | 0.78% | 0.81% |
| Maximum | 20.0% | 7.5% |
| Range | 19.2% | 6.7% |
| Mean | 5.1% | 2.5% |
| Median | 3.5% | 2.3% |
| Interquartile 25% (IQ1) | 2.5% | 2.0% |
| Interquartile 75% (IQ3) | 5.0% | 2.6% |
| Interquartile Range (IQR) | 2.4% | 0.61% |
| Standard Deviation (Sample) | 4.9% | 1.1% |
| Standard Deviation (Population) | 4.8% | 1.1% |
Similar Demographics by Self-Care Disability
Demographics Similar to Apache by Self-Care Disability
In terms of self-care disability, the demographic groups most similar to Apache are Immigrants from Iraq (2.7%, a difference of 0.020%), Delaware (2.7%, a difference of 0.070%), Fijian (2.7%, a difference of 0.12%), Jamaican (2.7%, a difference of 0.16%), and Hispanic or Latino (2.7%, a difference of 0.17%).
| Demographics | Rating | Rank | Self-Care Disability |
| Immigrants | Trinidad and Tobago | 0.1 /100 | #275 | Tragic 2.7% |
| Japanese | 0.1 /100 | #276 | Tragic 2.7% |
| Immigrants | Ukraine | 0.1 /100 | #277 | Tragic 2.7% |
| Ottawa | 0.1 /100 | #278 | Tragic 2.7% |
| Iroquois | 0.1 /100 | #279 | Tragic 2.7% |
| Hispanics or Latinos | 0.1 /100 | #280 | Tragic 2.7% |
| Immigrants | Iraq | 0.0 /100 | #281 | Tragic 2.7% |
| Apache | 0.0 /100 | #282 | Tragic 2.7% |
| Delaware | 0.0 /100 | #283 | Tragic 2.7% |
| Fijians | 0.0 /100 | #284 | Tragic 2.7% |
| Jamaicans | 0.0 /100 | #285 | Tragic 2.7% |
| French American Indians | 0.0 /100 | #286 | Tragic 2.7% |
| Immigrants | Jamaica | 0.0 /100 | #287 | Tragic 2.7% |
| Immigrants | Barbados | 0.0 /100 | #288 | Tragic 2.7% |
| Africans | 0.0 /100 | #289 | Tragic 2.7% |
Demographics Similar to Immigrants from Eastern Africa by Self-Care Disability
In terms of self-care disability, the demographic groups most similar to Immigrants from Eastern Africa are Immigrants from Bulgaria (2.3%, a difference of 0.10%), Immigrants from Sweden (2.3%, a difference of 0.13%), Iranian (2.3%, a difference of 0.15%), Immigrants from Sudan (2.3%, a difference of 0.22%), and Immigrants from Lithuania (2.3%, a difference of 0.30%).
| Demographics | Rating | Rank | Self-Care Disability |
| Danes | 99.9 /100 | #31 | Exceptional 2.3% |
| Burmese | 99.9 /100 | #32 | Exceptional 2.3% |
| Immigrants | Korea | 99.9 /100 | #33 | Exceptional 2.3% |
| Immigrants | Turkey | 99.9 /100 | #34 | Exceptional 2.3% |
| Immigrants | Australia | 99.9 /100 | #35 | Exceptional 2.3% |
| Immigrants | Lithuania | 99.9 /100 | #36 | Exceptional 2.3% |
| Immigrants | Sweden | 99.9 /100 | #37 | Exceptional 2.3% |
| Immigrants | Eastern Africa | 99.9 /100 | #38 | Exceptional 2.3% |
| Immigrants | Bulgaria | 99.8 /100 | #39 | Exceptional 2.3% |
| Iranians | 99.8 /100 | #40 | Exceptional 2.3% |
| Immigrants | Sudan | 99.8 /100 | #41 | Exceptional 2.3% |
| Immigrants | Uganda | 99.8 /100 | #42 | Exceptional 2.3% |
| Immigrants | Pakistan | 99.8 /100 | #43 | Exceptional 2.3% |
| Immigrants | South Africa | 99.8 /100 | #44 | Exceptional 2.3% |
| Norwegians | 99.8 /100 | #45 | Exceptional 2.3% |