Apache vs Lumbee Self-Care Disability
COMPARE
Apache
Lumbee
Self-Care Disability
Self-Care Disability Comparison
Apache
Lumbee
2.7%
SELF-CARE DISABILITY
0.0/ 100
METRIC RATING
282nd/ 347
METRIC RANK
3.0%
SELF-CARE DISABILITY
0.0/ 100
METRIC RATING
331st/ 347
METRIC RANK
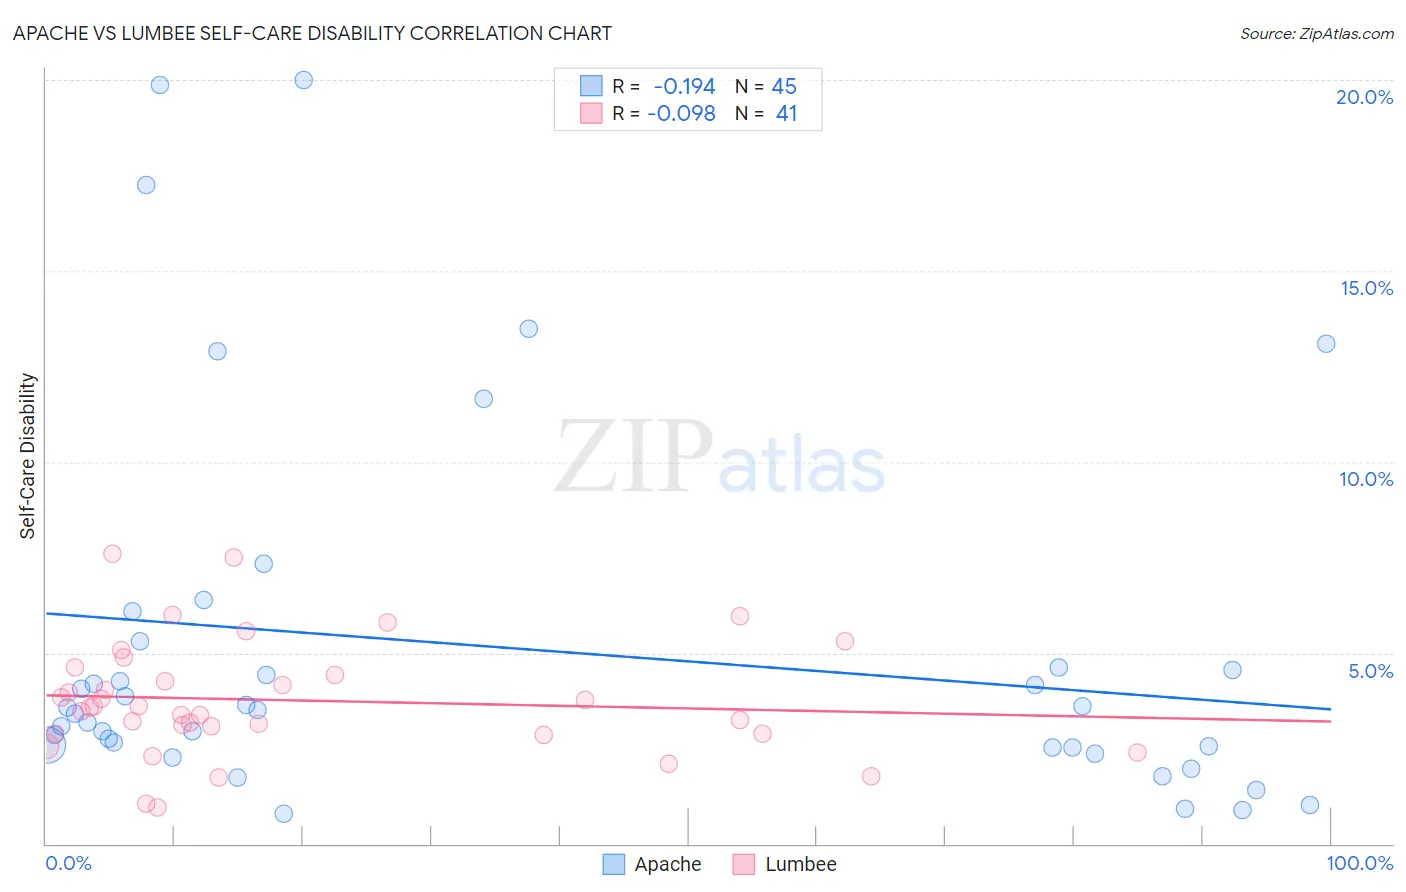
Apache vs Lumbee Self-Care Disability Correlation Chart
The statistical analysis conducted on geographies consisting of 230,868,082 people shows a poor negative correlation between the proportion of Apache and percentage of population with self-care disability in the United States with a correlation coefficient (R) of -0.194 and weighted average of 2.7%. Similarly, the statistical analysis conducted on geographies consisting of 92,217,287 people shows a slight negative correlation between the proportion of Lumbee and percentage of population with self-care disability in the United States with a correlation coefficient (R) of -0.098 and weighted average of 3.0%, a difference of 10.1%.
Self-Care Disability Correlation Summary
| Measurement | Apache | Lumbee |
| Minimum | 0.78% | 0.94% |
| Maximum | 20.0% | 7.6% |
| Range | 19.2% | 6.7% |
| Mean | 5.1% | 3.8% |
| Median | 3.5% | 3.6% |
| Interquartile 25% (IQ1) | 2.5% | 2.9% |
| Interquartile 75% (IQ3) | 5.0% | 4.5% |
| Interquartile Range (IQR) | 2.4% | 1.6% |
| Standard Deviation (Sample) | 4.9% | 1.5% |
| Standard Deviation (Population) | 4.8% | 1.5% |
Similar Demographics by Self-Care Disability
Demographics Similar to Apache by Self-Care Disability
In terms of self-care disability, the demographic groups most similar to Apache are Immigrants from Iraq (2.7%, a difference of 0.020%), Delaware (2.7%, a difference of 0.070%), Fijian (2.7%, a difference of 0.12%), Jamaican (2.7%, a difference of 0.16%), and Hispanic or Latino (2.7%, a difference of 0.17%).
| Demographics | Rating | Rank | Self-Care Disability |
| Immigrants | Trinidad and Tobago | 0.1 /100 | #275 | Tragic 2.7% |
| Japanese | 0.1 /100 | #276 | Tragic 2.7% |
| Immigrants | Ukraine | 0.1 /100 | #277 | Tragic 2.7% |
| Ottawa | 0.1 /100 | #278 | Tragic 2.7% |
| Iroquois | 0.1 /100 | #279 | Tragic 2.7% |
| Hispanics or Latinos | 0.1 /100 | #280 | Tragic 2.7% |
| Immigrants | Iraq | 0.0 /100 | #281 | Tragic 2.7% |
| Apache | 0.0 /100 | #282 | Tragic 2.7% |
| Delaware | 0.0 /100 | #283 | Tragic 2.7% |
| Fijians | 0.0 /100 | #284 | Tragic 2.7% |
| Jamaicans | 0.0 /100 | #285 | Tragic 2.7% |
| French American Indians | 0.0 /100 | #286 | Tragic 2.7% |
| Immigrants | Jamaica | 0.0 /100 | #287 | Tragic 2.7% |
| Immigrants | Barbados | 0.0 /100 | #288 | Tragic 2.7% |
| Africans | 0.0 /100 | #289 | Tragic 2.7% |
Demographics Similar to Lumbee by Self-Care Disability
In terms of self-care disability, the demographic groups most similar to Lumbee are Nepalese (3.0%, a difference of 0.12%), Kiowa (3.0%, a difference of 0.36%), Dutch West Indian (3.0%, a difference of 0.59%), Houma (3.0%, a difference of 0.66%), and Immigrants from the Azores (3.0%, a difference of 0.71%).
| Demographics | Rating | Rank | Self-Care Disability |
| Cherokee | 0.0 /100 | #324 | Tragic 2.9% |
| Immigrants | Uzbekistan | 0.0 /100 | #325 | Tragic 2.9% |
| Paiute | 0.0 /100 | #326 | Tragic 2.9% |
| Blacks/African Americans | 0.0 /100 | #327 | Tragic 2.9% |
| Hopi | 0.0 /100 | #328 | Tragic 2.9% |
| Cajuns | 0.0 /100 | #329 | Tragic 2.9% |
| Nepalese | 0.0 /100 | #330 | Tragic 3.0% |
| Lumbee | 0.0 /100 | #331 | Tragic 3.0% |
| Kiowa | 0.0 /100 | #332 | Tragic 3.0% |
| Dutch West Indians | 0.0 /100 | #333 | Tragic 3.0% |
| Houma | 0.0 /100 | #334 | Tragic 3.0% |
| Immigrants | Azores | 0.0 /100 | #335 | Tragic 3.0% |
| Immigrants | Yemen | 0.0 /100 | #336 | Tragic 3.0% |
| Choctaw | 0.0 /100 | #337 | Tragic 3.0% |
| Cape Verdeans | 0.0 /100 | #338 | Tragic 3.0% |