Apache vs Immigrants from Venezuela Self-Care Disability
COMPARE
Apache
Immigrants from Venezuela
Self-Care Disability
Self-Care Disability Comparison
Apache
Immigrants from Venezuela
2.7%
SELF-CARE DISABILITY
0.0/ 100
METRIC RATING
282nd/ 347
METRIC RANK
2.2%
SELF-CARE DISABILITY
100.0/ 100
METRIC RATING
22nd/ 347
METRIC RANK
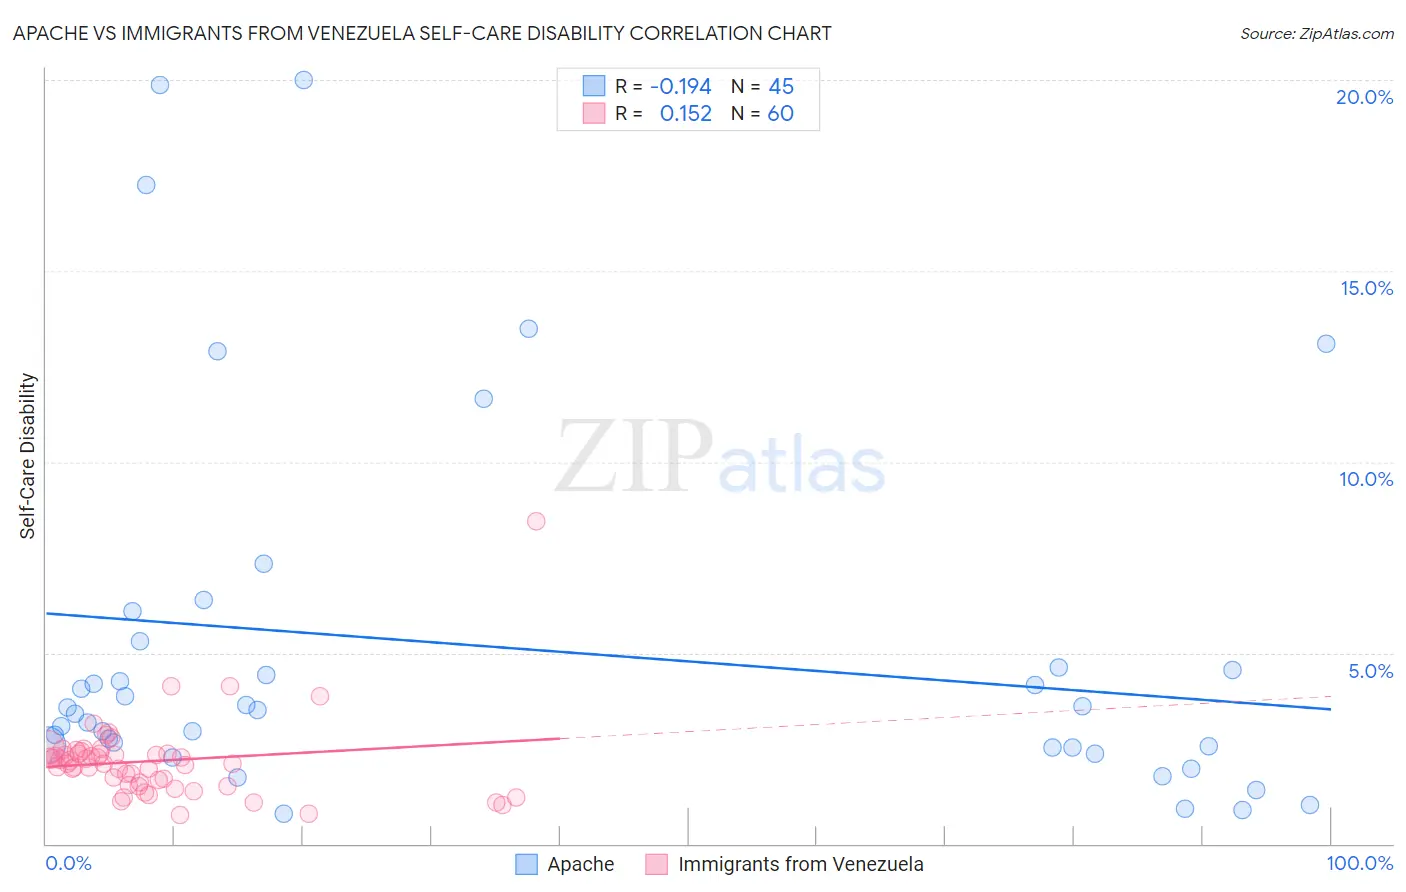
Apache vs Immigrants from Venezuela Self-Care Disability Correlation Chart
The statistical analysis conducted on geographies consisting of 230,868,082 people shows a poor negative correlation between the proportion of Apache and percentage of population with self-care disability in the United States with a correlation coefficient (R) of -0.194 and weighted average of 2.7%. Similarly, the statistical analysis conducted on geographies consisting of 287,724,504 people shows a poor positive correlation between the proportion of Immigrants from Venezuela and percentage of population with self-care disability in the United States with a correlation coefficient (R) of 0.152 and weighted average of 2.2%, a difference of 20.8%.
Self-Care Disability Correlation Summary
| Measurement | Apache | Immigrants from Venezuela |
| Minimum | 0.78% | 0.74% |
| Maximum | 20.0% | 8.4% |
| Range | 19.2% | 7.7% |
| Mean | 5.1% | 2.2% |
| Median | 3.5% | 2.1% |
| Interquartile 25% (IQ1) | 2.5% | 1.6% |
| Interquartile 75% (IQ3) | 5.0% | 2.4% |
| Interquartile Range (IQR) | 2.4% | 0.78% |
| Standard Deviation (Sample) | 4.9% | 1.1% |
| Standard Deviation (Population) | 4.8% | 1.1% |
Similar Demographics by Self-Care Disability
Demographics Similar to Apache by Self-Care Disability
In terms of self-care disability, the demographic groups most similar to Apache are Immigrants from Iraq (2.7%, a difference of 0.020%), Delaware (2.7%, a difference of 0.070%), Fijian (2.7%, a difference of 0.12%), Jamaican (2.7%, a difference of 0.16%), and Hispanic or Latino (2.7%, a difference of 0.17%).
| Demographics | Rating | Rank | Self-Care Disability |
| Immigrants | Trinidad and Tobago | 0.1 /100 | #275 | Tragic 2.7% |
| Japanese | 0.1 /100 | #276 | Tragic 2.7% |
| Immigrants | Ukraine | 0.1 /100 | #277 | Tragic 2.7% |
| Ottawa | 0.1 /100 | #278 | Tragic 2.7% |
| Iroquois | 0.1 /100 | #279 | Tragic 2.7% |
| Hispanics or Latinos | 0.1 /100 | #280 | Tragic 2.7% |
| Immigrants | Iraq | 0.0 /100 | #281 | Tragic 2.7% |
| Apache | 0.0 /100 | #282 | Tragic 2.7% |
| Delaware | 0.0 /100 | #283 | Tragic 2.7% |
| Fijians | 0.0 /100 | #284 | Tragic 2.7% |
| Jamaicans | 0.0 /100 | #285 | Tragic 2.7% |
| French American Indians | 0.0 /100 | #286 | Tragic 2.7% |
| Immigrants | Jamaica | 0.0 /100 | #287 | Tragic 2.7% |
| Immigrants | Barbados | 0.0 /100 | #288 | Tragic 2.7% |
| Africans | 0.0 /100 | #289 | Tragic 2.7% |
Demographics Similar to Immigrants from Venezuela by Self-Care Disability
In terms of self-care disability, the demographic groups most similar to Immigrants from Venezuela are Bulgarian (2.2%, a difference of 0.040%), Cambodian (2.2%, a difference of 0.21%), Tongan (2.2%, a difference of 0.29%), Immigrants from Eritrea (2.2%, a difference of 0.36%), and Cypriot (2.2%, a difference of 0.52%).
| Demographics | Rating | Rank | Self-Care Disability |
| Okinawans | 100.0 /100 | #15 | Exceptional 2.2% |
| Immigrants | Kuwait | 100.0 /100 | #16 | Exceptional 2.2% |
| Immigrants | Saudi Arabia | 100.0 /100 | #17 | Exceptional 2.2% |
| Immigrants | Taiwan | 100.0 /100 | #18 | Exceptional 2.2% |
| Immigrants | Eritrea | 100.0 /100 | #19 | Exceptional 2.2% |
| Tongans | 100.0 /100 | #20 | Exceptional 2.2% |
| Bulgarians | 100.0 /100 | #21 | Exceptional 2.2% |
| Immigrants | Venezuela | 100.0 /100 | #22 | Exceptional 2.2% |
| Cambodians | 100.0 /100 | #23 | Exceptional 2.2% |
| Cypriots | 100.0 /100 | #24 | Exceptional 2.2% |
| Turks | 100.0 /100 | #25 | Exceptional 2.2% |
| Immigrants | Sri Lanka | 99.9 /100 | #26 | Exceptional 2.2% |
| Venezuelans | 99.9 /100 | #27 | Exceptional 2.2% |
| Inupiat | 99.9 /100 | #28 | Exceptional 2.2% |
| Immigrants | Zimbabwe | 99.9 /100 | #29 | Exceptional 2.3% |