Apache vs Ecuadorian Child Poverty Under the Age of 5
COMPARE
Apache
Ecuadorian
Child Poverty Under the Age of 5
Child Poverty Under the Age of 5 Comparison
Apache
Ecuadorians
25.0%
CHILD POVERTY UNDER THE AGE OF 5
0.0/ 100
METRIC RATING
332nd/ 347
METRIC RANK
19.2%
CHILD POVERTY UNDER THE AGE OF 5
1.2/ 100
METRIC RATING
230th/ 347
METRIC RANK
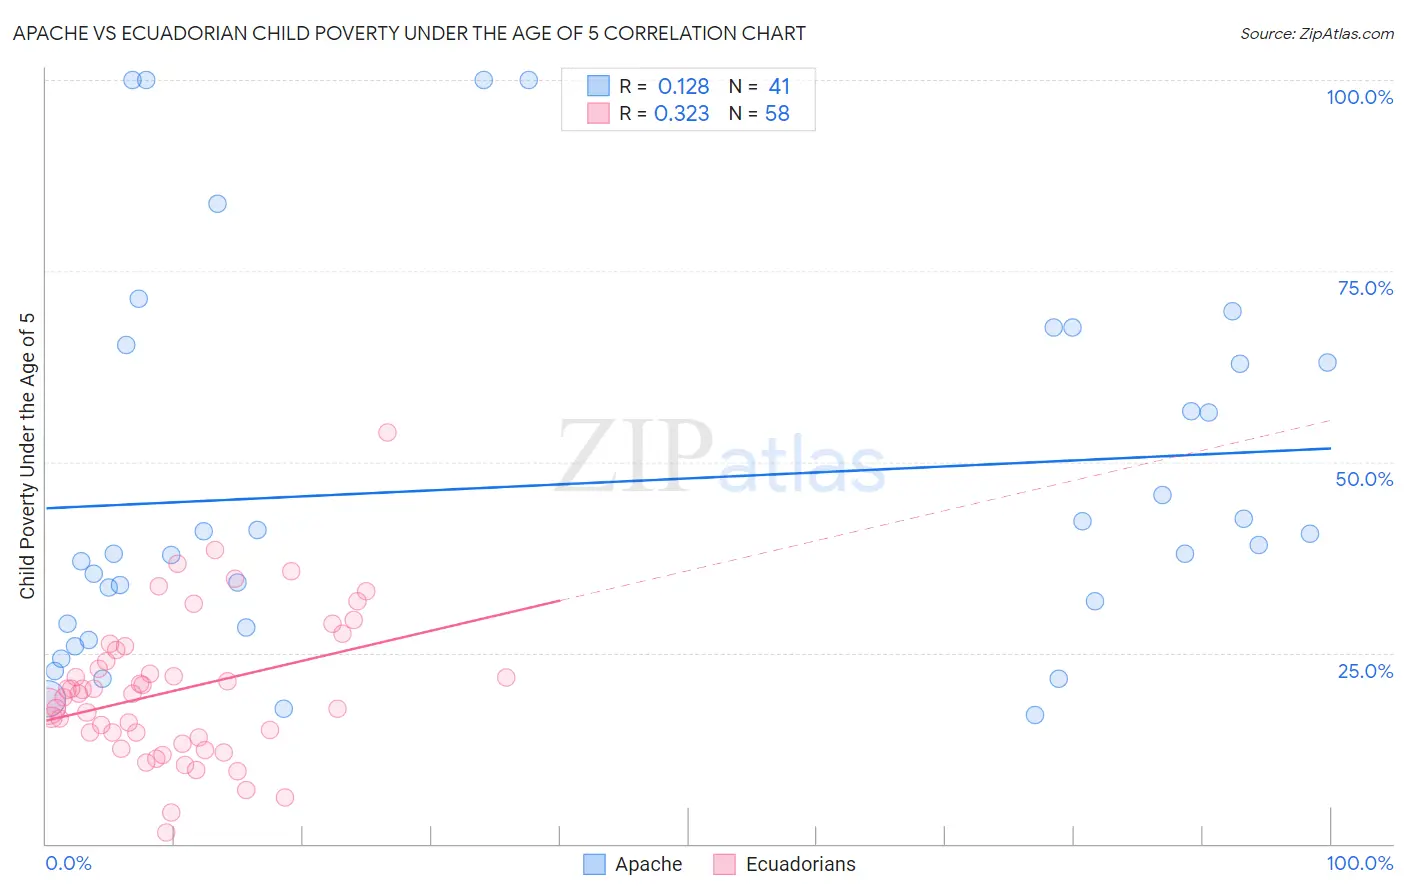
Apache vs Ecuadorian Child Poverty Under the Age of 5 Correlation Chart
The statistical analysis conducted on geographies consisting of 227,703,796 people shows a poor positive correlation between the proportion of Apache and poverty level among children under the age of 5 in the United States with a correlation coefficient (R) of 0.128 and weighted average of 25.0%. Similarly, the statistical analysis conducted on geographies consisting of 306,907,692 people shows a mild positive correlation between the proportion of Ecuadorians and poverty level among children under the age of 5 in the United States with a correlation coefficient (R) of 0.323 and weighted average of 19.2%, a difference of 30.1%.
Child Poverty Under the Age of 5 Correlation Summary
| Measurement | Apache | Ecuadorian |
| Minimum | 16.9% | 1.5% |
| Maximum | 100.0% | 53.9% |
| Range | 83.1% | 52.3% |
| Mean | 47.1% | 20.1% |
| Median | 39.2% | 19.7% |
| Interquartile 25% (IQ1) | 28.6% | 13.9% |
| Interquartile 75% (IQ3) | 64.1% | 25.4% |
| Interquartile Range (IQR) | 35.5% | 11.5% |
| Standard Deviation (Sample) | 24.2% | 9.5% |
| Standard Deviation (Population) | 23.9% | 9.5% |
Similar Demographics by Child Poverty Under the Age of 5
Demographics Similar to Apache by Child Poverty Under the Age of 5
In terms of child poverty under the age of 5, the demographic groups most similar to Apache are Kiowa (24.5%, a difference of 2.2%), Native/Alaskan (25.6%, a difference of 2.2%), Black/African American (25.7%, a difference of 2.8%), Colville (25.7%, a difference of 2.8%), and Creek (24.2%, a difference of 3.2%).
| Demographics | Rating | Rank | Child Poverty Under the Age of 5 |
| Immigrants | Congo | 0.0 /100 | #325 | Tragic 23.9% |
| Central American Indians | 0.0 /100 | #326 | Tragic 23.9% |
| Dominicans | 0.0 /100 | #327 | Tragic 24.0% |
| Immigrants | Dominican Republic | 0.0 /100 | #328 | Tragic 24.1% |
| Cajuns | 0.0 /100 | #329 | Tragic 24.1% |
| Creek | 0.0 /100 | #330 | Tragic 24.2% |
| Kiowa | 0.0 /100 | #331 | Tragic 24.5% |
| Apache | 0.0 /100 | #332 | Tragic 25.0% |
| Natives/Alaskans | 0.0 /100 | #333 | Tragic 25.6% |
| Blacks/African Americans | 0.0 /100 | #334 | Tragic 25.7% |
| Colville | 0.0 /100 | #335 | Tragic 25.7% |
| Sioux | 0.0 /100 | #336 | Tragic 26.9% |
| Pima | 0.0 /100 | #337 | Tragic 27.4% |
| Hopi | 0.0 /100 | #338 | Tragic 27.7% |
| Yup'ik | 0.0 /100 | #339 | Tragic 27.7% |
Demographics Similar to Ecuadorians by Child Poverty Under the Age of 5
In terms of child poverty under the age of 5, the demographic groups most similar to Ecuadorians are Ghanaian (19.2%, a difference of 0.040%), Bermudan (19.2%, a difference of 0.050%), Immigrants from Sudan (19.2%, a difference of 0.12%), Cape Verdean (19.1%, a difference of 0.43%), and Immigrants from Eritrea (19.1%, a difference of 0.61%).
| Demographics | Rating | Rank | Child Poverty Under the Age of 5 |
| Cubans | 1.7 /100 | #223 | Tragic 19.1% |
| Nicaraguans | 1.6 /100 | #224 | Tragic 19.1% |
| Nigerians | 1.6 /100 | #225 | Tragic 19.1% |
| Immigrants | Eritrea | 1.5 /100 | #226 | Tragic 19.1% |
| Cape Verdeans | 1.4 /100 | #227 | Tragic 19.1% |
| Immigrants | Sudan | 1.3 /100 | #228 | Tragic 19.2% |
| Ghanaians | 1.2 /100 | #229 | Tragic 19.2% |
| Ecuadorians | 1.2 /100 | #230 | Tragic 19.2% |
| Bermudans | 1.2 /100 | #231 | Tragic 19.2% |
| Trinidadians and Tobagonians | 0.9 /100 | #232 | Tragic 19.3% |
| Sudanese | 0.9 /100 | #233 | Tragic 19.3% |
| Immigrants | Micronesia | 0.9 /100 | #234 | Tragic 19.4% |
| Immigrants | Laos | 0.8 /100 | #235 | Tragic 19.4% |
| Immigrants | Trinidad and Tobago | 0.8 /100 | #236 | Tragic 19.4% |
| Immigrants | Cabo Verde | 0.6 /100 | #237 | Tragic 19.5% |