Alaskan Athabascan vs Pima Male Disability
COMPARE
Alaskan Athabascan
Pima
Male Disability
Male Disability Comparison
Alaskan Athabascans
Pima
14.9%
MALE DISABILITY
0.0/ 100
METRIC RATING
336th/ 347
METRIC RANK
12.8%
MALE DISABILITY
0.0/ 100
METRIC RATING
290th/ 347
METRIC RANK
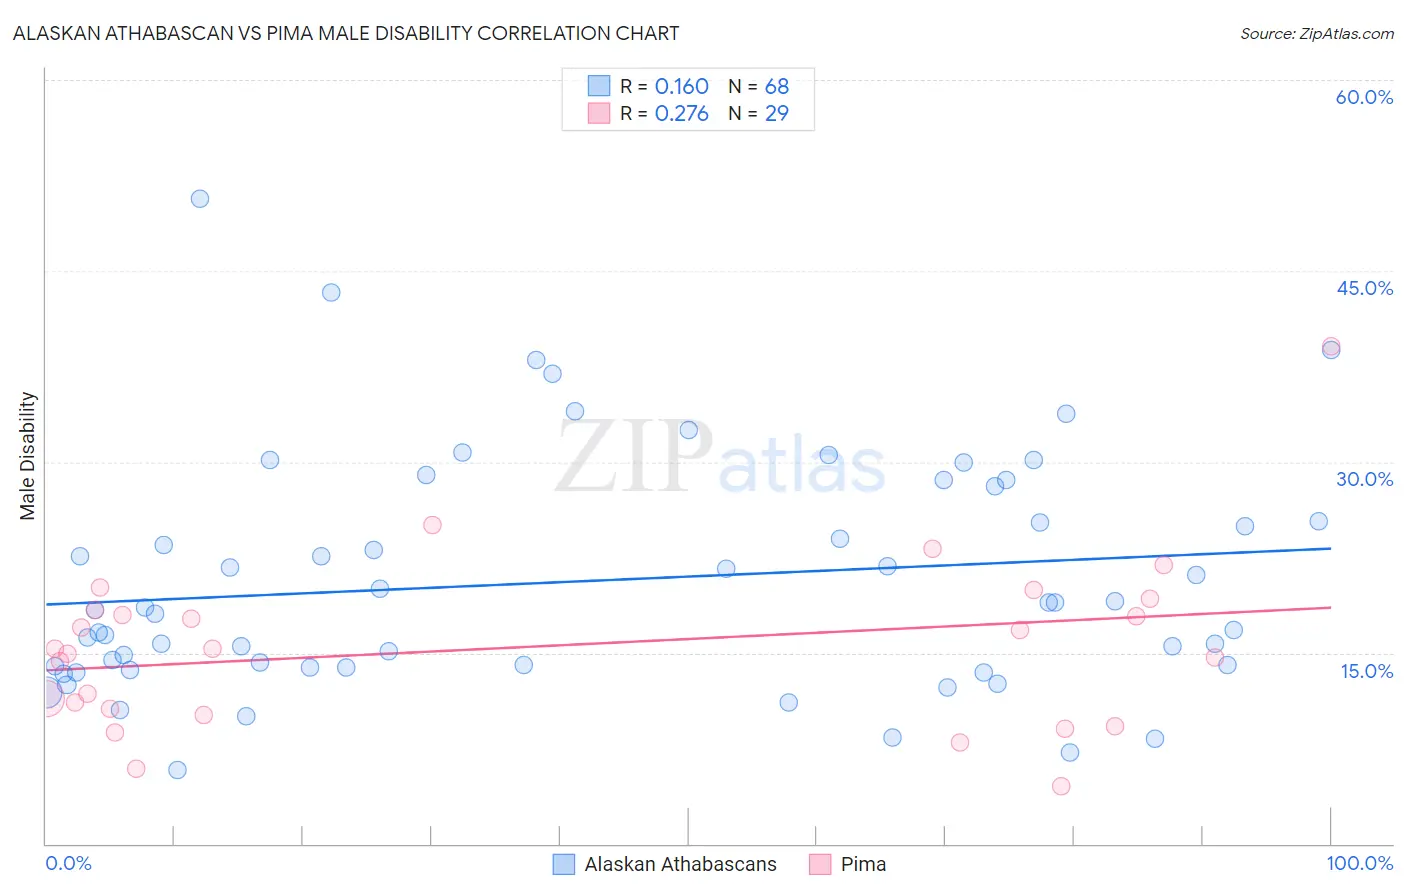
Alaskan Athabascan vs Pima Male Disability Correlation Chart
The statistical analysis conducted on geographies consisting of 45,820,726 people shows a poor positive correlation between the proportion of Alaskan Athabascans and percentage of males with a disability in the United States with a correlation coefficient (R) of 0.160 and weighted average of 14.9%. Similarly, the statistical analysis conducted on geographies consisting of 61,540,793 people shows a weak positive correlation between the proportion of Pima and percentage of males with a disability in the United States with a correlation coefficient (R) of 0.276 and weighted average of 12.8%, a difference of 16.2%.
Male Disability Correlation Summary
| Measurement | Alaskan Athabascan | Pima |
| Minimum | 5.8% | 4.5% |
| Maximum | 50.7% | 39.1% |
| Range | 44.9% | 34.6% |
| Mean | 20.7% | 15.5% |
| Median | 18.5% | 15.3% |
| Interquartile 25% (IQ1) | 13.9% | 10.3% |
| Interquartile 75% (IQ3) | 26.7% | 18.8% |
| Interquartile Range (IQR) | 12.8% | 8.5% |
| Standard Deviation (Sample) | 9.2% | 6.9% |
| Standard Deviation (Population) | 9.1% | 6.8% |
Similar Demographics by Male Disability
Demographics Similar to Alaskan Athabascans by Male Disability
In terms of male disability, the demographic groups most similar to Alaskan Athabascans are Dutch West Indian (14.8%, a difference of 0.46%), Cherokee (14.8%, a difference of 0.49%), Menominee (15.0%, a difference of 0.51%), Pueblo (15.0%, a difference of 0.62%), and Yuman (14.7%, a difference of 1.2%).
| Demographics | Rating | Rank | Male Disability |
| Cajuns | 0.0 /100 | #329 | Tragic 14.4% |
| Navajo | 0.0 /100 | #330 | Tragic 14.4% |
| Tohono O'odham | 0.0 /100 | #331 | Tragic 14.6% |
| Seminole | 0.0 /100 | #332 | Tragic 14.7% |
| Yuman | 0.0 /100 | #333 | Tragic 14.7% |
| Cherokee | 0.0 /100 | #334 | Tragic 14.8% |
| Dutch West Indians | 0.0 /100 | #335 | Tragic 14.8% |
| Alaskan Athabascans | 0.0 /100 | #336 | Tragic 14.9% |
| Menominee | 0.0 /100 | #337 | Tragic 15.0% |
| Pueblo | 0.0 /100 | #338 | Tragic 15.0% |
| Chickasaw | 0.0 /100 | #339 | Tragic 15.1% |
| Lumbee | 0.0 /100 | #340 | Tragic 15.2% |
| Choctaw | 0.0 /100 | #341 | Tragic 15.4% |
| Kiowa | 0.0 /100 | #342 | Tragic 15.4% |
| Creek | 0.0 /100 | #343 | Tragic 15.5% |
Demographics Similar to Pima by Male Disability
In terms of male disability, the demographic groups most similar to Pima are White/Caucasian (12.8%, a difference of 0.090%), Immigrants from Cabo Verde (12.8%, a difference of 0.15%), English (12.8%, a difference of 0.15%), Yup'ik (12.8%, a difference of 0.34%), and Yaqui (12.9%, a difference of 0.44%).
| Demographics | Rating | Rank | Male Disability |
| Germans | 0.0 /100 | #283 | Tragic 12.7% |
| Spanish | 0.0 /100 | #284 | Tragic 12.7% |
| Welsh | 0.0 /100 | #285 | Tragic 12.7% |
| Scottish | 0.0 /100 | #286 | Tragic 12.8% |
| Cape Verdeans | 0.0 /100 | #287 | Tragic 12.8% |
| Yup'ik | 0.0 /100 | #288 | Tragic 12.8% |
| Immigrants | Cabo Verde | 0.0 /100 | #289 | Tragic 12.8% |
| Pima | 0.0 /100 | #290 | Tragic 12.8% |
| Whites/Caucasians | 0.0 /100 | #291 | Tragic 12.8% |
| English | 0.0 /100 | #292 | Tragic 12.8% |
| Yaqui | 0.0 /100 | #293 | Tragic 12.9% |
| Marshallese | 0.0 /100 | #294 | Tragic 12.9% |
| Immigrants | Micronesia | 0.0 /100 | #295 | Tragic 12.9% |
| Immigrants | Nonimmigrants | 0.0 /100 | #296 | Tragic 12.9% |
| Inupiat | 0.0 /100 | #297 | Tragic 13.0% |