Alaskan Athabascan vs Bermudan Male Disability
COMPARE
Alaskan Athabascan
Bermudan
Male Disability
Male Disability Comparison
Alaskan Athabascans
Bermudans
14.9%
MALE DISABILITY
0.0/ 100
METRIC RATING
336th/ 347
METRIC RANK
11.8%
MALE DISABILITY
2.3/ 100
METRIC RATING
229th/ 347
METRIC RANK
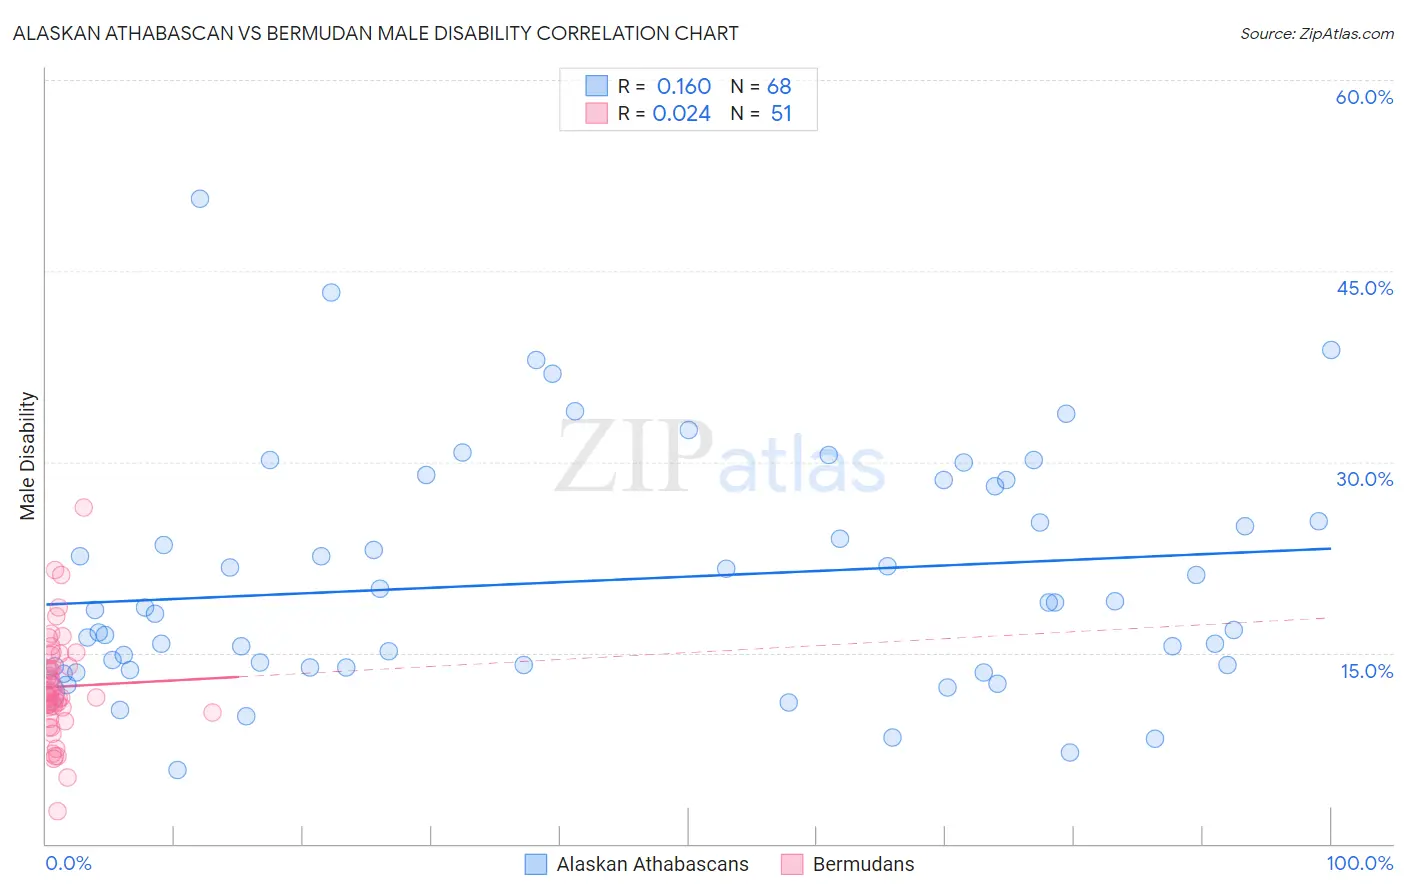
Alaskan Athabascan vs Bermudan Male Disability Correlation Chart
The statistical analysis conducted on geographies consisting of 45,820,726 people shows a poor positive correlation between the proportion of Alaskan Athabascans and percentage of males with a disability in the United States with a correlation coefficient (R) of 0.160 and weighted average of 14.9%. Similarly, the statistical analysis conducted on geographies consisting of 55,719,731 people shows no correlation between the proportion of Bermudans and percentage of males with a disability in the United States with a correlation coefficient (R) of 0.024 and weighted average of 11.8%, a difference of 26.3%.
Male Disability Correlation Summary
| Measurement | Alaskan Athabascan | Bermudan |
| Minimum | 5.8% | 2.5% |
| Maximum | 50.7% | 26.4% |
| Range | 44.9% | 23.9% |
| Mean | 20.7% | 12.3% |
| Median | 18.5% | 11.5% |
| Interquartile 25% (IQ1) | 13.9% | 10.3% |
| Interquartile 75% (IQ3) | 26.7% | 14.8% |
| Interquartile Range (IQR) | 12.8% | 4.5% |
| Standard Deviation (Sample) | 9.2% | 4.2% |
| Standard Deviation (Population) | 9.1% | 4.2% |
Similar Demographics by Male Disability
Demographics Similar to Alaskan Athabascans by Male Disability
In terms of male disability, the demographic groups most similar to Alaskan Athabascans are Dutch West Indian (14.8%, a difference of 0.46%), Cherokee (14.8%, a difference of 0.49%), Menominee (15.0%, a difference of 0.51%), Pueblo (15.0%, a difference of 0.62%), and Yuman (14.7%, a difference of 1.2%).
| Demographics | Rating | Rank | Male Disability |
| Cajuns | 0.0 /100 | #329 | Tragic 14.4% |
| Navajo | 0.0 /100 | #330 | Tragic 14.4% |
| Tohono O'odham | 0.0 /100 | #331 | Tragic 14.6% |
| Seminole | 0.0 /100 | #332 | Tragic 14.7% |
| Yuman | 0.0 /100 | #333 | Tragic 14.7% |
| Cherokee | 0.0 /100 | #334 | Tragic 14.8% |
| Dutch West Indians | 0.0 /100 | #335 | Tragic 14.8% |
| Alaskan Athabascans | 0.0 /100 | #336 | Tragic 14.9% |
| Menominee | 0.0 /100 | #337 | Tragic 15.0% |
| Pueblo | 0.0 /100 | #338 | Tragic 15.0% |
| Chickasaw | 0.0 /100 | #339 | Tragic 15.1% |
| Lumbee | 0.0 /100 | #340 | Tragic 15.2% |
| Choctaw | 0.0 /100 | #341 | Tragic 15.4% |
| Kiowa | 0.0 /100 | #342 | Tragic 15.4% |
| Creek | 0.0 /100 | #343 | Tragic 15.5% |
Demographics Similar to Bermudans by Male Disability
In terms of male disability, the demographic groups most similar to Bermudans are Hispanic or Latino (11.8%, a difference of 0.030%), Croatian (11.8%, a difference of 0.090%), Austrian (11.8%, a difference of 0.11%), Dominican (11.8%, a difference of 0.28%), and Subsaharan African (11.8%, a difference of 0.29%).
| Demographics | Rating | Rank | Male Disability |
| Alsatians | 3.3 /100 | #222 | Tragic 11.7% |
| Immigrants | Bahamas | 3.2 /100 | #223 | Tragic 11.7% |
| Japanese | 3.1 /100 | #224 | Tragic 11.7% |
| Liberians | 3.1 /100 | #225 | Tragic 11.8% |
| Sub-Saharan Africans | 2.8 /100 | #226 | Tragic 11.8% |
| Austrians | 2.5 /100 | #227 | Tragic 11.8% |
| Hispanics or Latinos | 2.3 /100 | #228 | Tragic 11.8% |
| Bermudans | 2.3 /100 | #229 | Tragic 11.8% |
| Croatians | 2.1 /100 | #230 | Tragic 11.8% |
| Dominicans | 1.8 /100 | #231 | Tragic 11.8% |
| Malaysians | 1.8 /100 | #232 | Tragic 11.8% |
| Mexicans | 1.7 /100 | #233 | Tragic 11.8% |
| Immigrants | Canada | 1.6 /100 | #234 | Tragic 11.9% |
| Immigrants | North America | 1.5 /100 | #235 | Tragic 11.9% |
| U.S. Virgin Islanders | 1.3 /100 | #236 | Tragic 11.9% |