Alaskan Athabascan vs Immigrants from Jamaica Male Disability
COMPARE
Alaskan Athabascan
Immigrants from Jamaica
Male Disability
Male Disability Comparison
Alaskan Athabascans
Immigrants from Jamaica
14.9%
MALE DISABILITY
0.0/ 100
METRIC RATING
336th/ 347
METRIC RANK
11.5%
MALE DISABILITY
16.3/ 100
METRIC RATING
198th/ 347
METRIC RANK
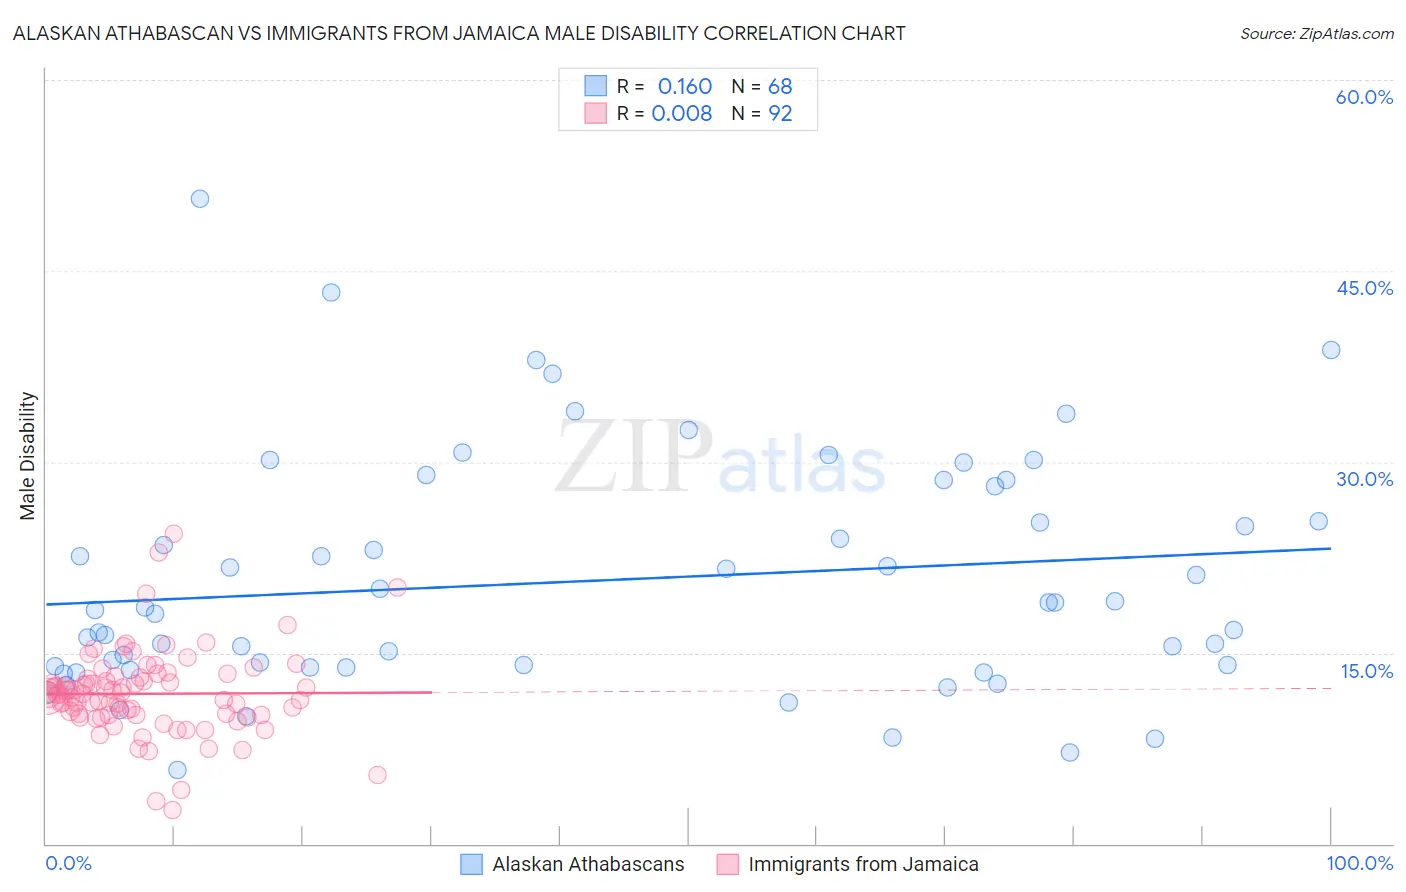
Alaskan Athabascan vs Immigrants from Jamaica Male Disability Correlation Chart
The statistical analysis conducted on geographies consisting of 45,820,726 people shows a poor positive correlation between the proportion of Alaskan Athabascans and percentage of males with a disability in the United States with a correlation coefficient (R) of 0.160 and weighted average of 14.9%. Similarly, the statistical analysis conducted on geographies consisting of 301,738,521 people shows no correlation between the proportion of Immigrants from Jamaica and percentage of males with a disability in the United States with a correlation coefficient (R) of 0.008 and weighted average of 11.5%, a difference of 30.0%.
Male Disability Correlation Summary
| Measurement | Alaskan Athabascan | Immigrants from Jamaica |
| Minimum | 5.8% | 2.6% |
| Maximum | 50.7% | 24.3% |
| Range | 44.9% | 21.7% |
| Mean | 20.7% | 11.8% |
| Median | 18.5% | 11.7% |
| Interquartile 25% (IQ1) | 13.9% | 10.1% |
| Interquartile 75% (IQ3) | 26.7% | 13.1% |
| Interquartile Range (IQR) | 12.8% | 3.0% |
| Standard Deviation (Sample) | 9.2% | 3.4% |
| Standard Deviation (Population) | 9.1% | 3.3% |
Similar Demographics by Male Disability
Demographics Similar to Alaskan Athabascans by Male Disability
In terms of male disability, the demographic groups most similar to Alaskan Athabascans are Dutch West Indian (14.8%, a difference of 0.46%), Cherokee (14.8%, a difference of 0.49%), Menominee (15.0%, a difference of 0.51%), Pueblo (15.0%, a difference of 0.62%), and Yuman (14.7%, a difference of 1.2%).
| Demographics | Rating | Rank | Male Disability |
| Cajuns | 0.0 /100 | #329 | Tragic 14.4% |
| Navajo | 0.0 /100 | #330 | Tragic 14.4% |
| Tohono O'odham | 0.0 /100 | #331 | Tragic 14.6% |
| Seminole | 0.0 /100 | #332 | Tragic 14.7% |
| Yuman | 0.0 /100 | #333 | Tragic 14.7% |
| Cherokee | 0.0 /100 | #334 | Tragic 14.8% |
| Dutch West Indians | 0.0 /100 | #335 | Tragic 14.8% |
| Alaskan Athabascans | 0.0 /100 | #336 | Tragic 14.9% |
| Menominee | 0.0 /100 | #337 | Tragic 15.0% |
| Pueblo | 0.0 /100 | #338 | Tragic 15.0% |
| Chickasaw | 0.0 /100 | #339 | Tragic 15.1% |
| Lumbee | 0.0 /100 | #340 | Tragic 15.2% |
| Choctaw | 0.0 /100 | #341 | Tragic 15.4% |
| Kiowa | 0.0 /100 | #342 | Tragic 15.4% |
| Creek | 0.0 /100 | #343 | Tragic 15.5% |
Demographics Similar to Immigrants from Jamaica by Male Disability
In terms of male disability, the demographic groups most similar to Immigrants from Jamaica are Lebanese (11.5%, a difference of 0.090%), Somali (11.4%, a difference of 0.18%), West Indian (11.4%, a difference of 0.20%), Immigrants from Iraq (11.5%, a difference of 0.36%), and Immigrants from Panama (11.5%, a difference of 0.36%).
| Demographics | Rating | Rank | Male Disability |
| Senegalese | 23.2 /100 | #191 | Fair 11.4% |
| Assyrians/Chaldeans/Syriacs | 23.2 /100 | #192 | Fair 11.4% |
| Greeks | 22.2 /100 | #193 | Fair 11.4% |
| Belizeans | 21.2 /100 | #194 | Fair 11.4% |
| Immigrants | Oceania | 20.9 /100 | #195 | Fair 11.4% |
| West Indians | 18.4 /100 | #196 | Poor 11.4% |
| Somalis | 18.2 /100 | #197 | Poor 11.4% |
| Immigrants | Jamaica | 16.3 /100 | #198 | Poor 11.5% |
| Lebanese | 15.4 /100 | #199 | Poor 11.5% |
| Immigrants | Iraq | 13.0 /100 | #200 | Poor 11.5% |
| Immigrants | Panama | 13.0 /100 | #201 | Poor 11.5% |
| Immigrants | Mexico | 12.6 /100 | #202 | Poor 11.5% |
| Jamaicans | 10.9 /100 | #203 | Poor 11.5% |
| Immigrants | Cambodia | 10.8 /100 | #204 | Poor 11.5% |
| Serbians | 10.7 /100 | #205 | Poor 11.5% |