Alaskan Athabascan vs Nigerian Male Disability
COMPARE
Alaskan Athabascan
Nigerian
Male Disability
Male Disability Comparison
Alaskan Athabascans
Nigerians
14.9%
MALE DISABILITY
0.0/ 100
METRIC RATING
336th/ 347
METRIC RANK
11.0%
MALE DISABILITY
81.9/ 100
METRIC RATING
138th/ 347
METRIC RANK
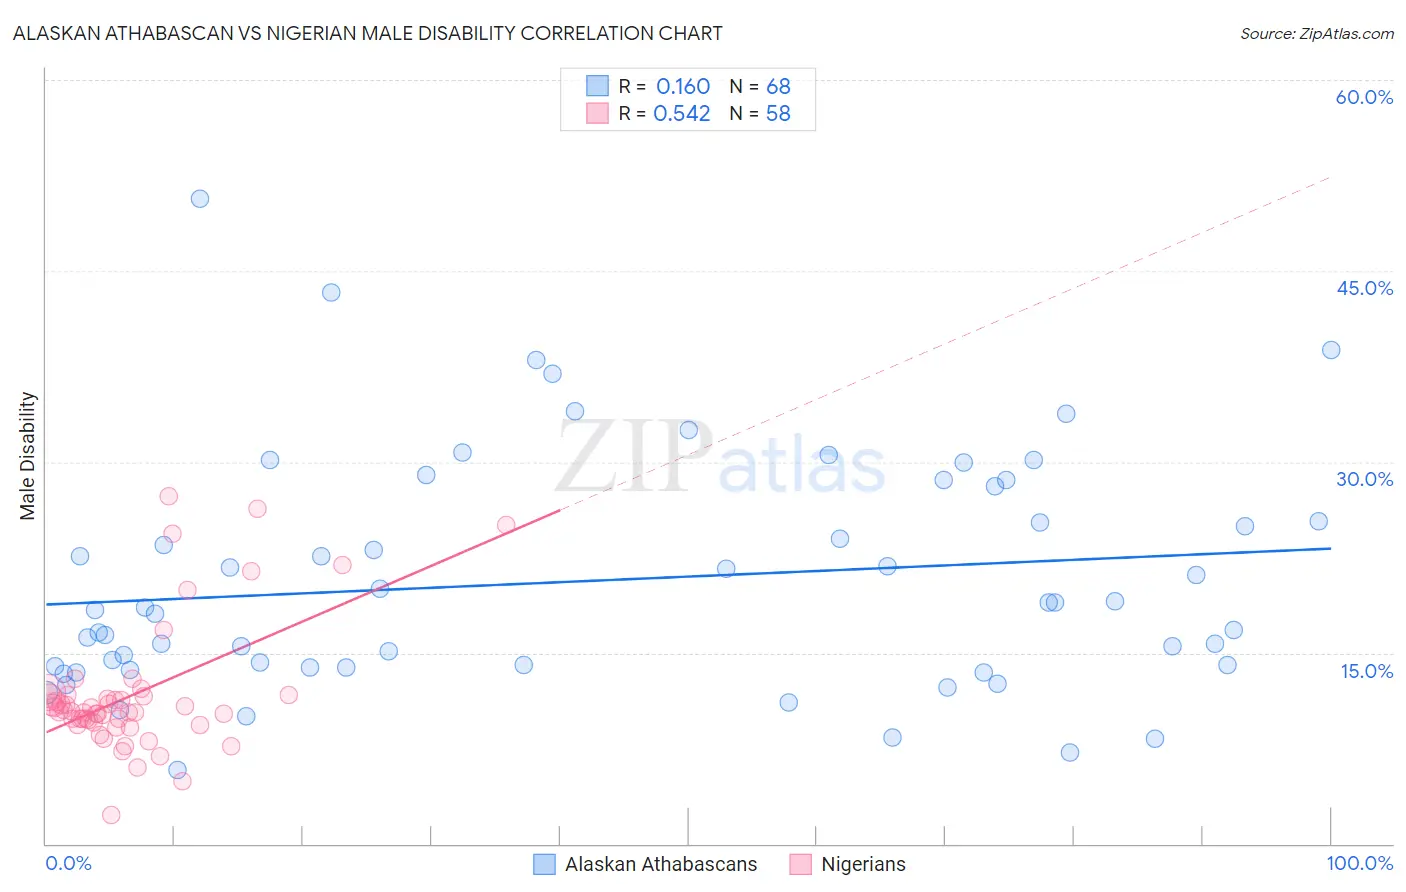
Alaskan Athabascan vs Nigerian Male Disability Correlation Chart
The statistical analysis conducted on geographies consisting of 45,820,726 people shows a poor positive correlation between the proportion of Alaskan Athabascans and percentage of males with a disability in the United States with a correlation coefficient (R) of 0.160 and weighted average of 14.9%. Similarly, the statistical analysis conducted on geographies consisting of 332,727,494 people shows a substantial positive correlation between the proportion of Nigerians and percentage of males with a disability in the United States with a correlation coefficient (R) of 0.542 and weighted average of 11.0%, a difference of 35.7%.
Male Disability Correlation Summary
| Measurement | Alaskan Athabascan | Nigerian |
| Minimum | 5.8% | 2.2% |
| Maximum | 50.7% | 27.3% |
| Range | 44.9% | 25.0% |
| Mean | 20.7% | 11.7% |
| Median | 18.5% | 10.4% |
| Interquartile 25% (IQ1) | 13.9% | 9.5% |
| Interquartile 75% (IQ3) | 26.7% | 11.6% |
| Interquartile Range (IQR) | 12.8% | 2.1% |
| Standard Deviation (Sample) | 9.2% | 5.0% |
| Standard Deviation (Population) | 9.1% | 5.0% |
Similar Demographics by Male Disability
Demographics Similar to Alaskan Athabascans by Male Disability
In terms of male disability, the demographic groups most similar to Alaskan Athabascans are Dutch West Indian (14.8%, a difference of 0.46%), Cherokee (14.8%, a difference of 0.49%), Menominee (15.0%, a difference of 0.51%), Pueblo (15.0%, a difference of 0.62%), and Yuman (14.7%, a difference of 1.2%).
| Demographics | Rating | Rank | Male Disability |
| Cajuns | 0.0 /100 | #329 | Tragic 14.4% |
| Navajo | 0.0 /100 | #330 | Tragic 14.4% |
| Tohono O'odham | 0.0 /100 | #331 | Tragic 14.6% |
| Seminole | 0.0 /100 | #332 | Tragic 14.7% |
| Yuman | 0.0 /100 | #333 | Tragic 14.7% |
| Cherokee | 0.0 /100 | #334 | Tragic 14.8% |
| Dutch West Indians | 0.0 /100 | #335 | Tragic 14.8% |
| Alaskan Athabascans | 0.0 /100 | #336 | Tragic 14.9% |
| Menominee | 0.0 /100 | #337 | Tragic 15.0% |
| Pueblo | 0.0 /100 | #338 | Tragic 15.0% |
| Chickasaw | 0.0 /100 | #339 | Tragic 15.1% |
| Lumbee | 0.0 /100 | #340 | Tragic 15.2% |
| Choctaw | 0.0 /100 | #341 | Tragic 15.4% |
| Kiowa | 0.0 /100 | #342 | Tragic 15.4% |
| Creek | 0.0 /100 | #343 | Tragic 15.5% |
Demographics Similar to Nigerians by Male Disability
In terms of male disability, the demographic groups most similar to Nigerians are Immigrants from Europe (11.0%, a difference of 0.010%), South African (11.0%, a difference of 0.020%), Immigrants from Italy (11.0%, a difference of 0.030%), Arab (11.0%, a difference of 0.040%), and Immigrants from Sudan (11.0%, a difference of 0.040%).
| Demographics | Rating | Rank | Male Disability |
| Macedonians | 84.2 /100 | #131 | Excellent 11.0% |
| Immigrants | Fiji | 84.0 /100 | #132 | Excellent 11.0% |
| Ugandans | 83.9 /100 | #133 | Excellent 11.0% |
| Bhutanese | 83.4 /100 | #134 | Excellent 11.0% |
| Trinidadians and Tobagonians | 83.3 /100 | #135 | Excellent 11.0% |
| Immigrants | Costa Rica | 82.8 /100 | #136 | Excellent 11.0% |
| Immigrants | Europe | 82.0 /100 | #137 | Excellent 11.0% |
| Nigerians | 81.9 /100 | #138 | Excellent 11.0% |
| South Africans | 81.7 /100 | #139 | Excellent 11.0% |
| Immigrants | Italy | 81.5 /100 | #140 | Excellent 11.0% |
| Arabs | 81.5 /100 | #141 | Excellent 11.0% |
| Immigrants | Sudan | 81.5 /100 | #142 | Excellent 11.0% |
| Moroccans | 80.7 /100 | #143 | Excellent 11.0% |
| Kenyans | 78.1 /100 | #144 | Good 11.0% |
| Costa Ricans | 78.0 /100 | #145 | Good 11.0% |