Alaskan Athabascan vs Pima College, 1 year or more
COMPARE
Alaskan Athabascan
Pima
College, 1 year or more
College, 1 year or more Comparison
Alaskan Athabascans
Pima
53.4%
COLLEGE, 1 YEAR OR MORE
0.0/ 100
METRIC RATING
290th/ 347
METRIC RANK
45.6%
COLLEGE, 1 YEAR OR MORE
0.0/ 100
METRIC RATING
345th/ 347
METRIC RANK
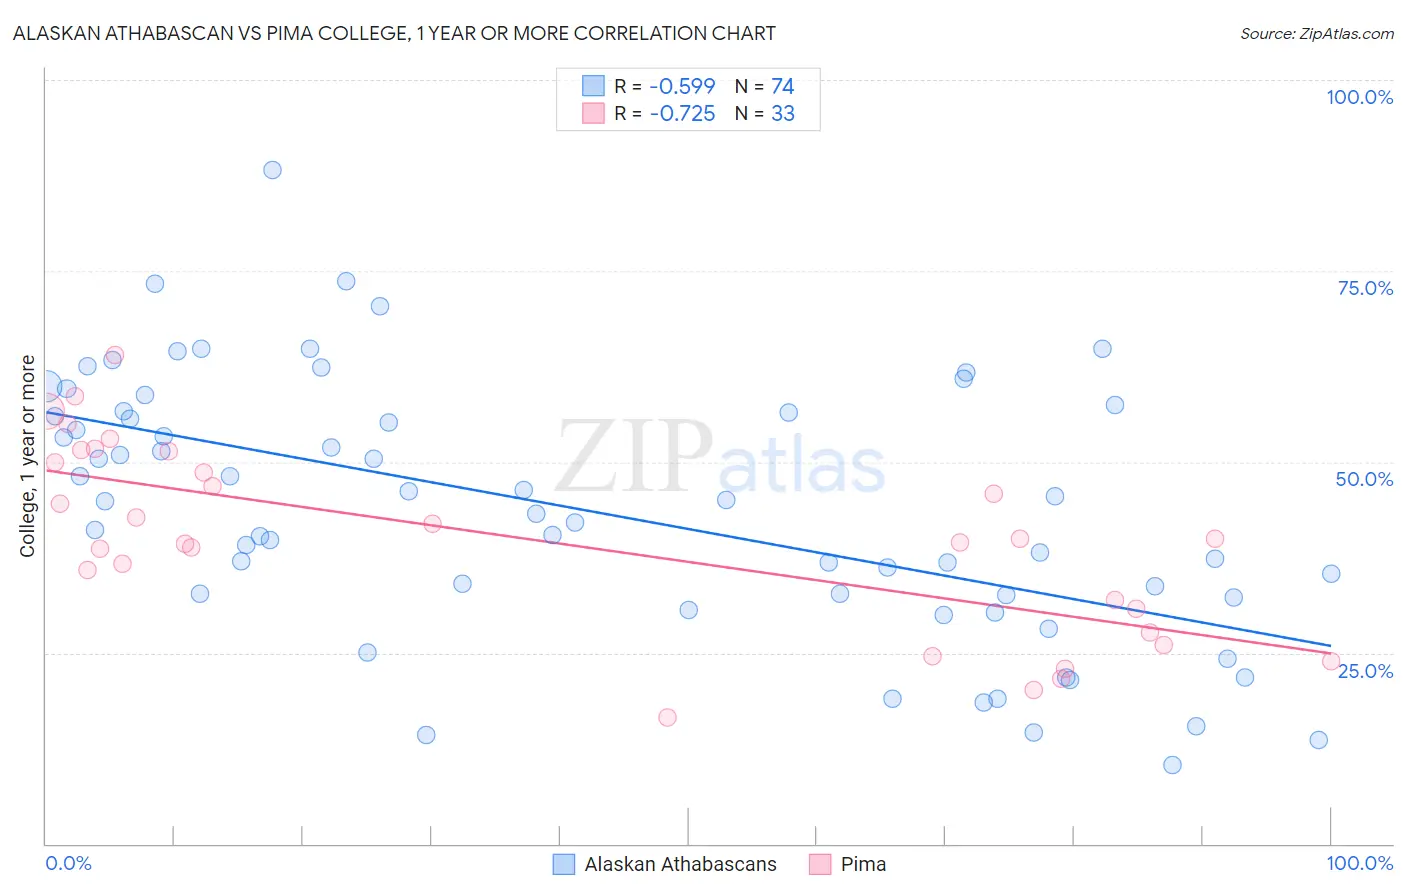
Alaskan Athabascan vs Pima College, 1 year or more Correlation Chart
The statistical analysis conducted on geographies consisting of 45,820,330 people shows a substantial negative correlation between the proportion of Alaskan Athabascans and percentage of population with at least college, 1 year or more education in the United States with a correlation coefficient (R) of -0.599 and weighted average of 53.4%. Similarly, the statistical analysis conducted on geographies consisting of 61,552,513 people shows a strong negative correlation between the proportion of Pima and percentage of population with at least college, 1 year or more education in the United States with a correlation coefficient (R) of -0.725 and weighted average of 45.6%, a difference of 17.1%.
College, 1 year or more Correlation Summary
| Measurement | Alaskan Athabascan | Pima |
| Minimum | 10.3% | 16.6% |
| Maximum | 88.2% | 64.1% |
| Range | 77.9% | 47.5% |
| Mean | 43.6% | 39.9% |
| Median | 44.1% | 39.9% |
| Interquartile 25% (IQ1) | 32.5% | 29.3% |
| Interquartile 75% (IQ3) | 56.5% | 50.7% |
| Interquartile Range (IQR) | 24.0% | 21.4% |
| Standard Deviation (Sample) | 16.8% | 12.3% |
| Standard Deviation (Population) | 16.7% | 12.2% |
Similar Demographics by College, 1 year or more
Demographics Similar to Alaskan Athabascans by College, 1 year or more
In terms of college, 1 year or more, the demographic groups most similar to Alaskan Athabascans are Alaska Native (53.4%, a difference of 0.020%), Immigrants from Ecuador (53.4%, a difference of 0.020%), Cuban (53.4%, a difference of 0.050%), Chickasaw (53.3%, a difference of 0.18%), and Immigrants from Belize (53.5%, a difference of 0.19%).
| Demographics | Rating | Rank | College, 1 year or more |
| Nicaraguans | 0.1 /100 | #283 | Tragic 53.9% |
| Ute | 0.1 /100 | #284 | Tragic 53.8% |
| Immigrants | Guyana | 0.1 /100 | #285 | Tragic 53.5% |
| Central American Indians | 0.1 /100 | #286 | Tragic 53.5% |
| Immigrants | Belize | 0.1 /100 | #287 | Tragic 53.5% |
| Alaska Natives | 0.0 /100 | #288 | Tragic 53.4% |
| Immigrants | Ecuador | 0.0 /100 | #289 | Tragic 53.4% |
| Alaskan Athabascans | 0.0 /100 | #290 | Tragic 53.4% |
| Cubans | 0.0 /100 | #291 | Tragic 53.4% |
| Chickasaw | 0.0 /100 | #292 | Tragic 53.3% |
| Blacks/African Americans | 0.0 /100 | #293 | Tragic 53.3% |
| Cherokee | 0.0 /100 | #294 | Tragic 53.2% |
| Yaqui | 0.0 /100 | #295 | Tragic 53.2% |
| Sioux | 0.0 /100 | #296 | Tragic 53.0% |
| Paiute | 0.0 /100 | #297 | Tragic 52.9% |
Demographics Similar to Pima by College, 1 year or more
In terms of college, 1 year or more, the demographic groups most similar to Pima are Yakama (46.2%, a difference of 1.3%), Tohono O'odham (47.1%, a difference of 3.4%), Inupiat (47.2%, a difference of 3.6%), Immigrants from Mexico (47.5%, a difference of 4.2%), and Immigrants from Cabo Verde (48.1%, a difference of 5.4%).
| Demographics | Rating | Rank | College, 1 year or more |
| Immigrants | Dominican Republic | 0.0 /100 | #333 | Tragic 49.1% |
| Lumbee | 0.0 /100 | #334 | Tragic 48.9% |
| Yuman | 0.0 /100 | #335 | Tragic 48.7% |
| Spanish American Indians | 0.0 /100 | #336 | Tragic 48.5% |
| Pennsylvania Germans | 0.0 /100 | #337 | Tragic 48.5% |
| Immigrants | Central America | 0.0 /100 | #338 | Tragic 48.5% |
| Immigrants | Azores | 0.0 /100 | #339 | Tragic 48.4% |
| Immigrants | Cabo Verde | 0.0 /100 | #340 | Tragic 48.1% |
| Immigrants | Mexico | 0.0 /100 | #341 | Tragic 47.5% |
| Inupiat | 0.0 /100 | #342 | Tragic 47.2% |
| Tohono O'odham | 0.0 /100 | #343 | Tragic 47.1% |
| Yakama | 0.0 /100 | #344 | Tragic 46.2% |
| Pima | 0.0 /100 | #345 | Tragic 45.6% |
| Houma | 0.0 /100 | #346 | Tragic 41.2% |
| Yup'ik | 0.0 /100 | #347 | Tragic 39.4% |