Alaskan Athabascan vs Lithuanian Male Disability
COMPARE
Alaskan Athabascan
Lithuanian
Male Disability
Male Disability Comparison
Alaskan Athabascans
Lithuanians
14.9%
MALE DISABILITY
0.0/ 100
METRIC RATING
336th/ 347
METRIC RANK
11.6%
MALE DISABILITY
6.6/ 100
METRIC RATING
214th/ 347
METRIC RANK
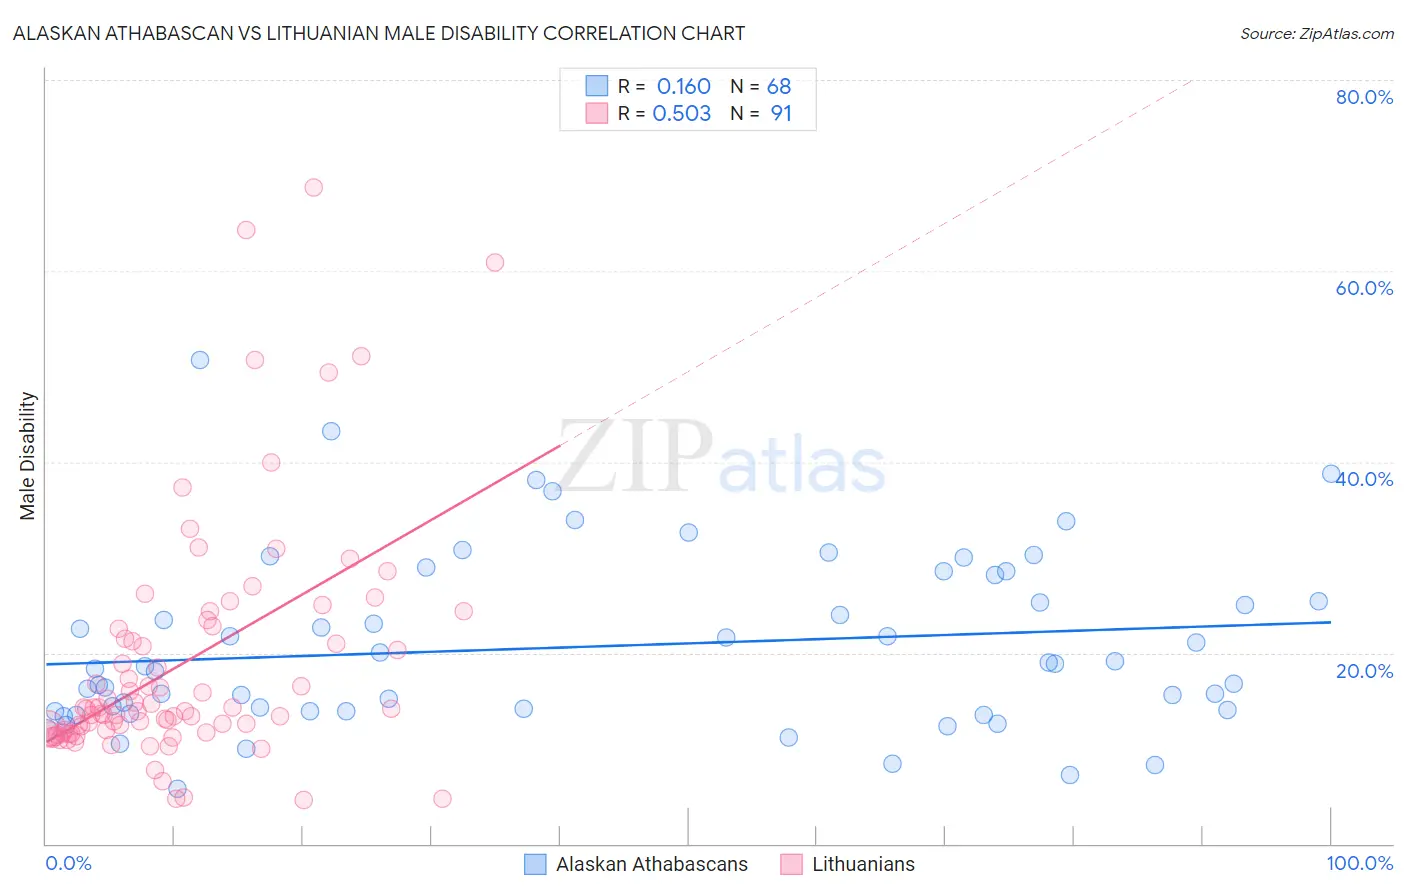
Alaskan Athabascan vs Lithuanian Male Disability Correlation Chart
The statistical analysis conducted on geographies consisting of 45,820,726 people shows a poor positive correlation between the proportion of Alaskan Athabascans and percentage of males with a disability in the United States with a correlation coefficient (R) of 0.160 and weighted average of 14.9%. Similarly, the statistical analysis conducted on geographies consisting of 421,914,182 people shows a substantial positive correlation between the proportion of Lithuanians and percentage of males with a disability in the United States with a correlation coefficient (R) of 0.503 and weighted average of 11.6%, a difference of 28.2%.
Male Disability Correlation Summary
| Measurement | Alaskan Athabascan | Lithuanian |
| Minimum | 5.8% | 4.5% |
| Maximum | 50.7% | 68.7% |
| Range | 44.9% | 64.1% |
| Mean | 20.7% | 18.8% |
| Median | 18.5% | 14.1% |
| Interquartile 25% (IQ1) | 13.9% | 11.6% |
| Interquartile 75% (IQ3) | 26.7% | 22.5% |
| Interquartile Range (IQR) | 12.8% | 10.9% |
| Standard Deviation (Sample) | 9.2% | 12.6% |
| Standard Deviation (Population) | 9.1% | 12.5% |
Similar Demographics by Male Disability
Demographics Similar to Alaskan Athabascans by Male Disability
In terms of male disability, the demographic groups most similar to Alaskan Athabascans are Dutch West Indian (14.8%, a difference of 0.46%), Cherokee (14.8%, a difference of 0.49%), Menominee (15.0%, a difference of 0.51%), Pueblo (15.0%, a difference of 0.62%), and Yuman (14.7%, a difference of 1.2%).
| Demographics | Rating | Rank | Male Disability |
| Cajuns | 0.0 /100 | #329 | Tragic 14.4% |
| Navajo | 0.0 /100 | #330 | Tragic 14.4% |
| Tohono O'odham | 0.0 /100 | #331 | Tragic 14.6% |
| Seminole | 0.0 /100 | #332 | Tragic 14.7% |
| Yuman | 0.0 /100 | #333 | Tragic 14.7% |
| Cherokee | 0.0 /100 | #334 | Tragic 14.8% |
| Dutch West Indians | 0.0 /100 | #335 | Tragic 14.8% |
| Alaskan Athabascans | 0.0 /100 | #336 | Tragic 14.9% |
| Menominee | 0.0 /100 | #337 | Tragic 15.0% |
| Pueblo | 0.0 /100 | #338 | Tragic 15.0% |
| Chickasaw | 0.0 /100 | #339 | Tragic 15.1% |
| Lumbee | 0.0 /100 | #340 | Tragic 15.2% |
| Choctaw | 0.0 /100 | #341 | Tragic 15.4% |
| Kiowa | 0.0 /100 | #342 | Tragic 15.4% |
| Creek | 0.0 /100 | #343 | Tragic 15.5% |
Demographics Similar to Lithuanians by Male Disability
In terms of male disability, the demographic groups most similar to Lithuanians are Indonesian (11.6%, a difference of 0.16%), Mexican American Indian (11.6%, a difference of 0.24%), Immigrants from Scotland (11.6%, a difference of 0.32%), Immigrants from Thailand (11.6%, a difference of 0.35%), and Immigrants from Dominican Republic (11.7%, a difference of 0.44%).
| Demographics | Rating | Rank | Male Disability |
| Immigrants | Somalia | 10.4 /100 | #207 | Poor 11.5% |
| Icelanders | 10.1 /100 | #208 | Poor 11.6% |
| Spanish American Indians | 10.1 /100 | #209 | Poor 11.6% |
| Ute | 9.4 /100 | #210 | Tragic 11.6% |
| Immigrants | Thailand | 8.4 /100 | #211 | Tragic 11.6% |
| Immigrants | Scotland | 8.2 /100 | #212 | Tragic 11.6% |
| Mexican American Indians | 7.8 /100 | #213 | Tragic 11.6% |
| Lithuanians | 6.6 /100 | #214 | Tragic 11.6% |
| Indonesians | 5.9 /100 | #215 | Tragic 11.6% |
| Immigrants | Dominican Republic | 4.9 /100 | #216 | Tragic 11.7% |
| Immigrants | Dominica | 4.6 /100 | #217 | Tragic 11.7% |
| Immigrants | England | 4.0 /100 | #218 | Tragic 11.7% |
| Panamanians | 3.8 /100 | #219 | Tragic 11.7% |
| Immigrants | Western Europe | 3.8 /100 | #220 | Tragic 11.7% |
| Immigrants | Congo | 3.7 /100 | #221 | Tragic 11.7% |