Alaskan Athabascan vs Jamaican Male Disability
COMPARE
Alaskan Athabascan
Jamaican
Male Disability
Male Disability Comparison
Alaskan Athabascans
Jamaicans
14.9%
MALE DISABILITY
0.0/ 100
METRIC RATING
336th/ 347
METRIC RANK
11.5%
MALE DISABILITY
10.9/ 100
METRIC RATING
203rd/ 347
METRIC RANK
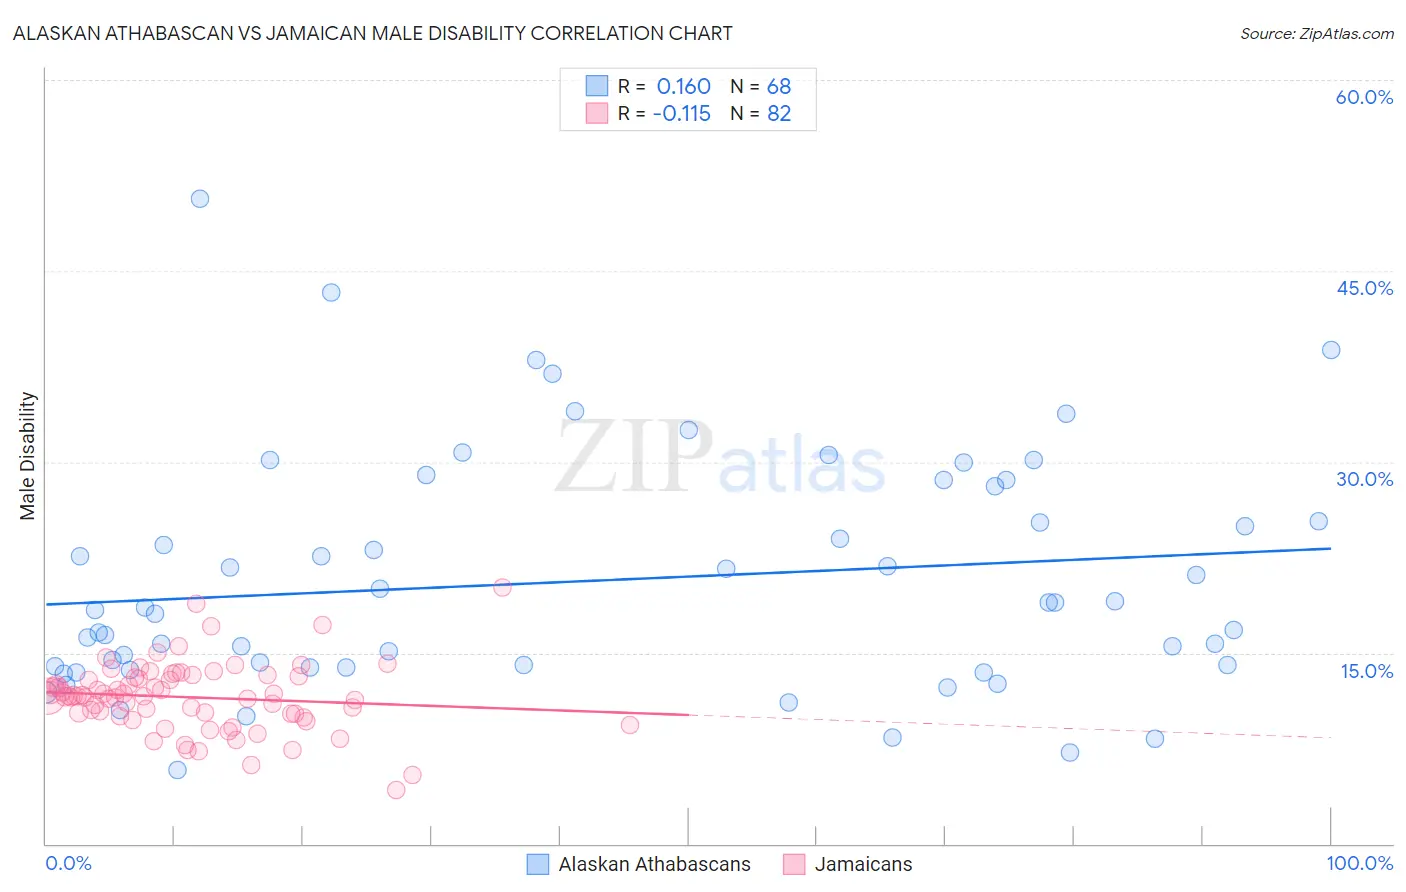
Alaskan Athabascan vs Jamaican Male Disability Correlation Chart
The statistical analysis conducted on geographies consisting of 45,820,726 people shows a poor positive correlation between the proportion of Alaskan Athabascans and percentage of males with a disability in the United States with a correlation coefficient (R) of 0.160 and weighted average of 14.9%. Similarly, the statistical analysis conducted on geographies consisting of 367,937,563 people shows a poor negative correlation between the proportion of Jamaicans and percentage of males with a disability in the United States with a correlation coefficient (R) of -0.115 and weighted average of 11.5%, a difference of 29.2%.
Male Disability Correlation Summary
| Measurement | Alaskan Athabascan | Jamaican |
| Minimum | 5.8% | 4.2% |
| Maximum | 50.7% | 20.1% |
| Range | 44.9% | 15.9% |
| Mean | 20.7% | 11.5% |
| Median | 18.5% | 11.6% |
| Interquartile 25% (IQ1) | 13.9% | 10.2% |
| Interquartile 75% (IQ3) | 26.7% | 13.1% |
| Interquartile Range (IQR) | 12.8% | 2.9% |
| Standard Deviation (Sample) | 9.2% | 2.7% |
| Standard Deviation (Population) | 9.1% | 2.7% |
Similar Demographics by Male Disability
Demographics Similar to Alaskan Athabascans by Male Disability
In terms of male disability, the demographic groups most similar to Alaskan Athabascans are Dutch West Indian (14.8%, a difference of 0.46%), Cherokee (14.8%, a difference of 0.49%), Menominee (15.0%, a difference of 0.51%), Pueblo (15.0%, a difference of 0.62%), and Yuman (14.7%, a difference of 1.2%).
| Demographics | Rating | Rank | Male Disability |
| Cajuns | 0.0 /100 | #329 | Tragic 14.4% |
| Navajo | 0.0 /100 | #330 | Tragic 14.4% |
| Tohono O'odham | 0.0 /100 | #331 | Tragic 14.6% |
| Seminole | 0.0 /100 | #332 | Tragic 14.7% |
| Yuman | 0.0 /100 | #333 | Tragic 14.7% |
| Cherokee | 0.0 /100 | #334 | Tragic 14.8% |
| Dutch West Indians | 0.0 /100 | #335 | Tragic 14.8% |
| Alaskan Athabascans | 0.0 /100 | #336 | Tragic 14.9% |
| Menominee | 0.0 /100 | #337 | Tragic 15.0% |
| Pueblo | 0.0 /100 | #338 | Tragic 15.0% |
| Chickasaw | 0.0 /100 | #339 | Tragic 15.1% |
| Lumbee | 0.0 /100 | #340 | Tragic 15.2% |
| Choctaw | 0.0 /100 | #341 | Tragic 15.4% |
| Kiowa | 0.0 /100 | #342 | Tragic 15.4% |
| Creek | 0.0 /100 | #343 | Tragic 15.5% |
Demographics Similar to Jamaicans by Male Disability
In terms of male disability, the demographic groups most similar to Jamaicans are Immigrants from Cambodia (11.5%, a difference of 0.010%), Serbian (11.5%, a difference of 0.020%), Ukrainian (11.5%, a difference of 0.030%), Immigrants from Somalia (11.5%, a difference of 0.060%), and Icelander (11.6%, a difference of 0.10%).
| Demographics | Rating | Rank | Male Disability |
| West Indians | 18.4 /100 | #196 | Poor 11.4% |
| Somalis | 18.2 /100 | #197 | Poor 11.4% |
| Immigrants | Jamaica | 16.3 /100 | #198 | Poor 11.5% |
| Lebanese | 15.4 /100 | #199 | Poor 11.5% |
| Immigrants | Iraq | 13.0 /100 | #200 | Poor 11.5% |
| Immigrants | Panama | 13.0 /100 | #201 | Poor 11.5% |
| Immigrants | Mexico | 12.6 /100 | #202 | Poor 11.5% |
| Jamaicans | 10.9 /100 | #203 | Poor 11.5% |
| Immigrants | Cambodia | 10.8 /100 | #204 | Poor 11.5% |
| Serbians | 10.7 /100 | #205 | Poor 11.5% |
| Ukrainians | 10.6 /100 | #206 | Poor 11.5% |
| Immigrants | Somalia | 10.4 /100 | #207 | Poor 11.5% |
| Icelanders | 10.1 /100 | #208 | Poor 11.6% |
| Spanish American Indians | 10.1 /100 | #209 | Poor 11.6% |
| Ute | 9.4 /100 | #210 | Tragic 11.6% |