Zip Codes with the Highest Percentage of Population Taking Taxi / Cab to Work in Colorado Springs, CO

RELATED REPORTS & OPTIONS

Taxi / Cab
Population
Families and Households
Female Fertility
Female Fertility (Unmarried)
Race (Community Size)
Race (Percentage)
Ancestry (Community Size)
AfghanAfricanAlaskan AthabascanAlbanianAlsatianAmericanApacheArabArapahoArgentineanArmenianAustralianAustrianBangladeshiBarbadianBasqueBelgianBelizeanBermudanBhutaneseBlackfeetBolivianBrazilianBritishBritish West IndianBulgarianBurmeseCajunCambodianCanadianCape VerdeanCarpatho RusynCelticCentral AmericanCentral American IndianCherokeeCheyenneChickasawChileanChineseChippewaChoctawColombianComancheCosta RicanCreeCreekCroatianCubanCzechCzechoslovakianDanishDelawareDominicanDutchEastern EuropeanEcuadorianEgyptianEnglishEstonianEthiopianEuropeanFilipinoFinnishFrenchFrench CanadianGermanGerman RussianGhanaianGreekGuamanian / ChamorroGuatemalanHaitianHonduranHopiHungarianIcelanderIndian (Asian)IndonesianInupiatIranianIraqiIrishIroquoisIsraeliItalianJamaicanJapaneseJordanianKenyanKoreanLaotianLatvianLebaneseLiberianLithuanianLuxembourgerMacedonianMalaysianMexicanMexican American IndianNative HawaiianNavajoNew ZealanderNicaraguanNigerianNorthern EuropeanNorwegianOkinawanOsagePakistaniPalestinianPanamanianPennsylvania GermanPeruvianPolishPortuguesePotawatomiPuebloPuerto RicanRomanianRussianSalvadoranSamoanScandinavianScotch-IrishScottishSeminoleSerbianShoshoneSiouxSlavicSlovakSloveneSomaliSouth AfricanSouth AmericanSouth American IndianSpaniardSpanishSpanish AmericanSpanish American IndianSri LankanSubsaharan AfricanSudaneseSwedishSwissSyrianThaiTohono O'OdhamTrinidadian and TobagonianTurkishUkrainianUteVenezuelanWelshWest IndianYaquiYugoslavian
Ancestry (Percentage)
AfghanAfricanAlaskan AthabascanAlbanianAlsatianAmericanApacheArabArapahoArgentineanArmenianAustralianAustrianBangladeshiBarbadianBasqueBelgianBelizeanBermudanBhutaneseBlackfeetBolivianBrazilianBritishBritish West IndianBulgarianBurmeseCajunCambodianCanadianCape VerdeanCarpatho RusynCelticCentral AmericanCentral American IndianCherokeeCheyenneChickasawChileanChineseChippewaChoctawColombianComancheCosta RicanCreeCreekCroatianCubanCzechCzechoslovakianDanishDelawareDominicanDutchEastern EuropeanEcuadorianEgyptianEnglishEstonianEthiopianEuropeanFilipinoFinnishFrenchFrench CanadianGermanGerman RussianGhanaianGreekGuamanian / ChamorroGuatemalanHaitianHonduranHopiHungarianIcelanderIndian (Asian)IndonesianInupiatIranianIraqiIrishIroquoisIsraeliItalianJamaicanJapaneseJordanianKenyanKoreanLaotianLatvianLebaneseLiberianLithuanianLuxembourgerMacedonianMalaysianMexicanMexican American IndianNative HawaiianNavajoNew ZealanderNicaraguanNigerianNorthern EuropeanNorwegianOkinawanOsagePakistaniPalestinianPanamanianPennsylvania GermanPeruvianPolishPortuguesePotawatomiPuebloPuerto RicanRomanianRussianSalvadoranSamoanScandinavianScotch-IrishScottishSeminoleSerbianShoshoneSiouxSlavicSlovakSloveneSomaliSouth AfricanSouth AmericanSouth American IndianSpaniardSpanishSpanish AmericanSpanish American IndianSri LankanSubsaharan AfricanSudaneseSwedishSwissSyrianThaiTohono O'OdhamTrinidadian and TobagonianTurkishUkrainianUteVenezuelanWelshWest IndianYaquiYugoslavian
Immigrant Origin (Total)
AfghanistanAfricaArgentinaArmeniaAsiaAustraliaAustriaBangladeshBarbadosBelarusBoliviaBosnia and HerzegovinaBrazilBulgariaBurma / MyanmarCambodiaCameroonCanadaCaribbeanCentral AmericaChileChinaColombiaCosta RicaCroatiaCubaCzechoslovakiaDenmarkDominican RepublicEastern AfricaEastern AsiaEastern EuropeEcuadorEgyptEl SalvadorEnglandEritreaEthiopiaEuropeFranceGermanyGhanaGuatemalaGuyanaHaitiHondurasHong KongHungaryIndiaIndonesiaIranIraqIrelandIsraelItalyJamaicaJapanKazakhstanKenyaKoreaLaosLatin AmericaLebanonLiberiaLithuaniaMexicoMiddle AfricaMoldovaNepalNetherlandsNicaraguaNigeriaNorth MacedoniaNorthern AfricaNorthern EuropeNorwayOceaniaPakistanPanamaPeruPhilippinesPolandRomaniaRussiaScotlandSingaporeSomaliaSouth AfricaSouth AmericaSouth Central AsiaSouth Eastern AsiaSouthern EuropeSpainSt. Vincent and the GrenadinesSwedenSwitzerlandSyriaTaiwanThailandTrinidad and TobagoTurkeyUgandaUkraineUzbekistanVenezuelaVietnamWest IndiesWestern AfricaWestern AsiaWestern EuropeZaireZimbabwe
Immigrant Origin (Percentage)
AfghanistanAfricaArgentinaArmeniaAsiaAustraliaAustriaBangladeshBarbadosBelarusBoliviaBosnia and HerzegovinaBrazilBulgariaBurma / MyanmarCambodiaCameroonCanadaCaribbeanCentral AmericaChileChinaColombiaCosta RicaCroatiaCubaCzechoslovakiaDenmarkDominican RepublicEastern AfricaEastern AsiaEastern EuropeEcuadorEgyptEl SalvadorEnglandEritreaEthiopiaEuropeFranceGermanyGhanaGuatemalaGuyanaHaitiHondurasHong KongHungaryIndiaIndonesiaIranIraqIrelandIsraelItalyJamaicaJapanKazakhstanKenyaKoreaLaosLatin AmericaLebanonLiberiaLithuaniaMexicoMiddle AfricaMoldovaNepalNetherlandsNicaraguaNigeriaNorth MacedoniaNorthern AfricaNorthern EuropeNorwayOceaniaPakistanPanamaPeruPhilippinesPolandRomaniaRussiaScotlandSingaporeSomaliaSouth AfricaSouth AmericaSouth Central AsiaSouth Eastern AsiaSouthern EuropeSpainSt. Vincent and the GrenadinesSwedenSwitzerlandSyriaTaiwanThailandTrinidad and TobagoTurkeyUgandaUkraineUzbekistanVenezuelaVietnamWest IndiesWestern AfricaWestern AsiaWestern EuropeZaireZimbabwe
Income
Income (Families)
Income (Households)
Poverty
Poverty (Families)
Unemployment
Employment Occupations
Employment Industries
Employer Class
Commute Time
Commute Means
School Enrollment
Education by Degree Field
Occupancy
Finances
Physical Characteristics
Colorado Springs
Compare Zip Codes
Comparison Subject

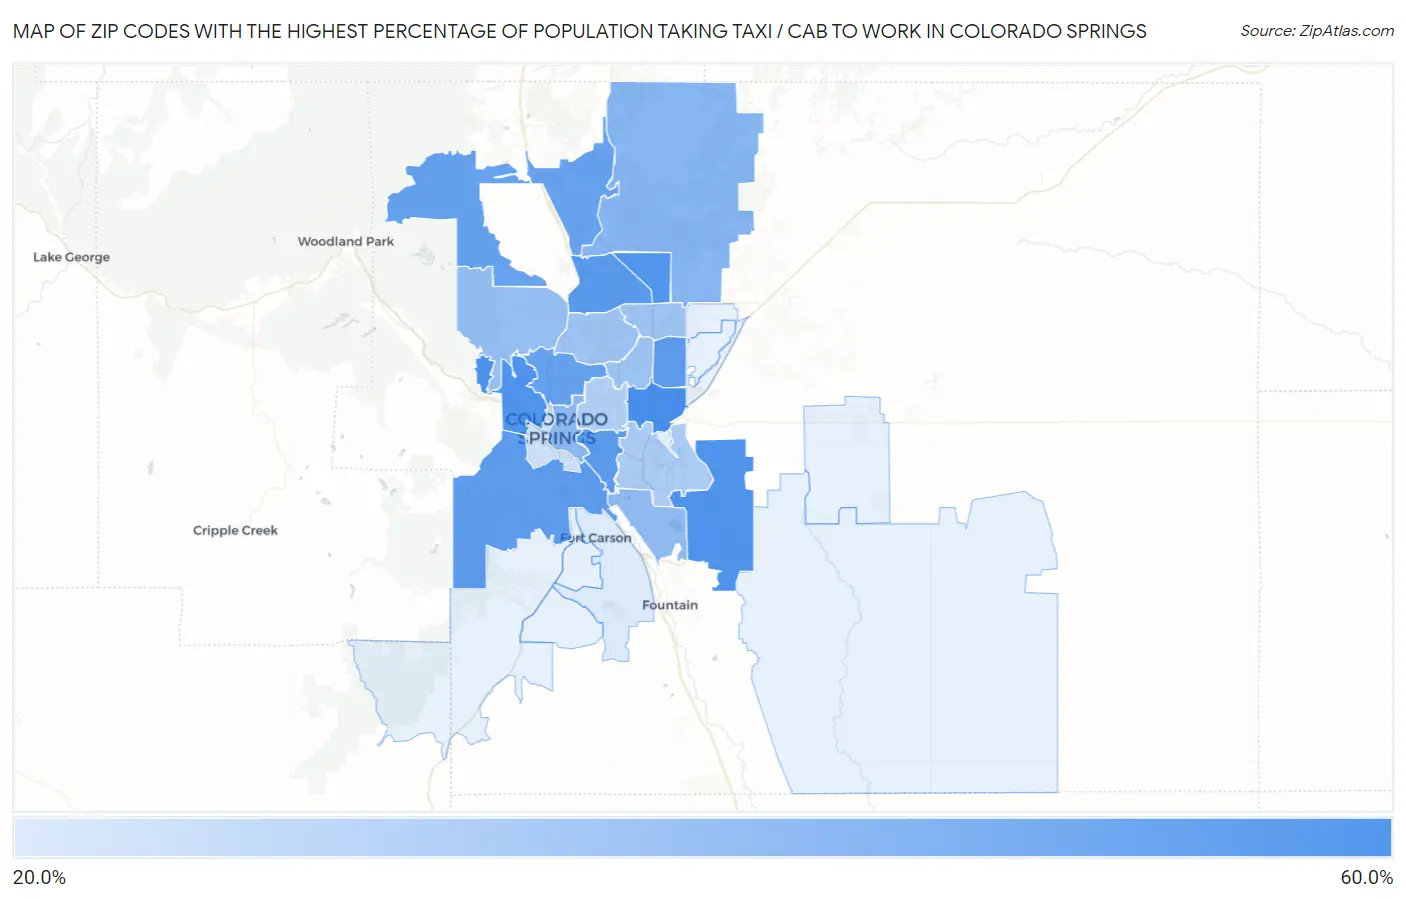
Map of Zip Codes with the Highest Percentage of Population Taking Taxi / Cab to Work in Colorado Springs

0.0%
60.0%
Zip Codes with the Highest Percentage of Population Taking Taxi / Cab to Work in Colorado Springs Map

Zip Codes with the Highest Percentage of Population Taking Taxi / Cab to Work in Colorado Springs, CO

Zip Code % Take Taxi / Cab vs State vs National
1.8091552.0%37.4%(+14.6)#3338.2%(+13.8)#2,381
2.8090450.3%37.4%(+12.9)#4138.2%(+12.1)#2,865
3.8092549.7%37.4%(+12.3)#4338.2%(+11.5)#3,043
4.8092449.5%37.4%(+12.1)#4538.2%(+11.3)#3,099
5.8092048.0%37.4%(+10.6)#5438.2%(+9.80)#3,619
6.8091047.1%37.4%(+9.70)#5938.2%(+8.90)#3,935
7.8090646.9%37.4%(+9.50)#6238.2%(+8.70)#3,988
8.8092246.5%37.4%(+9.10)#6438.2%(+8.30)#4,112
9.8090745.2%37.4%(+7.80)#7238.2%(+7.00)#4,584
10.8092144.6%37.4%(+7.20)#7738.2%(+6.40)#4,789
11.8090837.6%37.4%(+0.200)#12338.2%(-0.600)#7,682
12.8090335.9%37.4%(-1.50)#14038.2%(-2.30)#8,473
13.8091135.3%37.4%(-2.10)#14738.2%(-2.90)#8,781
14.8091934.2%37.4%(-3.20)#16038.2%(-4.00)#9,270
15.8091732.8%37.4%(-4.60)#16938.2%(-5.40)#9,845
16.8092332.8%37.4%(-4.60)#17038.2%(-5.40)#9,847
17.8091832.7%37.4%(-4.70)#17138.2%(-5.50)#9,881
18.8091629.8%37.4%(-7.60)#19338.2%(-8.40)#10,972
19.8090928.3%37.4%(-9.10)#20138.2%(-9.90)#11,474
20.8090522.9%37.4%(-14.5)#21538.2%(-15.3)#12,643
21.8091320.4%37.4%(-17.0)#21838.2%(-17.8)#12,996

Common Questions

What are the Top 10 Zip Codes with the Highest Percentage of Population Taking Taxi / Cab to Work in Colorado Springs, CO?
Top 10 Zip Codes with the Highest Percentage of Population Taking Taxi / Cab to Work in Colorado Springs, CO are:
#1
52.0%
#2
50.3%
#3
49.7%
#4
49.5%
#5
48.0%
#6
47.1%
#7
46.9%
#8
46.5%
#9
45.2%
#10
44.6%
What zip code has the Highest Percentage of Population Taking Taxi / Cab to Work in Colorado Springs, CO?
80915 has the Highest Percentage of Population Taking Taxi / Cab to Work in Colorado Springs, CO with 52.0%.
What is the Percentage of Population Taking Taxi / Cab to Work in Colorado Springs, CO?
Percentage of Population Taking Taxi / Cab to Work in Colorado Springs is 36.8%.
What is the Percentage of Population Taking Taxi / Cab to Work in Colorado?
Percentage of Population Taking Taxi / Cab to Work in Colorado is 37.4%.
What is the Percentage of Population Taking Taxi / Cab to Work in the United States?
Percentage of Population Taking Taxi / Cab to Work in the United States is 38.2%.