Zip Codes with the Highest Percentage of Population with a Degree in Psychology in Colorado Springs, CO

RELATED REPORTS & OPTIONS

Psychology
Population
Families and Households
Female Fertility
Female Fertility (Unmarried)
Race (Community Size)
Race (Percentage)
Ancestry (Community Size)
AfghanAfricanAlaskan AthabascanAlbanianAlsatianAmericanApacheArabArapahoArgentineanArmenianAustralianAustrianBangladeshiBarbadianBasqueBelgianBelizeanBermudanBhutaneseBlackfeetBolivianBrazilianBritishBritish West IndianBulgarianBurmeseCajunCambodianCanadianCape VerdeanCarpatho RusynCelticCentral AmericanCentral American IndianCherokeeCheyenneChickasawChileanChineseChippewaChoctawColombianComancheCosta RicanCreeCreekCroatianCubanCzechCzechoslovakianDanishDelawareDominicanDutchEastern EuropeanEcuadorianEgyptianEnglishEstonianEthiopianEuropeanFilipinoFinnishFrenchFrench CanadianGermanGerman RussianGhanaianGreekGuamanian / ChamorroGuatemalanHaitianHonduranHopiHungarianIcelanderIndian (Asian)IndonesianInupiatIranianIraqiIrishIroquoisIsraeliItalianJamaicanJapaneseJordanianKenyanKoreanLaotianLatvianLebaneseLiberianLithuanianLuxembourgerMacedonianMalaysianMexicanMexican American IndianNative HawaiianNavajoNew ZealanderNicaraguanNigerianNorthern EuropeanNorwegianOkinawanOsagePakistaniPalestinianPanamanianPennsylvania GermanPeruvianPolishPortuguesePotawatomiPuebloPuerto RicanRomanianRussianSalvadoranSamoanScandinavianScotch-IrishScottishSeminoleSerbianShoshoneSiouxSlavicSlovakSloveneSomaliSouth AfricanSouth AmericanSouth American IndianSpaniardSpanishSpanish AmericanSpanish American IndianSri LankanSubsaharan AfricanSudaneseSwedishSwissSyrianThaiTohono O'OdhamTrinidadian and TobagonianTurkishUkrainianUteVenezuelanWelshWest IndianYaquiYugoslavian
Ancestry (Percentage)
AfghanAfricanAlaskan AthabascanAlbanianAlsatianAmericanApacheArabArapahoArgentineanArmenianAustralianAustrianBangladeshiBarbadianBasqueBelgianBelizeanBermudanBhutaneseBlackfeetBolivianBrazilianBritishBritish West IndianBulgarianBurmeseCajunCambodianCanadianCape VerdeanCarpatho RusynCelticCentral AmericanCentral American IndianCherokeeCheyenneChickasawChileanChineseChippewaChoctawColombianComancheCosta RicanCreeCreekCroatianCubanCzechCzechoslovakianDanishDelawareDominicanDutchEastern EuropeanEcuadorianEgyptianEnglishEstonianEthiopianEuropeanFilipinoFinnishFrenchFrench CanadianGermanGerman RussianGhanaianGreekGuamanian / ChamorroGuatemalanHaitianHonduranHopiHungarianIcelanderIndian (Asian)IndonesianInupiatIranianIraqiIrishIroquoisIsraeliItalianJamaicanJapaneseJordanianKenyanKoreanLaotianLatvianLebaneseLiberianLithuanianLuxembourgerMacedonianMalaysianMexicanMexican American IndianNative HawaiianNavajoNew ZealanderNicaraguanNigerianNorthern EuropeanNorwegianOkinawanOsagePakistaniPalestinianPanamanianPennsylvania GermanPeruvianPolishPortuguesePotawatomiPuebloPuerto RicanRomanianRussianSalvadoranSamoanScandinavianScotch-IrishScottishSeminoleSerbianShoshoneSiouxSlavicSlovakSloveneSomaliSouth AfricanSouth AmericanSouth American IndianSpaniardSpanishSpanish AmericanSpanish American IndianSri LankanSubsaharan AfricanSudaneseSwedishSwissSyrianThaiTohono O'OdhamTrinidadian and TobagonianTurkishUkrainianUteVenezuelanWelshWest IndianYaquiYugoslavian
Immigrant Origin (Total)
AfghanistanAfricaArgentinaArmeniaAsiaAustraliaAustriaBangladeshBarbadosBelarusBoliviaBosnia and HerzegovinaBrazilBulgariaBurma / MyanmarCambodiaCameroonCanadaCaribbeanCentral AmericaChileChinaColombiaCosta RicaCroatiaCubaCzechoslovakiaDenmarkDominican RepublicEastern AfricaEastern AsiaEastern EuropeEcuadorEgyptEl SalvadorEnglandEritreaEthiopiaEuropeFranceGermanyGhanaGuatemalaGuyanaHaitiHondurasHong KongHungaryIndiaIndonesiaIranIraqIrelandIsraelItalyJamaicaJapanKazakhstanKenyaKoreaLaosLatin AmericaLebanonLiberiaLithuaniaMexicoMiddle AfricaMoldovaNepalNetherlandsNicaraguaNigeriaNorth MacedoniaNorthern AfricaNorthern EuropeNorwayOceaniaPakistanPanamaPeruPhilippinesPolandRomaniaRussiaScotlandSingaporeSomaliaSouth AfricaSouth AmericaSouth Central AsiaSouth Eastern AsiaSouthern EuropeSpainSt. Vincent and the GrenadinesSwedenSwitzerlandSyriaTaiwanThailandTrinidad and TobagoTurkeyUgandaUkraineUzbekistanVenezuelaVietnamWest IndiesWestern AfricaWestern AsiaWestern EuropeZaireZimbabwe
Immigrant Origin (Percentage)
AfghanistanAfricaArgentinaArmeniaAsiaAustraliaAustriaBangladeshBarbadosBelarusBoliviaBosnia and HerzegovinaBrazilBulgariaBurma / MyanmarCambodiaCameroonCanadaCaribbeanCentral AmericaChileChinaColombiaCosta RicaCroatiaCubaCzechoslovakiaDenmarkDominican RepublicEastern AfricaEastern AsiaEastern EuropeEcuadorEgyptEl SalvadorEnglandEritreaEthiopiaEuropeFranceGermanyGhanaGuatemalaGuyanaHaitiHondurasHong KongHungaryIndiaIndonesiaIranIraqIrelandIsraelItalyJamaicaJapanKazakhstanKenyaKoreaLaosLatin AmericaLebanonLiberiaLithuaniaMexicoMiddle AfricaMoldovaNepalNetherlandsNicaraguaNigeriaNorth MacedoniaNorthern AfricaNorthern EuropeNorwayOceaniaPakistanPanamaPeruPhilippinesPolandRomaniaRussiaScotlandSingaporeSomaliaSouth AfricaSouth AmericaSouth Central AsiaSouth Eastern AsiaSouthern EuropeSpainSt. Vincent and the GrenadinesSwedenSwitzerlandSyriaTaiwanThailandTrinidad and TobagoTurkeyUgandaUkraineUzbekistanVenezuelaVietnamWest IndiesWestern AfricaWestern AsiaWestern EuropeZaireZimbabwe
Income
Income (Families)
Income (Households)
Poverty
Poverty (Families)
Unemployment
Employment Occupations
Employment Industries
Employer Class
Commute Time
Commute Means
School Enrollment
Education by Degree Field
Occupancy
Finances
Physical Characteristics
Colorado Springs
Compare Zip Codes
Comparison Subject

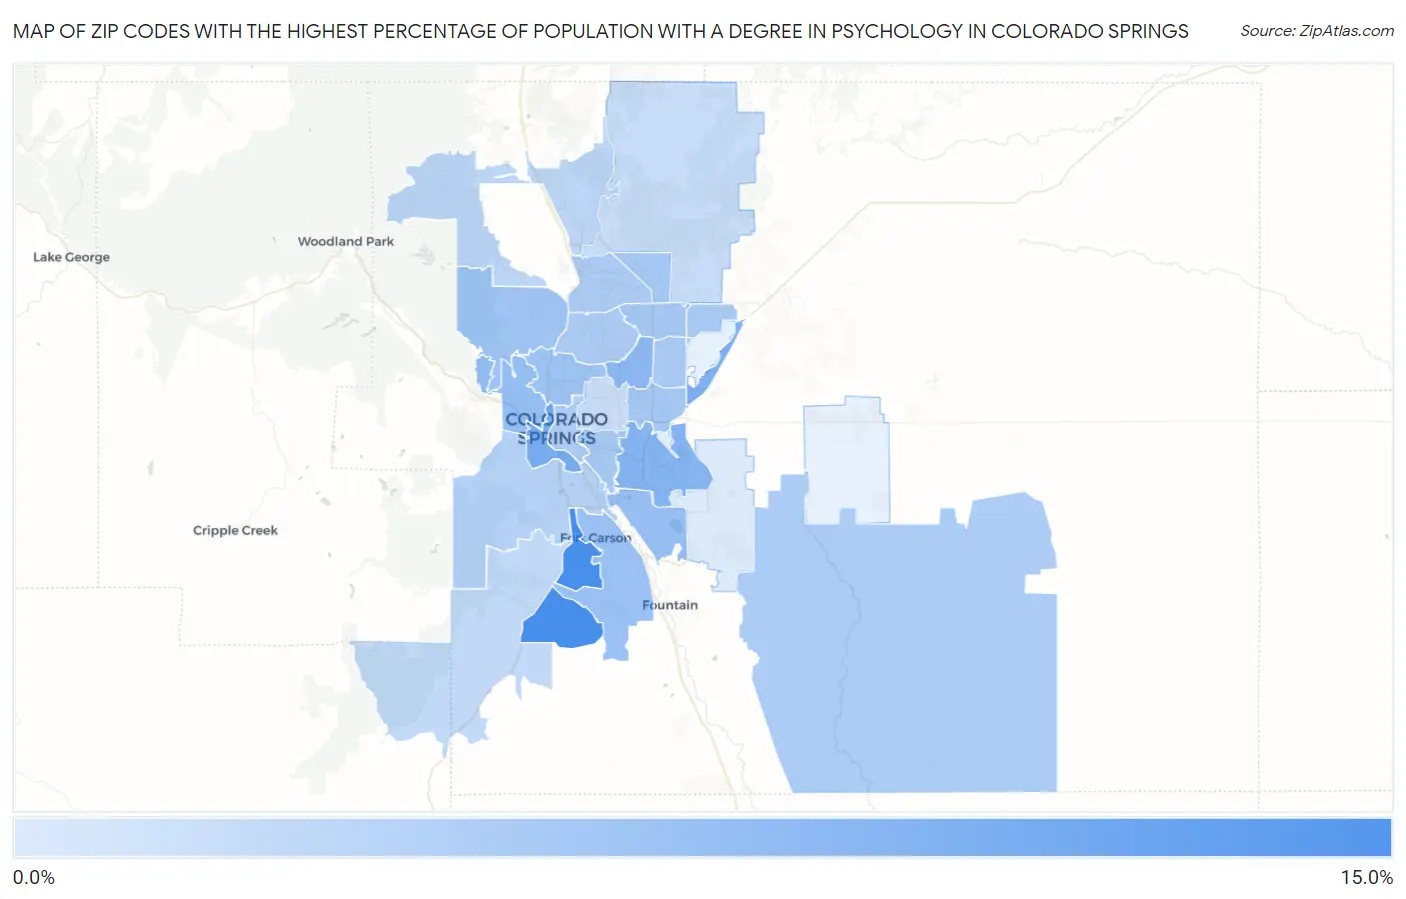
Map of Zip Codes with the Highest Percentage of Population with a Degree in Psychology in Colorado Springs

0.0%
15.0%
Zip Codes with the Highest Percentage of Population with a Degree in Psychology in Colorado Springs Map

Zip Codes with the Highest Percentage of Population with a Degree in Psychology in Colorado Springs, CO

Zip Code % Graduates vs State vs National
1.8090214.2%5.6%(+8.60)#235.1%(+9.11)#1,257
2.8090510.2%5.6%(+4.65)#425.1%(+5.17)#2,376
3.809519.5%5.6%(+3.92)#535.1%(+4.44)#2,785
4.809168.9%5.6%(+3.36)#585.1%(+3.88)#3,201
5.809178.5%5.6%(+2.91)#685.1%(+3.42)#3,630
6.809047.6%5.6%(+2.08)#825.1%(+2.60)#4,576
7.809117.5%5.6%(+1.93)#885.1%(+2.44)#4,830
8.809137.3%5.6%(+1.78)#935.1%(+2.29)#5,067
9.809077.0%5.6%(+1.48)#1065.1%(+2.00)#5,544
10.809196.8%5.6%(+1.27)#1135.1%(+1.78)#5,936
11.809236.5%5.6%(+0.951)#1295.1%(+1.47)#6,611
12.809156.5%5.6%(+0.883)#1335.1%(+1.40)#6,754
13.809246.4%5.6%(+0.805)#1365.1%(+1.32)#6,952
14.809106.2%5.6%(+0.668)#1475.1%(+1.18)#7,287
15.809276.2%5.6%(+0.604)#1525.1%(+1.12)#7,465
16.809226.1%5.6%(+0.531)#1585.1%(+1.05)#7,670
17.809286.0%5.6%(+0.392)#1655.1%(+0.909)#8,063
18.809185.9%5.6%(+0.287)#1755.1%(+0.804)#8,399
19.809205.8%5.6%(+0.259)#1775.1%(+0.776)#8,487
20.809035.8%5.6%(+0.228)#1795.1%(+0.745)#8,585
21.809065.1%5.6%(-0.458)#2245.1%(+0.059)#10,864
22.809214.6%5.6%(-0.943)#2495.1%(-0.426)#12,611
23.809264.2%5.6%(-1.33)#2745.1%(-0.811)#14,081
24.809083.8%5.6%(-1.76)#2925.1%(-1.25)#15,615
25.809093.6%5.6%(-1.99)#3015.1%(-1.47)#16,414
26.809252.2%5.6%(-3.40)#3505.1%(-2.89)#20,463

Common Questions

What are the Top 10 Zip Codes with the Highest Percentage of Population with a Degree in Psychology in Colorado Springs, CO?
Top 10 Zip Codes with the Highest Percentage of Population with a Degree in Psychology in Colorado Springs, CO are:
#1
14.2%
#2
10.2%
#3
9.5%
#4
8.9%
#5
8.5%
#6
7.6%
#7
7.5%
#8
7.3%
#9
7.0%
#10
6.8%
What zip code has the Highest Percentage of Population with a Degree in Psychology in Colorado Springs, CO?
80902 has the Highest Percentage of Population with a Degree in Psychology in Colorado Springs, CO with 14.2%.
What is the Percentage of Population with a Degree in Psychology in Colorado Springs, CO?
Percentage of Population with a Degree in Psychology in Colorado Springs is 6.3%.
What is the Percentage of Population with a Degree in Psychology in Colorado?
Percentage of Population with a Degree in Psychology in Colorado is 5.6%.
What is the Percentage of Population with a Degree in Psychology in the United States?
Percentage of Population with a Degree in Psychology in the United States is 5.1%.