Zip Codes with the Highest Population Density in Moraga, CA
On this page
RELATED REPORTS & OPTIONS
Highest Population Density
Population
Highest PopulationHighest Population DensityLowest Population DensityMale / Female RatioFemale / Male RatioOldest PopulationOldest Population | MaleOldest Population | FemaleYoungest PopulationYoungest Population | MaleYoungest Population | Female
Race (Community Size)
Race (Percentage)
Ancestry (Community Size)
AfricanAmericanBasqueBhutaneseBritishBurmeseCentral AmericanCroatianCzechDanishDutchEastern EuropeanEnglishEuropeanFrenchFrench CanadianGermanGreekGuamanian / ChamorroIndian (Asian)IrishIsraeliItalianKoreanMexicanNorwegianPeruvianPolishPuerto RicanSalvadoranSamoanScottishSouth AmericanSri LankanSubsaharan AfricanSwedishSwissThaiWelsh
Ancestry (Percentage)
AfricanAmericanBasqueBhutaneseBritishBurmeseCentral AmericanCroatianCzechDanishDutchEastern EuropeanEnglishEuropeanFrenchFrench CanadianGermanGreekGuamanian / ChamorroIndian (Asian)IrishIsraeliItalianKoreanMexicanNorwegianPeruvianPolishPuerto RicanSalvadoranSamoanScottishSouth AmericanSri LankanSubsaharan AfricanSwedishSwissThaiWelsh
Immigrant Origin (Total)
AfricaAsiaCameroonCanadaCentral AmericaChinaEastern AsiaEuropeGermanyItalyKoreaLatin AmericaMiddle AfricaPhilippinesSouth Central AsiaSouth Eastern AsiaSouthern EuropeWestern Europe
Immigrant Origin (Percentage)
AfricaAsiaCameroonCanadaCentral AmericaChinaEastern AsiaEuropeGermanyItalyKoreaLatin AmericaMiddle AfricaPhilippinesSouth Central AsiaSouth Eastern AsiaSouthern EuropeWestern Europe
Income
Highest Per Capita IncomeHighest Earnings | MaleHighest Earnings | FemaleHighest Wage/Income Gap ($)Highest Wage/Income Gap (%)Lowest Per Capita IncomeLowest Earnings | MaleLowest Earnings | FemaleLowest Wage/Income Gap ($)Lowest Wage/Income Gap (%)
Poverty
Highest PovertyHighest Poverty | MaleHighest Poverty | Seniors 65+Highest Poverty | Seniors 75+ Lowest PovertyLowest Poverty | MaleLowest Poverty | Seniors 65+Lowest Poverty | Seniors 75+
Unemployment
Highest UnemploymentHighest Unemployment | MaleHighest Unemployment | FemaleHighest Unemployment | Youth < 25Lowest UnemploymentLowest Unemployment | MaleLowest Unemployment | FemaleLowest Unemployment | Youth < 25
Employment Occupations
Arts, Media & EntertainmentCommunity & Social Service Computer & MathematicsComputer, Engineering & ScienceEducation Instruction & LibraryFirefighting & PreventionFood Preparation & ServingLaw EnforcementManagementMaterial MovingOffice & AdministrationPersonal Care and ServiceSales & RelatedSecurity & ProtectionTransportation
Employment Industries
Accommodation & Food ServicesArts, Entertainment & RecreationEducational ServicesHealth Care & Social AssistanceProfessional & Scientific ServicesPublic AdministrationRetail TradeTransportation & Warehousing
Employer Class
Private Company EmployeesSelf-Employed / Not IncorporatedNot-for-profit OrganizationsLocal Government EmployeesState Government EmployeesFederal Government Employees
Commute Time
Longest CommuteLongest Commute | MaleLongest Commute | FemaleShortest CommuteShortest Commute | MaleShortest Commute | Female
Commute Means
School Enrollment
Education by Degree Field
Moraga
States
AlabamaAlaskaArizonaArkansasCaliforniaColoradoConnecticutDelawareDistrict Of ColumbiaFloridaGeorgiaHawaiiIdahoIllinoisIndianaIowaKansasKentuckyLouisianaMaineMarylandMassachusettsMichiganMinnesotaMississippiMissouriMontanaNebraskaNevadaNew HampshireNew JerseyNew MexicoNew YorkNorth CarolinaNorth DakotaOhioOklahomaOregonPennsylvaniaPuerto RicoRhode IslandSouth CarolinaSouth DakotaTennesseeTexasUtahVermontVirginiaWashingtonWest VirginiaWisconsinWyoming
California Cities
AlamedaAlhambraAnaheimAntiochApple ValleyArcadiaAuburnBakersfieldBerkeleyBeverly HillsBreaBuena ParkBurbankCamarilloCanoga ParkCanyon CountryCarlsbadCarsonCastro ValleyChicoChinoChula VistaCitrus HeightsClovisComptonConcordCoronaCosta MesaCovinaCulver CityDaly CityDanvilleDavisDesert Hot SpringsDowneyDuarteEdwardsEl CajonEl MonteElk GroveEncinoEscondidoEurekaFairfieldFontanaFremontFresnoFullertonGarden GroveGardenaGlendaleGlendoraGrass ValleyHaywardHemetHesperiaHuntington BeachIndioInglewoodIrvineLa JollaLa MesaLa MiradaLa PuenteLake ElsinoreLakewoodLancasterLemooreLivermoreLodiLoma LindaLompocLong BeachLos AltosLos AngelesLos GatosMaderaMalibuMantecaMenifeeMercedMission ViejoModestoMontereyMonterey ParkMoragaMoreno ValleyMountain ViewMurrietaNapaNewport BeachNorth HollywoodNorthridgeNovatoOaklandOceansideOntarioOrangeOrovilleOxnardPalm DesertPalm SpringsPalmdalePalo AltoPasadenaPerrisPetalumaPleasantonPomonaPortervilleRancho CordovaRancho CucamongaRancho Santa FeReddingRedlandsRedondo BeachRedwood CityRialtoRichmondRiversideRocklinRosevilleSacramentoSalinasSan BernardinoSan ClementeSan DiegoSan FranciscoSan GabrielSan JacintoSan JoseSan LeandroSan Luis ObispoSan MarcosSan MateoSan PedroSan RafaelSan RamonSanta AnaSanta BarbaraSanta ClaraSanta ClaritaSanta CruzSanta MariaSanta MonicaSanta RosaSherman OaksSimi ValleySpring ValleyStocktonSunnyvaleTehachapiTemeculaThousand OaksTorranceTrabuco CanyonTracyTurlockTustinTwentynine PalmsUplandVacavilleValenciaVallejoVan NuysVenturaVictorvilleVisaliaVistaWalnut CreekWest CovinaWest SacramentoWhittierWoodlandWoodland HillsYorba LindaYuba City
Compare Zip Codes
Comparison Subject
Compare StatesCompare CitiesCompare Zip Codes
Map of Zip Codes with the Highest Population Density in Moraga
824.1
6,213.6
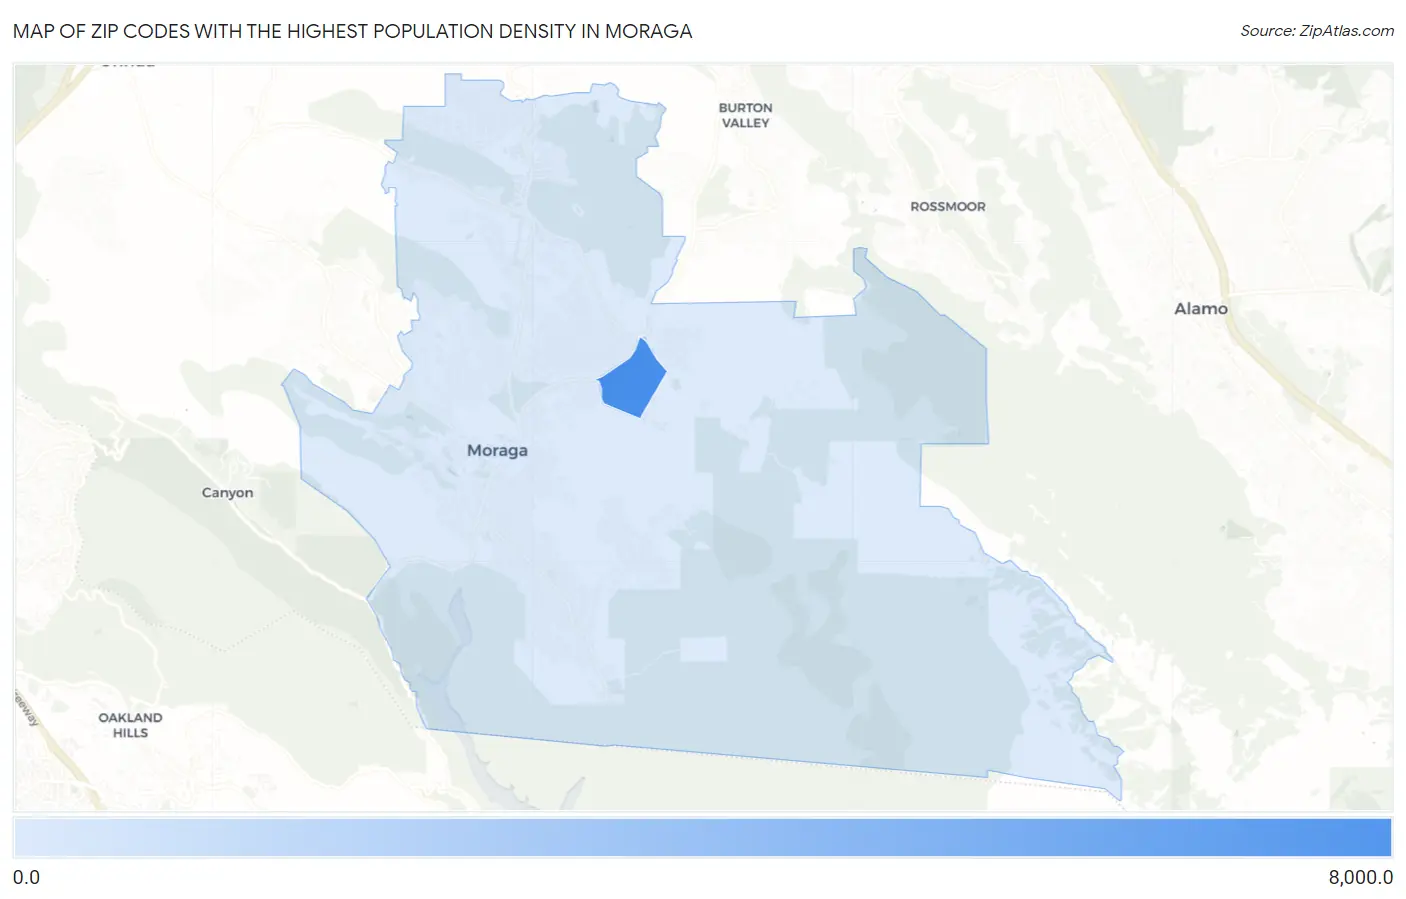
Zip Codes with the Highest Population Density in Moraga, CA
| Zip Code | People / Sq Mi | vs State | vs National | |
| 1. | 94575 | 6,213.6 | 252.7(+5.96k)#351 | 0.0(+6.21k)#1,455 |
| 2. | 94556 | 824.1 | 252.7(+571)#874 | 0.0(+824)#7,741 |
1
Common Questions
What are the Top Zip Codes with the Highest Population Density in Moraga, CA?
Top Zip Codes with the Highest Population Density in Moraga, CA are:
What zip code has the Highest Population Density in Moraga, CA?
94575 has the Highest Population Density in Moraga, CA with 6,213.6.
What is the Population Density in Moraga, CA?
Population Density in Moraga is 1,781.3.
What is the Population Density in California?
Population Density in California is 252.7.