Zip Codes with the Most Immigrants from Middle Africa in Moraga, CA
RELATED REPORTS & OPTIONS
Middle Africa
Moraga
Compare Zip Codes
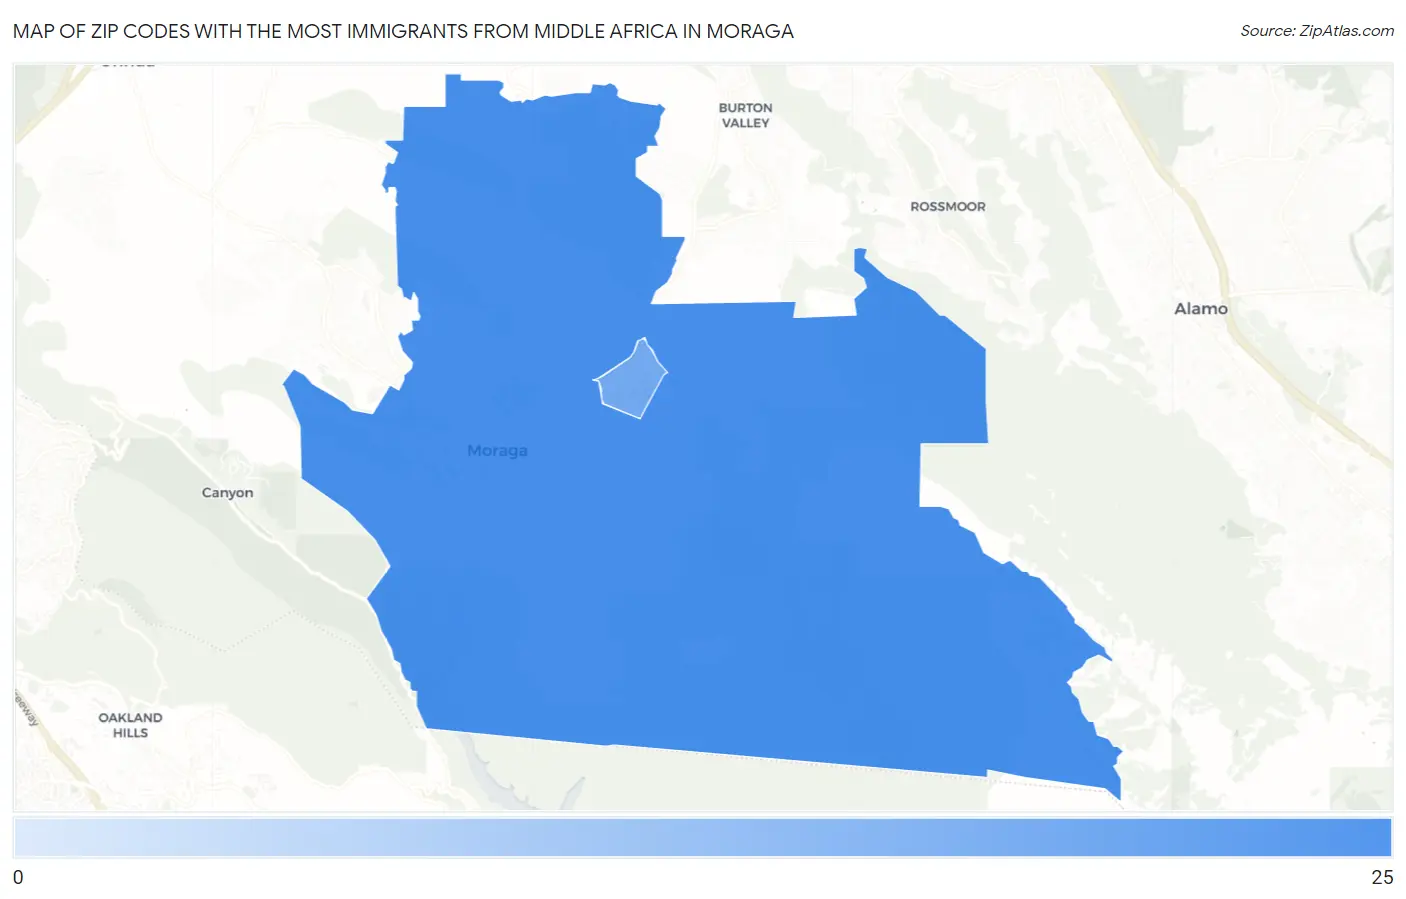
Map of Zip Codes with the Most Immigrants from Middle Africa in Moraga
9
24
Zip Codes with the Most Immigrants from Middle Africa in Moraga, CA
| Zip Code | Middle Africa | vs State | vs National | |
| 1. | 94556 | 24 | 7,302(0.33%)#90 | 193,874(0.01%)#1,454 |
| 2. | 94575 | 9 | 7,302(0.12%)#172 | 193,874(0.00%)#2,147 |
1
Common Questions
What are the Top Zip Codes with the Most Immigrants from Middle Africa in Moraga, CA?
Top Zip Codes with the Most Immigrants from Middle Africa in Moraga, CA are:
What zip code has the Most Immigrants from Middle Africa in Moraga, CA?
94556 has the Most Immigrants from Middle Africa in Moraga, CA with 24.
What is the Total Immigrants from Middle Africa in Moraga, CA?
Total Immigrants from Middle Africa in Moraga is 33.
What is the Total Immigrants from Middle Africa in California?
Total Immigrants from Middle Africa in California is 7,302.
What is the Total Immigrants from Middle Africa in the United States?
Total Immigrants from Middle Africa in the United States is 193,874.