Chinook, WA Map & Demographics
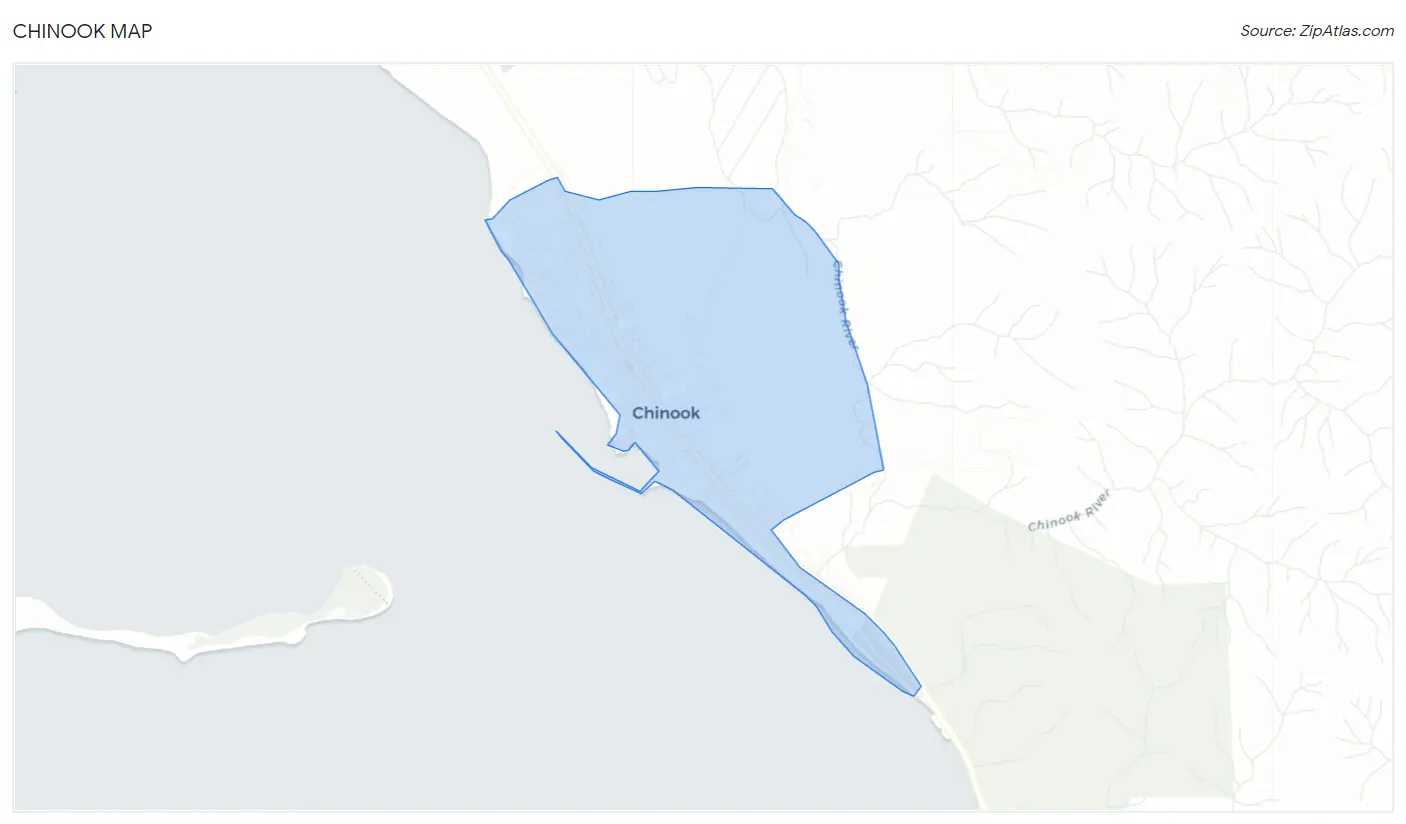
Chinook Map
Chinook Overview
$89,261
PER CAPITA INCOME
$100,469
AVG FAMILY INCOME
$86,731
AVG HOUSEHOLD INCOME
74.3%
WAGE / INCOME GAP [ % ]
25.7¢/ $1
WAGE / INCOME GAP [ $ ]
0.52
INEQUALITY / GINI INDEX
447
TOTAL POPULATION
208
MALE POPULATION
239
FEMALE POPULATION
87.03
MALES / 100 FEMALES
114.90
FEMALES / 100 MALES
54.3
MEDIAN AGE
2.4
AVG FAMILY SIZE
1.9
AVG HOUSEHOLD SIZE
235
LABOR FORCE [ PEOPLE ]
59.5%
PERCENT IN LABOR FORCE
Chinook Zip Codes
Chinook Area Codes
Income in Chinook
Income Overview in Chinook
Per Capita Income in Chinook is $89,261, while median incomes of families and households are $100,469 and $86,731 respectively.
| Characteristic | Number | Measure |
| Per Capita Income | 447 | $89,261 |
| Median Family Income | 110 | $100,469 |
| Mean Family Income | 110 | $85,053 |
| Median Household Income | 240 | $86,731 |
| Mean Household Income | 240 | $169,802 |
| Income Deficit | 110 | $0 |
| Wage / Income Gap (%) | 447 | 74.28% |
| Wage / Income Gap ($) | 447 | 25.72¢ per $1 |
| Gini / Inequality Index | 447 | 0.52 |
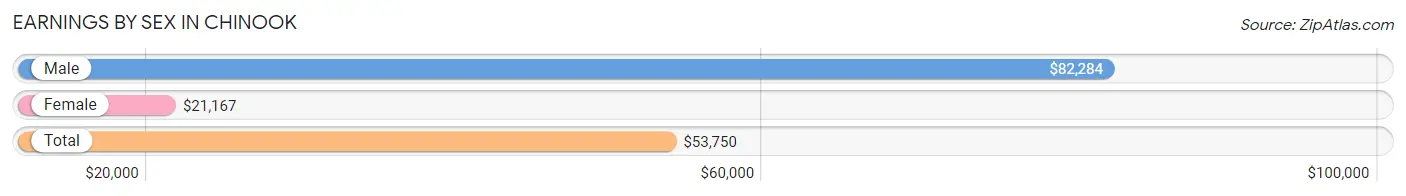
Earnings by Sex in Chinook
Average Earnings in Chinook are $53,750, $82,284 for men and $21,167 for women, a difference of 74.3%.
| Sex | Number | Average Earnings |
| Male | 157 (66.8%) | $82,284 |
| Female | 78 (33.2%) | $21,167 |
| Total | 235 (100.0%) | $53,750 |
Earnings by Sex by Income Bracket in Chinook
The most common earnings brackets in Chinook are $100,000+ for men (76 | 48.4%) and $20,000 to $22,499 for women (30 | 38.5%).
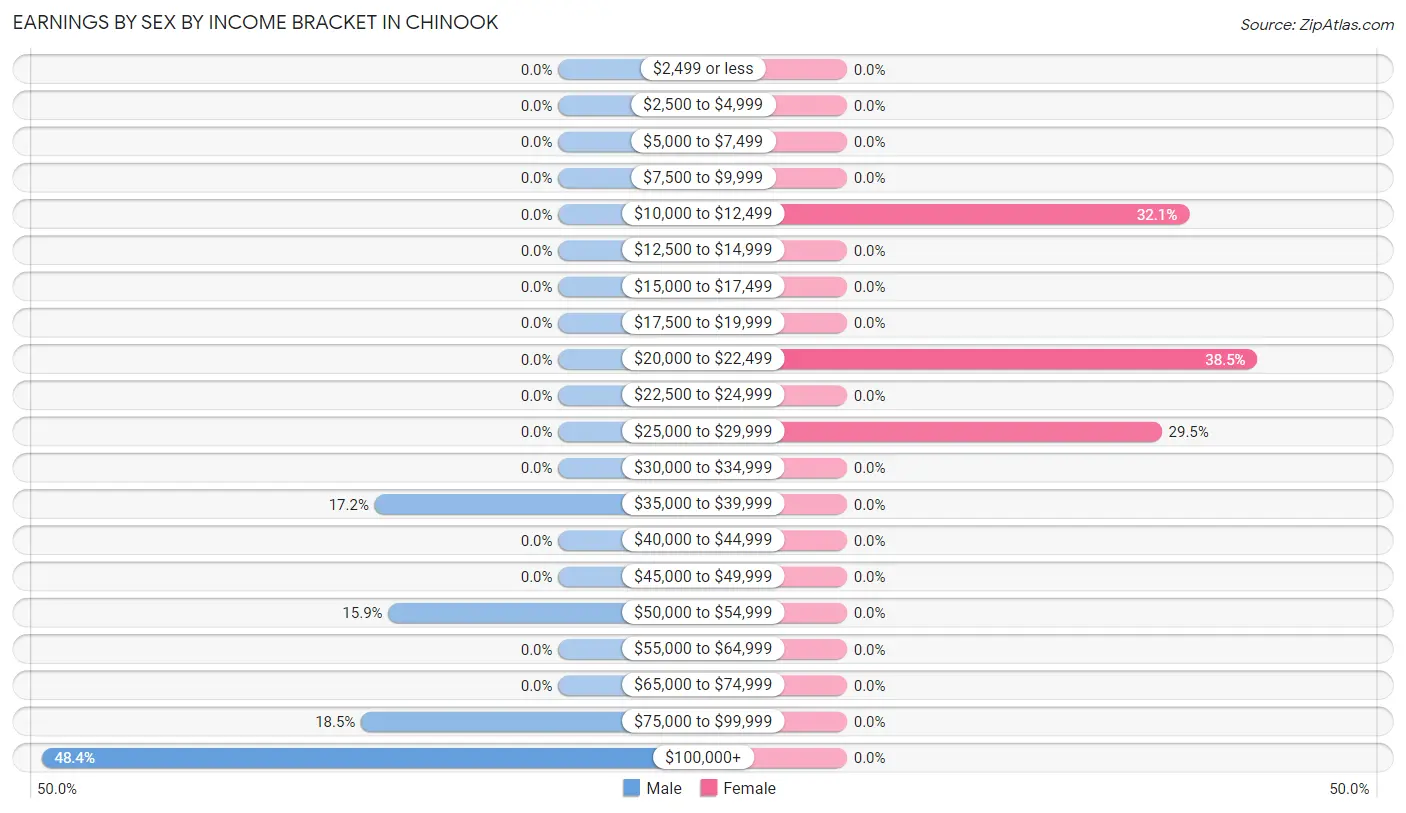
| Income | Male | Female |
| $2,499 or less | 0 (0.0%) | 0 (0.0%) |
| $2,500 to $4,999 | 0 (0.0%) | 0 (0.0%) |
| $5,000 to $7,499 | 0 (0.0%) | 0 (0.0%) |
| $7,500 to $9,999 | 0 (0.0%) | 0 (0.0%) |
| $10,000 to $12,499 | 0 (0.0%) | 25 (32.1%) |
| $12,500 to $14,999 | 0 (0.0%) | 0 (0.0%) |
| $15,000 to $17,499 | 0 (0.0%) | 0 (0.0%) |
| $17,500 to $19,999 | 0 (0.0%) | 0 (0.0%) |
| $20,000 to $22,499 | 0 (0.0%) | 30 (38.5%) |
| $22,500 to $24,999 | 0 (0.0%) | 0 (0.0%) |
| $25,000 to $29,999 | 0 (0.0%) | 23 (29.5%) |
| $30,000 to $34,999 | 0 (0.0%) | 0 (0.0%) |
| $35,000 to $39,999 | 27 (17.2%) | 0 (0.0%) |
| $40,000 to $44,999 | 0 (0.0%) | 0 (0.0%) |
| $45,000 to $49,999 | 0 (0.0%) | 0 (0.0%) |
| $50,000 to $54,999 | 25 (15.9%) | 0 (0.0%) |
| $55,000 to $64,999 | 0 (0.0%) | 0 (0.0%) |
| $65,000 to $74,999 | 0 (0.0%) | 0 (0.0%) |
| $75,000 to $99,999 | 29 (18.5%) | 0 (0.0%) |
| $100,000+ | 76 (48.4%) | 0 (0.0%) |
| Total | 157 (100.0%) | 78 (100.0%) |
Earnings by Sex by Educational Attainment in Chinook
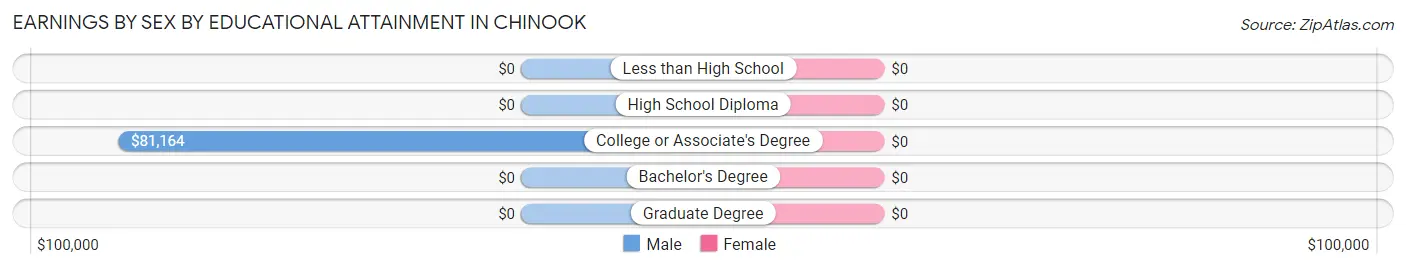
| Educational Attainment | Male Income | Female Income |
| Less than High School | - | - |
| High School Diploma | - | - |
| College or Associate's Degree | $81,164 | $0 |
| Bachelor's Degree | - | - |
| Graduate Degree | - | - |
| Total | $82,284 | $21,167 |
Family Income in Chinook
Family Income Brackets in Chinook
According to the Chinook family income data, there are 61 families falling into the $100,000 to $149,999 income range, which is the most common income bracket and makes up 55.4% of all families.
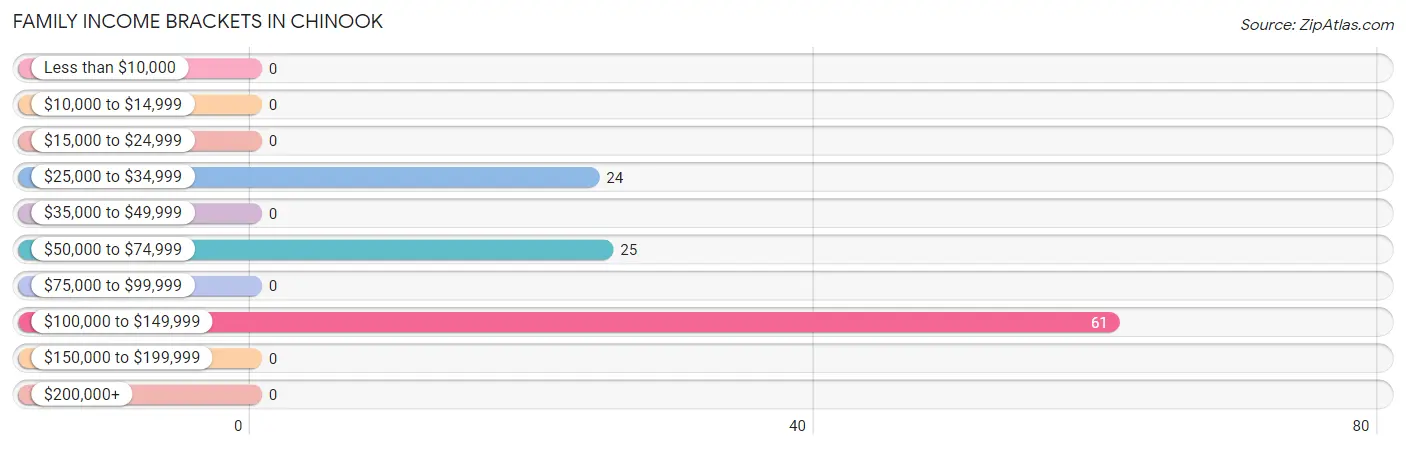
| Income Bracket | # Families | % Families |
| Less than $10,000 | 0 | 0.0% |
| $10,000 to $14,999 | 0 | 0.0% |
| $15,000 to $24,999 | 0 | 0.0% |
| $25,000 to $34,999 | 24 | 21.8% |
| $35,000 to $49,999 | 0 | 0.0% |
| $50,000 to $74,999 | 25 | 22.7% |
| $75,000 to $99,999 | 0 | 0.0% |
| $100,000 to $149,999 | 61 | 55.5% |
| $150,000 to $199,999 | 0 | 0.0% |
| $200,000+ | 0 | 0.0% |
Family Income by Famaliy Size in Chinook
| Income Bracket | # Families | Median Income |
| 2-Person Families | 78 (70.9%) | $0 |
| 3-Person Families | 0 (0.0%) | $0 |
| 4-Person Families | 32 (29.1%) | $0 |
| 5-Person Families | 0 (0.0%) | $0 |
| 6-Person Families | 0 (0.0%) | $0 |
| 7+ Person Families | 0 (0.0%) | $0 |
| Total | 110 (100.0%) | $100,469 |
Family Income by Number of Earners in Chinook
| Number of Earners | # Families | Median Income |
| No Earners | 24 (21.8%) | $0 |
| 1 Earner | 32 (29.1%) | $0 |
| 2 Earners | 54 (49.1%) | $0 |
| 3+ Earners | 0 (0.0%) | $0 |
| Total | 110 (100.0%) | $100,469 |
Household Income in Chinook
Household Income Brackets in Chinook
With 61 households falling in the category, the $100,000 to $149,999 income range is the most frequent in Chinook, accounting for 25.4% of all households.
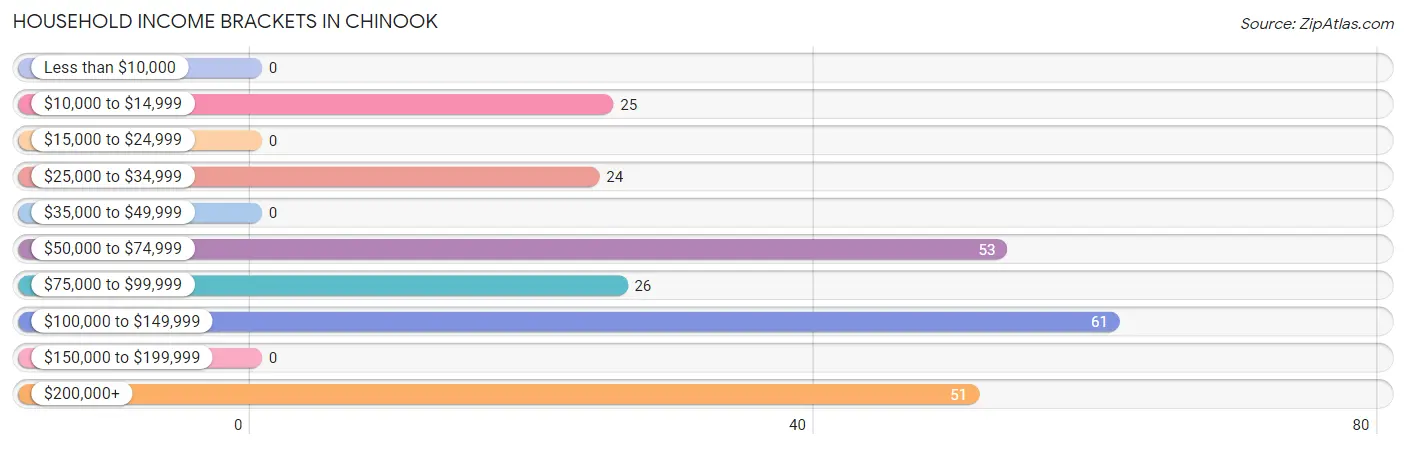
| Income Bracket | # Households | % Households |
| Less than $10,000 | 0 | 0.0% |
| $10,000 to $14,999 | 25 | 10.4% |
| $15,000 to $24,999 | 0 | 0.0% |
| $25,000 to $34,999 | 24 | 10.0% |
| $35,000 to $49,999 | 0 | 0.0% |
| $50,000 to $74,999 | 53 | 22.1% |
| $75,000 to $99,999 | 26 | 10.8% |
| $100,000 to $149,999 | 61 | 25.4% |
| $150,000 to $199,999 | 0 | 0.0% |
| $200,000+ | 51 | 21.3% |
Household Income by Householder Age in Chinook
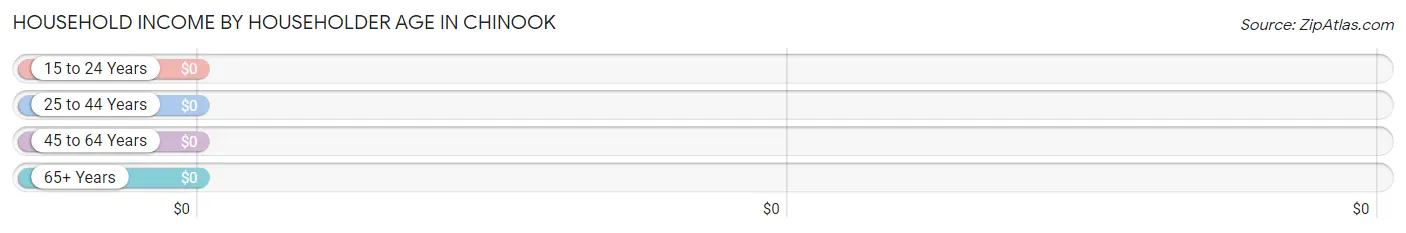
| Income Bracket | # Households | Median Income |
| 15 to 24 Years | 0 (0.0%) | $0 |
| 25 to 44 Years | 32 (13.3%) | $0 |
| 45 to 64 Years | 105 (43.8%) | $0 |
| 65+ Years | 103 (42.9%) | $0 |
| Total | 240 (100.0%) | $86,731 |
Poverty in Chinook
Income Below Poverty by Sex and Age in Chinook
| Age Bracket | Male | Female |
| Under 5 Years | 0 (0.0%) | 0 (0.0%) |
| 5 Years | 0 (0.0%) | 0 (0.0%) |
| 6 to 11 Years | 0 (0.0%) | 0 (0.0%) |
| 12 to 14 Years | 0 (0.0%) | 0 (0.0%) |
| 15 Years | 0 (0.0%) | 0 (0.0%) |
| 16 and 17 Years | 0 (0.0%) | 0 (0.0%) |
| 18 to 24 Years | 0 (0.0%) | 0 (0.0%) |
| 25 to 34 Years | 0 (0.0%) | 0 (0.0%) |
| 35 to 44 Years | 0 (0.0%) | 0 (0.0%) |
| 45 to 54 Years | 0 (0.0%) | 0 (0.0%) |
| 55 to 64 Years | 0 (0.0%) | 0 (0.0%) |
| 65 to 74 Years | 0 (0.0%) | 0 (0.0%) |
| 75 Years and over | 0 (0.0%) | 0 (0.0%) |
| Total | 0 (0.0%) | 0 (0.0%) |
Income Above Poverty by Sex and Age in Chinook
According to the poverty statistics in Chinook, males aged 45 to 54 years and females aged under 5 years are the age groups that are most secure financially, with 100.0% of males and 100.0% of females in these age groups living above the poverty line.
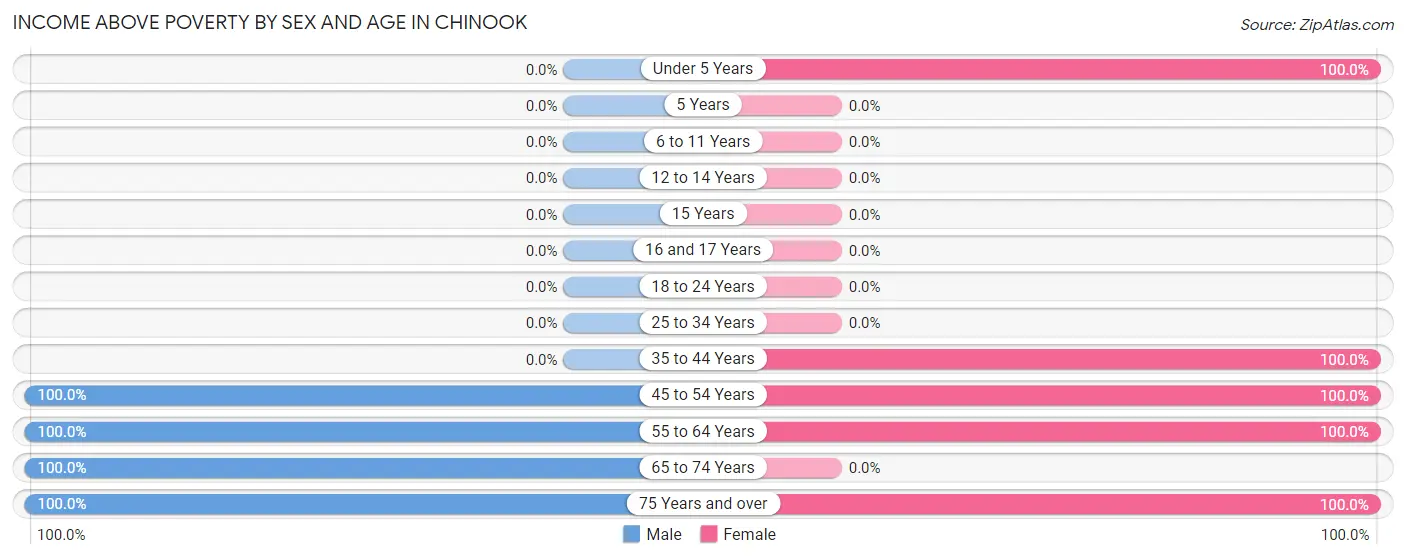
| Age Bracket | Male | Female |
| Under 5 Years | 0 (0.0%) | 52 (100.0%) |
| 5 Years | 0 (0.0%) | 0 (0.0%) |
| 6 to 11 Years | 0 (0.0%) | 0 (0.0%) |
| 12 to 14 Years | 0 (0.0%) | 0 (0.0%) |
| 15 Years | 0 (0.0%) | 0 (0.0%) |
| 16 and 17 Years | 0 (0.0%) | 0 (0.0%) |
| 18 to 24 Years | 0 (0.0%) | 0 (0.0%) |
| 25 to 34 Years | 0 (0.0%) | 0 (0.0%) |
| 35 to 44 Years | 0 (0.0%) | 32 (100.0%) |
| 45 to 54 Years | 103 (100.0%) | 55 (100.0%) |
| 55 to 64 Years | 54 (100.0%) | 23 (100.0%) |
| 65 to 74 Years | 25 (100.0%) | 0 (0.0%) |
| 75 Years and over | 26 (100.0%) | 77 (100.0%) |
| Total | 208 (100.0%) | 239 (100.0%) |
Income Below Poverty Among Married-Couple Families in Chinook
| Children | Above Poverty | Below Poverty |
| No Children | 78 (100.0%) | 0 (0.0%) |
| 1 or 2 Children | 32 (100.0%) | 0 (0.0%) |
| 3 or 4 Children | 0 (0.0%) | 0 (0.0%) |
| 5 or more Children | 0 (0.0%) | 0 (0.0%) |
| Total | 110 (100.0%) | 0 (0.0%) |
Income Below Poverty Among Single-Parent Households in Chinook
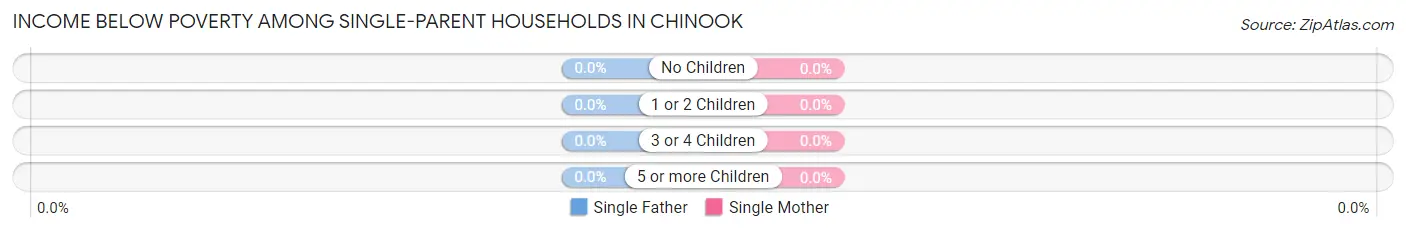
| Children | Single Father | Single Mother |
| No Children | 0 (0.0%) | 0 (0.0%) |
| 1 or 2 Children | 0 (0.0%) | 0 (0.0%) |
| 3 or 4 Children | 0 (0.0%) | 0 (0.0%) |
| 5 or more Children | 0 (0.0%) | 0 (0.0%) |
| Total | 0 (0.0%) | 0 (0.0%) |
Income Below Poverty Among Married-Couple vs Single-Parent Households in Chinook
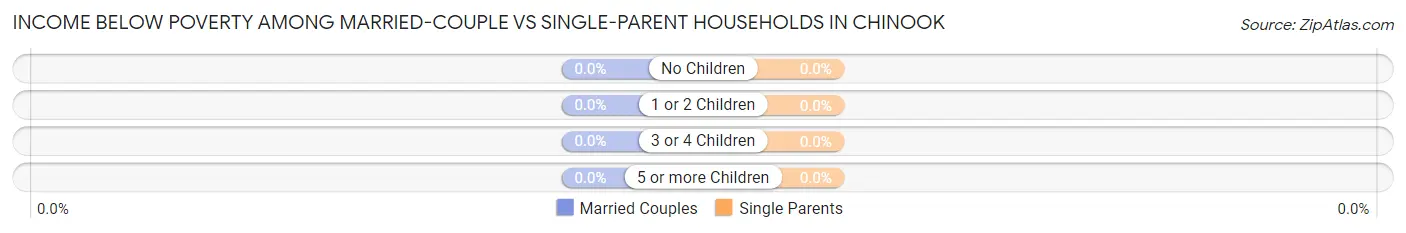
| Children | Married-Couple Families | Single-Parent Households |
| No Children | 0 (0.0%) | 0 (0.0%) |
| 1 or 2 Children | 0 (0.0%) | 0 (0.0%) |
| 3 or 4 Children | 0 (0.0%) | 0 (0.0%) |
| 5 or more Children | 0 (0.0%) | 0 (0.0%) |
| Total | 0 (0.0%) | 0 (0.0%) |
Race in Chinook
The most populous races in Chinook are , and White / Caucasian (447 | 100.0%).
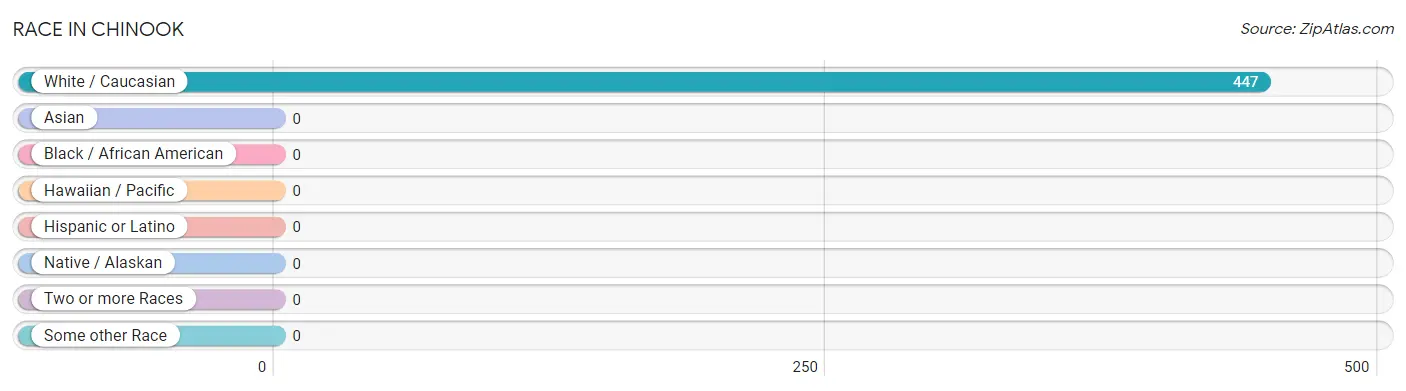
| Race | # Population | % Population |
| Asian | 0 | 0.0% |
| Black / African American | 0 | 0.0% |
| Hawaiian / Pacific | 0 | 0.0% |
| Hispanic or Latino | 0 | 0.0% |
| Native / Alaskan | 0 | 0.0% |
| White / Caucasian | 447 | 100.0% |
| Two or more Races | 0 | 0.0% |
| Some other Race | 0 | 0.0% |
| Total | 447 | 100.0% |
Ancestry in Chinook
The most populous ancestries reported in Chinook are English (82 | 18.3%), Swedish (51 | 11.4%), Scandinavian (49 | 11.0%), German (47 | 10.5%), and Welsh (32 | 7.2%), together accounting for 58.4% of all Chinook residents.
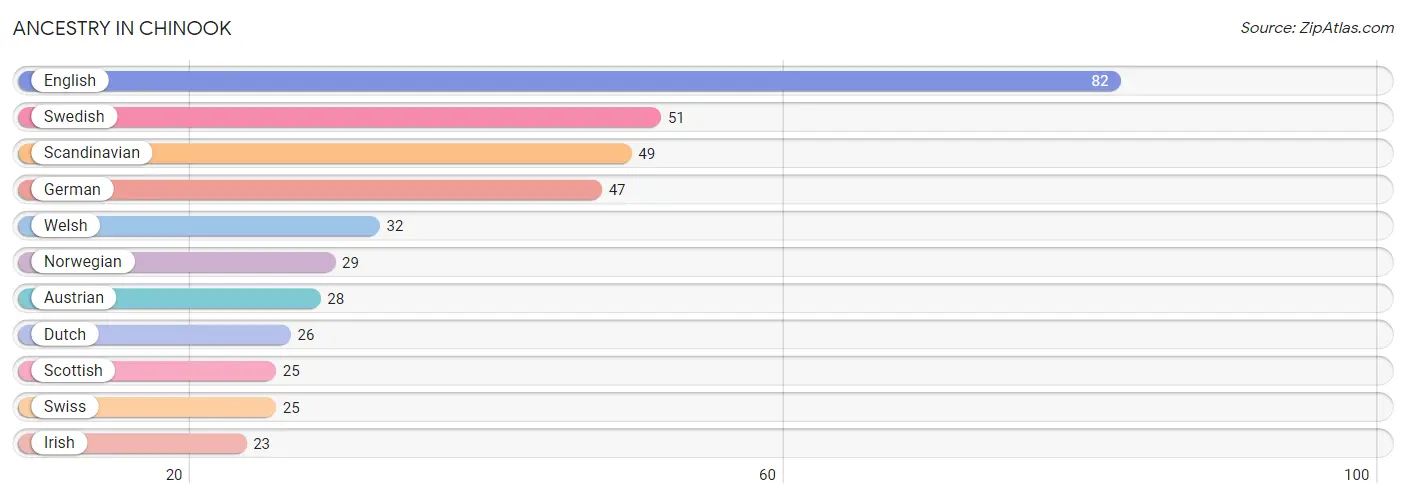
| Ancestry | # Population | % Population |
| Austrian | 28 | 6.3% |
| Dutch | 26 | 5.8% |
| English | 82 | 18.3% |
| German | 47 | 10.5% |
| Irish | 23 | 5.1% |
| Norwegian | 29 | 6.5% |
| Scandinavian | 49 | 11.0% |
| Scottish | 25 | 5.6% |
| Swedish | 51 | 11.4% |
| Swiss | 25 | 5.6% |
| Welsh | 32 | 7.2% | View All 11 Rows |
Immigrants in Chinook

| Immigration Origin | # Population | % Population | View All 0 Rows |
Sex and Age in Chinook
Sex and Age in Chinook
The most populous age groups in Chinook are 50 to 54 Years (78 | 37.5%) for men and 75 to 79 Years (77 | 32.2%) for women.
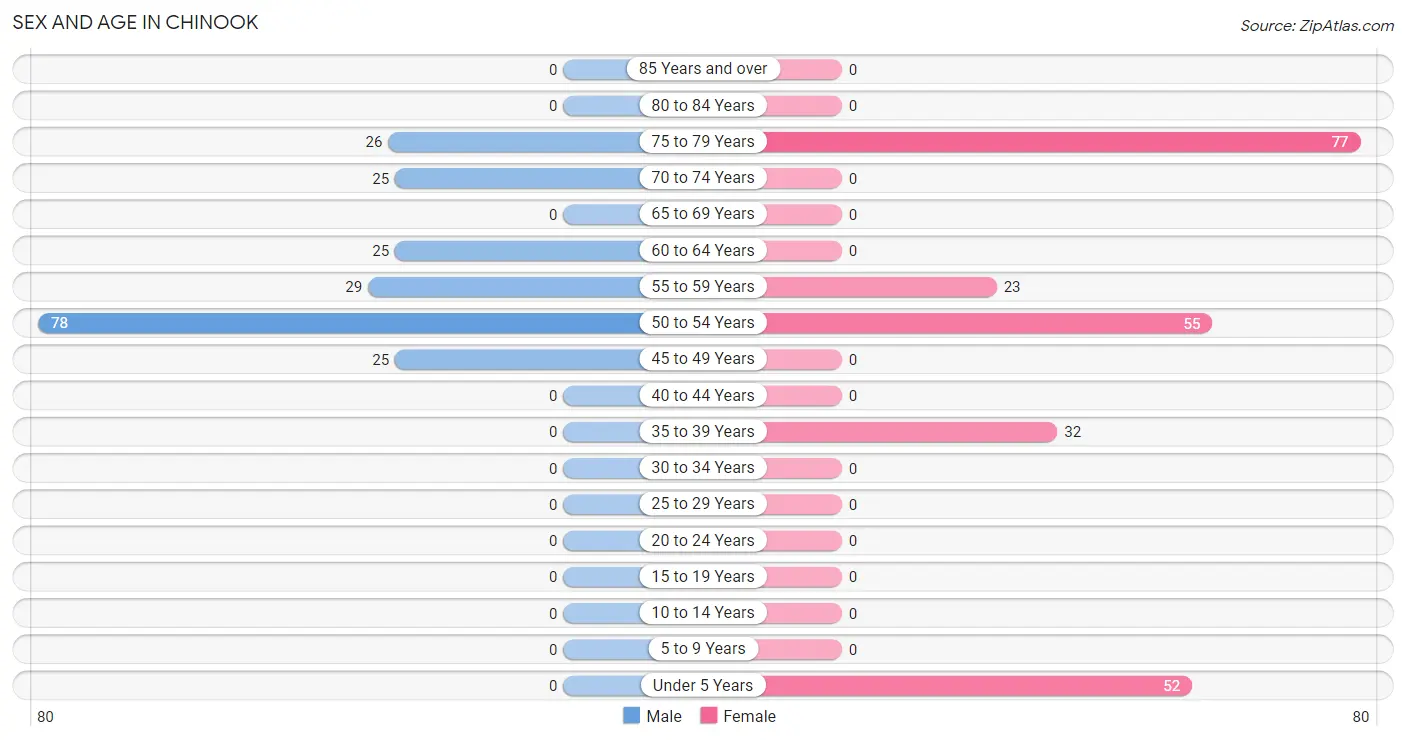
| Age Bracket | Male | Female |
| Under 5 Years | 0 (0.0%) | 52 (21.8%) |
| 5 to 9 Years | 0 (0.0%) | 0 (0.0%) |
| 10 to 14 Years | 0 (0.0%) | 0 (0.0%) |
| 15 to 19 Years | 0 (0.0%) | 0 (0.0%) |
| 20 to 24 Years | 0 (0.0%) | 0 (0.0%) |
| 25 to 29 Years | 0 (0.0%) | 0 (0.0%) |
| 30 to 34 Years | 0 (0.0%) | 0 (0.0%) |
| 35 to 39 Years | 0 (0.0%) | 32 (13.4%) |
| 40 to 44 Years | 0 (0.0%) | 0 (0.0%) |
| 45 to 49 Years | 25 (12.0%) | 0 (0.0%) |
| 50 to 54 Years | 78 (37.5%) | 55 (23.0%) |
| 55 to 59 Years | 29 (13.9%) | 23 (9.6%) |
| 60 to 64 Years | 25 (12.0%) | 0 (0.0%) |
| 65 to 69 Years | 0 (0.0%) | 0 (0.0%) |
| 70 to 74 Years | 25 (12.0%) | 0 (0.0%) |
| 75 to 79 Years | 26 (12.5%) | 77 (32.2%) |
| 80 to 84 Years | 0 (0.0%) | 0 (0.0%) |
| 85 Years and over | 0 (0.0%) | 0 (0.0%) |
| Total | 208 (100.0%) | 239 (100.0%) |
Families and Households in Chinook
Median Family Size in Chinook
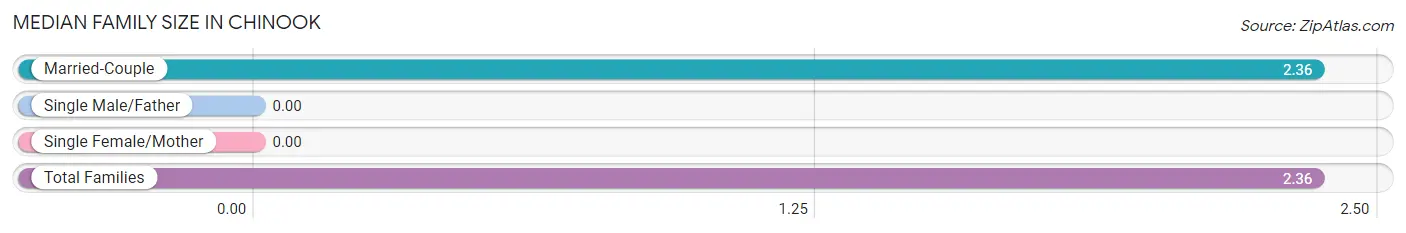
| Family Type | # Families | Family Size |
| Married-Couple | 110 (100.0%) | 2.36 |
| Single Male/Father | 0 (0.0%) | - |
| Single Female/Mother | 0 (0.0%) | - |
| Total Families | 110 (100.0%) | 2.36 |
Median Household Size in Chinook
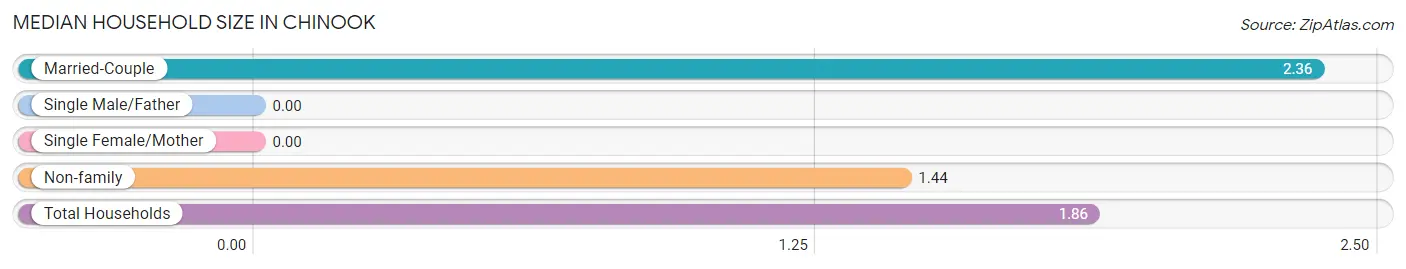
| Household Type | # Households | Household Size |
| Married-Couple | 110 (45.8%) | 2.36 |
| Single Male/Father | 0 (0.0%) | - |
| Single Female/Mother | 0 (0.0%) | - |
| Non-family | 130 (54.2%) | 1.44 |
| Total Households | 240 (100.0%) | 1.86 |
Household Size by Marriage Status in Chinook
Out of a total of 240 households in Chinook, 110 (45.8%) are family households, while 130 (54.2%) are nonfamily households. The most numerous type of family households are 2-person households, comprising 78, and the most common type of nonfamily households are 1-person households, comprising 104.
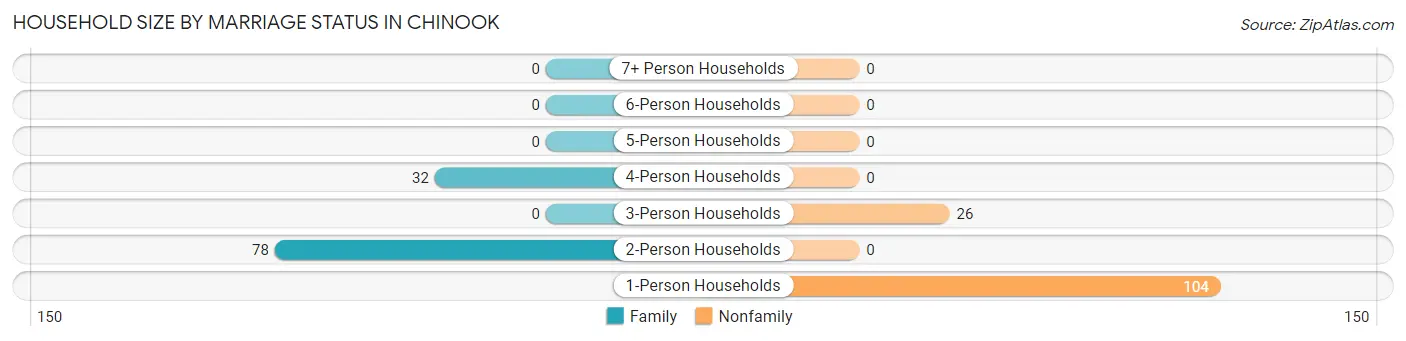
| Household Size | Family Households | Nonfamily Households |
| 1-Person Households | - | 104 (43.3%) |
| 2-Person Households | 78 (32.5%) | 0 (0.0%) |
| 3-Person Households | 0 (0.0%) | 26 (10.8%) |
| 4-Person Households | 32 (13.3%) | 0 (0.0%) |
| 5-Person Households | 0 (0.0%) | 0 (0.0%) |
| 6-Person Households | 0 (0.0%) | 0 (0.0%) |
| 7+ Person Households | 0 (0.0%) | 0 (0.0%) |
| Total | 110 (45.8%) | 130 (54.2%) |
Female Fertility in Chinook
Fertility by Age in Chinook
| Age Bracket | Women with Births | Births / 1,000 Women |
| 15 to 19 years | 0 (0.0%) | 0.0 |
| 20 to 34 years | 0 (0.0%) | 0.0 |
| 35 to 50 years | 0 (0.0%) | 0.0 |
| Total | 0 (0.0%) | 0.0 |
Fertility by Age by Marriage Status in Chinook
| Age Bracket | Married | Unmarried |
| 15 to 19 years | 0 (0.0%) | 0 (0.0%) |
| 20 to 34 years | 0 (0.0%) | 0 (0.0%) |
| 35 to 50 years | 0 (0.0%) | 0 (0.0%) |
| Total | 0 (0.0%) | 0 (0.0%) |
Fertility by Education in Chinook
| Educational Attainment | Women with Births | Births / 1,000 Women |
| Less than High School | 0 (0.0%) | 0.0 |
| High School Diploma | 0 (0.0%) | 0.0 |
| College or Associate's Degree | 0 (0.0%) | 0.0 |
| Bachelor's Degree | 0 (0.0%) | 0.0 |
| Graduate Degree | 0 (0.0%) | 0.0 |
| Total | 0 (0.0%) | 0.0 |
Fertility by Education by Marriage Status in Chinook
| Educational Attainment | Married | Unmarried |
| Less than High School | 0 (0.0%) | 0 (0.0%) |
| High School Diploma | 0 (0.0%) | 0 (0.0%) |
| College or Associate's Degree | 0 (0.0%) | 0 (0.0%) |
| Bachelor's Degree | 0 (0.0%) | 0 (0.0%) |
| Graduate Degree | 0 (0.0%) | 0 (0.0%) |
| Total | 0 (0.0%) | 0 (0.0%) |
Employment Characteristics in Chinook
Employment by Class of Employer in Chinook
Among the 235 employed individuals in Chinook, private company employees (77 | 32.8%), self-employed (not incorporated) (55 | 23.4%), and unpaid family workers (52 | 22.1%) make up the most common classes of employment.
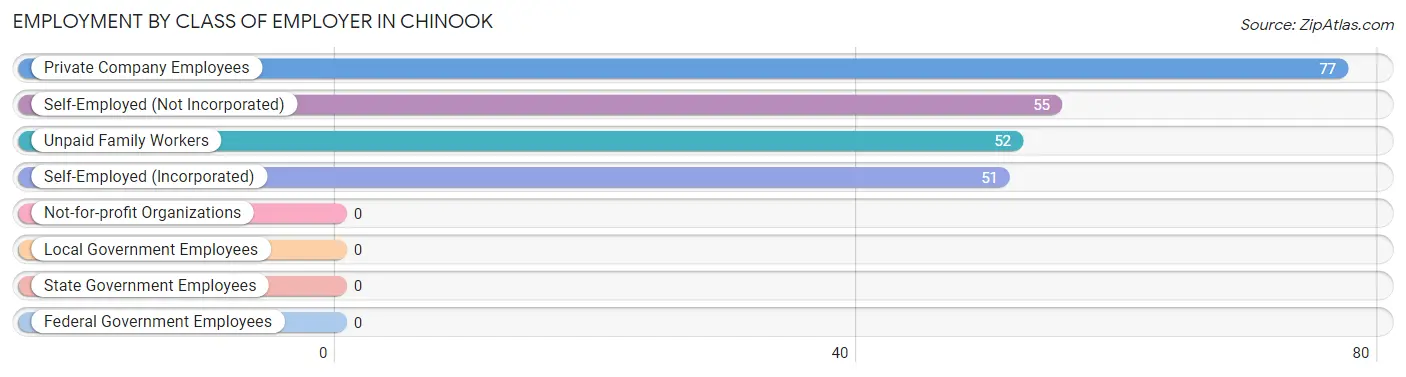
| Employer Class | # Employees | % Employees |
| Private Company Employees | 77 | 32.8% |
| Self-Employed (Incorporated) | 51 | 21.7% |
| Self-Employed (Not Incorporated) | 55 | 23.4% |
| Not-for-profit Organizations | 0 | 0.0% |
| Local Government Employees | 0 | 0.0% |
| State Government Employees | 0 | 0.0% |
| Federal Government Employees | 0 | 0.0% |
| Unpaid Family Workers | 52 | 22.1% |
| Total | 235 | 100.0% |
Employment Status by Age in Chinook
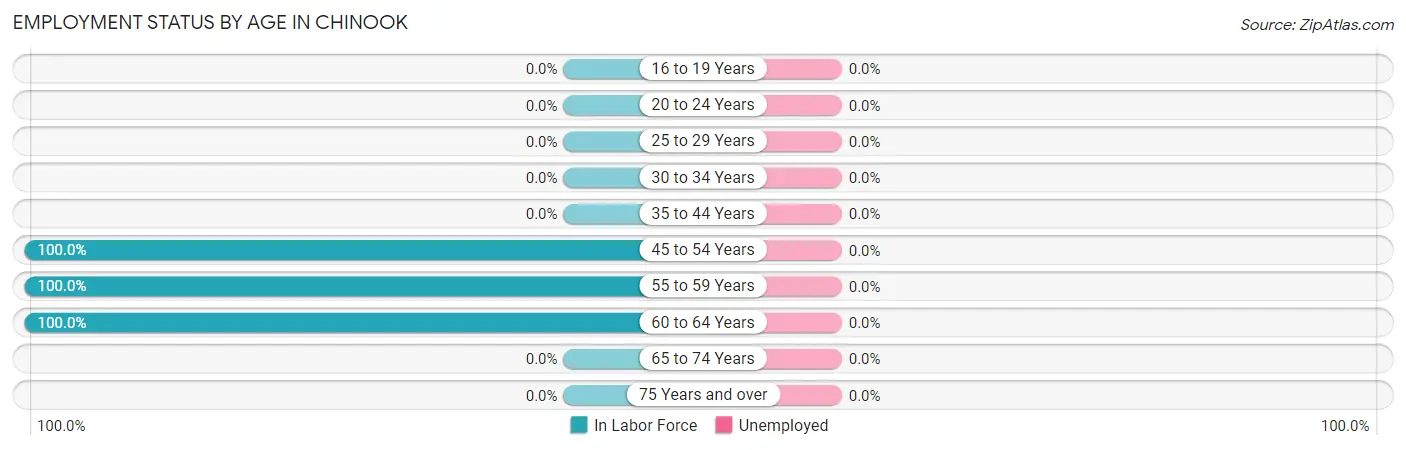
| Age Bracket | In Labor Force | Unemployed |
| 16 to 19 Years | 0 (0.0%) | 0 (0.0%) |
| 20 to 24 Years | 0 (0.0%) | 0 (0.0%) |
| 25 to 29 Years | 0 (0.0%) | 0 (0.0%) |
| 30 to 34 Years | 0 (0.0%) | 0 (0.0%) |
| 35 to 44 Years | 0 (0.0%) | 0 (0.0%) |
| 45 to 54 Years | 158 (100.0%) | 0 (0.0%) |
| 55 to 59 Years | 52 (100.0%) | 0 (0.0%) |
| 60 to 64 Years | 25 (100.0%) | 0 (0.0%) |
| 65 to 74 Years | 0 (0.0%) | 0 (0.0%) |
| 75 Years and over | 0 (0.0%) | 0 (0.0%) |
| Total | 235 (59.5%) | 0 (0.0%) |
Employment Status by Educational Attainment in Chinook
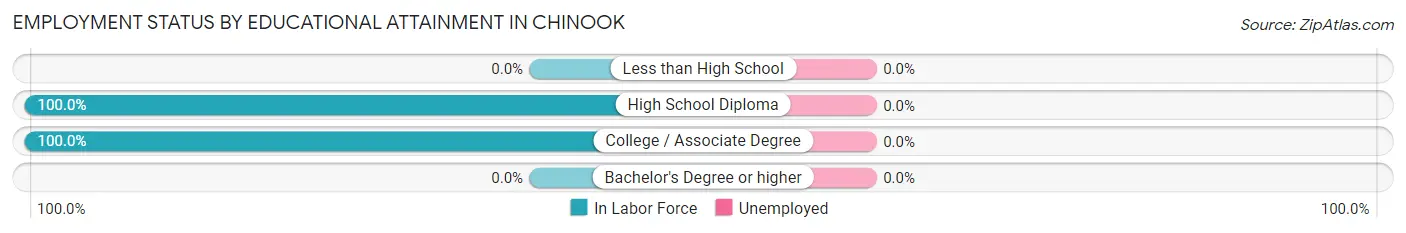
| Educational Attainment | In Labor Force | Unemployed |
| Less than High School | 0 (0.0%) | 0 (0.0%) |
| High School Diploma | 106 (100.0%) | 0 (0.0%) |
| College / Associate Degree | 129 (100.0%) | 0 (0.0%) |
| Bachelor's Degree or higher | 0 (0.0%) | 0 (0.0%) |
| Total | 235 (88.0%) | 0 (0.0%) |
Employment Occupations by Sex in Chinook
Management, Business, Science and Arts Occupations
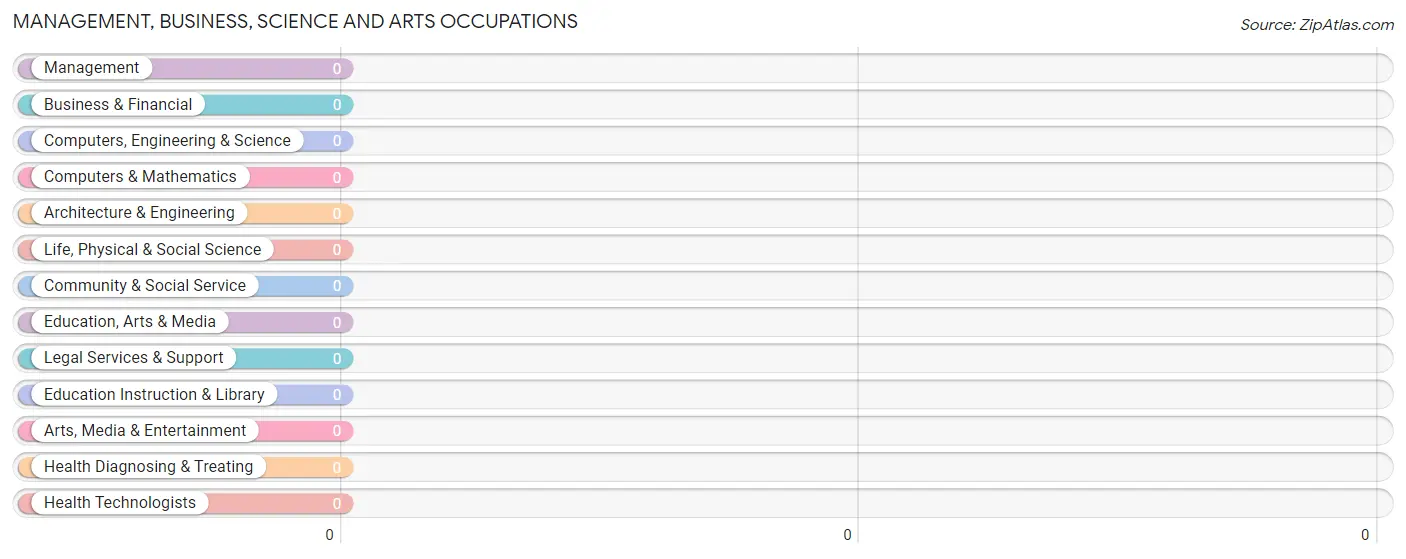
Management, Business, Science and Arts Occupations by Sex
| Occupation | Male | Female |
| Management | 0 (0.0%) | 0 (0.0%) |
| Business & Financial | 0 (0.0%) | 0 (0.0%) |
| Computers, Engineering & Science | 0 (0.0%) | 0 (0.0%) |
| Computers & Mathematics | 0 (0.0%) | 0 (0.0%) |
| Architecture & Engineering | 0 (0.0%) | 0 (0.0%) |
| Life, Physical & Social Science | 0 (0.0%) | 0 (0.0%) |
| Community & Social Service | 0 (0.0%) | 0 (0.0%) |
| Education, Arts & Media | 0 (0.0%) | 0 (0.0%) |
| Legal Services & Support | 0 (0.0%) | 0 (0.0%) |
| Education Instruction & Library | 0 (0.0%) | 0 (0.0%) |
| Arts, Media & Entertainment | 0 (0.0%) | 0 (0.0%) |
| Health Diagnosing & Treating | 0 (0.0%) | 0 (0.0%) |
| Health Technologists | 0 (0.0%) | 0 (0.0%) |
| Total (Category) | 0 (0.0%) | 0 (0.0%) |
| Total (Overall) | 157 (66.8%) | 78 (33.2%) |
Services Occupations
The most common Services occupations in Chinook are , and Healthcare Support (30 | 12.8%).
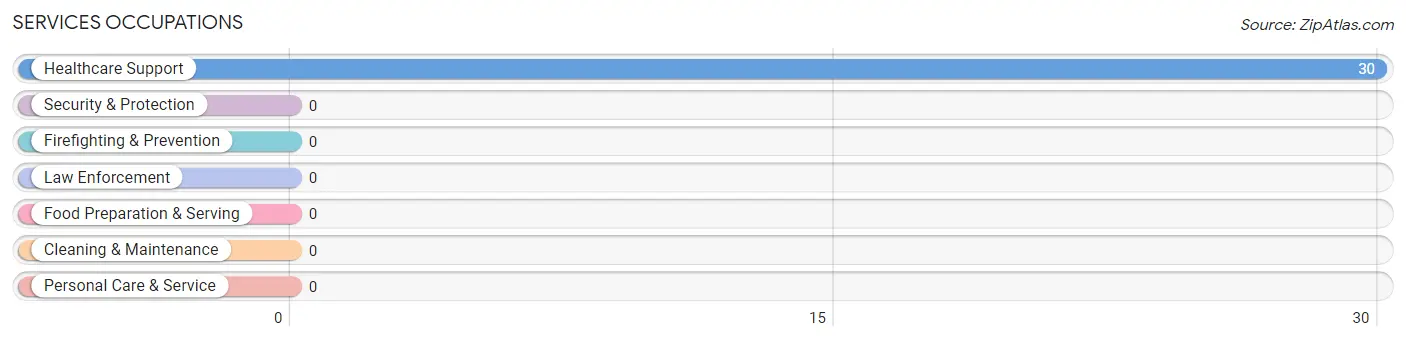
Services Occupations by Sex
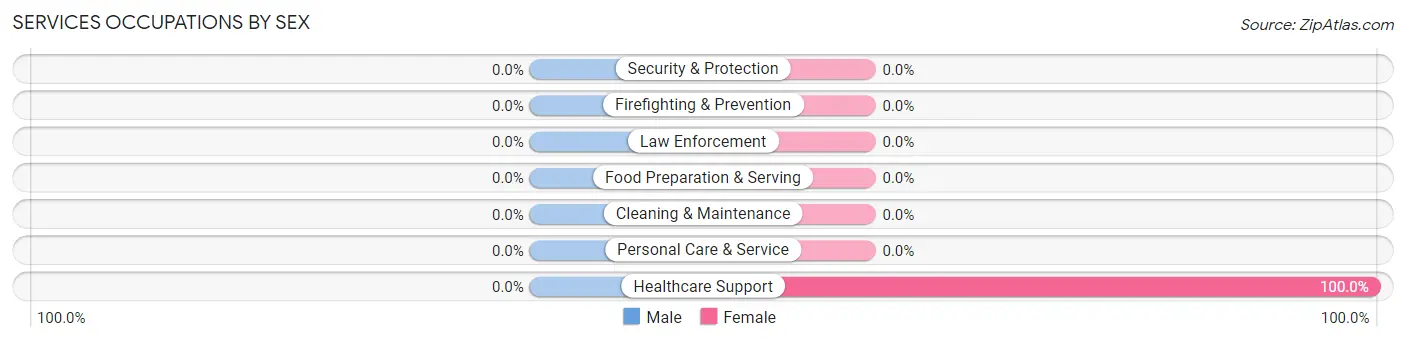
| Occupation | Male | Female |
| Healthcare Support | 0 (0.0%) | 30 (100.0%) |
| Security & Protection | 0 (0.0%) | 0 (0.0%) |
| Firefighting & Prevention | 0 (0.0%) | 0 (0.0%) |
| Law Enforcement | 0 (0.0%) | 0 (0.0%) |
| Food Preparation & Serving | 0 (0.0%) | 0 (0.0%) |
| Cleaning & Maintenance | 0 (0.0%) | 0 (0.0%) |
| Personal Care & Service | 0 (0.0%) | 0 (0.0%) |
| Total (Category) | 0 (0.0%) | 30 (100.0%) |
| Total (Overall) | 157 (66.8%) | 78 (33.2%) |
Sales and Office Occupations
The most common Sales and Office occupations in Chinook are Sales & Related (25 | 10.6%), and Office & Administration (23 | 9.8%).
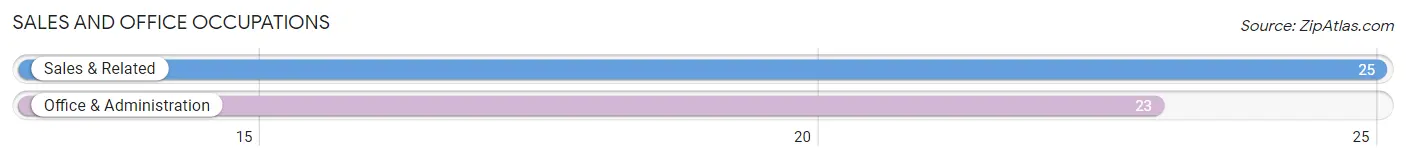
Sales and Office Occupations by Sex
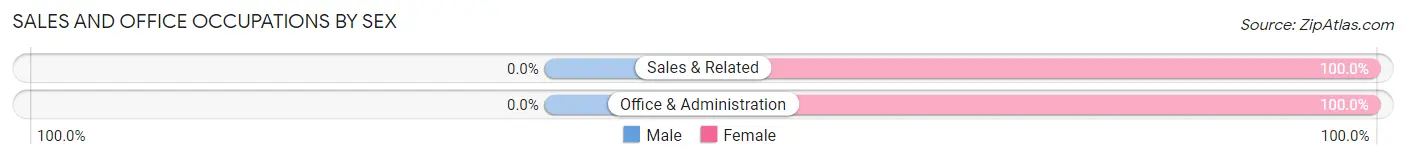
| Occupation | Male | Female |
| Sales & Related | 0 (0.0%) | 25 (100.0%) |
| Office & Administration | 0 (0.0%) | 23 (100.0%) |
| Total (Category) | 0 (0.0%) | 48 (100.0%) |
| Total (Overall) | 157 (66.8%) | 78 (33.2%) |
Natural Resources, Construction and Maintenance Occupations
The most common Natural Resources, Construction and Maintenance occupations in Chinook are Construction & Extraction (101 | 43.0%), and Farming, Fishing & Forestry (56 | 23.8%).
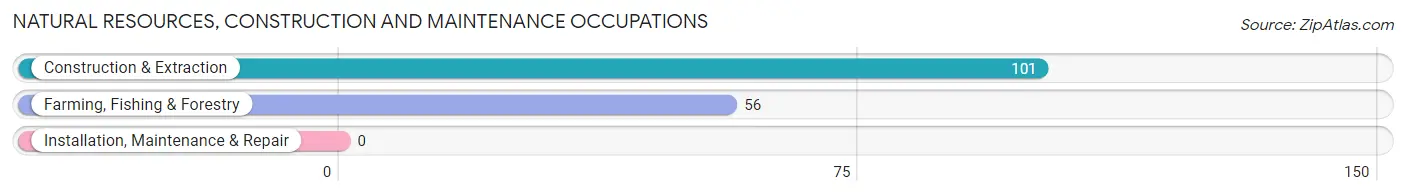
Natural Resources, Construction and Maintenance Occupations by Sex
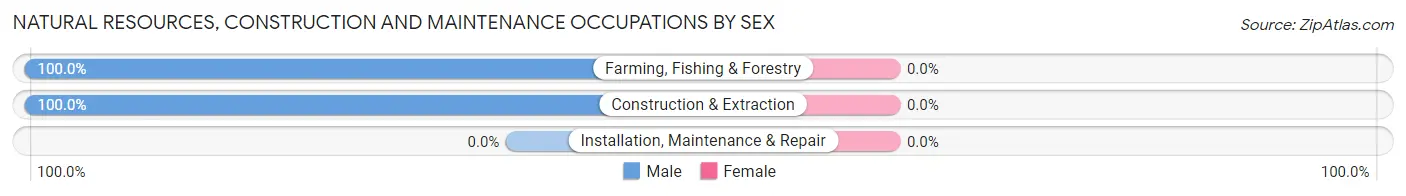
| Occupation | Male | Female |
| Farming, Fishing & Forestry | 56 (100.0%) | 0 (0.0%) |
| Construction & Extraction | 101 (100.0%) | 0 (0.0%) |
| Installation, Maintenance & Repair | 0 (0.0%) | 0 (0.0%) |
| Total (Category) | 157 (100.0%) | 0 (0.0%) |
| Total (Overall) | 157 (66.8%) | 78 (33.2%) |
Production, Transportation and Moving Occupations
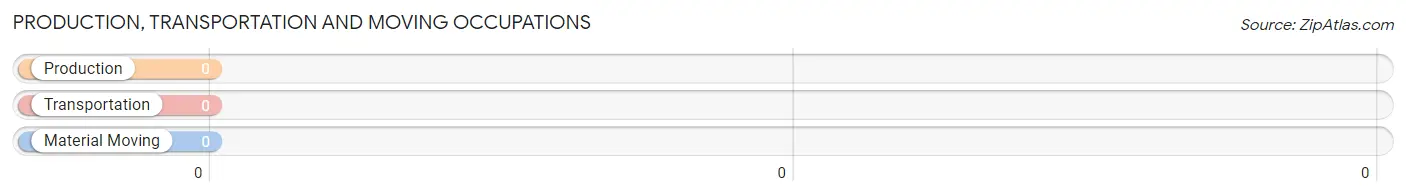
Production, Transportation and Moving Occupations by Sex
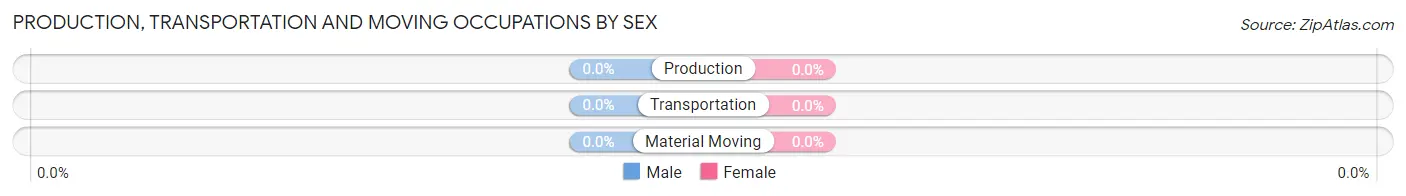
| Occupation | Male | Female |
| Production | 0 (0.0%) | 0 (0.0%) |
| Transportation | 0 (0.0%) | 0 (0.0%) |
| Material Moving | 0 (0.0%) | 0 (0.0%) |
| Total (Category) | 0 (0.0%) | 0 (0.0%) |
| Total (Overall) | 157 (66.8%) | 78 (33.2%) |
Employment Industries by Sex in Chinook
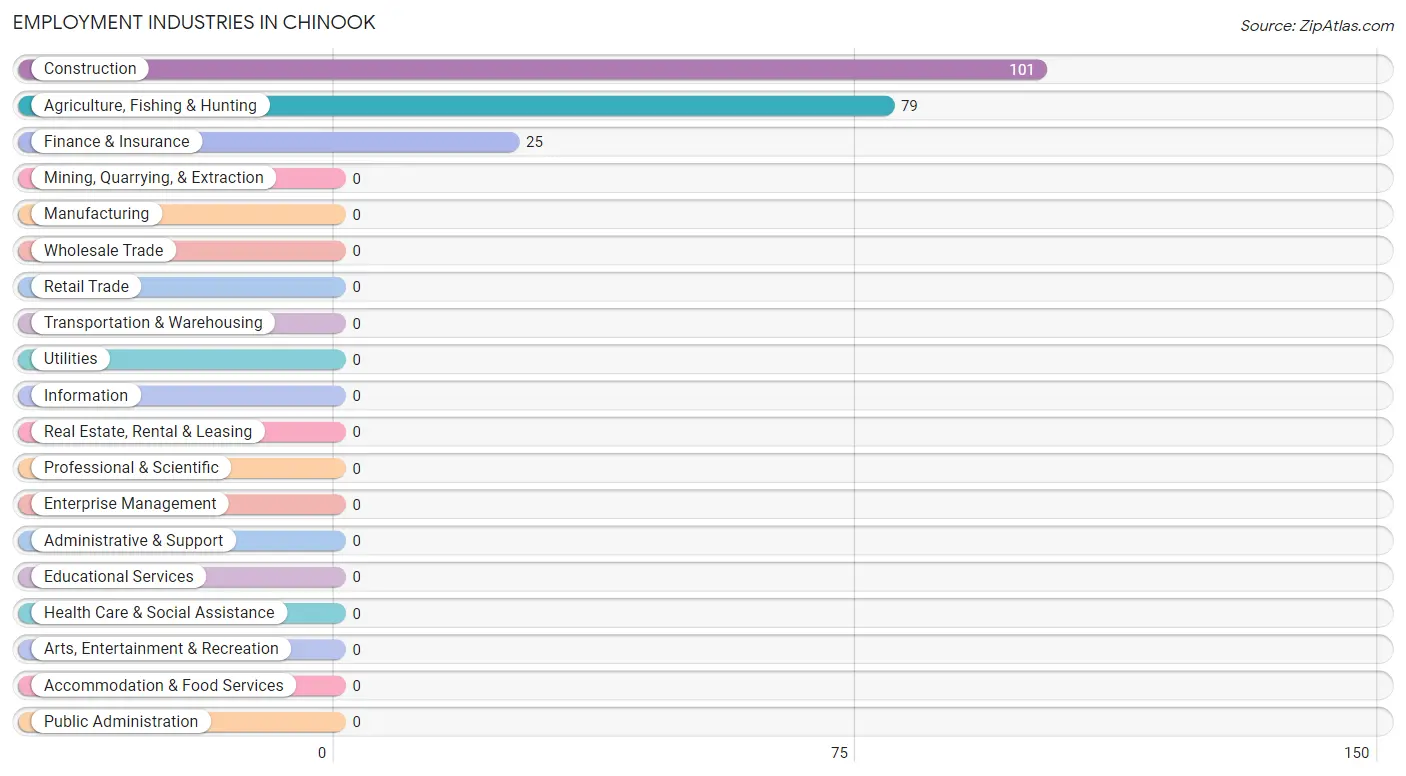
Employment Industries in Chinook
The major employment industries in Chinook include Construction (101 | 43.0%), Agriculture, Fishing & Hunting (79 | 33.6%), and Finance & Insurance (25 | 10.6%).
Employment Industries by Sex in Chinook
The Chinook industries that see more men than women are Construction (100.0%), and Agriculture, Fishing & Hunting (70.9%), whereas the industries that tend to have a higher number of women are Finance & Insurance (100.0%), and Agriculture, Fishing & Hunting (29.1%).
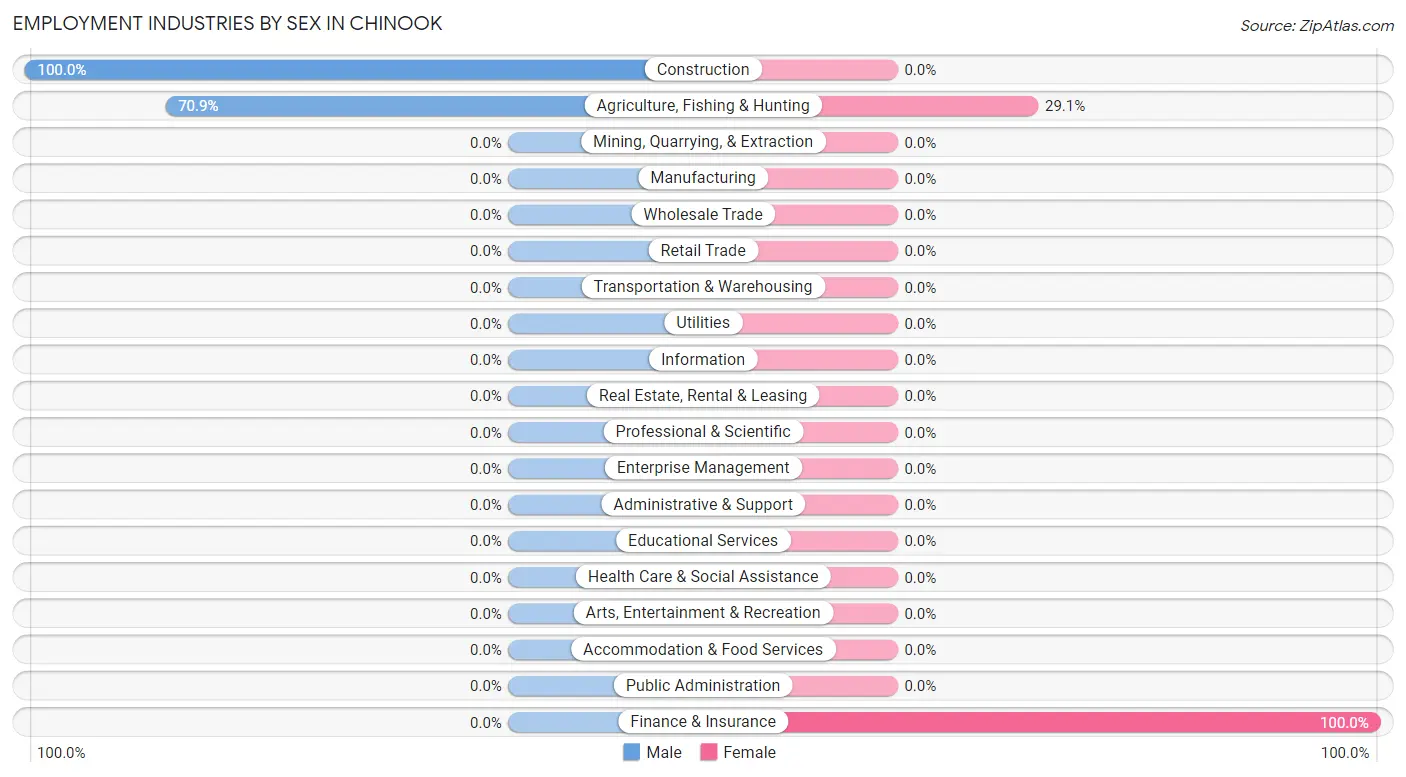
| Industry | Male | Female |
| Agriculture, Fishing & Hunting | 56 (70.9%) | 23 (29.1%) |
| Mining, Quarrying, & Extraction | 0 (0.0%) | 0 (0.0%) |
| Construction | 101 (100.0%) | 0 (0.0%) |
| Manufacturing | 0 (0.0%) | 0 (0.0%) |
| Wholesale Trade | 0 (0.0%) | 0 (0.0%) |
| Retail Trade | 0 (0.0%) | 0 (0.0%) |
| Transportation & Warehousing | 0 (0.0%) | 0 (0.0%) |
| Utilities | 0 (0.0%) | 0 (0.0%) |
| Information | 0 (0.0%) | 0 (0.0%) |
| Finance & Insurance | 0 (0.0%) | 25 (100.0%) |
| Real Estate, Rental & Leasing | 0 (0.0%) | 0 (0.0%) |
| Professional & Scientific | 0 (0.0%) | 0 (0.0%) |
| Enterprise Management | 0 (0.0%) | 0 (0.0%) |
| Administrative & Support | 0 (0.0%) | 0 (0.0%) |
| Educational Services | 0 (0.0%) | 0 (0.0%) |
| Health Care & Social Assistance | 0 (0.0%) | 0 (0.0%) |
| Arts, Entertainment & Recreation | 0 (0.0%) | 0 (0.0%) |
| Accommodation & Food Services | 0 (0.0%) | 0 (0.0%) |
| Public Administration | 0 (0.0%) | 0 (0.0%) |
| Total | 157 (66.8%) | 78 (33.2%) |
Education in Chinook
School Enrollment in Chinook
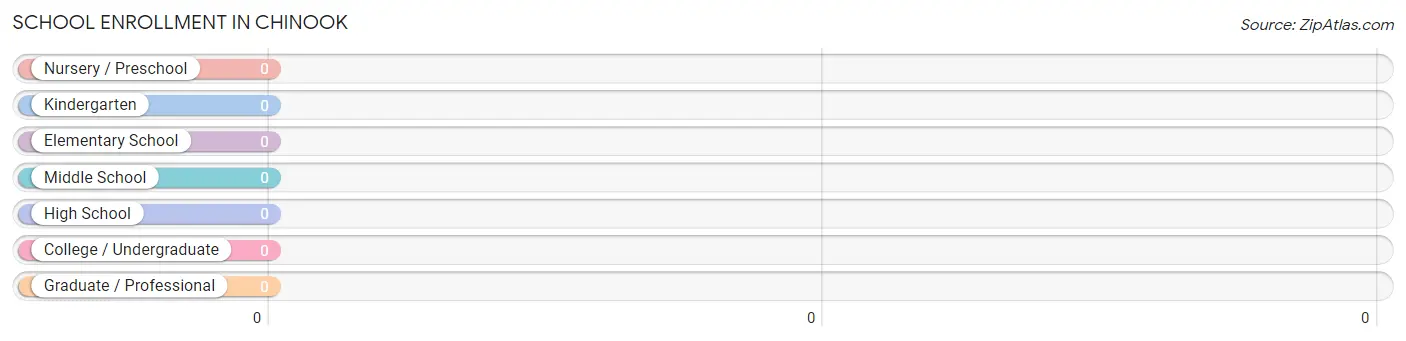
| School Level | # Students | % Students |
| Nursery / Preschool | 0 | 0.0% |
| Kindergarten | 0 | 0.0% |
| Elementary School | 0 | 0.0% |
| Middle School | 0 | 0.0% |
| High School | 0 | 0.0% |
| College / Undergraduate | 0 | 0.0% |
| Graduate / Professional | 0 | 0.0% |
| Total | 0 | 0.0% |
School Enrollment by Age by Funding Source in Chinook
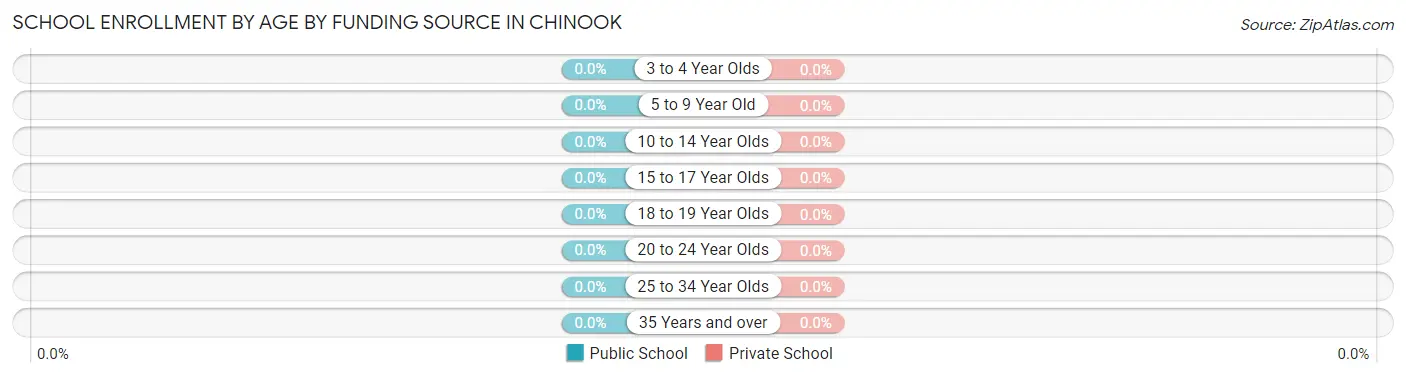
| Age Bracket | Public School | Private School |
| 3 to 4 Year Olds | 0 (0.0%) | 0 (0.0%) |
| 5 to 9 Year Old | 0 (0.0%) | 0 (0.0%) |
| 10 to 14 Year Olds | 0 (0.0%) | 0 (0.0%) |
| 15 to 17 Year Olds | 0 (0.0%) | 0 (0.0%) |
| 18 to 19 Year Olds | 0 (0.0%) | 0 (0.0%) |
| 20 to 24 Year Olds | 0 (0.0%) | 0 (0.0%) |
| 25 to 34 Year Olds | 0 (0.0%) | 0 (0.0%) |
| 35 Years and over | 0 (0.0%) | 0 (0.0%) |
| Total | 0 (0.0%) | 0 (0.0%) |
Educational Attainment by Field of Study in Chinook
Bio, nature & agricultural (32 | 53.3%), and liberal arts & history (28 | 46.7%) are the most common fields of study among 60 individuals in Chinook who have obtained a bachelor's degree or higher.
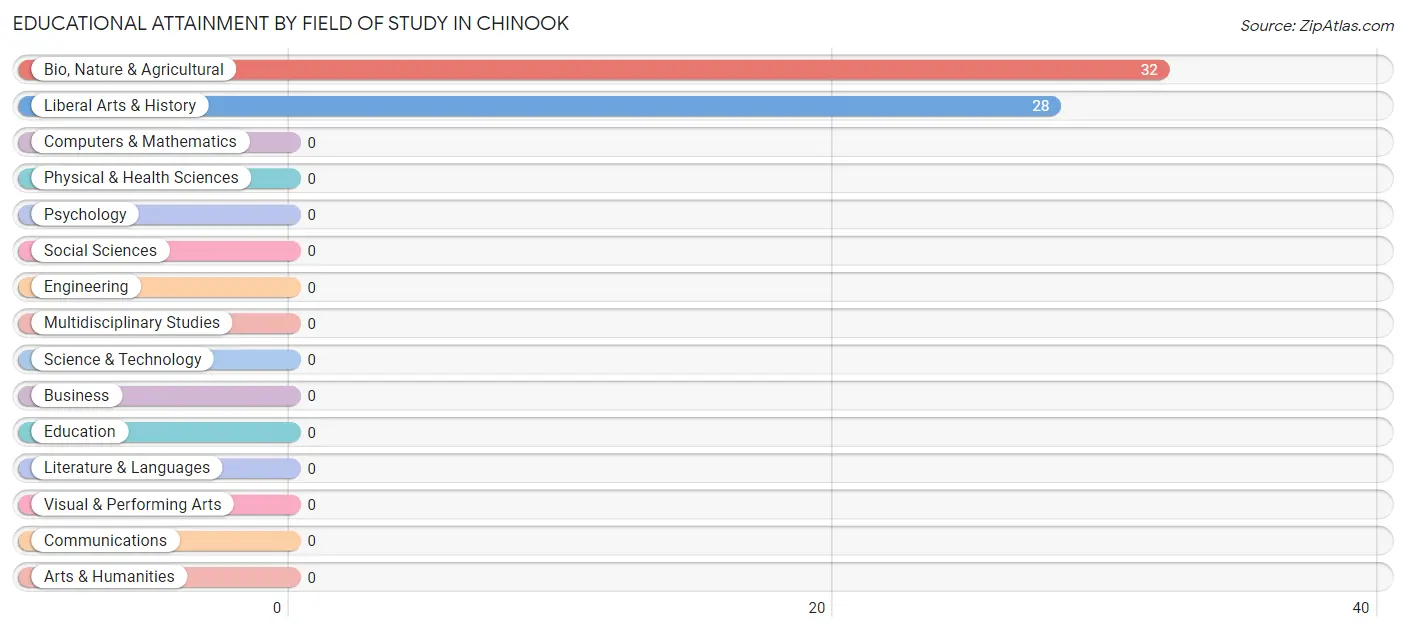
| Field of Study | # Graduates | % Graduates |
| Computers & Mathematics | 0 | 0.0% |
| Bio, Nature & Agricultural | 32 | 53.3% |
| Physical & Health Sciences | 0 | 0.0% |
| Psychology | 0 | 0.0% |
| Social Sciences | 0 | 0.0% |
| Engineering | 0 | 0.0% |
| Multidisciplinary Studies | 0 | 0.0% |
| Science & Technology | 0 | 0.0% |
| Business | 0 | 0.0% |
| Education | 0 | 0.0% |
| Literature & Languages | 0 | 0.0% |
| Liberal Arts & History | 28 | 46.7% |
| Visual & Performing Arts | 0 | 0.0% |
| Communications | 0 | 0.0% |
| Arts & Humanities | 0 | 0.0% |
| Total | 60 | 100.0% |
Transportation & Commute in Chinook
Vehicle Availability by Sex in Chinook
The most prevalent vehicle ownership categories in Chinook are males with 3 vehicles (105, accounting for 66.9%) and females with 3 vehicles (23, making up 134.6%).
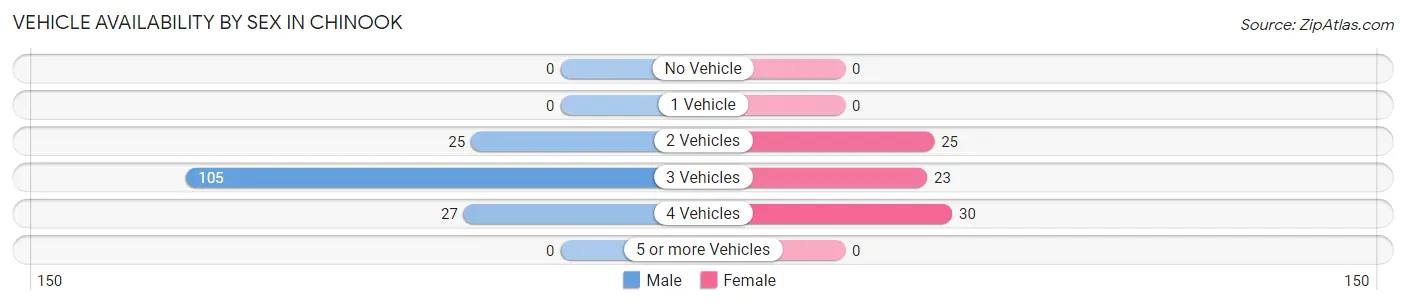
| Vehicles Available | Male | Female |
| No Vehicle | 0 (0.0%) | 0 (0.0%) |
| 1 Vehicle | 0 (0.0%) | 0 (0.0%) |
| 2 Vehicles | 25 (15.9%) | 25 (32.1%) |
| 3 Vehicles | 105 (66.9%) | 23 (29.5%) |
| 4 Vehicles | 27 (17.2%) | 30 (38.5%) |
| 5 or more Vehicles | 0 (0.0%) | 0 (0.0%) |
| Total | 157 (100.0%) | 78 (100.0%) |
Commute Time in Chinook
The most frequently occuring commute durations in Chinook are 10 to 14 minutes (76 commuters, 48.4%), less than 5 minutes (29 commuters, 18.5%), and 30 to 34 minutes (27 commuters, 17.2%).
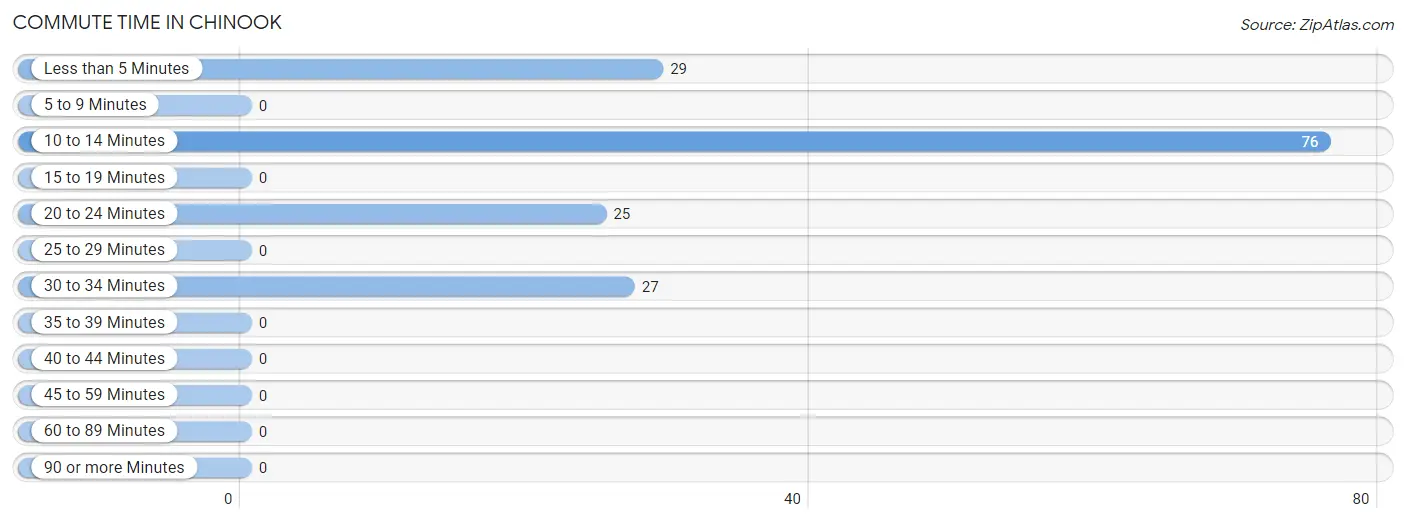
| Commute Time | # Commuters | % Commuters |
| Less than 5 Minutes | 29 | 18.5% |
| 5 to 9 Minutes | 0 | 0.0% |
| 10 to 14 Minutes | 76 | 48.4% |
| 15 to 19 Minutes | 0 | 0.0% |
| 20 to 24 Minutes | 25 | 15.9% |
| 25 to 29 Minutes | 0 | 0.0% |
| 30 to 34 Minutes | 27 | 17.2% |
| 35 to 39 Minutes | 0 | 0.0% |
| 40 to 44 Minutes | 0 | 0.0% |
| 45 to 59 Minutes | 0 | 0.0% |
| 60 to 89 Minutes | 0 | 0.0% |
| 90 or more Minutes | 0 | 0.0% |
Commute Time by Sex in Chinook
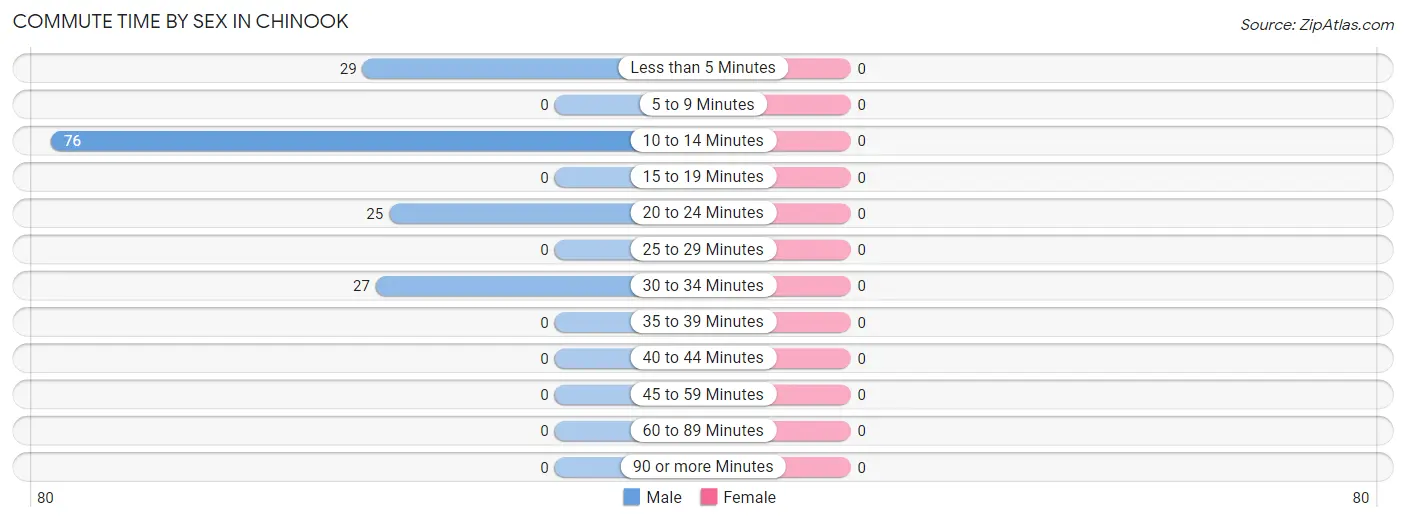
| Commute Time | Male | Female |
| Less than 5 Minutes | 29 (18.5%) | 0 (0.0%) |
| 5 to 9 Minutes | 0 (0.0%) | 0 (0.0%) |
| 10 to 14 Minutes | 76 (48.4%) | 0 (0.0%) |
| 15 to 19 Minutes | 0 (0.0%) | 0 (0.0%) |
| 20 to 24 Minutes | 25 (15.9%) | 0 (0.0%) |
| 25 to 29 Minutes | 0 (0.0%) | 0 (0.0%) |
| 30 to 34 Minutes | 27 (17.2%) | 0 (0.0%) |
| 35 to 39 Minutes | 0 (0.0%) | 0 (0.0%) |
| 40 to 44 Minutes | 0 (0.0%) | 0 (0.0%) |
| 45 to 59 Minutes | 0 (0.0%) | 0 (0.0%) |
| 60 to 89 Minutes | 0 (0.0%) | 0 (0.0%) |
| 90 or more Minutes | 0 (0.0%) | 0 (0.0%) |
Time of Departure to Work by Sex in Chinook
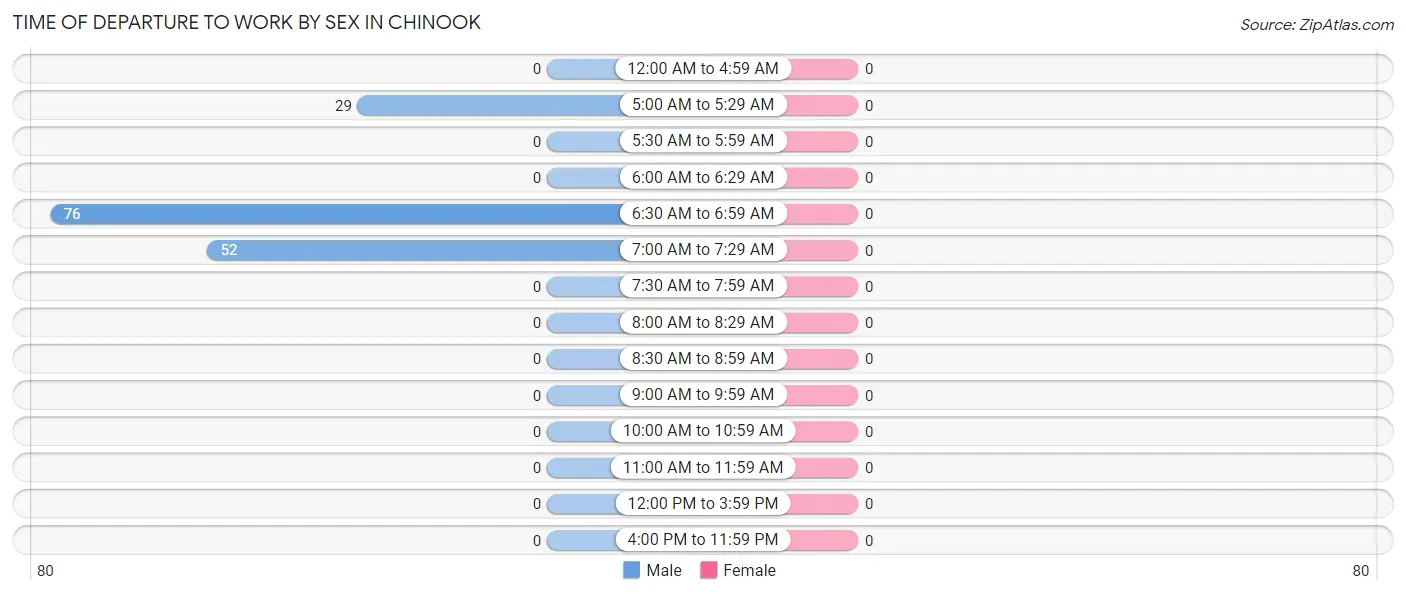
| Time of Departure | Male | Female |
| 12:00 AM to 4:59 AM | 0 (0.0%) | 0 (0.0%) |
| 5:00 AM to 5:29 AM | 29 (18.5%) | 0 (0.0%) |
| 5:30 AM to 5:59 AM | 0 (0.0%) | 0 (0.0%) |
| 6:00 AM to 6:29 AM | 0 (0.0%) | 0 (0.0%) |
| 6:30 AM to 6:59 AM | 76 (48.4%) | 0 (0.0%) |
| 7:00 AM to 7:29 AM | 52 (33.1%) | 0 (0.0%) |
| 7:30 AM to 7:59 AM | 0 (0.0%) | 0 (0.0%) |
| 8:00 AM to 8:29 AM | 0 (0.0%) | 0 (0.0%) |
| 8:30 AM to 8:59 AM | 0 (0.0%) | 0 (0.0%) |
| 9:00 AM to 9:59 AM | 0 (0.0%) | 0 (0.0%) |
| 10:00 AM to 10:59 AM | 0 (0.0%) | 0 (0.0%) |
| 11:00 AM to 11:59 AM | 0 (0.0%) | 0 (0.0%) |
| 12:00 PM to 3:59 PM | 0 (0.0%) | 0 (0.0%) |
| 4:00 PM to 11:59 PM | 0 (0.0%) | 0 (0.0%) |
| Total | 157 (100.0%) | 0 (0.0%) |
Housing Occupancy in Chinook
Occupancy by Ownership in Chinook
Of the total 240 dwellings in Chinook, owner-occupied units account for 240 (100.0%), while renter-occupied units make up 0 (0.0%).
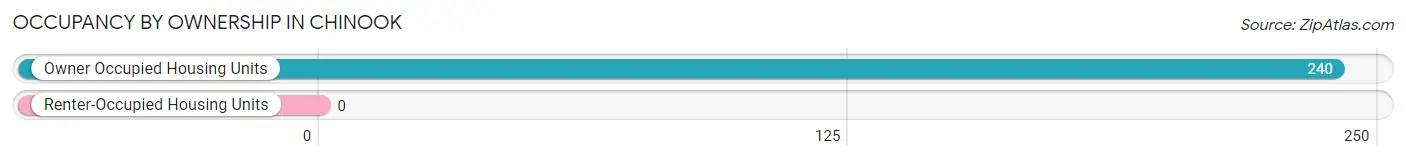
| Occupancy | # Housing Units | % Housing Units |
| Owner Occupied Housing Units | 240 | 100.0% |
| Renter-Occupied Housing Units | 0 | 0.0% |
| Total Occupied Housing Units | 240 | 100.0% |
Occupancy by Household Size in Chinook
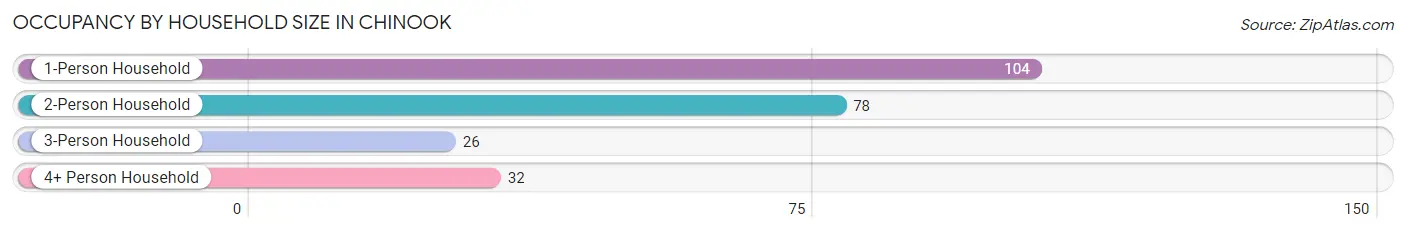
| Household Size | # Housing Units | % Housing Units |
| 1-Person Household | 104 | 43.3% |
| 2-Person Household | 78 | 32.5% |
| 3-Person Household | 26 | 10.8% |
| 4+ Person Household | 32 | 13.3% |
| Total Housing Units | 240 | 100.0% |
Occupancy by Ownership by Household Size in Chinook
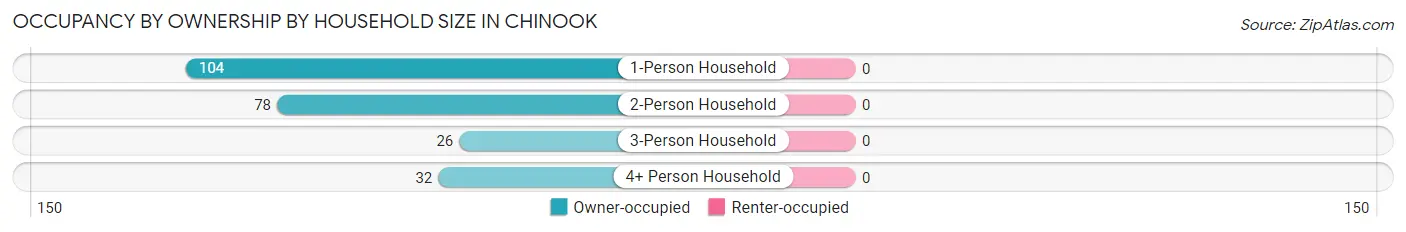
| Household Size | Owner-occupied | Renter-occupied |
| 1-Person Household | 104 (100.0%) | 0 (0.0%) |
| 2-Person Household | 78 (100.0%) | 0 (0.0%) |
| 3-Person Household | 26 (100.0%) | 0 (0.0%) |
| 4+ Person Household | 32 (100.0%) | 0 (0.0%) |
| Total Housing Units | 240 (100.0%) | 0 (0.0%) |
Occupancy by Educational Attainment in Chinook
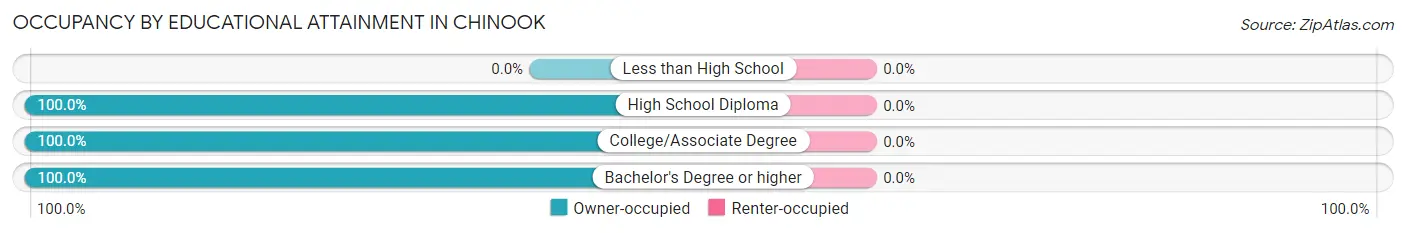
| Household Size | Owner-occupied | Renter-occupied |
| Less than High School | 0 (0.0%) | 0 (0.0%) |
| High School Diploma | 77 (100.0%) | 0 (0.0%) |
| College/Associate Degree | 103 (100.0%) | 0 (0.0%) |
| Bachelor's Degree or higher | 60 (100.0%) | 0 (0.0%) |
Occupancy by Age of Householder in Chinook
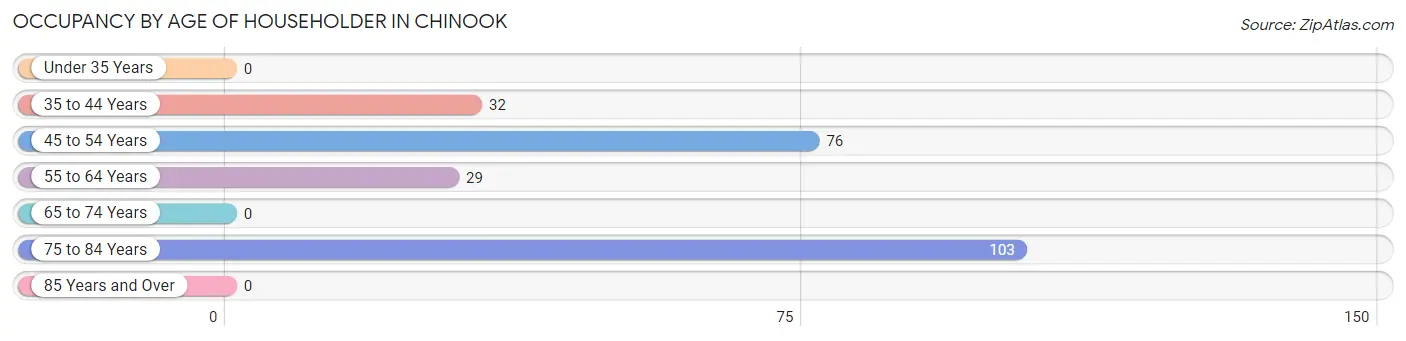
| Age Bracket | # Households | % Households |
| Under 35 Years | 0 | 0.0% |
| 35 to 44 Years | 32 | 13.3% |
| 45 to 54 Years | 76 | 31.7% |
| 55 to 64 Years | 29 | 12.1% |
| 65 to 74 Years | 0 | 0.0% |
| 75 to 84 Years | 103 | 42.9% |
| 85 Years and Over | 0 | 0.0% |
| Total | 240 | 100.0% |
Housing Finances in Chinook
Median Income by Occupancy in Chinook
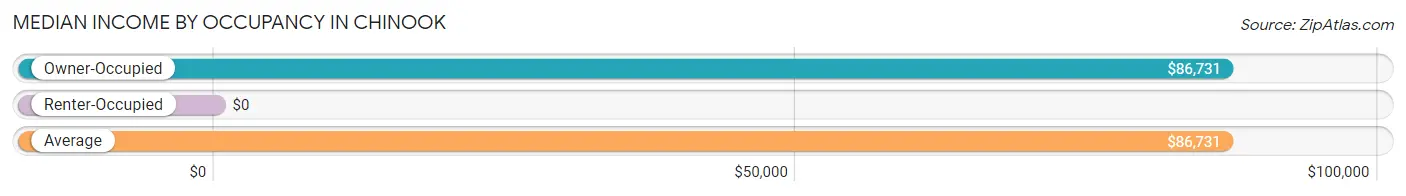
| Occupancy Type | # Households | Median Income |
| Owner-Occupied | 240 (100.0%) | $86,731 |
| Renter-Occupied | 0 (0.0%) | $0 |
| Average | 240 (100.0%) | $86,731 |
Occupancy by Householder Income Bracket in Chinook
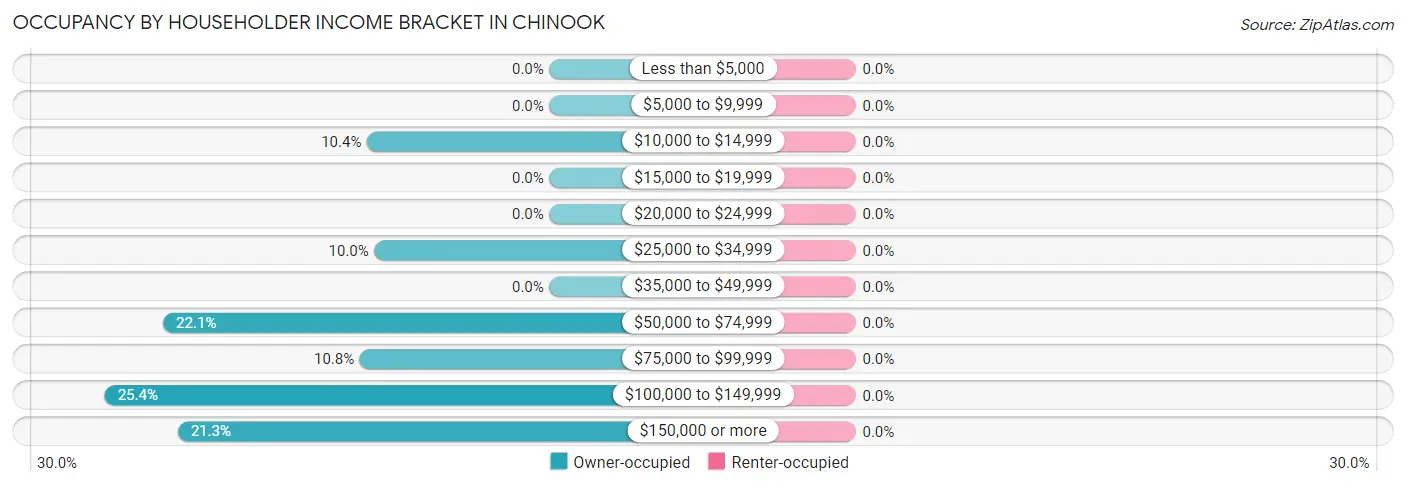
| Income Bracket | Owner-occupied | Renter-occupied |
| Less than $5,000 | 0 (0.0%) | 0 (0.0%) |
| $5,000 to $9,999 | 0 (0.0%) | 0 (0.0%) |
| $10,000 to $14,999 | 25 (10.4%) | 0 (0.0%) |
| $15,000 to $19,999 | 0 (0.0%) | 0 (0.0%) |
| $20,000 to $24,999 | 0 (0.0%) | 0 (0.0%) |
| $25,000 to $34,999 | 24 (10.0%) | 0 (0.0%) |
| $35,000 to $49,999 | 0 (0.0%) | 0 (0.0%) |
| $50,000 to $74,999 | 53 (22.1%) | 0 (0.0%) |
| $75,000 to $99,999 | 26 (10.8%) | 0 (0.0%) |
| $100,000 to $149,999 | 61 (25.4%) | 0 (0.0%) |
| $150,000 or more | 51 (21.2%) | 0 (0.0%) |
| Total | 240 (100.0%) | 0 (0.0%) |
Monthly Housing Cost Tiers in Chinook
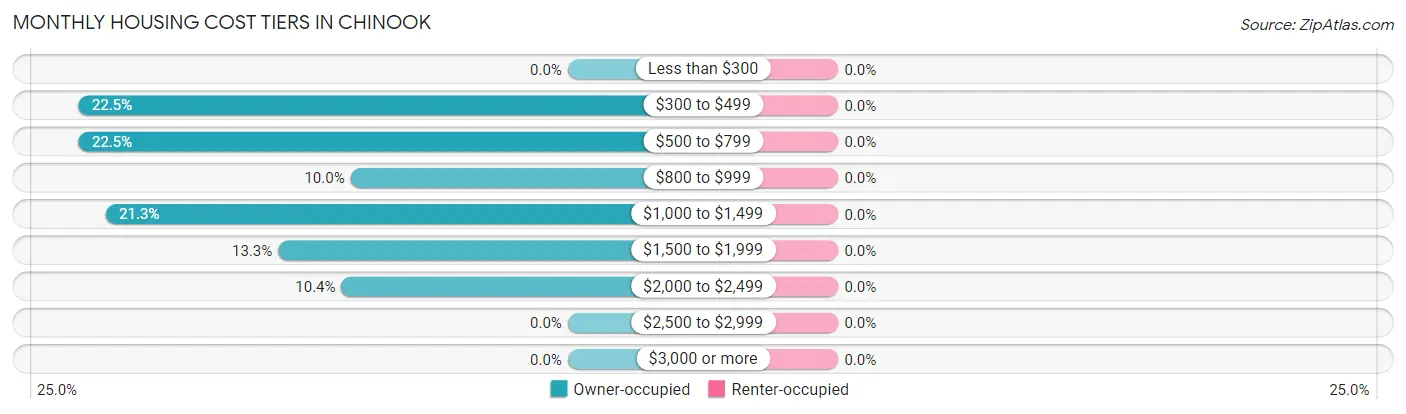
| Monthly Cost | Owner-occupied | Renter-occupied |
| Less than $300 | 0 (0.0%) | 0 (0.0%) |
| $300 to $499 | 54 (22.5%) | 0 (0.0%) |
| $500 to $799 | 54 (22.5%) | 0 (0.0%) |
| $800 to $999 | 24 (10.0%) | 0 (0.0%) |
| $1,000 to $1,499 | 51 (21.2%) | 0 (0.0%) |
| $1,500 to $1,999 | 32 (13.3%) | 0 (0.0%) |
| $2,000 to $2,499 | 25 (10.4%) | 0 (0.0%) |
| $2,500 to $2,999 | 0 (0.0%) | 0 (0.0%) |
| $3,000 or more | 0 (0.0%) | 0 (0.0%) |
| Total | 240 (100.0%) | 0 (0.0%) |
Physical Housing Characteristics in Chinook
Housing Structures in Chinook
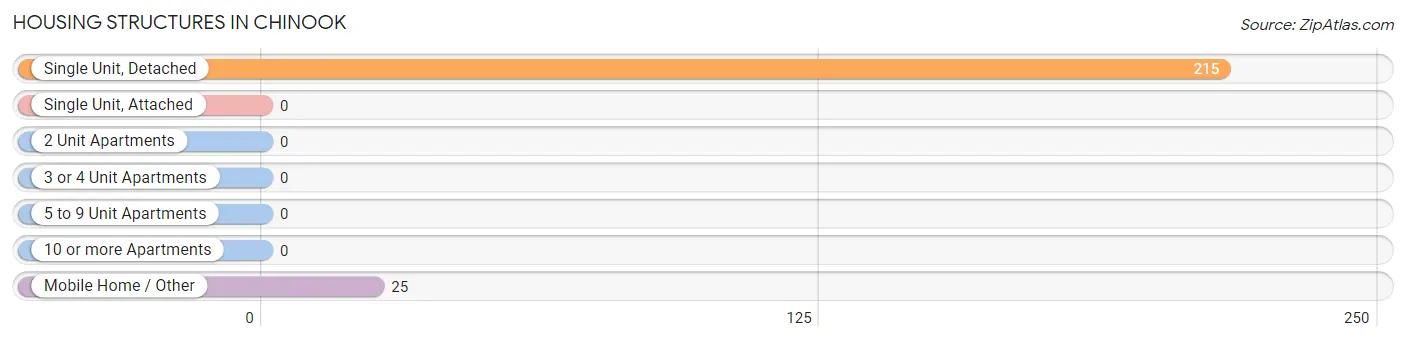
| Structure Type | # Housing Units | % Housing Units |
| Single Unit, Detached | 215 | 89.6% |
| Single Unit, Attached | 0 | 0.0% |
| 2 Unit Apartments | 0 | 0.0% |
| 3 or 4 Unit Apartments | 0 | 0.0% |
| 5 to 9 Unit Apartments | 0 | 0.0% |
| 10 or more Apartments | 0 | 0.0% |
| Mobile Home / Other | 25 | 10.4% |
| Total | 240 | 100.0% |
Housing Structures by Occupancy in Chinook
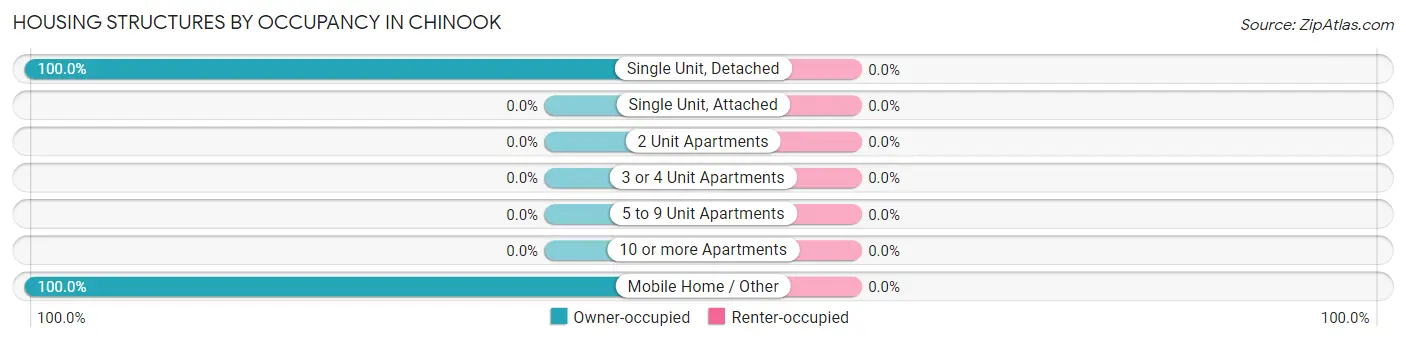
| Structure Type | Owner-occupied | Renter-occupied |
| Single Unit, Detached | 215 (100.0%) | 0 (0.0%) |
| Single Unit, Attached | 0 (0.0%) | 0 (0.0%) |
| 2 Unit Apartments | 0 (0.0%) | 0 (0.0%) |
| 3 or 4 Unit Apartments | 0 (0.0%) | 0 (0.0%) |
| 5 to 9 Unit Apartments | 0 (0.0%) | 0 (0.0%) |
| 10 or more Apartments | 0 (0.0%) | 0 (0.0%) |
| Mobile Home / Other | 25 (100.0%) | 0 (0.0%) |
| Total | 240 (100.0%) | 0 (0.0%) |
Housing Structures by Number of Rooms in Chinook
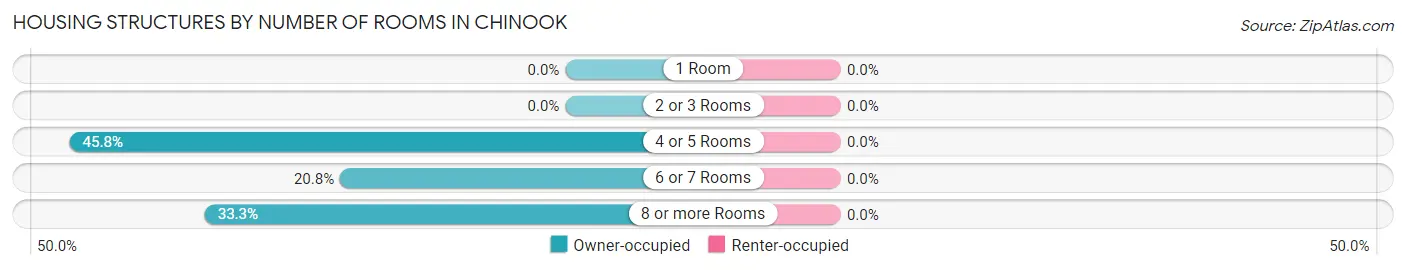
| Number of Rooms | Owner-occupied | Renter-occupied |
| 1 Room | 0 (0.0%) | 0 (0.0%) |
| 2 or 3 Rooms | 0 (0.0%) | 0 (0.0%) |
| 4 or 5 Rooms | 110 (45.8%) | 0 (0.0%) |
| 6 or 7 Rooms | 50 (20.8%) | 0 (0.0%) |
| 8 or more Rooms | 80 (33.3%) | 0 (0.0%) |
| Total | 240 (100.0%) | 0 (0.0%) |
Housing Structure by Heating Type in Chinook
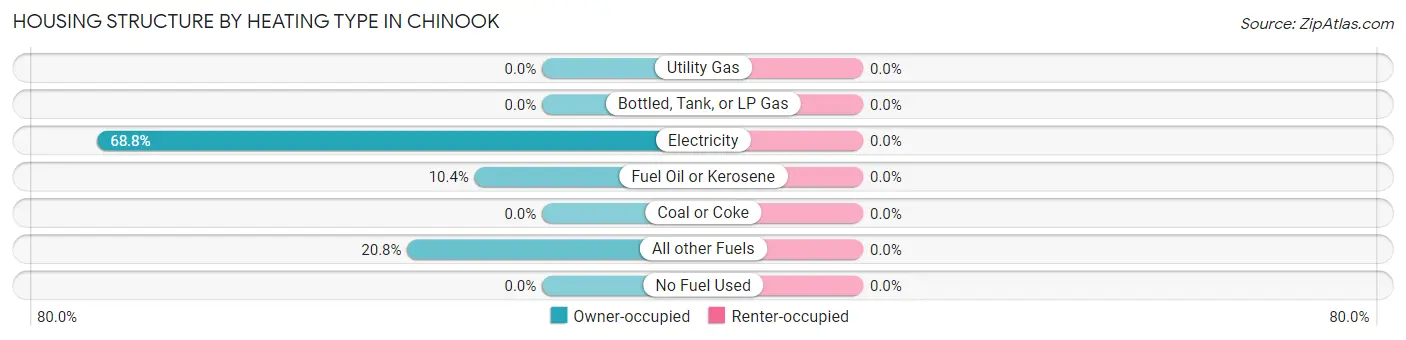
| Heating Type | Owner-occupied | Renter-occupied |
| Utility Gas | 0 (0.0%) | 0 (0.0%) |
| Bottled, Tank, or LP Gas | 0 (0.0%) | 0 (0.0%) |
| Electricity | 165 (68.8%) | 0 (0.0%) |
| Fuel Oil or Kerosene | 25 (10.4%) | 0 (0.0%) |
| Coal or Coke | 0 (0.0%) | 0 (0.0%) |
| All other Fuels | 50 (20.8%) | 0 (0.0%) |
| No Fuel Used | 0 (0.0%) | 0 (0.0%) |
| Total | 240 (100.0%) | 0 (0.0%) |
Household Vehicle Usage in Chinook
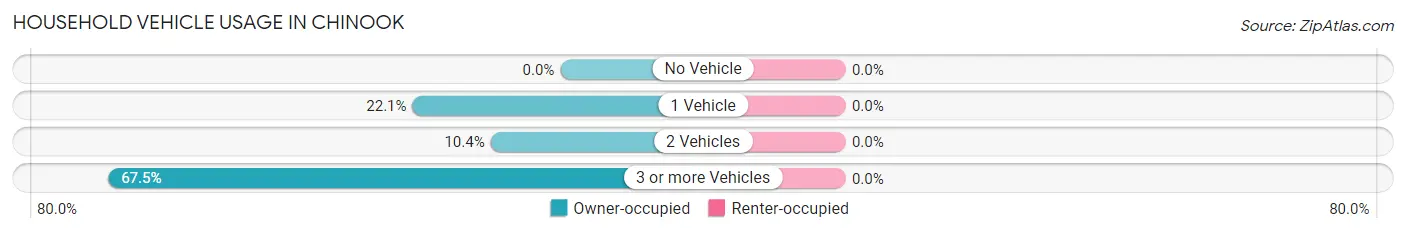
| Vehicles per Household | Owner-occupied | Renter-occupied |
| No Vehicle | 0 (0.0%) | 0 (0.0%) |
| 1 Vehicle | 53 (22.1%) | 0 (0.0%) |
| 2 Vehicles | 25 (10.4%) | 0 (0.0%) |
| 3 or more Vehicles | 162 (67.5%) | 0 (0.0%) |
| Total | 240 (100.0%) | 0 (0.0%) |
Real Estate & Mortgages in Chinook
Real Estate and Mortgage Overview in Chinook
| Characteristic | Without Mortgage | With Mortgage |
| Housing Units | 158 | 82 |
| Median Property Value | - | - |
| Median Household Income | - | - |
| Monthly Housing Costs | $786 | $0 |
| Real Estate Taxes | $3,862 | $0 |
Property Value by Mortgage Status in Chinook
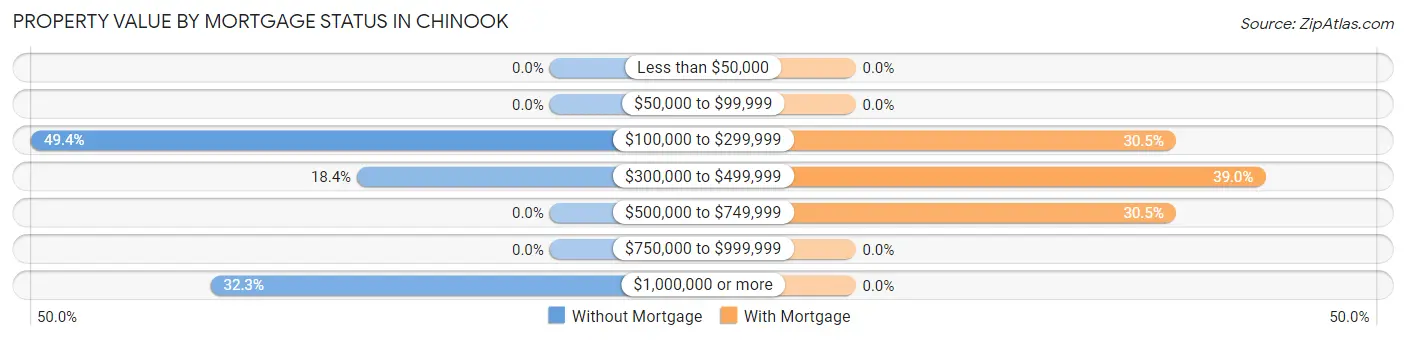
| Property Value | Without Mortgage | With Mortgage |
| Less than $50,000 | 0 (0.0%) | 0 (0.0%) |
| $50,000 to $99,999 | 0 (0.0%) | 0 (0.0%) |
| $100,000 to $299,999 | 78 (49.4%) | 25 (30.5%) |
| $300,000 to $499,999 | 29 (18.3%) | 32 (39.0%) |
| $500,000 to $749,999 | 0 (0.0%) | 25 (30.5%) |
| $750,000 to $999,999 | 0 (0.0%) | 0 (0.0%) |
| $1,000,000 or more | 51 (32.3%) | 0 (0.0%) |
| Total | 158 (100.0%) | 82 (100.0%) |
Household Income by Mortgage Status in Chinook
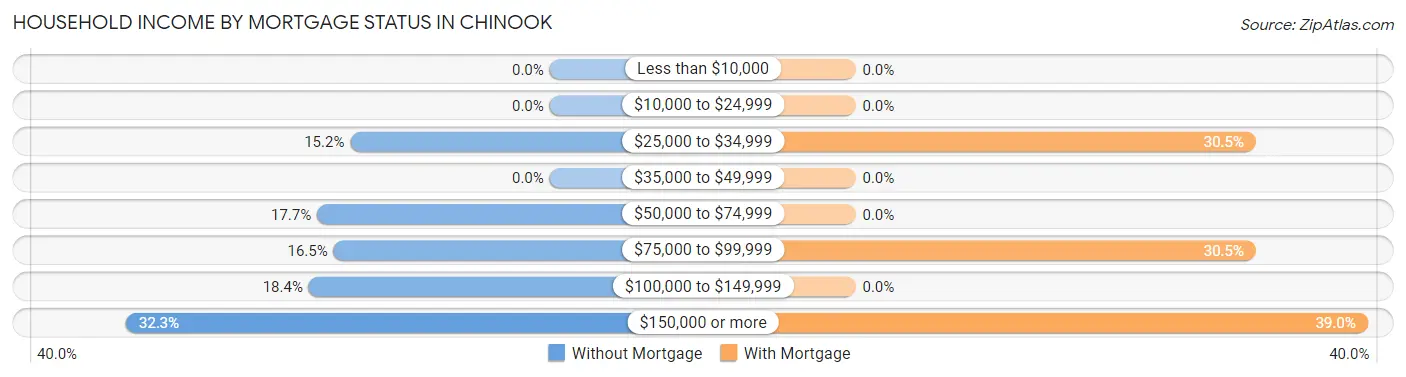
| Household Income | Without Mortgage | With Mortgage |
| Less than $10,000 | 0 (0.0%) | 0 (0.0%) |
| $10,000 to $24,999 | 0 (0.0%) | 0 (0.0%) |
| $25,000 to $34,999 | 24 (15.2%) | 25 (30.5%) |
| $35,000 to $49,999 | 0 (0.0%) | 0 (0.0%) |
| $50,000 to $74,999 | 28 (17.7%) | 0 (0.0%) |
| $75,000 to $99,999 | 26 (16.5%) | 25 (30.5%) |
| $100,000 to $149,999 | 29 (18.3%) | 0 (0.0%) |
| $150,000 or more | 51 (32.3%) | 32 (39.0%) |
| Total | 158 (100.0%) | 82 (100.0%) |
Property Value to Household Income Ratio in Chinook
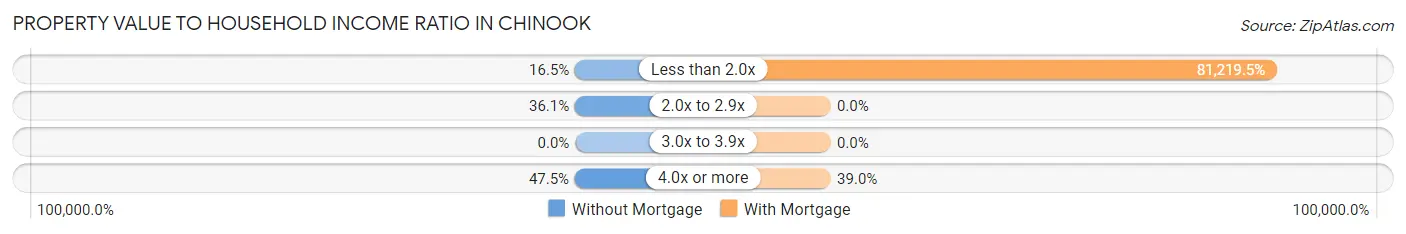
| Value-to-Income Ratio | Without Mortgage | With Mortgage |
| Less than 2.0x | 26 (16.5%) | 66,600 (81,219.5%) |
| 2.0x to 2.9x | 57 (36.1%) | 0 (0.0%) |
| 3.0x to 3.9x | 0 (0.0%) | 0 (0.0%) |
| 4.0x or more | 75 (47.5%) | 32 (39.0%) |
| Total | 158 (100.0%) | 82 (100.0%) |
Real Estate Taxes by Mortgage Status in Chinook
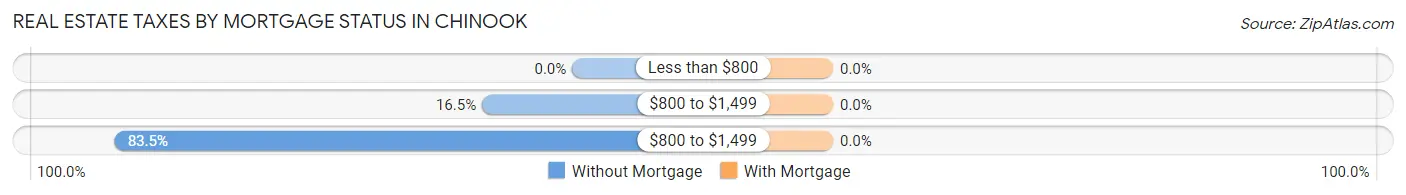
| Property Taxes | Without Mortgage | With Mortgage |
| Less than $800 | 0 (0.0%) | 0 (0.0%) |
| $800 to $1,499 | 26 (16.5%) | 0 (0.0%) |
| $800 to $1,499 | 132 (83.5%) | 0 (0.0%) |
| Total | 158 (100.0%) | 82 (100.0%) |
Health & Disability in Chinook
Health Insurance Coverage by Age in Chinook
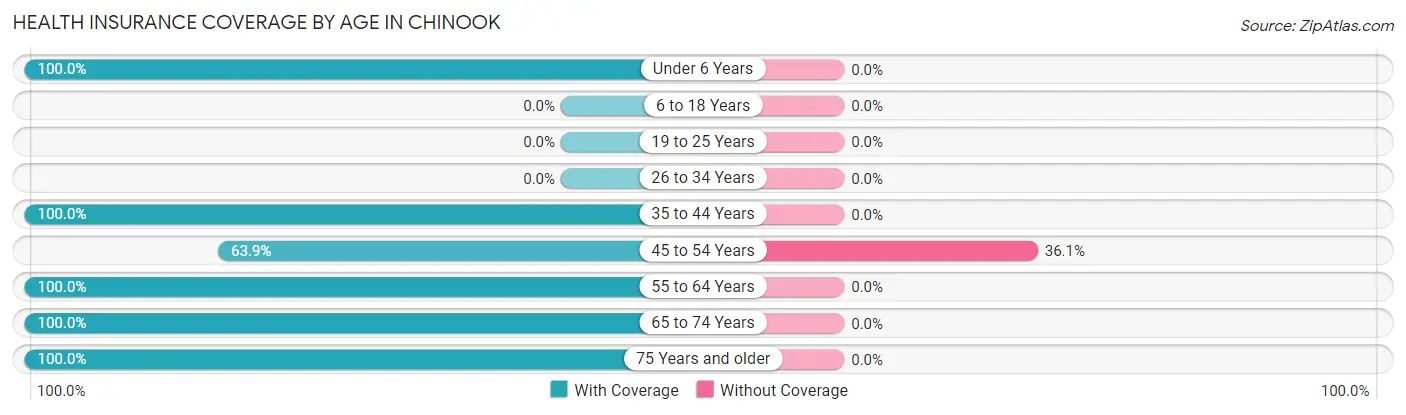
| Age Bracket | With Coverage | Without Coverage |
| Under 6 Years | 52 (100.0%) | 0 (0.0%) |
| 6 to 18 Years | 0 (0.0%) | 0 (0.0%) |
| 19 to 25 Years | 0 (0.0%) | 0 (0.0%) |
| 26 to 34 Years | 0 (0.0%) | 0 (0.0%) |
| 35 to 44 Years | 32 (100.0%) | 0 (0.0%) |
| 45 to 54 Years | 101 (63.9%) | 57 (36.1%) |
| 55 to 64 Years | 77 (100.0%) | 0 (0.0%) |
| 65 to 74 Years | 25 (100.0%) | 0 (0.0%) |
| 75 Years and older | 103 (100.0%) | 0 (0.0%) |
| Total | 390 (87.3%) | 57 (12.8%) |
Health Insurance Coverage by Citizenship Status in Chinook
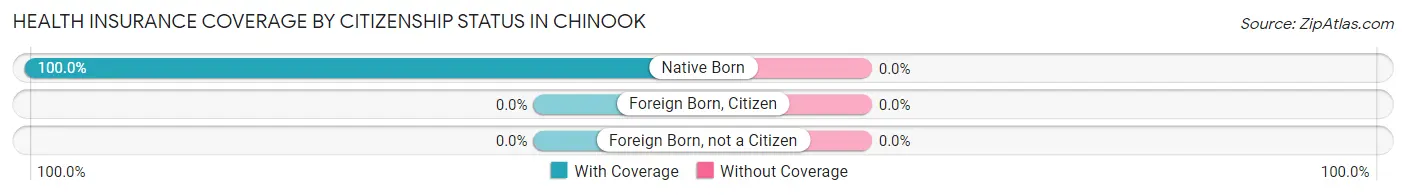
| Citizenship Status | With Coverage | Without Coverage |
| Native Born | 52 (100.0%) | 0 (0.0%) |
| Foreign Born, Citizen | 0 (0.0%) | 0 (0.0%) |
| Foreign Born, not a Citizen | 0 (0.0%) | 0 (0.0%) |
Health Insurance Coverage by Household Income in Chinook
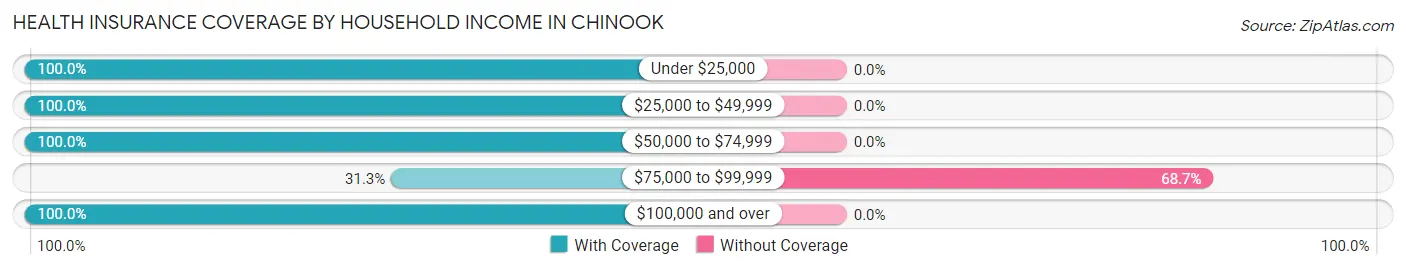
| Household Income | With Coverage | Without Coverage |
| Under $25,000 | 25 (100.0%) | 0 (0.0%) |
| $25,000 to $49,999 | 49 (100.0%) | 0 (0.0%) |
| $50,000 to $74,999 | 78 (100.0%) | 0 (0.0%) |
| $75,000 to $99,999 | 26 (31.3%) | 57 (68.7%) |
| $100,000 and over | 212 (100.0%) | 0 (0.0%) |
Public vs Private Health Insurance Coverage by Age in Chinook
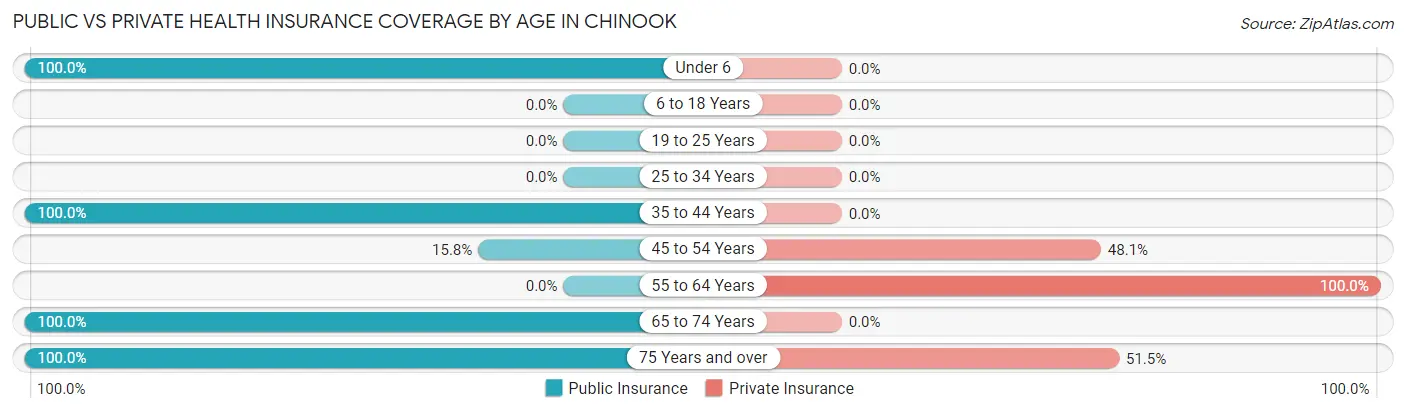
| Age Bracket | Public Insurance | Private Insurance |
| Under 6 | 52 (100.0%) | 0 (0.0%) |
| 6 to 18 Years | 0 (0.0%) | 0 (0.0%) |
| 19 to 25 Years | 0 (0.0%) | 0 (0.0%) |
| 25 to 34 Years | 0 (0.0%) | 0 (0.0%) |
| 35 to 44 Years | 32 (100.0%) | 0 (0.0%) |
| 45 to 54 Years | 25 (15.8%) | 76 (48.1%) |
| 55 to 64 Years | 0 (0.0%) | 77 (100.0%) |
| 65 to 74 Years | 25 (100.0%) | 0 (0.0%) |
| 75 Years and over | 103 (100.0%) | 53 (51.5%) |
| Total | 237 (53.0%) | 206 (46.1%) |
Disability Status by Sex by Age in Chinook
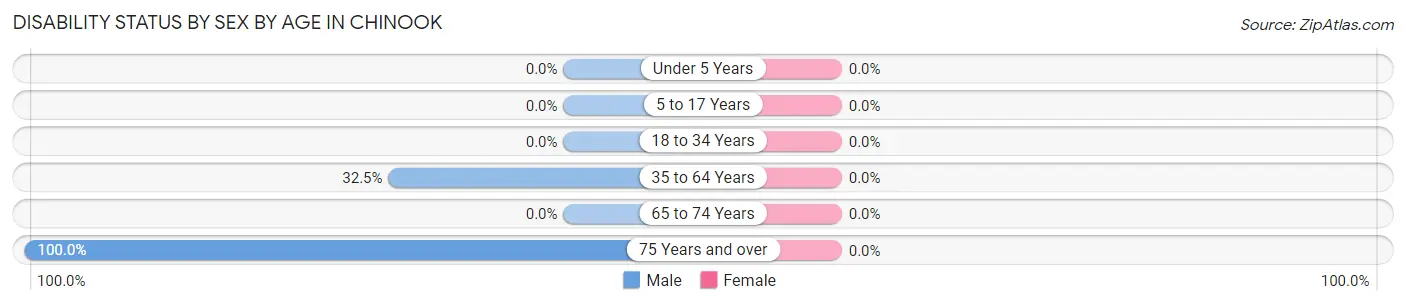
| Age Bracket | Male | Female |
| Under 5 Years | 0 (0.0%) | 0 (0.0%) |
| 5 to 17 Years | 0 (0.0%) | 0 (0.0%) |
| 18 to 34 Years | 0 (0.0%) | 0 (0.0%) |
| 35 to 64 Years | 51 (32.5%) | 0 (0.0%) |
| 65 to 74 Years | 0 (0.0%) | 0 (0.0%) |
| 75 Years and over | 26 (100.0%) | 0 (0.0%) |
Disability Class by Sex by Age in Chinook
Disability Class: Hearing Difficulty
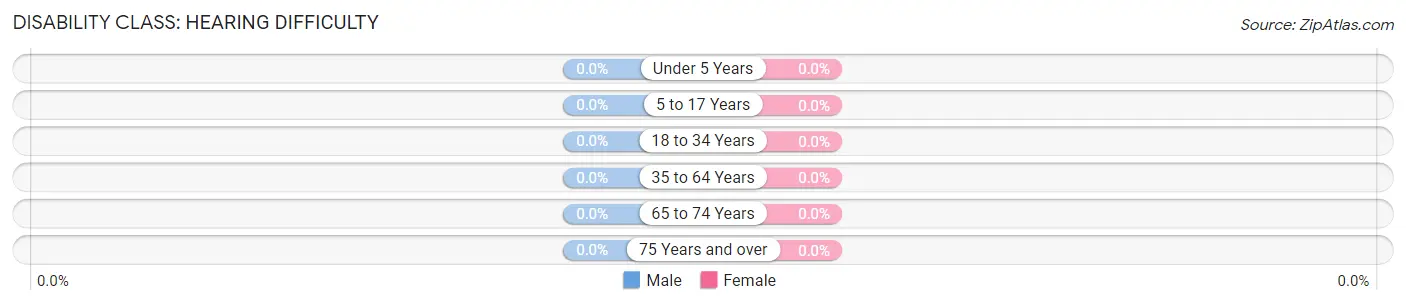
| Age Bracket | Male | Female |
| Under 5 Years | 0 (0.0%) | 0 (0.0%) |
| 5 to 17 Years | 0 (0.0%) | 0 (0.0%) |
| 18 to 34 Years | 0 (0.0%) | 0 (0.0%) |
| 35 to 64 Years | 0 (0.0%) | 0 (0.0%) |
| 65 to 74 Years | 0 (0.0%) | 0 (0.0%) |
| 75 Years and over | 0 (0.0%) | 0 (0.0%) |
Disability Class: Vision Difficulty
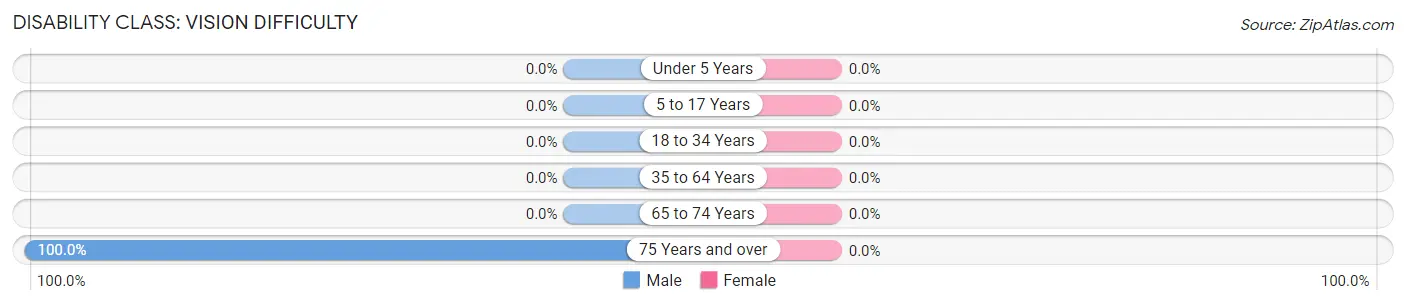
| Age Bracket | Male | Female |
| Under 5 Years | 0 (0.0%) | 0 (0.0%) |
| 5 to 17 Years | 0 (0.0%) | 0 (0.0%) |
| 18 to 34 Years | 0 (0.0%) | 0 (0.0%) |
| 35 to 64 Years | 0 (0.0%) | 0 (0.0%) |
| 65 to 74 Years | 0 (0.0%) | 0 (0.0%) |
| 75 Years and over | 26 (100.0%) | 0 (0.0%) |
Disability Class: Cognitive Difficulty
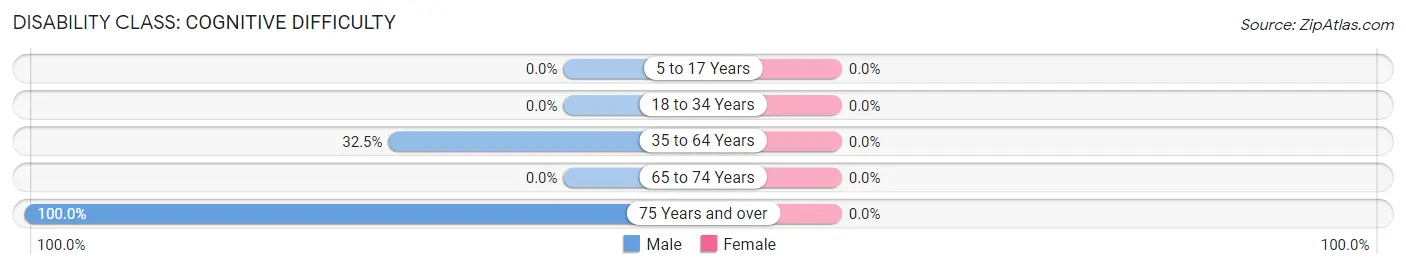
| Age Bracket | Male | Female |
| 5 to 17 Years | 0 (0.0%) | 0 (0.0%) |
| 18 to 34 Years | 0 (0.0%) | 0 (0.0%) |
| 35 to 64 Years | 51 (32.5%) | 0 (0.0%) |
| 65 to 74 Years | 0 (0.0%) | 0 (0.0%) |
| 75 Years and over | 26 (100.0%) | 0 (0.0%) |
Disability Class: Ambulatory Difficulty
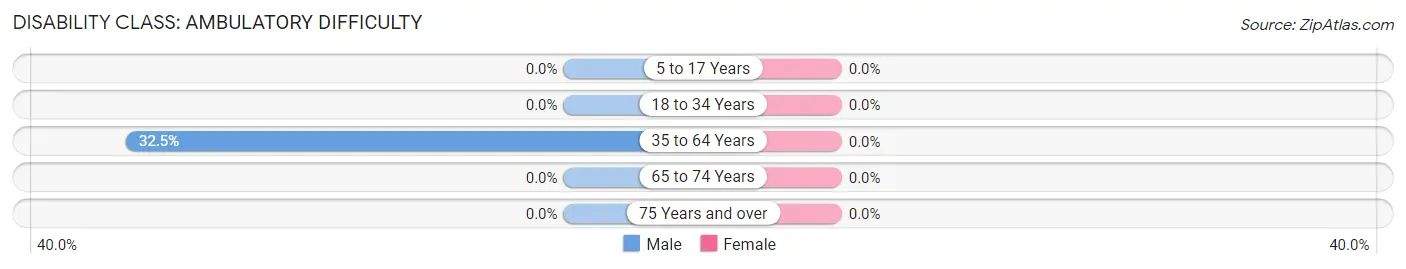
| Age Bracket | Male | Female |
| 5 to 17 Years | 0 (0.0%) | 0 (0.0%) |
| 18 to 34 Years | 0 (0.0%) | 0 (0.0%) |
| 35 to 64 Years | 51 (32.5%) | 0 (0.0%) |
| 65 to 74 Years | 0 (0.0%) | 0 (0.0%) |
| 75 Years and over | 0 (0.0%) | 0 (0.0%) |
Disability Class: Self-Care Difficulty
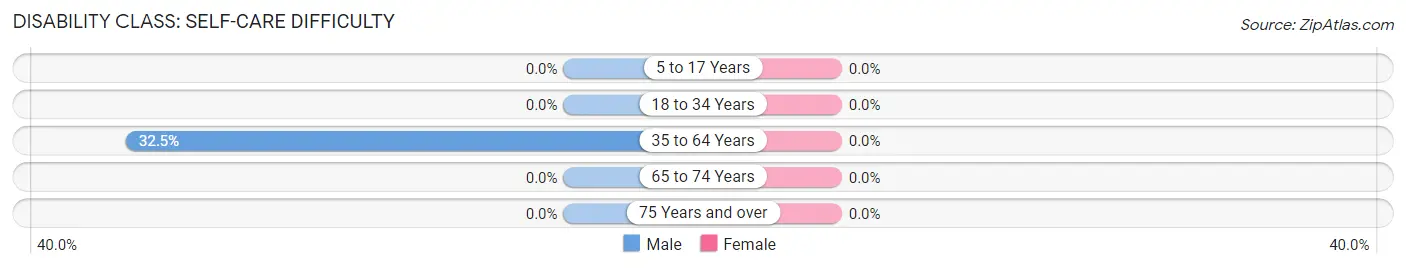
| Age Bracket | Male | Female |
| 5 to 17 Years | 0 (0.0%) | 0 (0.0%) |
| 18 to 34 Years | 0 (0.0%) | 0 (0.0%) |
| 35 to 64 Years | 51 (32.5%) | 0 (0.0%) |
| 65 to 74 Years | 0 (0.0%) | 0 (0.0%) |
| 75 Years and over | 0 (0.0%) | 0 (0.0%) |
Technology Access in Chinook
Computing Device Access in Chinook
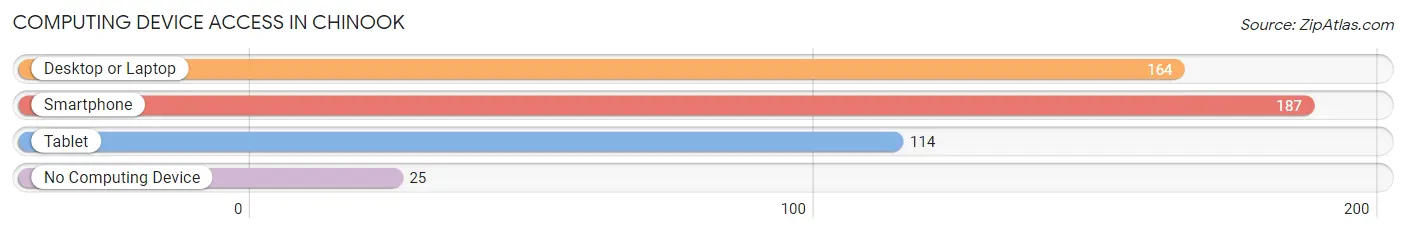
| Device Type | # Households | % Households |
| Desktop or Laptop | 164 | 68.3% |
| Smartphone | 187 | 77.9% |
| Tablet | 114 | 47.5% |
| No Computing Device | 25 | 10.4% |
| Total | 240 | 100.0% |
Internet Access in Chinook
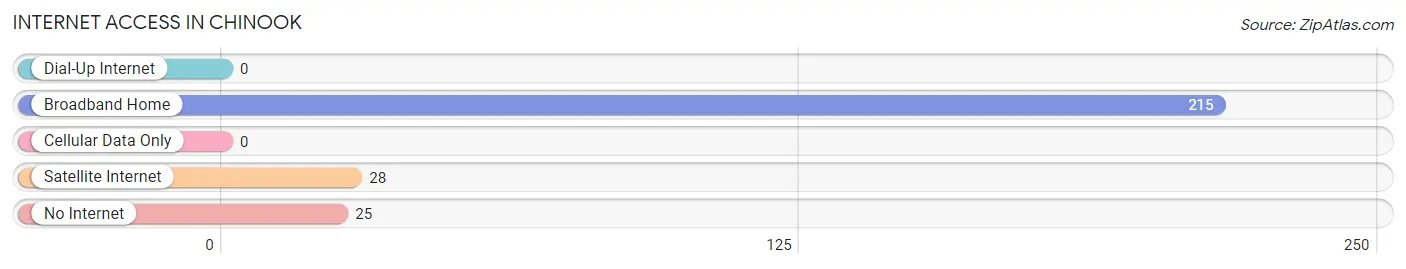
| Internet Type | # Households | % Households |
| Dial-Up Internet | 0 | 0.0% |
| Broadband Home | 215 | 89.6% |
| Cellular Data Only | 0 | 0.0% |
| Satellite Internet | 28 | 11.7% |
| No Internet | 25 | 10.4% |
| Total | 240 | 100.0% |
Chinook Summary
Chinook, Washington is a small town located in Pacific County, Washington, United States. It is situated on the north bank of the Columbia River, approximately 20 miles (32 km) east of Astoria, Oregon. The population was 545 at the 2010 census.
History
Chinook was founded in 1875 by a group of settlers from Oregon. The town was named after the Chinook people, a Native American tribe that lived in the area. The town was originally a fishing and logging community, and it was incorporated in 1891.
In the early 1900s, Chinook was a bustling port town, with a large fishing fleet and a cannery. The town was also home to a number of sawmills and logging camps. In the 1920s, the town began to decline as the logging industry moved away.
In the 1950s, Chinook began to experience a resurgence as a tourist destination. The town was home to a number of resorts and fishing lodges, and it became a popular spot for fishing and boating.
Geography
Chinook is located at 46°45′N 123°45′W (46.75, -123.75). According to the United States Census Bureau, the town has a total area of 0.7 square miles (1.8 km2), all of it land.
Economy
Chinook’s economy is largely based on tourism and fishing. The town is home to a number of resorts and fishing lodges, and it is a popular spot for fishing and boating. The town also has a number of restaurants and shops.
Demographics
As of the census of 2010, there were 545 people, 246 households, and 145 families residing in the town. The population density was 778.6 people per square mile (301.3/km2). There were 279 housing units at an average density of 400.0 per square mile (154.3/km2). The racial makeup of the town was 94.2% White, 0.2% African American, 0.7% Native American, 0.2% Asian, 0.2% Pacific Islander, 0.4% from other races, and 4.1% from two or more races. Hispanic or Latino of any race were 2.2% of the population.
There were 246 households, out of which 22.4% had children under the age of 18 living with them, 46.3% were married couples living together, 9.3% had a female householder with no husband present, and 40.7% were non-families. 34.6% of all households were made up of individuals, and 16.3% had someone living alone who was 65 years of age or older. The average household size was 2.22 and the average family size was 2.83.
In the town, the population was spread out, with 20.2% under the age of 18, 6.2% from 18 to 24, 22.2% from 25 to 44, 28.2% from 45 to 64, and 23.2% who were 65 years of age or older. The median age was 45 years. For every 100 females, there were 97.3 males. For every 100 females age 18 and over, there were 94.2 males.
The median income for a household in the town was $30,000, and the median income for a family was $36,250. Males had a median income of $30,000 versus $20,000 for females. The per capita income for the town was $17,845. About 10.2% of families and 14.2% of the population were below the poverty line, including 18.2% of those under age 18 and 8.3% of those age 65 or over.
Common Questions
What is Per Capita Income in Chinook?
Per Capita income in Chinook is $89,261.
What is the Median Family Income in Chinook?
Median Family Income in Chinook is $100,469.
What is the Median Household income in Chinook?
Median Household Income in Chinook is $86,731.
What is Income or Wage Gap in Chinook?
Income or Wage Gap in Chinook is 74.3%.
Women in Chinook earn 25.7 cents for every dollar earned by a man.
What is Inequality or Gini Index in Chinook?
Inequality or Gini Index in Chinook is 0.52.
What is the Total Population of Chinook?
Total Population of Chinook is 447.
What is the Total Male Population of Chinook?
Total Male Population of Chinook is 208.
What is the Total Female Population of Chinook?
Total Female Population of Chinook is 239.
What is the Ratio of Males per 100 Females in Chinook?
There are 87.03 Males per 100 Females in Chinook.
What is the Ratio of Females per 100 Males in Chinook?
There are 114.90 Females per 100 Males in Chinook.
What is the Median Population Age in Chinook?
Median Population Age in Chinook is 54.3 Years.
What is the Average Family Size in Chinook
Average Family Size in Chinook is 2.4 People.
What is the Average Household Size in Chinook
Average Household Size in Chinook is 1.9 People.
How Large is the Labor Force in Chinook?
There are 235 People in the Labor Forcein in Chinook.
What is the Percentage of People in the Labor Force in Chinook?
59.5% of People are in the Labor Force in Chinook.