George, WA Map & Demographics
George Map
George Overview
$14,729
PER CAPITA INCOME
$56,250
AVG FAMILY INCOME
$48,333
AVG HOUSEHOLD INCOME
20.5%
WAGE / INCOME GAP [ % ]
79.5¢/ $1
WAGE / INCOME GAP [ $ ]
0.36
INEQUALITY / GINI INDEX
892
TOTAL POPULATION
452
MALE POPULATION
440
FEMALE POPULATION
102.73
MALES / 100 FEMALES
97.35
FEMALES / 100 MALES
26.8
MEDIAN AGE
4.2
AVG FAMILY SIZE
3.9
AVG HOUSEHOLD SIZE
418
LABOR FORCE [ PEOPLE ]
68.0%
PERCENT IN LABOR FORCE
9.3%
UNEMPLOYMENT RATE
George Zip Codes
George Area Codes
Income in George
Income Overview in George
Per Capita Income in George is $14,729, while median incomes of families and households are $56,250 and $48,333 respectively.
| Characteristic | Number | Measure |
| Per Capita Income | 892 | $14,729 |
| Median Family Income | 194 | $56,250 |
| Mean Family Income | 194 | $64,578 |
| Median Household Income | 228 | $48,333 |
| Mean Household Income | 228 | $60,986 |
| Income Deficit | 194 | $0 |
| Wage / Income Gap (%) | 892 | 20.48% |
| Wage / Income Gap ($) | 892 | 79.52¢ per $1 |
| Gini / Inequality Index | 892 | 0.36 |
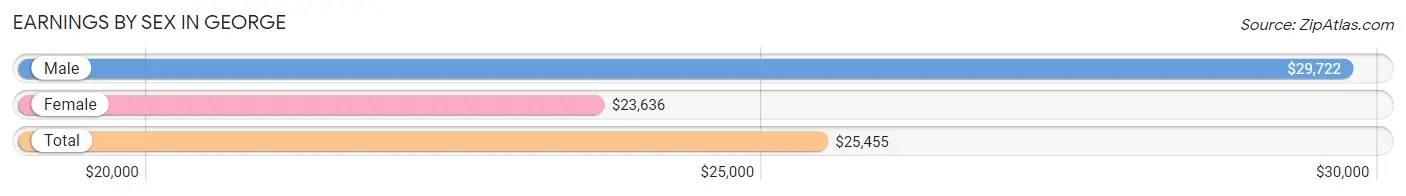
Earnings by Sex in George
Average Earnings in George are $25,455, $29,722 for men and $23,636 for women, a difference of 20.5%.
| Sex | Number | Average Earnings |
| Male | 232 (53.5%) | $29,722 |
| Female | 202 (46.5%) | $23,636 |
| Total | 434 (100.0%) | $25,455 |
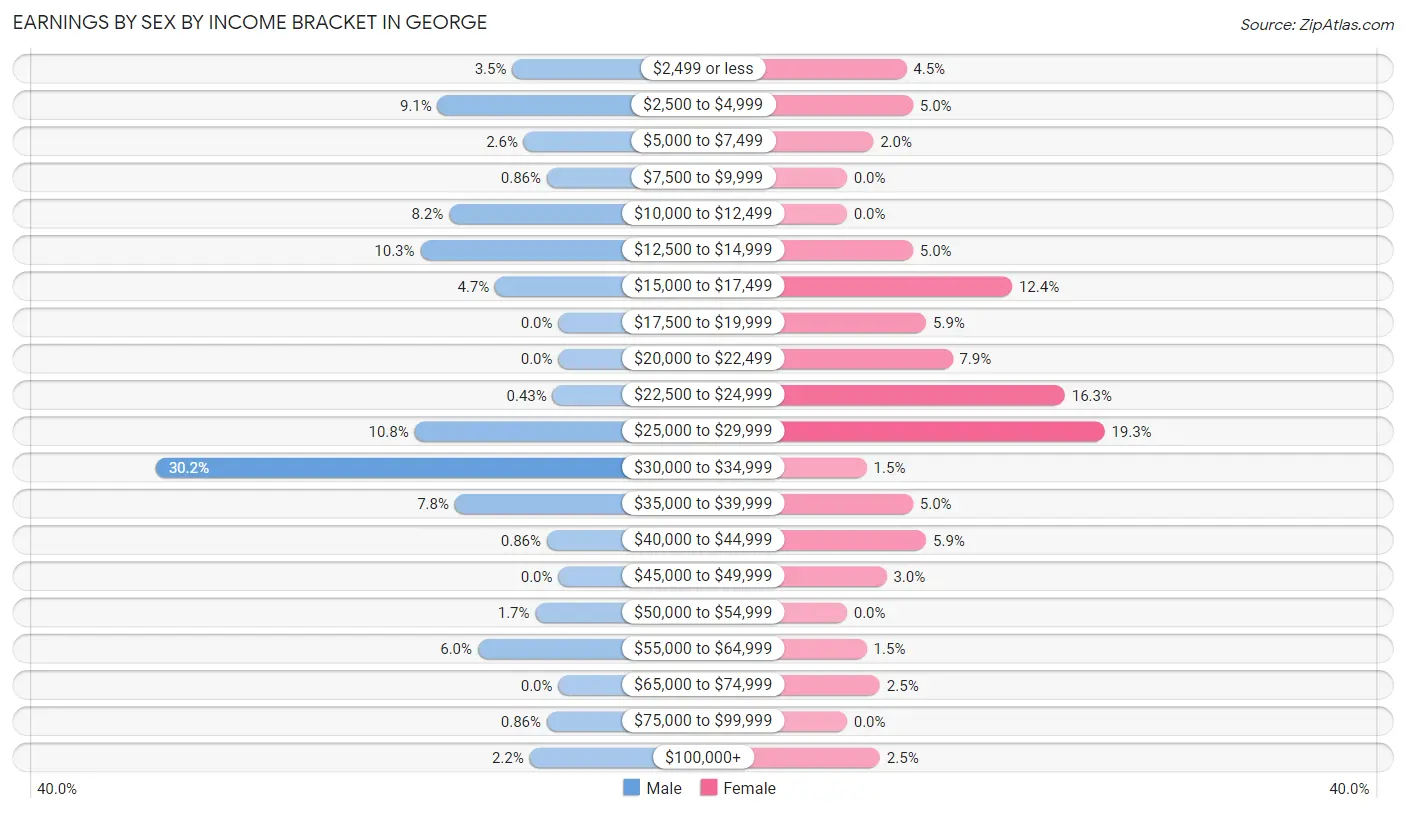
Earnings by Sex by Income Bracket in George
The most common earnings brackets in George are $30,000 to $34,999 for men (70 | 30.2%) and $25,000 to $29,999 for women (39 | 19.3%).
| Income | Male | Female |
| $2,499 or less | 8 (3.5%) | 9 (4.5%) |
| $2,500 to $4,999 | 21 (9.0%) | 10 (5.0%) |
| $5,000 to $7,499 | 6 (2.6%) | 4 (2.0%) |
| $7,500 to $9,999 | 2 (0.9%) | 0 (0.0%) |
| $10,000 to $12,499 | 19 (8.2%) | 0 (0.0%) |
| $12,500 to $14,999 | 24 (10.3%) | 10 (5.0%) |
| $15,000 to $17,499 | 11 (4.7%) | 25 (12.4%) |
| $17,500 to $19,999 | 0 (0.0%) | 12 (5.9%) |
| $20,000 to $22,499 | 0 (0.0%) | 16 (7.9%) |
| $22,500 to $24,999 | 1 (0.4%) | 33 (16.3%) |
| $25,000 to $29,999 | 25 (10.8%) | 39 (19.3%) |
| $30,000 to $34,999 | 70 (30.2%) | 3 (1.5%) |
| $35,000 to $39,999 | 18 (7.8%) | 10 (5.0%) |
| $40,000 to $44,999 | 2 (0.9%) | 12 (5.9%) |
| $45,000 to $49,999 | 0 (0.0%) | 6 (3.0%) |
| $50,000 to $54,999 | 4 (1.7%) | 0 (0.0%) |
| $55,000 to $64,999 | 14 (6.0%) | 3 (1.5%) |
| $65,000 to $74,999 | 0 (0.0%) | 5 (2.5%) |
| $75,000 to $99,999 | 2 (0.9%) | 0 (0.0%) |
| $100,000+ | 5 (2.2%) | 5 (2.5%) |
| Total | 232 (100.0%) | 202 (100.0%) |
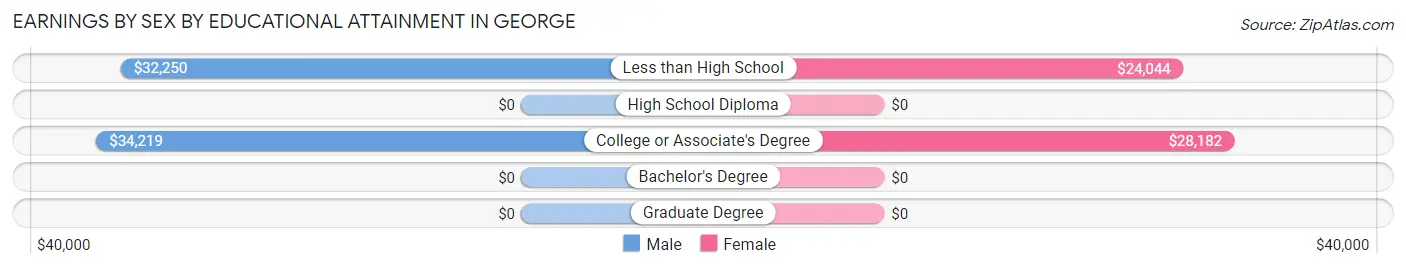
Earnings by Sex by Educational Attainment in George
Average earnings in George are $31,452 for men and $25,147 for women, a difference of 20.1%. Men with an educational attainment of college or associate's degree enjoy the highest average annual earnings of $34,219, while those with less than high school education earn the least with $32,250. Women with an educational attainment of college or associate's degree earn the most with the average annual earnings of $28,182, while those with less than high school education have the smallest earnings of $24,044.
| Educational Attainment | Male Income | Female Income |
| Less than High School | $32,250 | $24,044 |
| High School Diploma | - | - |
| College or Associate's Degree | $34,219 | $28,182 |
| Bachelor's Degree | - | - |
| Graduate Degree | - | - |
| Total | $31,452 | $25,147 |
Family Income in George
Family Income Brackets in George
According to the George family income data, there are 54 families falling into the $25,000 to $34,999 income range, which is the most common income bracket and makes up 27.8% of all families.
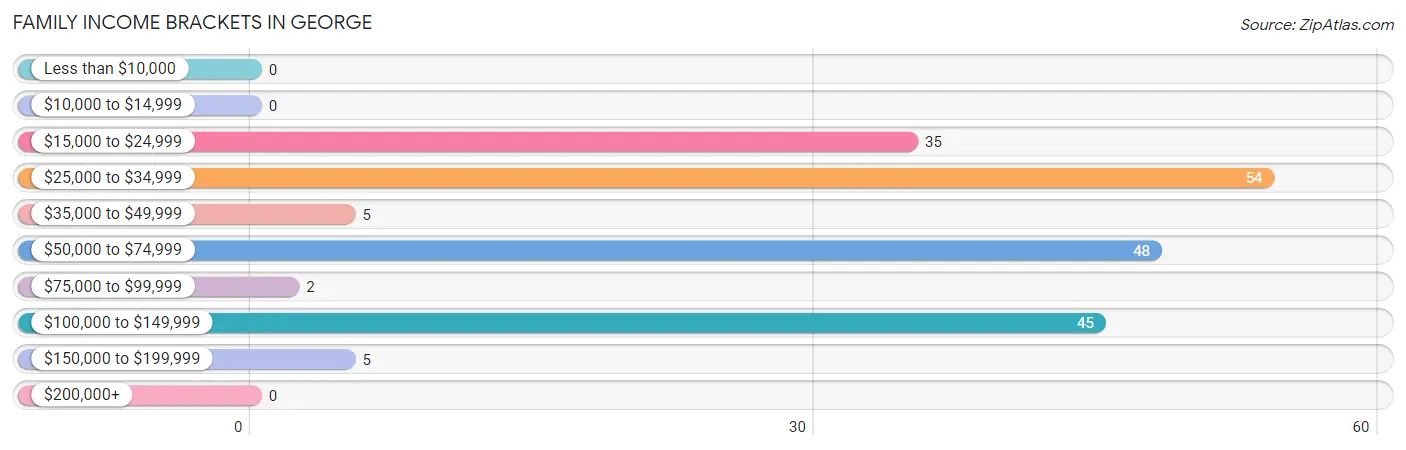
| Income Bracket | # Families | % Families |
| Less than $10,000 | 0 | 0.0% |
| $10,000 to $14,999 | 0 | 0.0% |
| $15,000 to $24,999 | 35 | 18.0% |
| $25,000 to $34,999 | 54 | 27.8% |
| $35,000 to $49,999 | 5 | 2.6% |
| $50,000 to $74,999 | 48 | 24.7% |
| $75,000 to $99,999 | 2 | 1.0% |
| $100,000 to $149,999 | 45 | 23.2% |
| $150,000 to $199,999 | 5 | 2.6% |
| $200,000+ | 0 | 0.0% |
Family Income by Famaliy Size in George
3-person families (32 | 16.5%) account for the highest median family income in George with $33,400 per family, while 3-person families (32 | 16.5%) have the highest median income of $11,133 per family member.
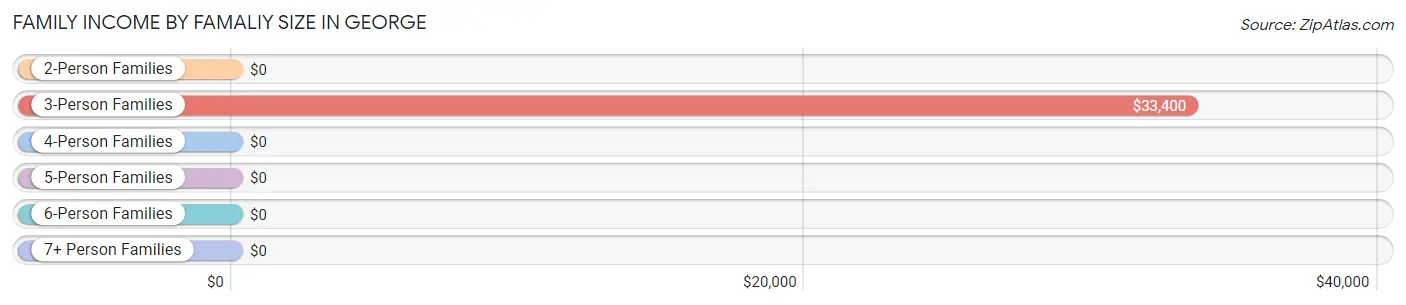
| Income Bracket | # Families | Median Income |
| 2-Person Families | 40 (20.6%) | $0 |
| 3-Person Families | 32 (16.5%) | $33,400 |
| 4-Person Families | 49 (25.3%) | $0 |
| 5-Person Families | 12 (6.2%) | $0 |
| 6-Person Families | 26 (13.4%) | $0 |
| 7+ Person Families | 35 (18.0%) | $0 |
| Total | 194 (100.0%) | $56,250 |
Family Income by Number of Earners in George
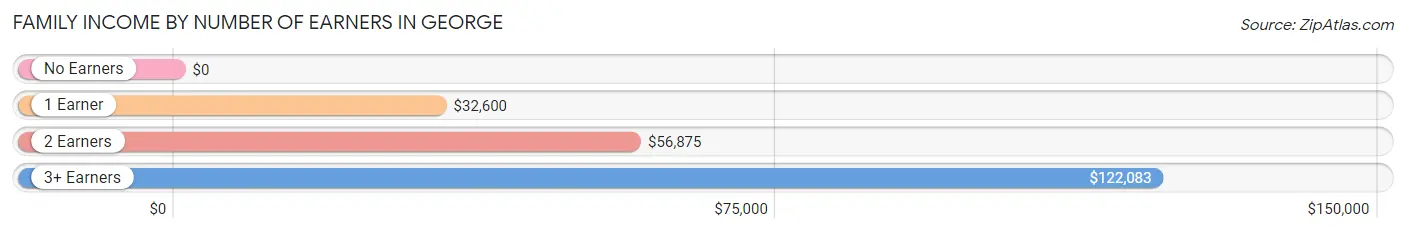
| Number of Earners | # Families | Median Income |
| No Earners | 5 (2.6%) | $0 |
| 1 Earner | 66 (34.0%) | $32,600 |
| 2 Earners | 69 (35.6%) | $56,875 |
| 3+ Earners | 54 (27.8%) | $122,083 |
| Total | 194 (100.0%) | $56,250 |
Household Income in George
Household Income Brackets in George
With 68 households falling in the category, the $25,000 to $34,999 income range is the most frequent in George, accounting for 29.8% of all households.
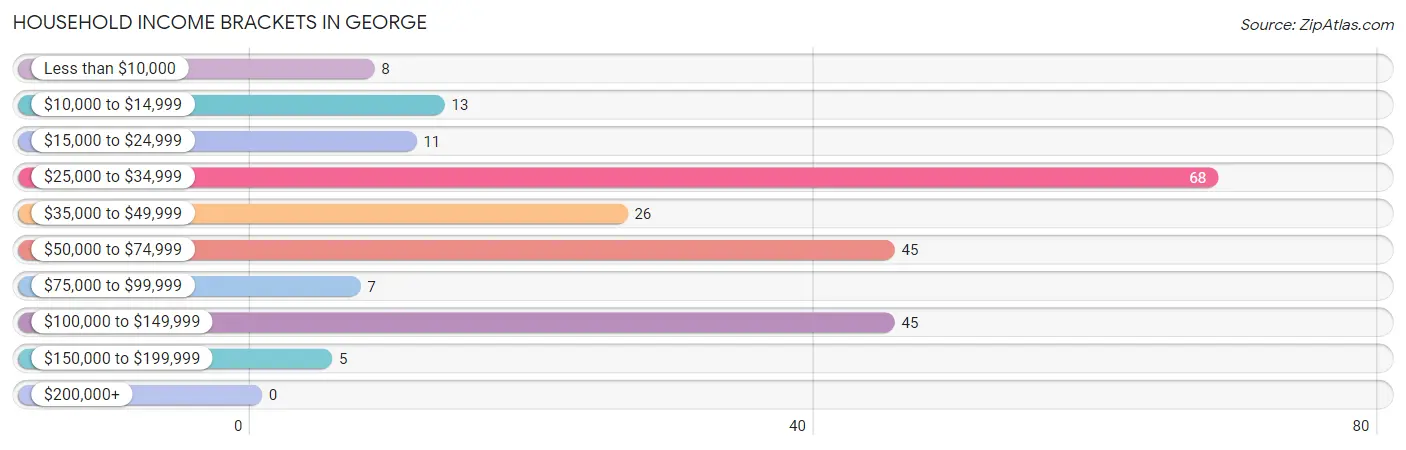
| Income Bracket | # Households | % Households |
| Less than $10,000 | 8 | 3.5% |
| $10,000 to $14,999 | 13 | 5.7% |
| $15,000 to $24,999 | 11 | 4.8% |
| $25,000 to $34,999 | 68 | 29.8% |
| $35,000 to $49,999 | 26 | 11.4% |
| $50,000 to $74,999 | 45 | 19.7% |
| $75,000 to $99,999 | 7 | 3.1% |
| $100,000 to $149,999 | 45 | 19.7% |
| $150,000 to $199,999 | 5 | 2.2% |
| $200,000+ | 0 | 0.0% |
Household Income by Householder Age in George
The median household income in George is $48,333, with the highest median household income of $63,875 found in the 45 to 64 years age bracket for the primary householder. A total of 72 households (31.6%) fall into this category. Meanwhile, the 25 to 44 years age bracket for the primary householder has the lowest median household income of $0, with 90 households (39.5%) in this group.
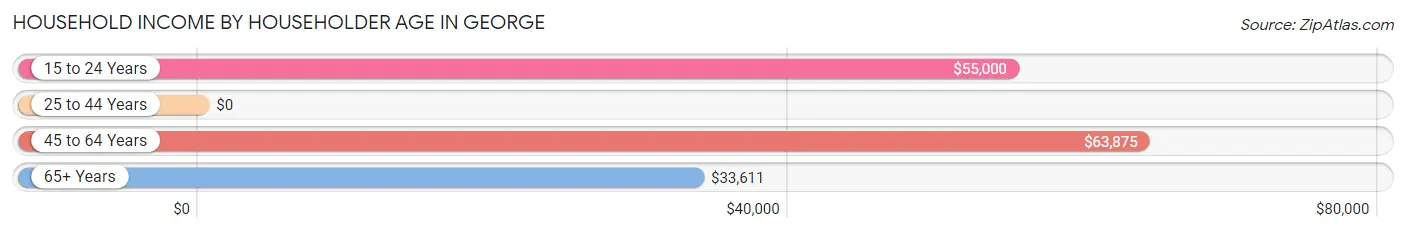
| Income Bracket | # Households | Median Income |
| 15 to 24 Years | 12 (5.3%) | $55,000 |
| 25 to 44 Years | 90 (39.5%) | $0 |
| 45 to 64 Years | 72 (31.6%) | $63,875 |
| 65+ Years | 54 (23.7%) | $33,611 |
| Total | 228 (100.0%) | $48,333 |
Poverty in George
Income Below Poverty by Sex and Age in George
With 11.5% poverty level for males and 12.7% for females among the residents of George, 6 to 11 year old males and 6 to 11 year old females are the most vulnerable to poverty, with 11 males (50.0%) and 11 females (55.0%) in their respective age groups living below the poverty level.
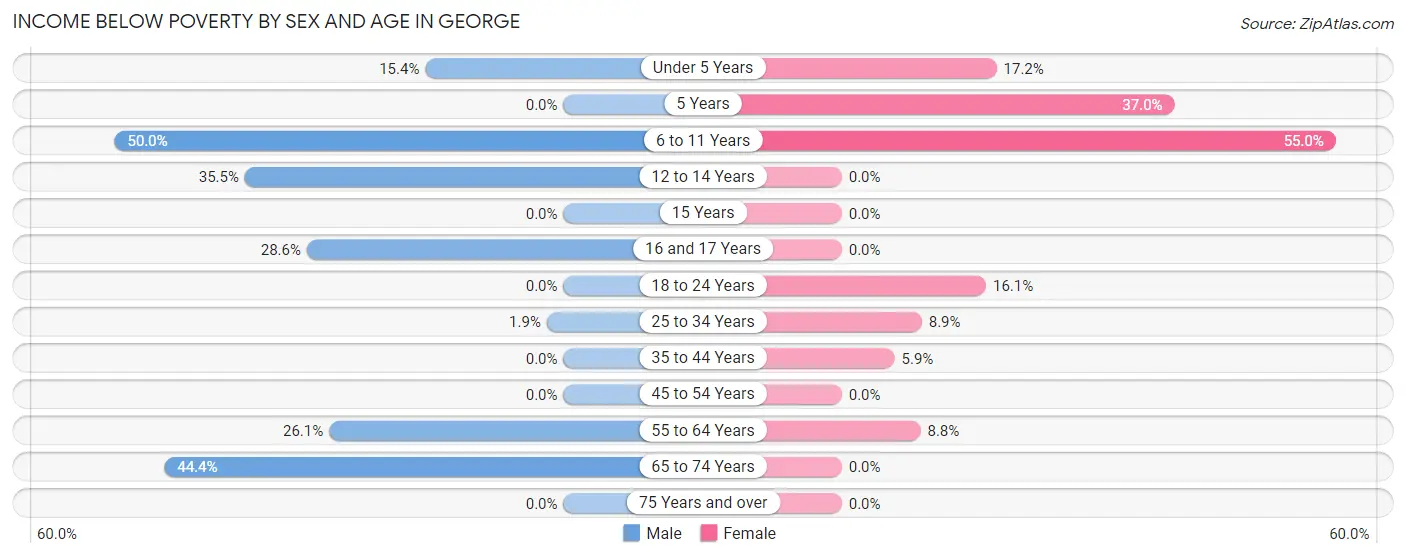
| Age Bracket | Male | Female |
| Under 5 Years | 12 (15.4%) | 10 (17.2%) |
| 5 Years | 0 (0.0%) | 10 (37.0%) |
| 6 to 11 Years | 11 (50.0%) | 11 (55.0%) |
| 12 to 14 Years | 11 (35.5%) | 0 (0.0%) |
| 15 Years | 0 (0.0%) | 0 (0.0%) |
| 16 and 17 Years | 2 (28.6%) | 0 (0.0%) |
| 18 to 24 Years | 0 (0.0%) | 9 (16.1%) |
| 25 to 34 Years | 2 (1.8%) | 9 (8.9%) |
| 35 to 44 Years | 0 (0.0%) | 2 (5.9%) |
| 45 to 54 Years | 0 (0.0%) | 0 (0.0%) |
| 55 to 64 Years | 6 (26.1%) | 5 (8.8%) |
| 65 to 74 Years | 8 (44.4%) | 0 (0.0%) |
| 75 Years and over | 0 (0.0%) | 0 (0.0%) |
| Total | 52 (11.5%) | 56 (12.7%) |
Income Above Poverty by Sex and Age in George
According to the poverty statistics in George, males aged 5 years and females aged 12 to 14 years are the age groups that are most secure financially, with 100.0% of males and 100.0% of females in these age groups living above the poverty line.
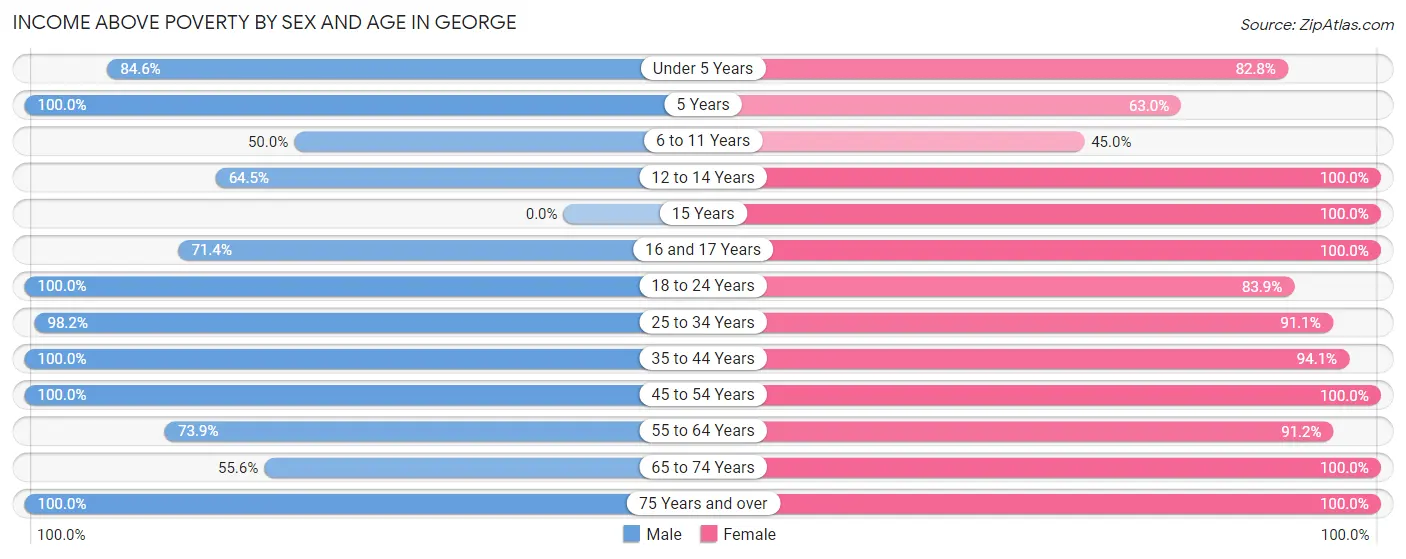
| Age Bracket | Male | Female |
| Under 5 Years | 66 (84.6%) | 48 (82.8%) |
| 5 Years | 12 (100.0%) | 17 (63.0%) |
| 6 to 11 Years | 11 (50.0%) | 9 (45.0%) |
| 12 to 14 Years | 20 (64.5%) | 26 (100.0%) |
| 15 Years | 0 (0.0%) | 3 (100.0%) |
| 16 and 17 Years | 5 (71.4%) | 5 (100.0%) |
| 18 to 24 Years | 65 (100.0%) | 47 (83.9%) |
| 25 to 34 Years | 106 (98.2%) | 92 (91.1%) |
| 35 to 44 Years | 16 (100.0%) | 32 (94.1%) |
| 45 to 54 Years | 45 (100.0%) | 38 (100.0%) |
| 55 to 64 Years | 17 (73.9%) | 52 (91.2%) |
| 65 to 74 Years | 10 (55.6%) | 7 (100.0%) |
| 75 Years and over | 27 (100.0%) | 8 (100.0%) |
| Total | 400 (88.5%) | 384 (87.3%) |
Income Below Poverty Among Married-Couple Families in George
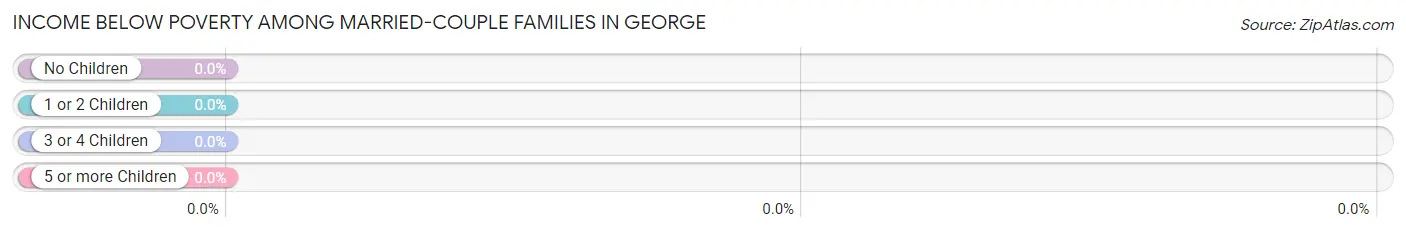
| Children | Above Poverty | Below Poverty |
| No Children | 21 (100.0%) | 0 (0.0%) |
| 1 or 2 Children | 86 (100.0%) | 0 (0.0%) |
| 3 or 4 Children | 2 (100.0%) | 0 (0.0%) |
| 5 or more Children | 14 (100.0%) | 0 (0.0%) |
| Total | 123 (100.0%) | 0 (0.0%) |
Income Below Poverty Among Single-Parent Households in George
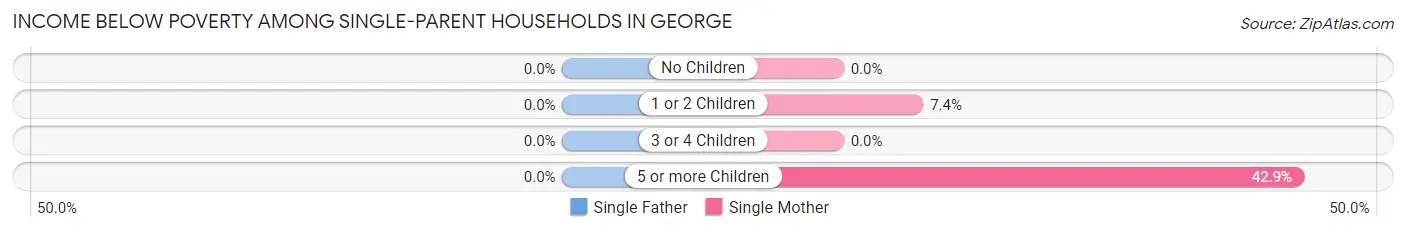
| Children | Single Father | Single Mother |
| No Children | 0 (0.0%) | 0 (0.0%) |
| 1 or 2 Children | 0 (0.0%) | 2 (7.4%) |
| 3 or 4 Children | 0 (0.0%) | 0 (0.0%) |
| 5 or more Children | 0 (0.0%) | 9 (42.9%) |
| Total | 0 (0.0%) | 11 (19.0%) |
Income Below Poverty Among Married-Couple vs Single-Parent Households in George
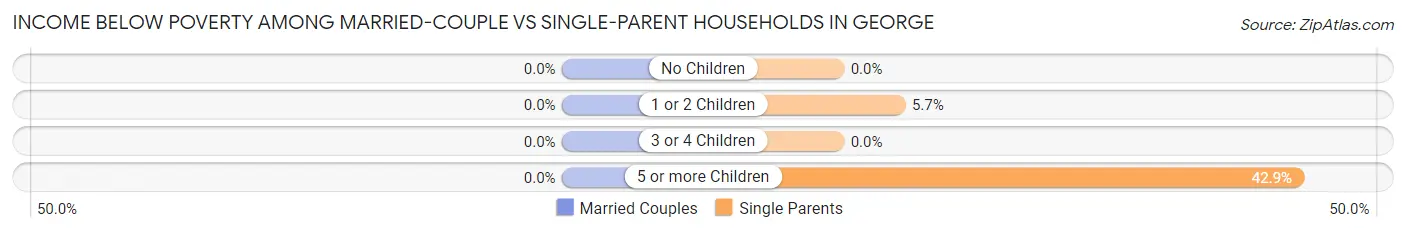
| Children | Married-Couple Families | Single-Parent Households |
| No Children | 0 (0.0%) | 0 (0.0%) |
| 1 or 2 Children | 0 (0.0%) | 2 (5.7%) |
| 3 or 4 Children | 0 (0.0%) | 0 (0.0%) |
| 5 or more Children | 0 (0.0%) | 9 (42.9%) |
| Total | 0 (0.0%) | 11 (15.5%) |
Race in George
The most populous races in George are Hispanic or Latino (794 | 89.0%), Some other Race (374 | 41.9%), and White / Caucasian (309 | 34.6%).
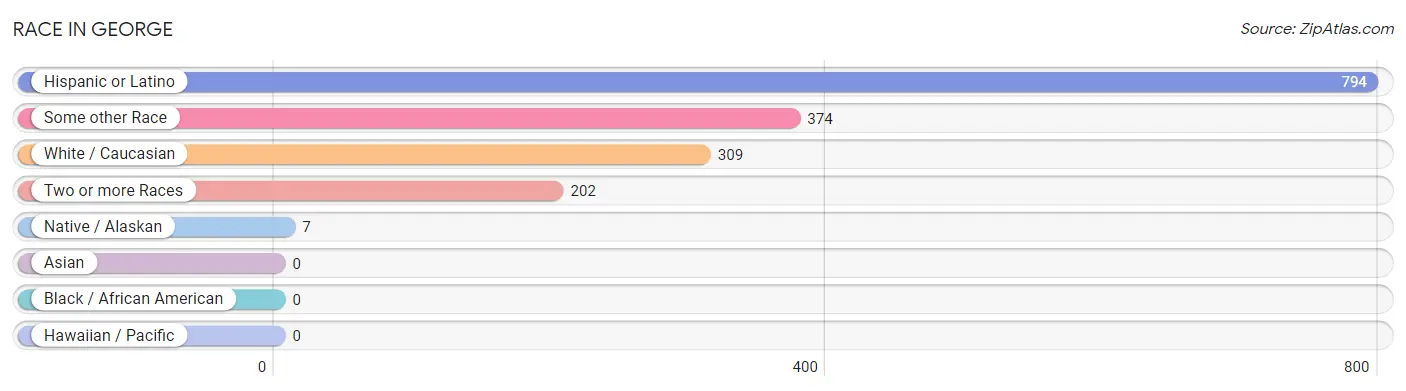
| Race | # Population | % Population |
| Asian | 0 | 0.0% |
| Black / African American | 0 | 0.0% |
| Hawaiian / Pacific | 0 | 0.0% |
| Hispanic or Latino | 794 | 89.0% |
| Native / Alaskan | 7 | 0.8% |
| White / Caucasian | 309 | 34.6% |
| Two or more Races | 202 | 22.7% |
| Some other Race | 374 | 41.9% |
| Total | 892 | 100.0% |
Ancestry in George
The most populous ancestries reported in George are Mexican (760 | 85.2%), German (42 | 4.7%), Central American (34 | 3.8%), Salvadoran (34 | 3.8%), and Irish (14 | 1.6%), together accounting for 99.1% of all George residents.
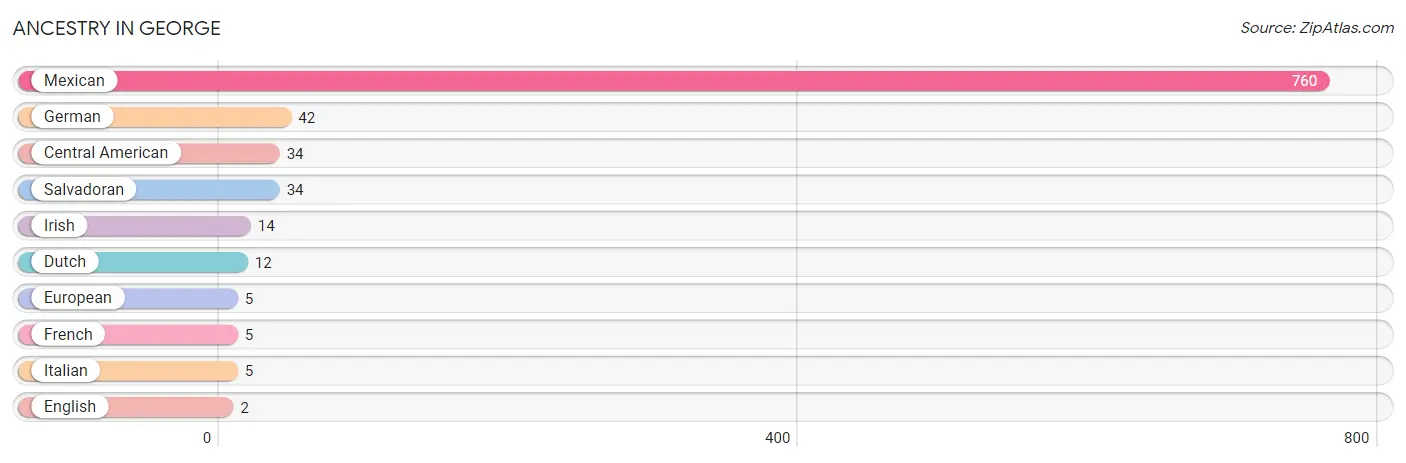
| Ancestry | # Population | % Population |
| Central American | 34 | 3.8% |
| Dutch | 12 | 1.3% |
| English | 2 | 0.2% |
| European | 5 | 0.6% |
| French | 5 | 0.6% |
| German | 42 | 4.7% |
| Irish | 14 | 1.6% |
| Italian | 5 | 0.6% |
| Mexican | 760 | 85.2% |
| Salvadoran | 34 | 3.8% | View All 10 Rows |
Immigrants in George
The most numerous immigrant groups reported in George came from Central America (363 | 40.7%), Latin America (363 | 40.7%), Mexico (338 | 37.9%), El Salvador (23 | 2.6%), and Honduras (2 | 0.2%), together accounting for 122.1% of all George residents.
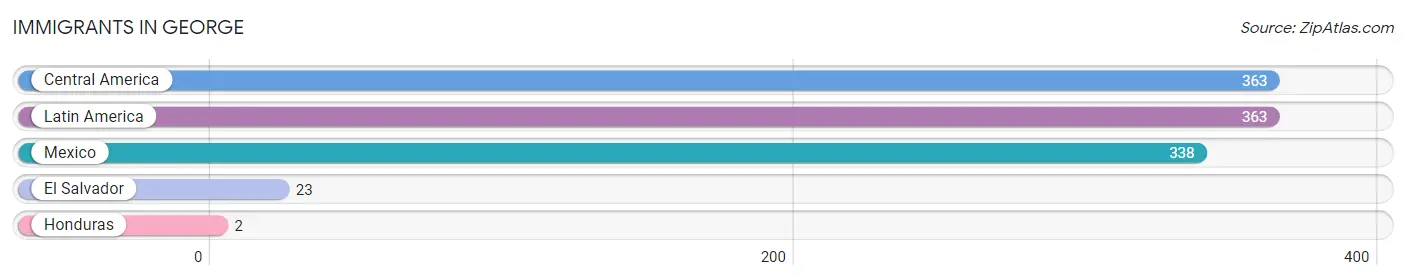
| Immigration Origin | # Population | % Population |
| Central America | 363 | 40.7% |
| El Salvador | 23 | 2.6% |
| Honduras | 2 | 0.2% |
| Latin America | 363 | 40.7% |
| Mexico | 338 | 37.9% | View All 5 Rows |
Sex and Age in George
Sex and Age in George
The most populous age groups in George are Under 5 Years (78 | 17.3%) for men and 30 to 34 Years (64 | 14.5%) for women.
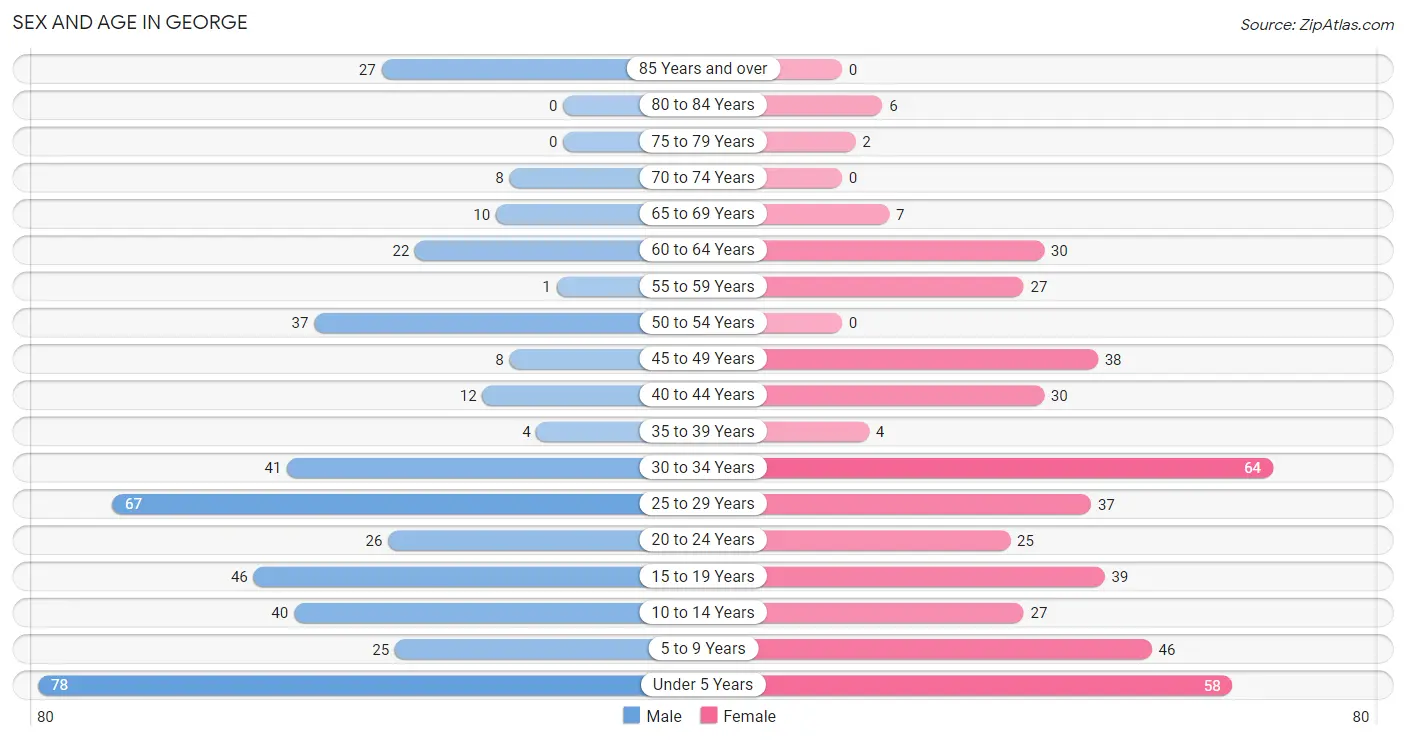
| Age Bracket | Male | Female |
| Under 5 Years | 78 (17.3%) | 58 (13.2%) |
| 5 to 9 Years | 25 (5.5%) | 46 (10.4%) |
| 10 to 14 Years | 40 (8.8%) | 27 (6.1%) |
| 15 to 19 Years | 46 (10.2%) | 39 (8.9%) |
| 20 to 24 Years | 26 (5.8%) | 25 (5.7%) |
| 25 to 29 Years | 67 (14.8%) | 37 (8.4%) |
| 30 to 34 Years | 41 (9.1%) | 64 (14.5%) |
| 35 to 39 Years | 4 (0.9%) | 4 (0.9%) |
| 40 to 44 Years | 12 (2.6%) | 30 (6.8%) |
| 45 to 49 Years | 8 (1.8%) | 38 (8.6%) |
| 50 to 54 Years | 37 (8.2%) | 0 (0.0%) |
| 55 to 59 Years | 1 (0.2%) | 27 (6.1%) |
| 60 to 64 Years | 22 (4.9%) | 30 (6.8%) |
| 65 to 69 Years | 10 (2.2%) | 7 (1.6%) |
| 70 to 74 Years | 8 (1.8%) | 0 (0.0%) |
| 75 to 79 Years | 0 (0.0%) | 2 (0.4%) |
| 80 to 84 Years | 0 (0.0%) | 6 (1.4%) |
| 85 Years and over | 27 (6.0%) | 0 (0.0%) |
| Total | 452 (100.0%) | 440 (100.0%) |
Families and Households in George
Median Family Size in George
The median family size in George is 4.20 persons per family, with single female/mother families (58 | 29.9%) accounting for the largest median family size of 4.55 persons per family. On the other hand, single male/father families (13 | 6.7%) represent the smallest median family size with 3.08 persons per family.
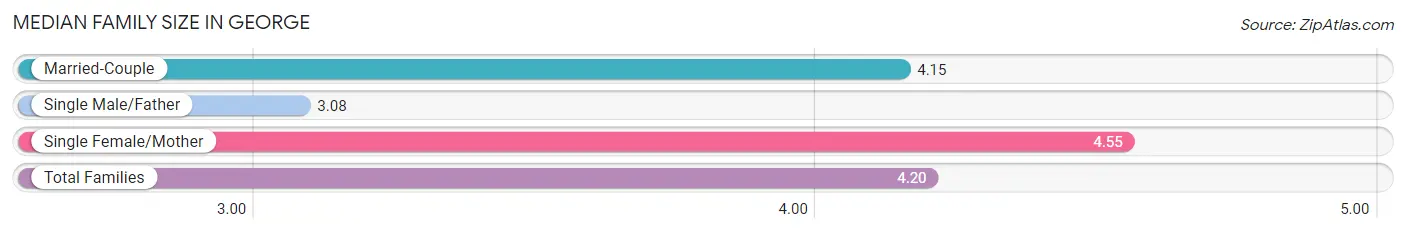
| Family Type | # Families | Family Size |
| Married-Couple | 123 (63.4%) | 4.15 |
| Single Male/Father | 13 (6.7%) | 3.08 |
| Single Female/Mother | 58 (29.9%) | 4.55 |
| Total Families | 194 (100.0%) | 4.20 |
Median Household Size in George
The median household size in George is 3.91 persons per household, with single female/mother households (58 | 25.4%) accounting for the largest median household size of 5.02 persons per household. non-family households (34 | 14.9%) represent the smallest median household size with 1.09 persons per household.
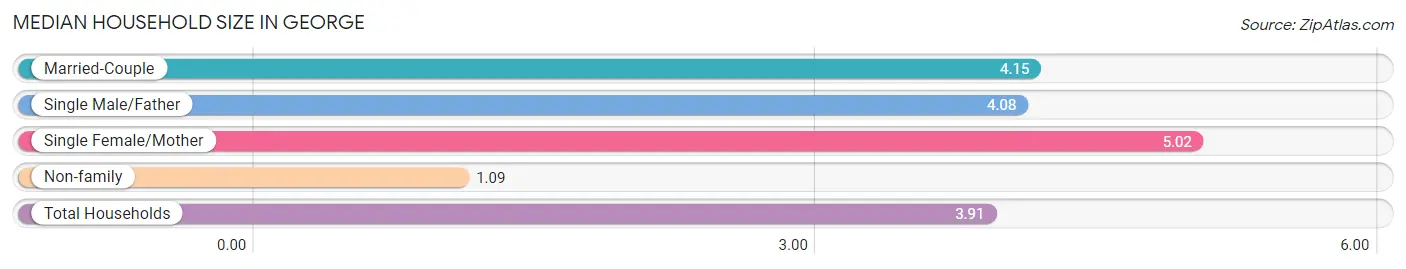
| Household Type | # Households | Household Size |
| Married-Couple | 123 (53.9%) | 4.15 |
| Single Male/Father | 13 (5.7%) | 4.08 |
| Single Female/Mother | 58 (25.4%) | 5.02 |
| Non-family | 34 (14.9%) | 1.09 |
| Total Households | 228 (100.0%) | 3.91 |
Household Size by Marriage Status in George
Out of a total of 228 households in George, 194 (85.1%) are family households, while 34 (14.9%) are nonfamily households. The most numerous type of family households are 3-person households, comprising 50, and the most common type of nonfamily households are 1-person households, comprising 30.
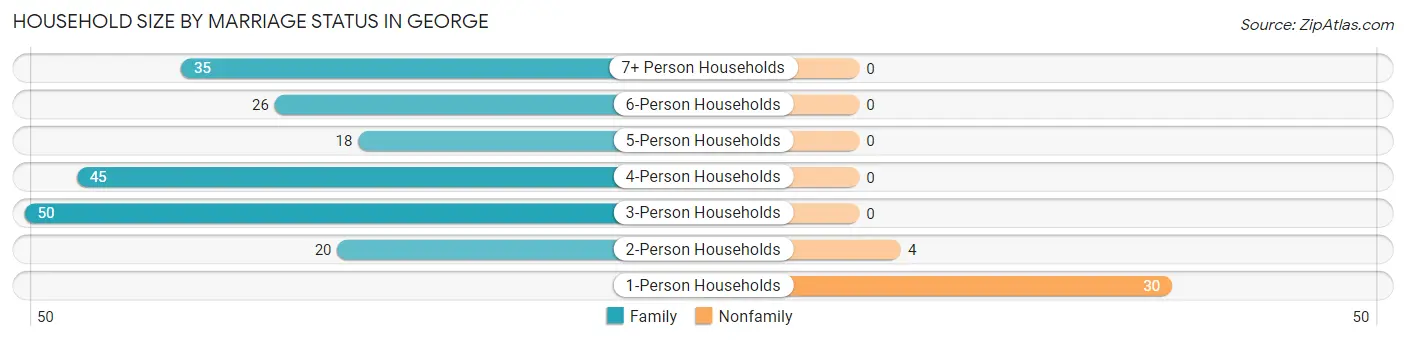
| Household Size | Family Households | Nonfamily Households |
| 1-Person Households | - | 30 (13.2%) |
| 2-Person Households | 20 (8.8%) | 4 (1.8%) |
| 3-Person Households | 50 (21.9%) | 0 (0.0%) |
| 4-Person Households | 45 (19.7%) | 0 (0.0%) |
| 5-Person Households | 18 (7.9%) | 0 (0.0%) |
| 6-Person Households | 26 (11.4%) | 0 (0.0%) |
| 7+ Person Households | 35 (15.3%) | 0 (0.0%) |
| Total | 194 (85.1%) | 34 (14.9%) |
Female Fertility in George
Fertility by Age in George
Average fertility rate in George is 59.0 births per 1,000 women. Women in the age bracket of 20 to 34 years have the highest fertility rate with 111.0 births per 1,000 women. Women in the age bracket of 20 to 34 years acount for 100.0% of all women with births.
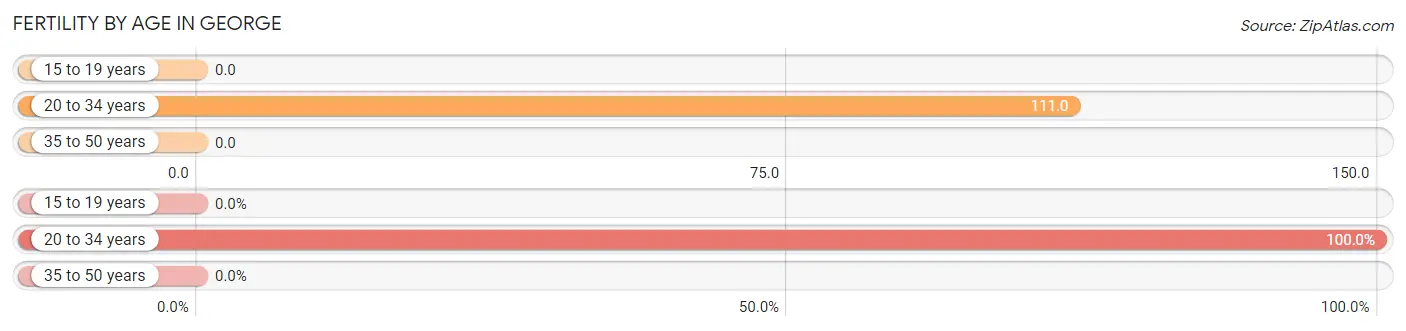
| Age Bracket | Women with Births | Births / 1,000 Women |
| 15 to 19 years | 0 (0.0%) | 0.0 |
| 20 to 34 years | 14 (100.0%) | 111.0 |
| 35 to 50 years | 0 (0.0%) | 0.0 |
| Total | 14 (100.0%) | 59.0 |
Fertility by Age by Marriage Status in George
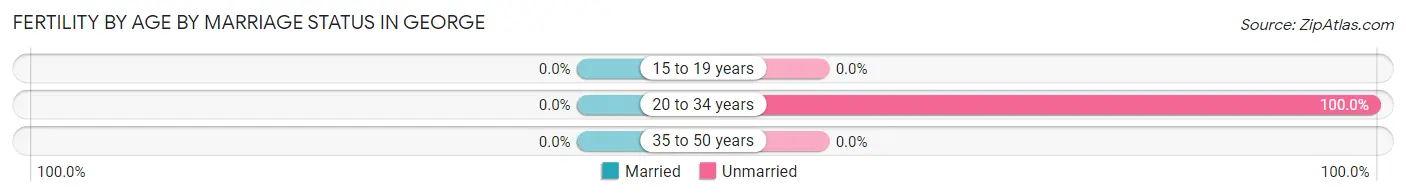
| Age Bracket | Married | Unmarried |
| 15 to 19 years | 0 (0.0%) | 0 (0.0%) |
| 20 to 34 years | 0 (0.0%) | 14 (100.0%) |
| 35 to 50 years | 0 (0.0%) | 0 (0.0%) |
| Total | 0 (0.0%) | 14 (100.0%) |
Fertility by Education in George
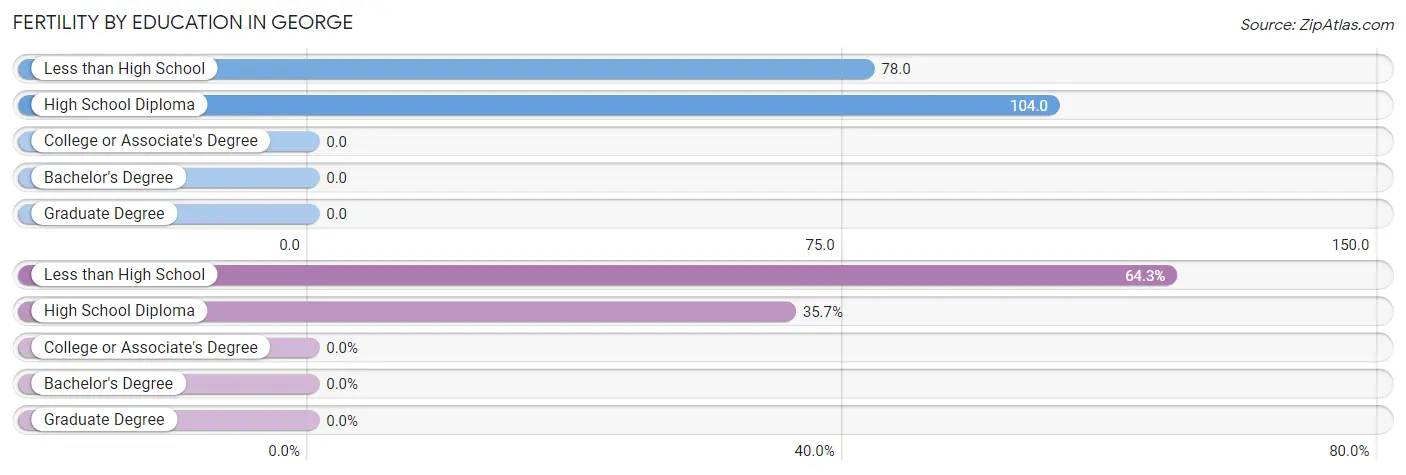
| Educational Attainment | Women with Births | Births / 1,000 Women |
| Less than High School | 9 (64.3%) | 78.0 |
| High School Diploma | 5 (35.7%) | 104.0 |
| College or Associate's Degree | 0 (0.0%) | 0.0 |
| Bachelor's Degree | 0 (0.0%) | 0.0 |
| Graduate Degree | 0 (0.0%) | 0.0 |
| Total | 14 (100.0%) | 59.0 |
Fertility by Education by Marriage Status in George
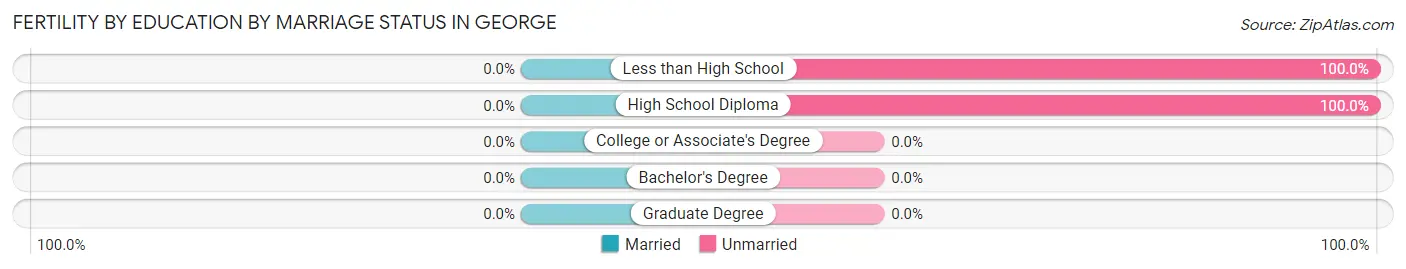
| Educational Attainment | Married | Unmarried |
| Less than High School | 0 (0.0%) | 9 (100.0%) |
| High School Diploma | 0 (0.0%) | 5 (100.0%) |
| College or Associate's Degree | 0 (0.0%) | 0 (0.0%) |
| Bachelor's Degree | 0 (0.0%) | 0 (0.0%) |
| Graduate Degree | 0 (0.0%) | 0 (0.0%) |
| Total | 0 (0.0%) | 14 (100.0%) |
Employment Characteristics in George
Employment by Class of Employer in George
Among the 379 employed individuals in George, private company employees (344 | 90.8%), local government employees (21 | 5.5%), and state government employees (12 | 3.2%) make up the most common classes of employment.
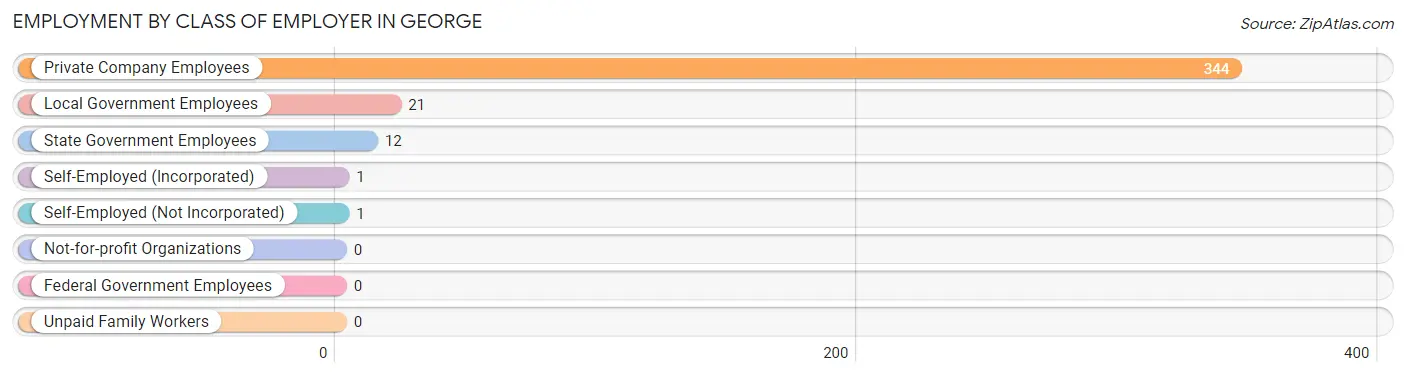
| Employer Class | # Employees | % Employees |
| Private Company Employees | 344 | 90.8% |
| Self-Employed (Incorporated) | 1 | 0.3% |
| Self-Employed (Not Incorporated) | 1 | 0.3% |
| Not-for-profit Organizations | 0 | 0.0% |
| Local Government Employees | 21 | 5.5% |
| State Government Employees | 12 | 3.2% |
| Federal Government Employees | 0 | 0.0% |
| Unpaid Family Workers | 0 | 0.0% |
| Total | 379 | 100.0% |
Employment Status by Age in George
According to the labor force statistics for George, out of the total population over 16 years of age (615), 68.0% or 418 individuals are in the labor force, with 9.3% or 39 of them unemployed. The age group with the highest labor force participation rate is 25 to 29 years, with 100.0% or 104 individuals in the labor force. Within the labor force, the 25 to 29 years age range has the highest percentage of unemployed individuals, with 24.0% or 25 of them being unemployed.
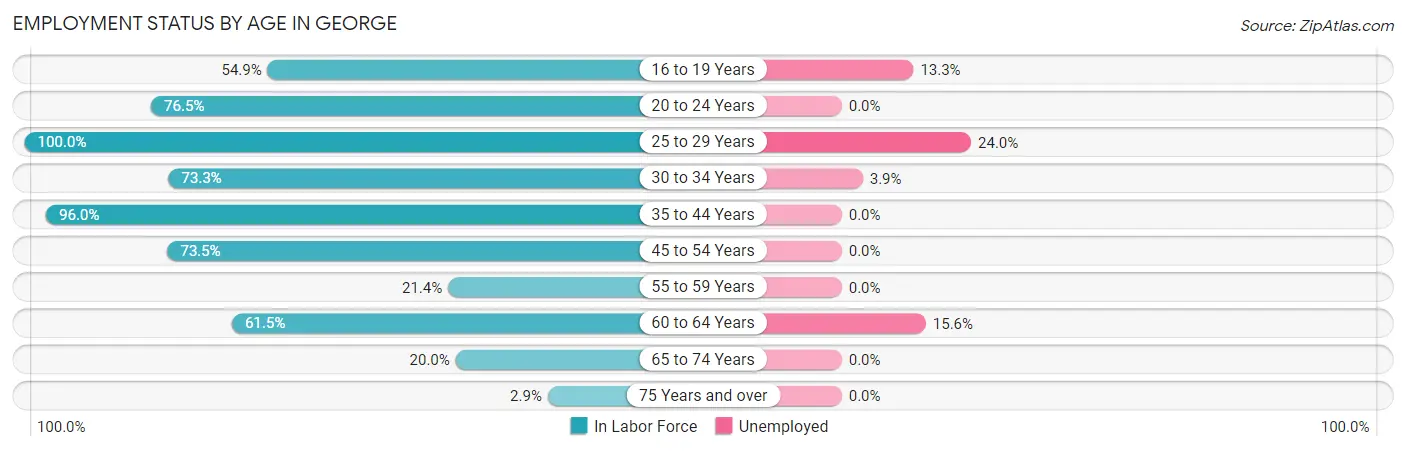
| Age Bracket | In Labor Force | Unemployed |
| 16 to 19 Years | 45 (54.9%) | 6 (13.3%) |
| 20 to 24 Years | 39 (76.5%) | 0 (0.0%) |
| 25 to 29 Years | 104 (100.0%) | 25 (24.0%) |
| 30 to 34 Years | 77 (73.3%) | 3 (3.9%) |
| 35 to 44 Years | 48 (96.0%) | 0 (0.0%) |
| 45 to 54 Years | 61 (73.5%) | 0 (0.0%) |
| 55 to 59 Years | 6 (21.4%) | 0 (0.0%) |
| 60 to 64 Years | 32 (61.5%) | 5 (15.6%) |
| 65 to 74 Years | 5 (20.0%) | 0 (0.0%) |
| 75 Years and over | 1 (2.9%) | 0 (0.0%) |
| Total | 418 (68.0%) | 39 (9.3%) |
Employment Status by Educational Attainment in George
According to labor force statistics for George, 77.7% of individuals (328) out of the total population between 25 and 64 years of age (422) are in the labor force, with 10.1% or 33 of them being unemployed. The group with the highest labor force participation rate are those with the educational attainment of bachelor's degree or higher, with 100.0% or 12 individuals in the labor force. Within the labor force, individuals with high school diploma education have the highest percentage of unemployment, with 34.7% or 25 of them being unemployed.
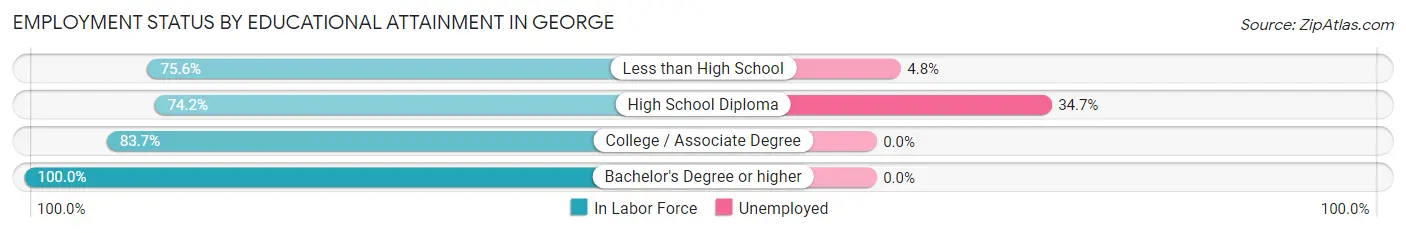
| Educational Attainment | In Labor Force | Unemployed |
| Less than High School | 167 (75.6%) | 11 (4.8%) |
| High School Diploma | 72 (74.2%) | 34 (34.7%) |
| College / Associate Degree | 77 (83.7%) | 0 (0.0%) |
| Bachelor's Degree or higher | 12 (100.0%) | 0 (0.0%) |
| Total | 328 (77.7%) | 43 (10.1%) |
Employment Occupations by Sex in George
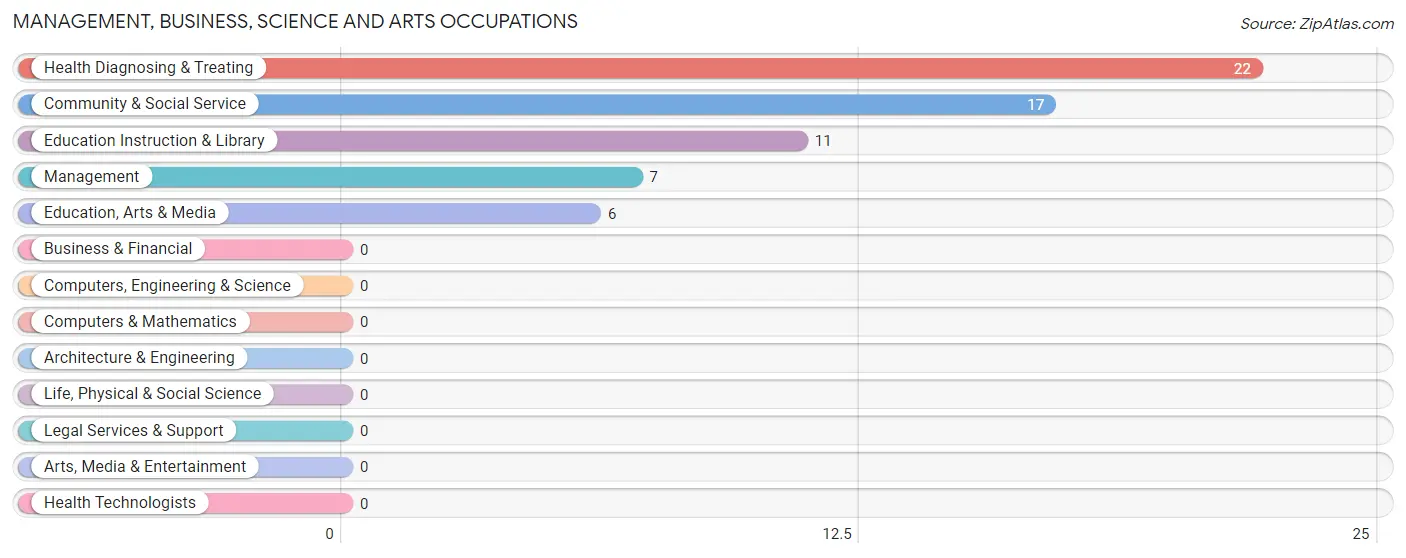
Management, Business, Science and Arts Occupations
The most common Management, Business, Science and Arts occupations in George are Health Diagnosing & Treating (22 | 5.8%), Community & Social Service (17 | 4.5%), Education Instruction & Library (11 | 2.9%), Management (7 | 1.8%), and Education, Arts & Media (6 | 1.6%).
Management, Business, Science and Arts Occupations by Sex
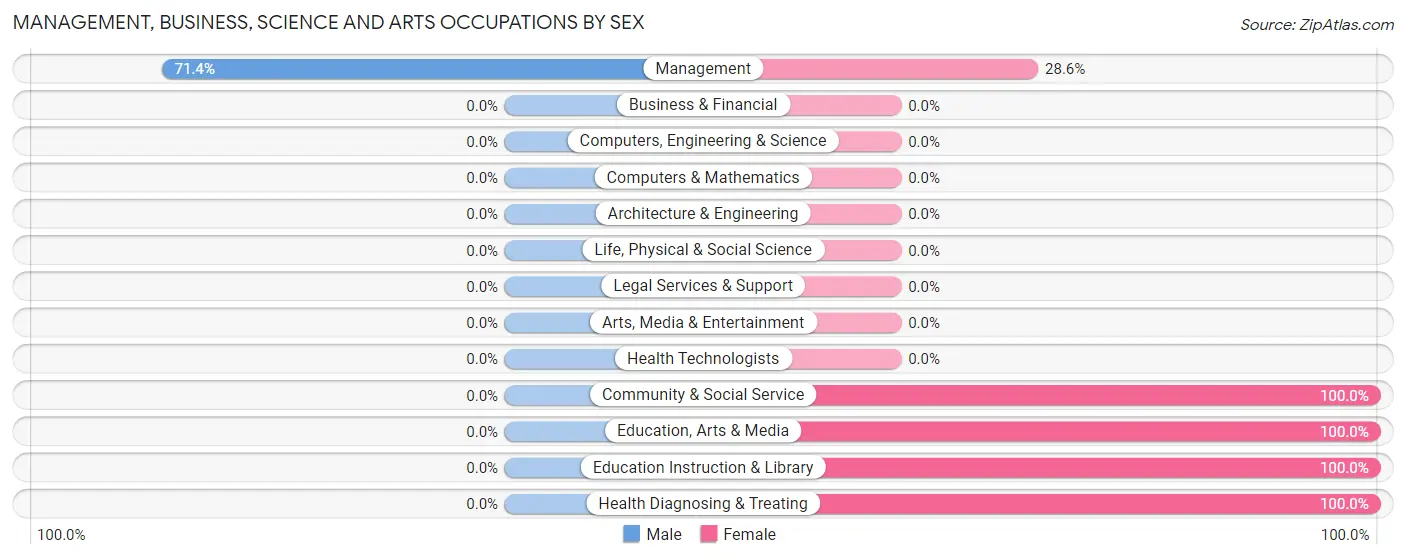
| Occupation | Male | Female |
| Management | 5 (71.4%) | 2 (28.6%) |
| Business & Financial | 0 (0.0%) | 0 (0.0%) |
| Computers, Engineering & Science | 0 (0.0%) | 0 (0.0%) |
| Computers & Mathematics | 0 (0.0%) | 0 (0.0%) |
| Architecture & Engineering | 0 (0.0%) | 0 (0.0%) |
| Life, Physical & Social Science | 0 (0.0%) | 0 (0.0%) |
| Community & Social Service | 0 (0.0%) | 17 (100.0%) |
| Education, Arts & Media | 0 (0.0%) | 6 (100.0%) |
| Legal Services & Support | 0 (0.0%) | 0 (0.0%) |
| Education Instruction & Library | 0 (0.0%) | 11 (100.0%) |
| Arts, Media & Entertainment | 0 (0.0%) | 0 (0.0%) |
| Health Diagnosing & Treating | 0 (0.0%) | 22 (100.0%) |
| Health Technologists | 0 (0.0%) | 0 (0.0%) |
| Total (Category) | 5 (10.9%) | 41 (89.1%) |
| Total (Overall) | 191 (50.4%) | 188 (49.6%) |
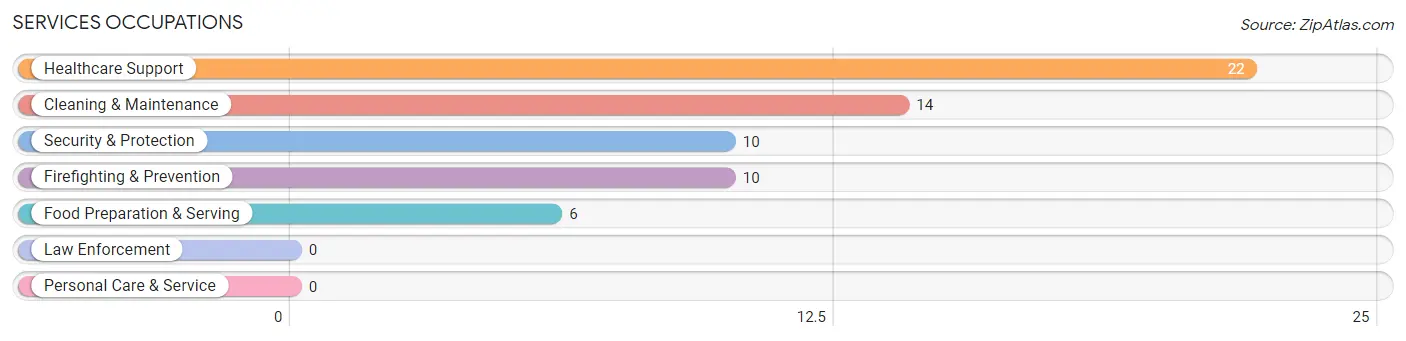
Services Occupations
The most common Services occupations in George are Healthcare Support (22 | 5.8%), Cleaning & Maintenance (14 | 3.7%), Security & Protection (10 | 2.6%), Firefighting & Prevention (10 | 2.6%), and Food Preparation & Serving (6 | 1.6%).
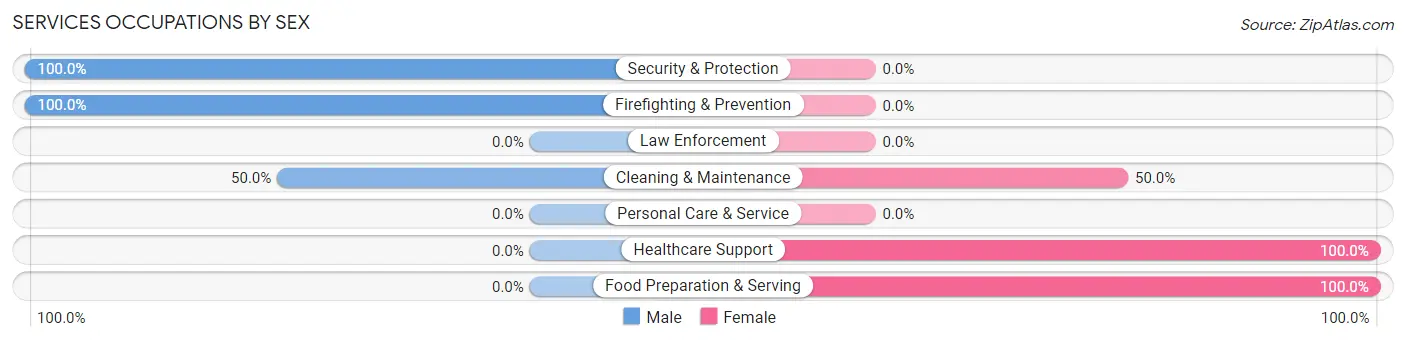
Services Occupations by Sex
Within the Services occupations in George, the most male-oriented occupations are Security & Protection (100.0%), Firefighting & Prevention (100.0%), and Cleaning & Maintenance (50.0%), while the most female-oriented occupations are Healthcare Support (100.0%), Food Preparation & Serving (100.0%), and Cleaning & Maintenance (50.0%).
| Occupation | Male | Female |
| Healthcare Support | 0 (0.0%) | 22 (100.0%) |
| Security & Protection | 10 (100.0%) | 0 (0.0%) |
| Firefighting & Prevention | 10 (100.0%) | 0 (0.0%) |
| Law Enforcement | 0 (0.0%) | 0 (0.0%) |
| Food Preparation & Serving | 0 (0.0%) | 6 (100.0%) |
| Cleaning & Maintenance | 7 (50.0%) | 7 (50.0%) |
| Personal Care & Service | 0 (0.0%) | 0 (0.0%) |
| Total (Category) | 17 (32.7%) | 35 (67.3%) |
| Total (Overall) | 191 (50.4%) | 188 (49.6%) |
Sales and Office Occupations
The most common Sales and Office occupations in George are Sales & Related (32 | 8.4%), and Office & Administration (5 | 1.3%).

Sales and Office Occupations by Sex

| Occupation | Male | Female |
| Sales & Related | 12 (37.5%) | 20 (62.5%) |
| Office & Administration | 0 (0.0%) | 5 (100.0%) |
| Total (Category) | 12 (32.4%) | 25 (67.6%) |
| Total (Overall) | 191 (50.4%) | 188 (49.6%) |
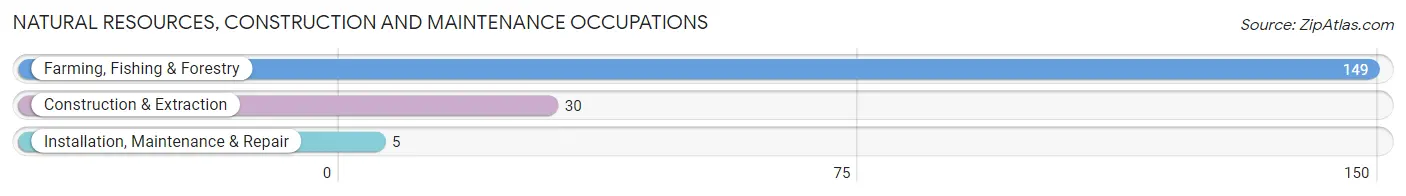
Natural Resources, Construction and Maintenance Occupations
The most common Natural Resources, Construction and Maintenance occupations in George are Farming, Fishing & Forestry (149 | 39.3%), Construction & Extraction (30 | 7.9%), and Installation, Maintenance & Repair (5 | 1.3%).
Natural Resources, Construction and Maintenance Occupations by Sex
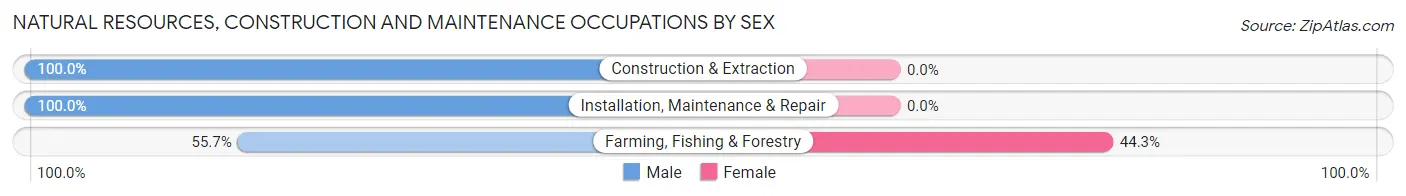
| Occupation | Male | Female |
| Farming, Fishing & Forestry | 83 (55.7%) | 66 (44.3%) |
| Construction & Extraction | 30 (100.0%) | 0 (0.0%) |
| Installation, Maintenance & Repair | 5 (100.0%) | 0 (0.0%) |
| Total (Category) | 118 (64.1%) | 66 (35.9%) |
| Total (Overall) | 191 (50.4%) | 188 (49.6%) |
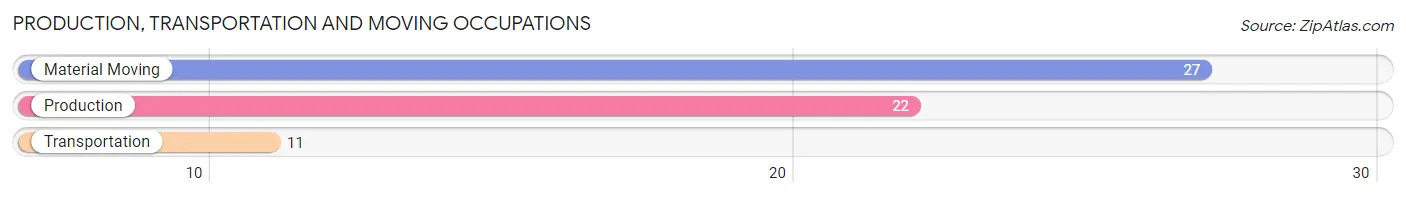
Production, Transportation and Moving Occupations
The most common Production, Transportation and Moving occupations in George are Material Moving (27 | 7.1%), Production (22 | 5.8%), and Transportation (11 | 2.9%).
Production, Transportation and Moving Occupations by Sex
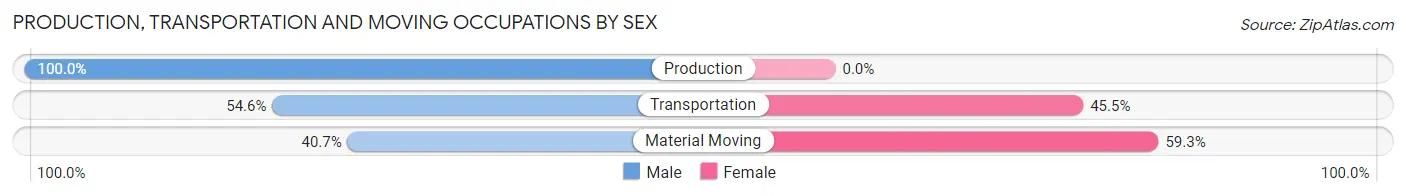
| Occupation | Male | Female |
| Production | 22 (100.0%) | 0 (0.0%) |
| Transportation | 6 (54.5%) | 5 (45.5%) |
| Material Moving | 11 (40.7%) | 16 (59.3%) |
| Total (Category) | 39 (65.0%) | 21 (35.0%) |
| Total (Overall) | 191 (50.4%) | 188 (49.6%) |
Employment Industries by Sex in George
Employment Industries in George
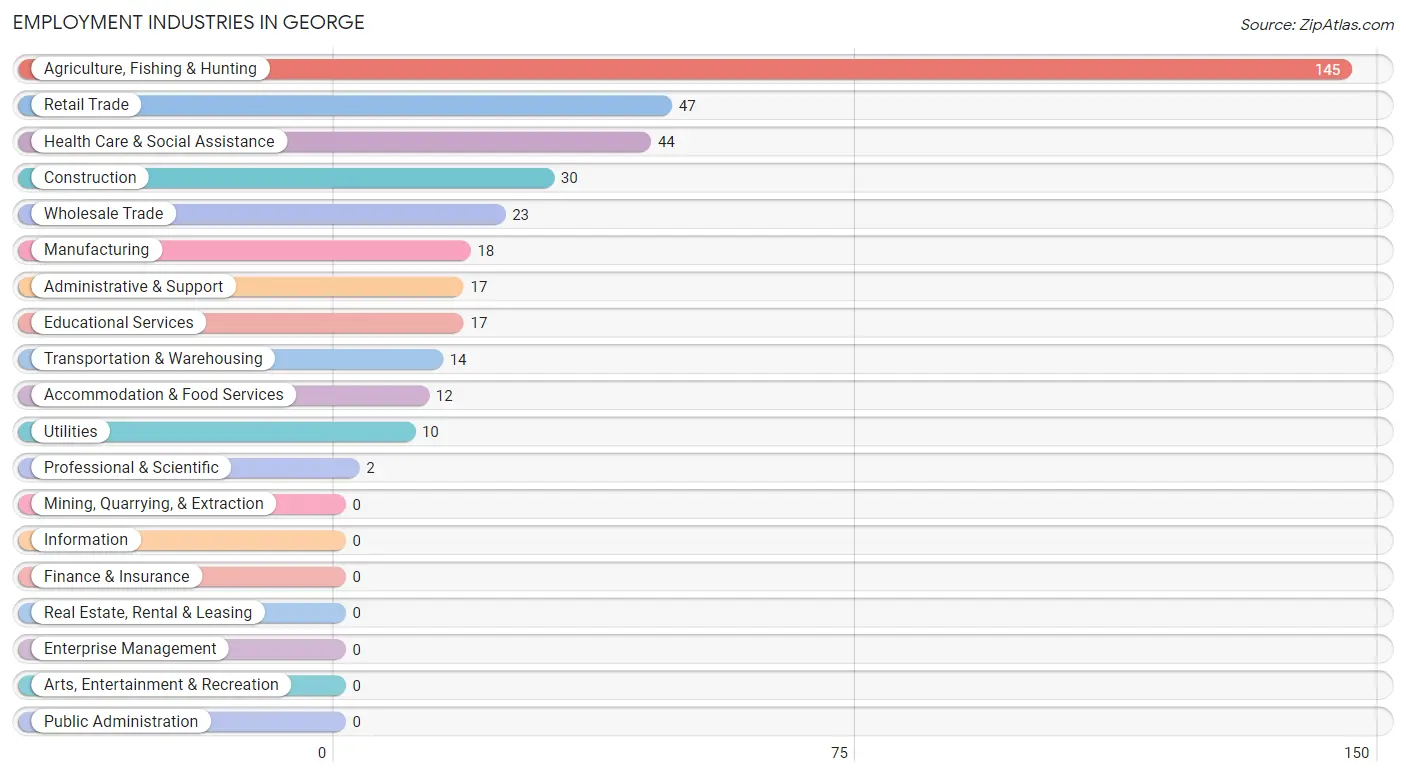
The major employment industries in George include Agriculture, Fishing & Hunting (145 | 38.3%), Retail Trade (47 | 12.4%), Health Care & Social Assistance (44 | 11.6%), Construction (30 | 7.9%), and Wholesale Trade (23 | 6.1%).
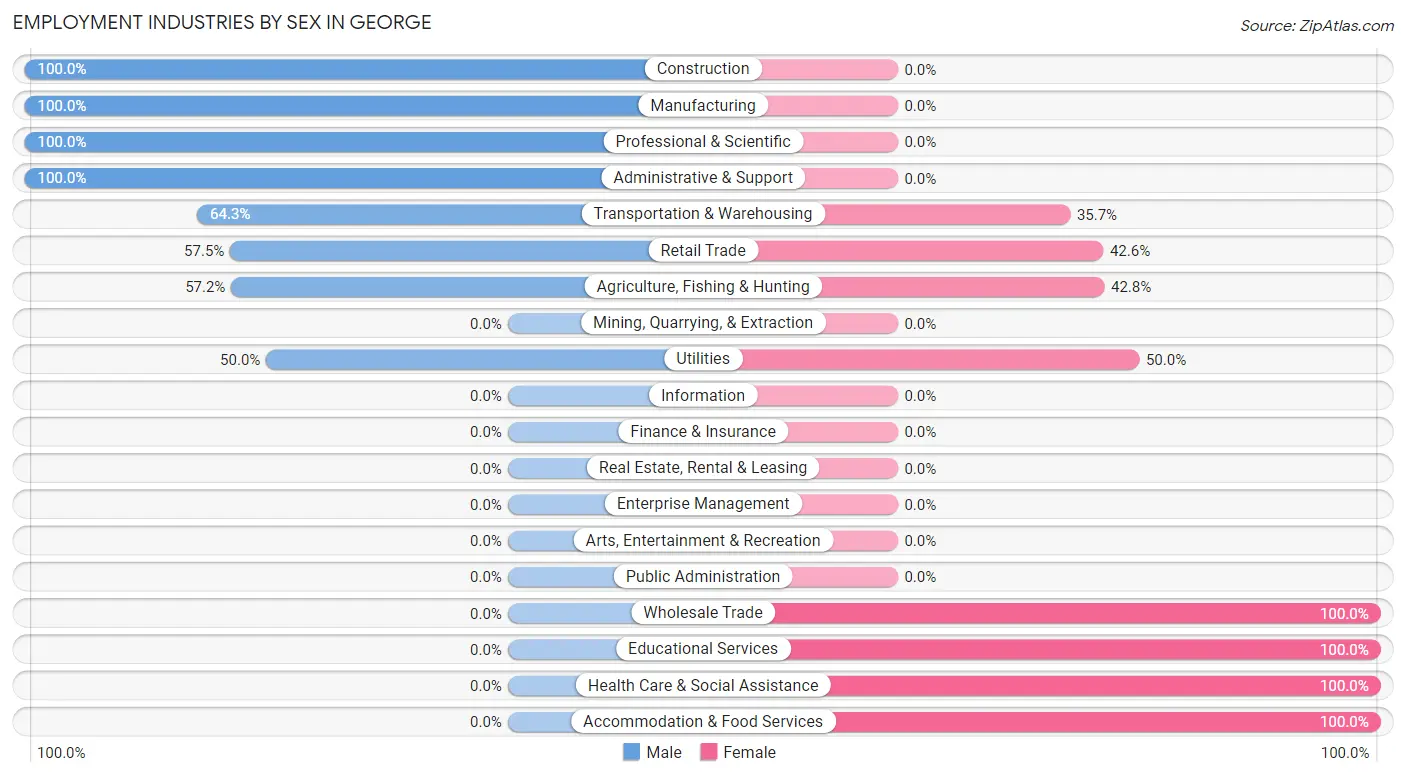
Employment Industries by Sex in George
The George industries that see more men than women are Construction (100.0%), Manufacturing (100.0%), and Professional & Scientific (100.0%), whereas the industries that tend to have a higher number of women are Wholesale Trade (100.0%), Educational Services (100.0%), and Health Care & Social Assistance (100.0%).
| Industry | Male | Female |
| Agriculture, Fishing & Hunting | 83 (57.2%) | 62 (42.8%) |
| Mining, Quarrying, & Extraction | 0 (0.0%) | 0 (0.0%) |
| Construction | 30 (100.0%) | 0 (0.0%) |
| Manufacturing | 18 (100.0%) | 0 (0.0%) |
| Wholesale Trade | 0 (0.0%) | 23 (100.0%) |
| Retail Trade | 27 (57.5%) | 20 (42.5%) |
| Transportation & Warehousing | 9 (64.3%) | 5 (35.7%) |
| Utilities | 5 (50.0%) | 5 (50.0%) |
| Information | 0 (0.0%) | 0 (0.0%) |
| Finance & Insurance | 0 (0.0%) | 0 (0.0%) |
| Real Estate, Rental & Leasing | 0 (0.0%) | 0 (0.0%) |
| Professional & Scientific | 2 (100.0%) | 0 (0.0%) |
| Enterprise Management | 0 (0.0%) | 0 (0.0%) |
| Administrative & Support | 17 (100.0%) | 0 (0.0%) |
| Educational Services | 0 (0.0%) | 17 (100.0%) |
| Health Care & Social Assistance | 0 (0.0%) | 44 (100.0%) |
| Arts, Entertainment & Recreation | 0 (0.0%) | 0 (0.0%) |
| Accommodation & Food Services | 0 (0.0%) | 12 (100.0%) |
| Public Administration | 0 (0.0%) | 0 (0.0%) |
| Total | 191 (50.4%) | 188 (49.6%) |
Education in George
School Enrollment in George
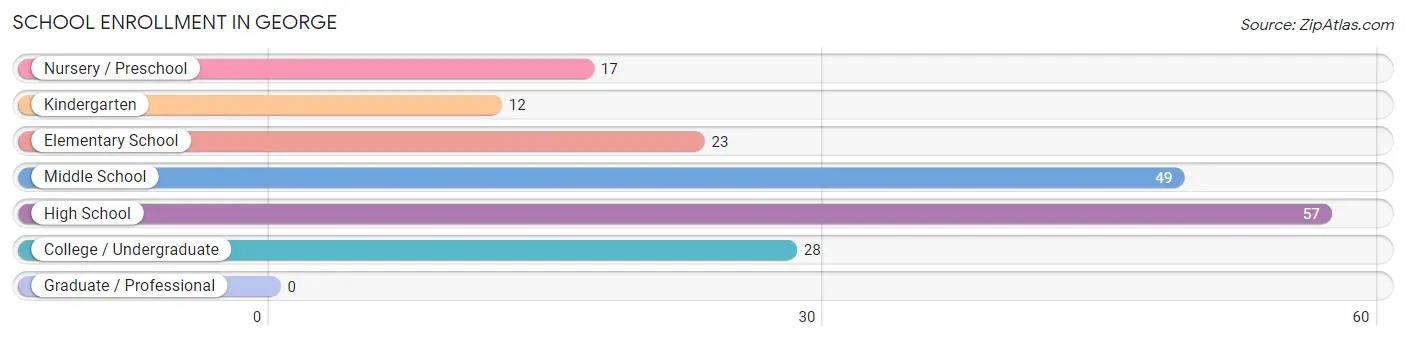
The most common levels of schooling among the 186 students in George are high school (57 | 30.6%), middle school (49 | 26.3%), and college / undergraduate (28 | 15.0%).
| School Level | # Students | % Students |
| Nursery / Preschool | 17 | 9.1% |
| Kindergarten | 12 | 6.5% |
| Elementary School | 23 | 12.4% |
| Middle School | 49 | 26.3% |
| High School | 57 | 30.6% |
| College / Undergraduate | 28 | 15.0% |
| Graduate / Professional | 0 | 0.0% |
| Total | 186 | 100.0% |
School Enrollment by Age by Funding Source in George
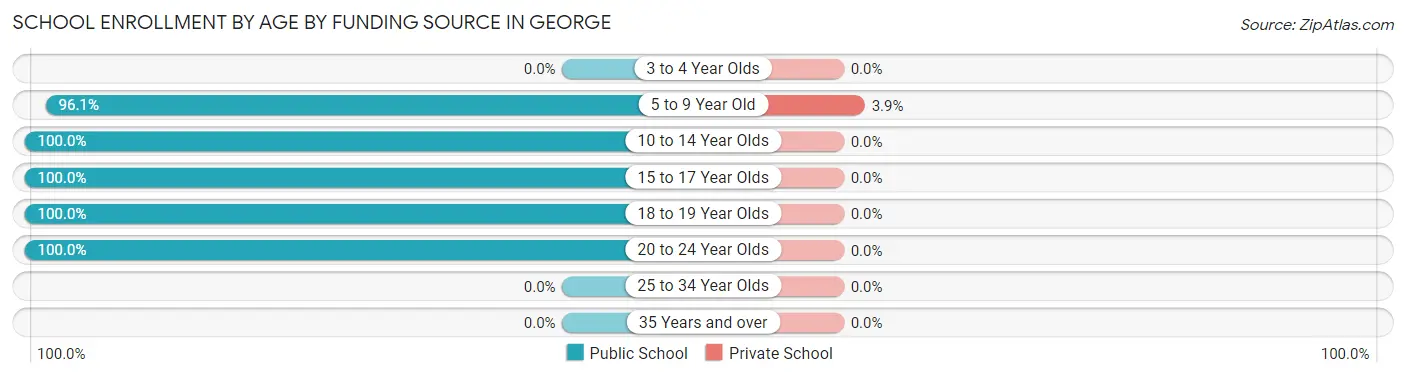
Out of a total of 186 students who are enrolled in schools in George, 2 (1.1%) attend a private institution, while the remaining 184 (98.9%) are enrolled in public schools. The age group of 5 to 9 year old has the highest likelihood of being enrolled in private schools, with 2 (3.9% in the age bracket) enrolled. Conversely, the age group of 10 to 14 year olds has the lowest likelihood of being enrolled in a private school, with 67 (100.0% in the age bracket) attending a public institution.
| Age Bracket | Public School | Private School |
| 3 to 4 Year Olds | 0 (0.0%) | 0 (0.0%) |
| 5 to 9 Year Old | 49 (96.1%) | 2 (3.9%) |
| 10 to 14 Year Olds | 67 (100.0%) | 0 (0.0%) |
| 15 to 17 Year Olds | 15 (100.0%) | 0 (0.0%) |
| 18 to 19 Year Olds | 46 (100.0%) | 0 (0.0%) |
| 20 to 24 Year Olds | 7 (100.0%) | 0 (0.0%) |
| 25 to 34 Year Olds | 0 (0.0%) | 0 (0.0%) |
| 35 Years and over | 0 (0.0%) | 0 (0.0%) |
| Total | 184 (98.9%) | 2 (1.1%) |
Educational Attainment by Field of Study in George
Engineering (5 | 29.4%), education (5 | 29.4%), visual & performing arts (5 | 29.4%), and communications (2 | 11.8%) are the most common fields of study among 17 individuals in George who have obtained a bachelor's degree or higher.
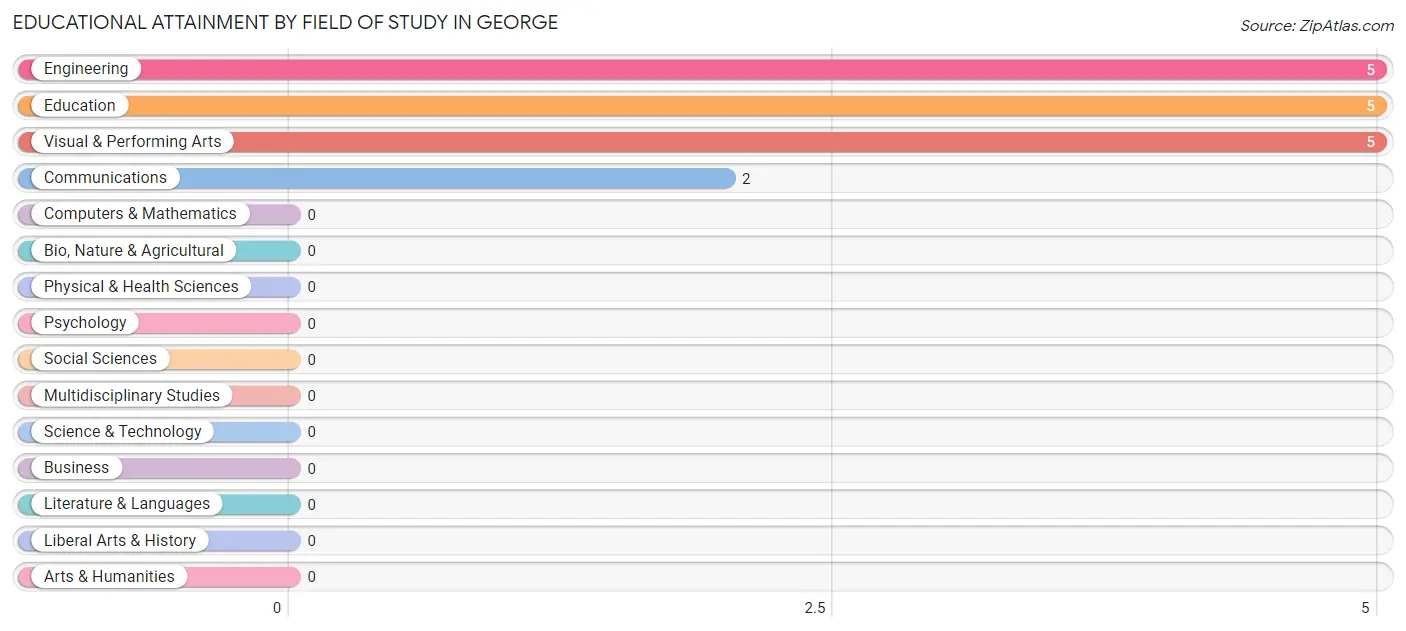
| Field of Study | # Graduates | % Graduates |
| Computers & Mathematics | 0 | 0.0% |
| Bio, Nature & Agricultural | 0 | 0.0% |
| Physical & Health Sciences | 0 | 0.0% |
| Psychology | 0 | 0.0% |
| Social Sciences | 0 | 0.0% |
| Engineering | 5 | 29.4% |
| Multidisciplinary Studies | 0 | 0.0% |
| Science & Technology | 0 | 0.0% |
| Business | 0 | 0.0% |
| Education | 5 | 29.4% |
| Literature & Languages | 0 | 0.0% |
| Liberal Arts & History | 0 | 0.0% |
| Visual & Performing Arts | 5 | 29.4% |
| Communications | 2 | 11.8% |
| Arts & Humanities | 0 | 0.0% |
| Total | 17 | 100.0% |
Transportation & Commute in George
Vehicle Availability by Sex in George
The most prevalent vehicle ownership categories in George are males with 3 vehicles (54, accounting for 28.3%) and females with 3 vehicles (61, making up 28.7%).
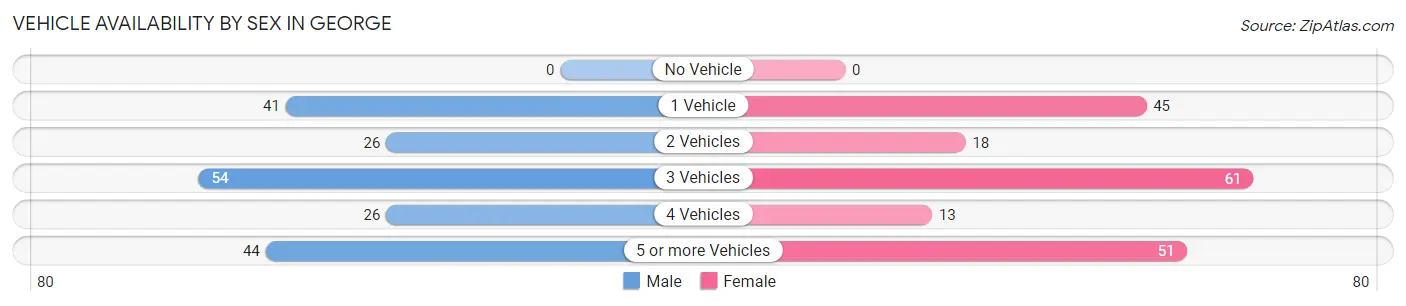
| Vehicles Available | Male | Female |
| No Vehicle | 0 (0.0%) | 0 (0.0%) |
| 1 Vehicle | 41 (21.5%) | 45 (23.9%) |
| 2 Vehicles | 26 (13.6%) | 18 (9.6%) |
| 3 Vehicles | 54 (28.3%) | 61 (32.5%) |
| 4 Vehicles | 26 (13.6%) | 13 (6.9%) |
| 5 or more Vehicles | 44 (23.0%) | 51 (27.1%) |
| Total | 191 (100.0%) | 188 (100.0%) |
Commute Time in George
The most frequently occuring commute durations in George are 15 to 19 minutes (86 commuters, 23.9%), 20 to 24 minutes (81 commuters, 22.5%), and 30 to 34 minutes (72 commuters, 20.0%).
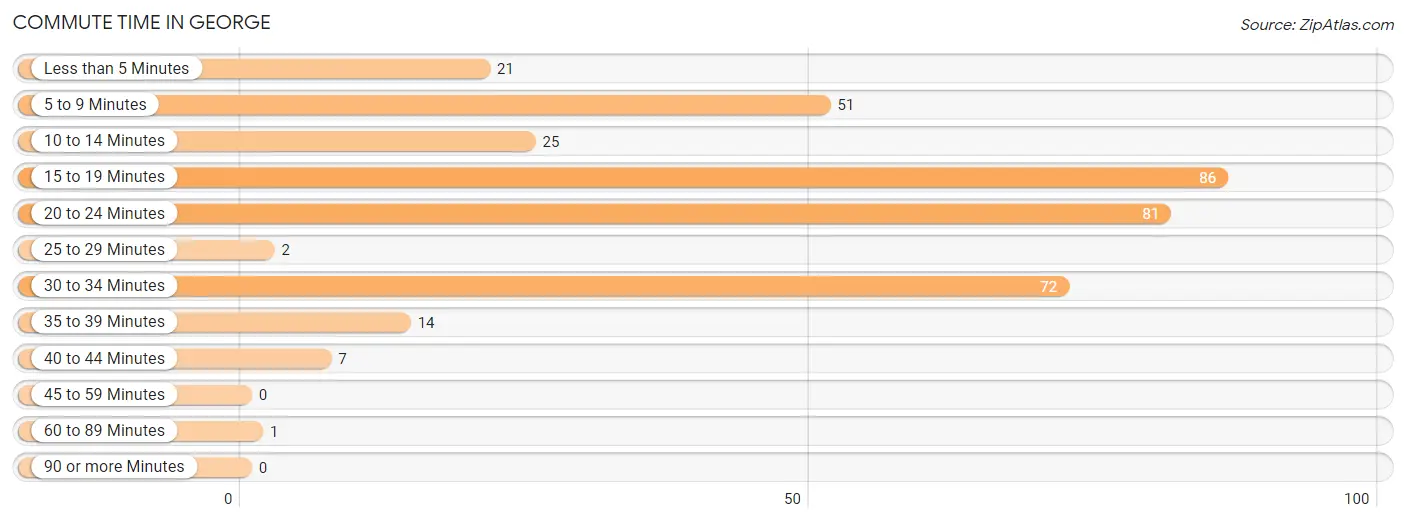
| Commute Time | # Commuters | % Commuters |
| Less than 5 Minutes | 21 | 5.8% |
| 5 to 9 Minutes | 51 | 14.2% |
| 10 to 14 Minutes | 25 | 6.9% |
| 15 to 19 Minutes | 86 | 23.9% |
| 20 to 24 Minutes | 81 | 22.5% |
| 25 to 29 Minutes | 2 | 0.6% |
| 30 to 34 Minutes | 72 | 20.0% |
| 35 to 39 Minutes | 14 | 3.9% |
| 40 to 44 Minutes | 7 | 1.9% |
| 45 to 59 Minutes | 0 | 0.0% |
| 60 to 89 Minutes | 1 | 0.3% |
| 90 or more Minutes | 0 | 0.0% |
Commute Time by Sex in George
The most common commute times in George are 15 to 19 minutes (58 commuters, 32.8%) for males and 20 to 24 minutes (47 commuters, 25.7%) for females.
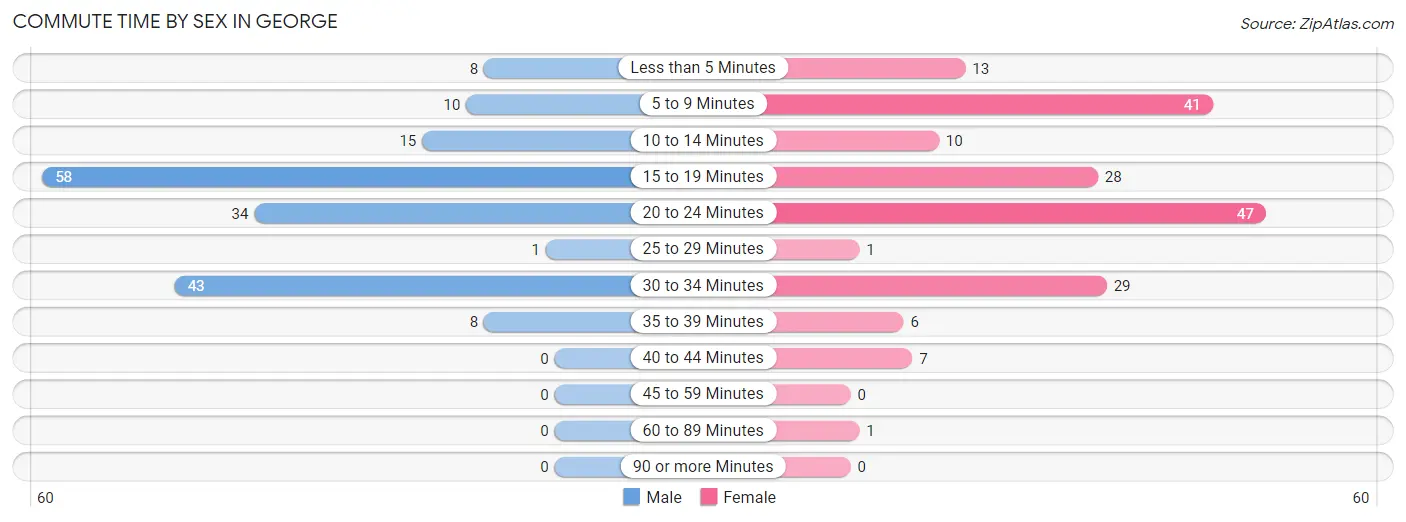
| Commute Time | Male | Female |
| Less than 5 Minutes | 8 (4.5%) | 13 (7.1%) |
| 5 to 9 Minutes | 10 (5.7%) | 41 (22.4%) |
| 10 to 14 Minutes | 15 (8.5%) | 10 (5.5%) |
| 15 to 19 Minutes | 58 (32.8%) | 28 (15.3%) |
| 20 to 24 Minutes | 34 (19.2%) | 47 (25.7%) |
| 25 to 29 Minutes | 1 (0.6%) | 1 (0.5%) |
| 30 to 34 Minutes | 43 (24.3%) | 29 (15.9%) |
| 35 to 39 Minutes | 8 (4.5%) | 6 (3.3%) |
| 40 to 44 Minutes | 0 (0.0%) | 7 (3.8%) |
| 45 to 59 Minutes | 0 (0.0%) | 0 (0.0%) |
| 60 to 89 Minutes | 0 (0.0%) | 1 (0.5%) |
| 90 or more Minutes | 0 (0.0%) | 0 (0.0%) |
Time of Departure to Work by Sex in George
The most frequent times of departure to work in George are 6:30 AM to 6:59 AM (68, 38.4%) for males and 7:30 AM to 7:59 AM (35, 19.1%) for females.
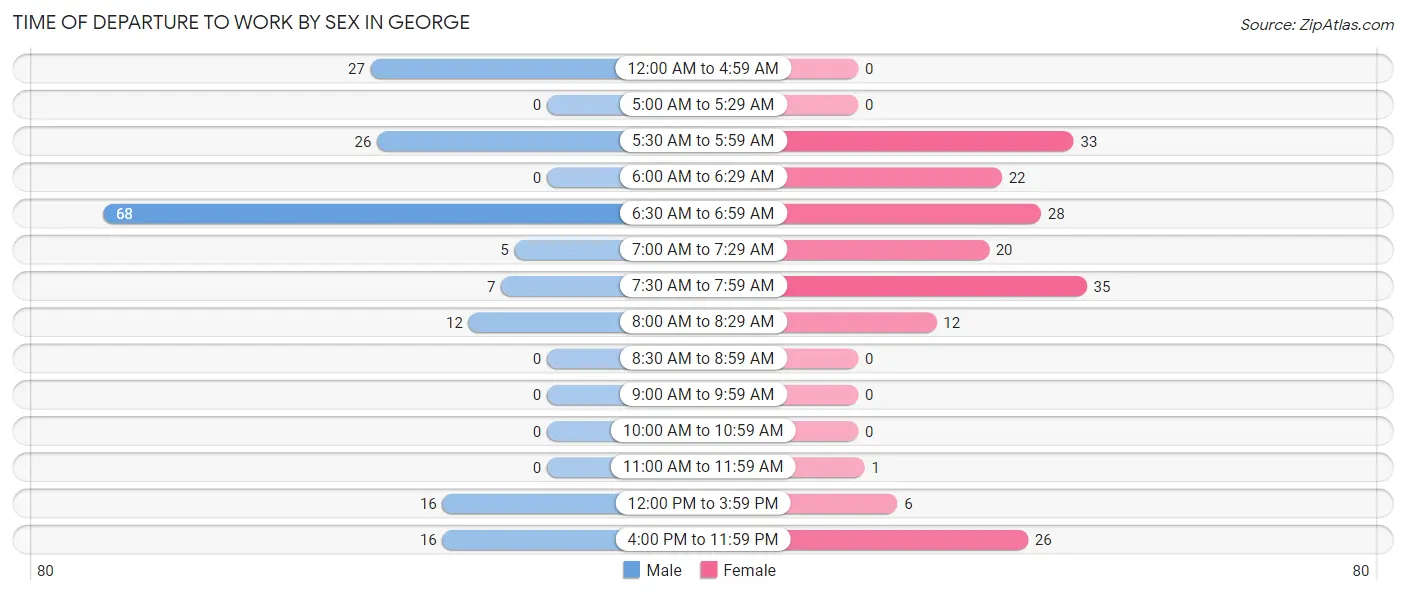
| Time of Departure | Male | Female |
| 12:00 AM to 4:59 AM | 27 (15.2%) | 0 (0.0%) |
| 5:00 AM to 5:29 AM | 0 (0.0%) | 0 (0.0%) |
| 5:30 AM to 5:59 AM | 26 (14.7%) | 33 (18.0%) |
| 6:00 AM to 6:29 AM | 0 (0.0%) | 22 (12.0%) |
| 6:30 AM to 6:59 AM | 68 (38.4%) | 28 (15.3%) |
| 7:00 AM to 7:29 AM | 5 (2.8%) | 20 (10.9%) |
| 7:30 AM to 7:59 AM | 7 (4.0%) | 35 (19.1%) |
| 8:00 AM to 8:29 AM | 12 (6.8%) | 12 (6.6%) |
| 8:30 AM to 8:59 AM | 0 (0.0%) | 0 (0.0%) |
| 9:00 AM to 9:59 AM | 0 (0.0%) | 0 (0.0%) |
| 10:00 AM to 10:59 AM | 0 (0.0%) | 0 (0.0%) |
| 11:00 AM to 11:59 AM | 0 (0.0%) | 1 (0.5%) |
| 12:00 PM to 3:59 PM | 16 (9.0%) | 6 (3.3%) |
| 4:00 PM to 11:59 PM | 16 (9.0%) | 26 (14.2%) |
| Total | 177 (100.0%) | 183 (100.0%) |
Housing Occupancy in George
Occupancy by Ownership in George
Of the total 228 dwellings in George, owner-occupied units account for 108 (47.4%), while renter-occupied units make up 120 (52.6%).
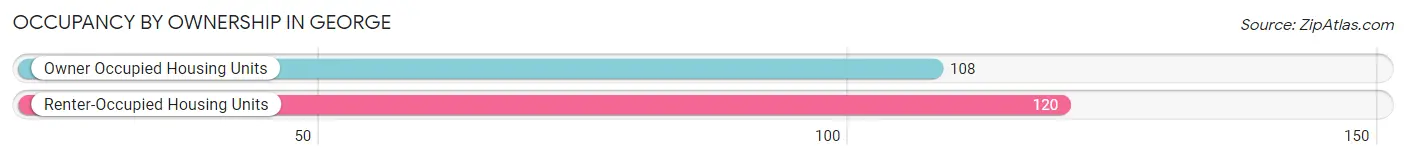
| Occupancy | # Housing Units | % Housing Units |
| Owner Occupied Housing Units | 108 | 47.4% |
| Renter-Occupied Housing Units | 120 | 52.6% |
| Total Occupied Housing Units | 228 | 100.0% |
Occupancy by Household Size in George
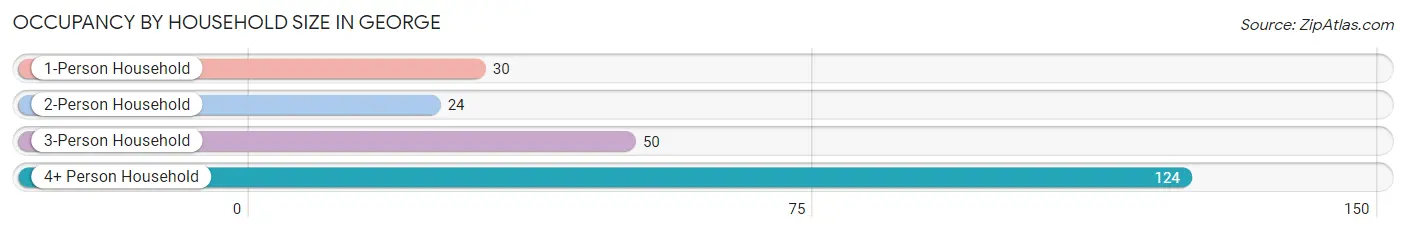
| Household Size | # Housing Units | % Housing Units |
| 1-Person Household | 30 | 13.2% |
| 2-Person Household | 24 | 10.5% |
| 3-Person Household | 50 | 21.9% |
| 4+ Person Household | 124 | 54.4% |
| Total Housing Units | 228 | 100.0% |
Occupancy by Ownership by Household Size in George
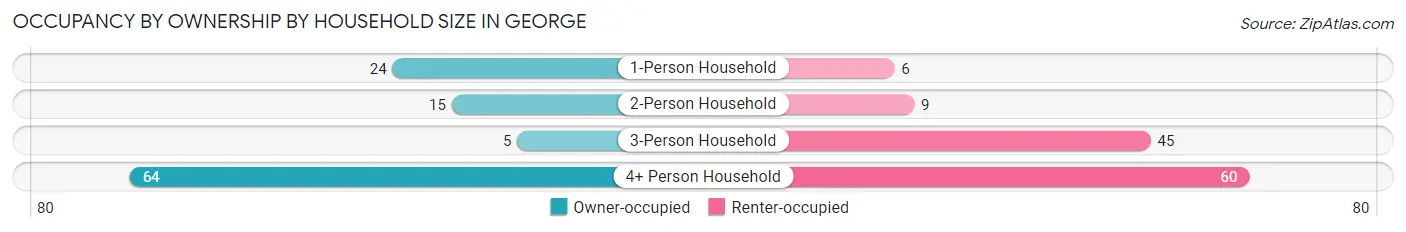
| Household Size | Owner-occupied | Renter-occupied |
| 1-Person Household | 24 (80.0%) | 6 (20.0%) |
| 2-Person Household | 15 (62.5%) | 9 (37.5%) |
| 3-Person Household | 5 (10.0%) | 45 (90.0%) |
| 4+ Person Household | 64 (51.6%) | 60 (48.4%) |
| Total Housing Units | 108 (47.4%) | 120 (52.6%) |
Occupancy by Educational Attainment in George
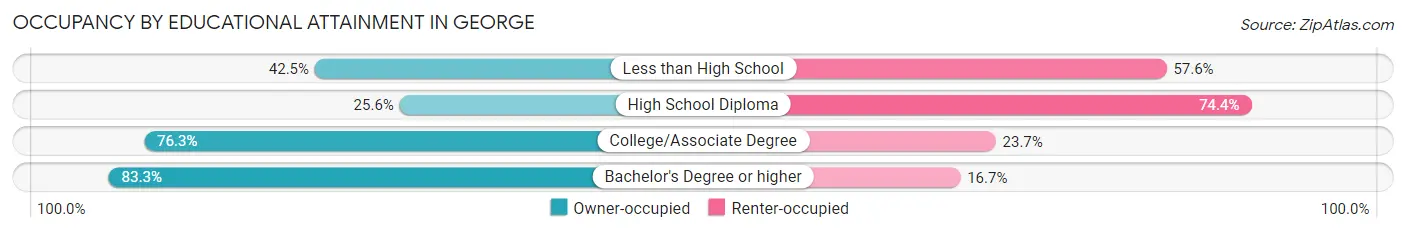
| Household Size | Owner-occupied | Renter-occupied |
| Less than High School | 59 (42.4%) | 80 (57.6%) |
| High School Diploma | 10 (25.6%) | 29 (74.4%) |
| College/Associate Degree | 29 (76.3%) | 9 (23.7%) |
| Bachelor's Degree or higher | 10 (83.3%) | 2 (16.7%) |
Occupancy by Age of Householder in George
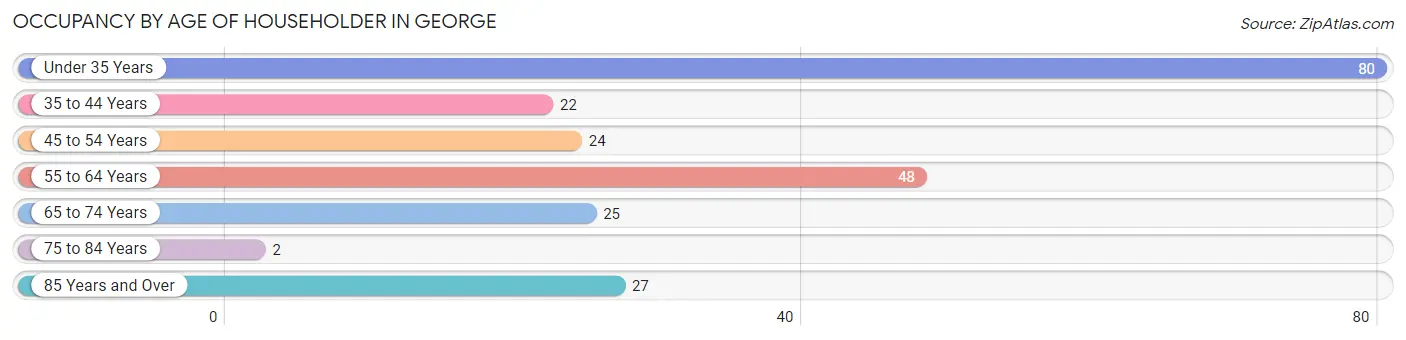
| Age Bracket | # Households | % Households |
| Under 35 Years | 80 | 35.1% |
| 35 to 44 Years | 22 | 9.7% |
| 45 to 54 Years | 24 | 10.5% |
| 55 to 64 Years | 48 | 21.0% |
| 65 to 74 Years | 25 | 11.0% |
| 75 to 84 Years | 2 | 0.9% |
| 85 Years and Over | 27 | 11.8% |
| Total | 228 | 100.0% |
Housing Finances in George
Median Income by Occupancy in George
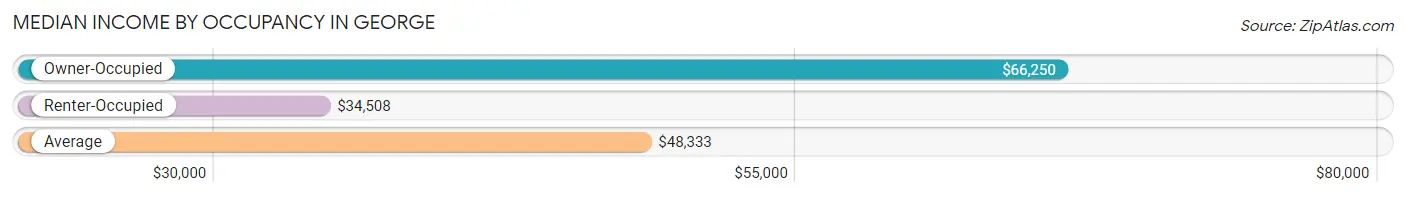
| Occupancy Type | # Households | Median Income |
| Owner-Occupied | 108 (47.4%) | $66,250 |
| Renter-Occupied | 120 (52.6%) | $34,508 |
| Average | 228 (100.0%) | $48,333 |
Occupancy by Householder Income Bracket in George
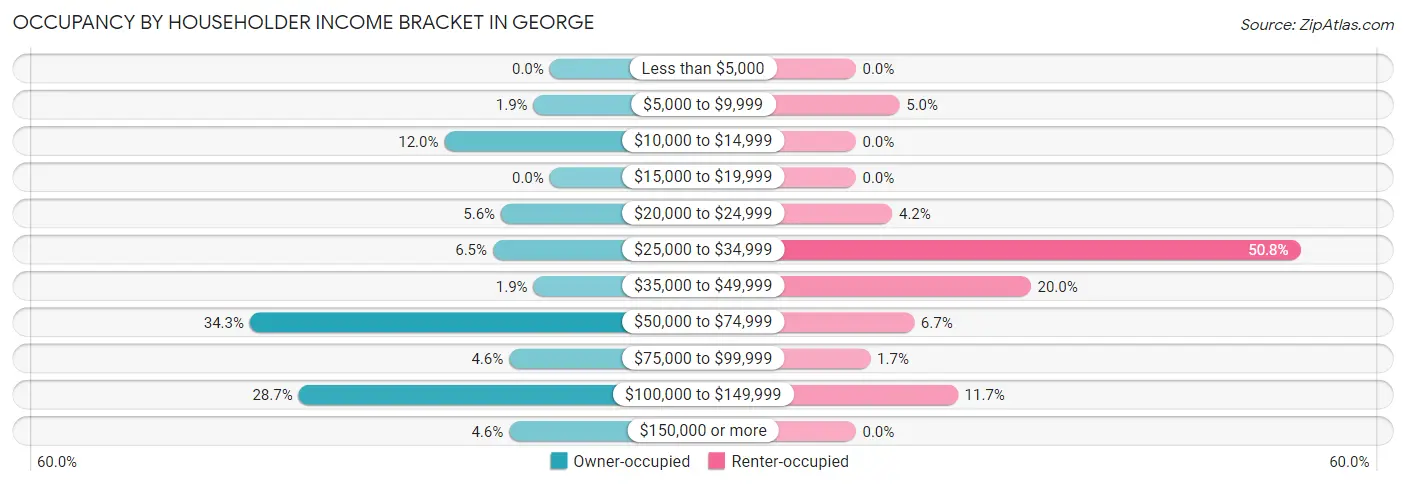
| Income Bracket | Owner-occupied | Renter-occupied |
| Less than $5,000 | 0 (0.0%) | 0 (0.0%) |
| $5,000 to $9,999 | 2 (1.8%) | 6 (5.0%) |
| $10,000 to $14,999 | 13 (12.0%) | 0 (0.0%) |
| $15,000 to $19,999 | 0 (0.0%) | 0 (0.0%) |
| $20,000 to $24,999 | 6 (5.6%) | 5 (4.2%) |
| $25,000 to $34,999 | 7 (6.5%) | 61 (50.8%) |
| $35,000 to $49,999 | 2 (1.8%) | 24 (20.0%) |
| $50,000 to $74,999 | 37 (34.3%) | 8 (6.7%) |
| $75,000 to $99,999 | 5 (4.6%) | 2 (1.7%) |
| $100,000 to $149,999 | 31 (28.7%) | 14 (11.7%) |
| $150,000 or more | 5 (4.6%) | 0 (0.0%) |
| Total | 108 (100.0%) | 120 (100.0%) |
Monthly Housing Cost Tiers in George
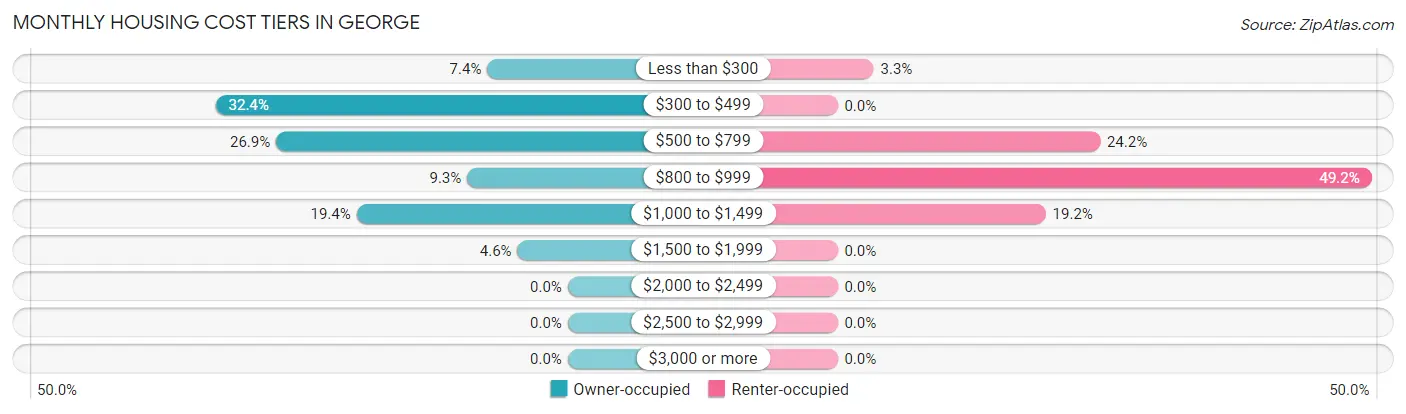
| Monthly Cost | Owner-occupied | Renter-occupied |
| Less than $300 | 8 (7.4%) | 4 (3.3%) |
| $300 to $499 | 35 (32.4%) | 0 (0.0%) |
| $500 to $799 | 29 (26.9%) | 29 (24.2%) |
| $800 to $999 | 10 (9.3%) | 59 (49.2%) |
| $1,000 to $1,499 | 21 (19.4%) | 23 (19.2%) |
| $1,500 to $1,999 | 5 (4.6%) | 0 (0.0%) |
| $2,000 to $2,499 | 0 (0.0%) | 0 (0.0%) |
| $2,500 to $2,999 | 0 (0.0%) | 0 (0.0%) |
| $3,000 or more | 0 (0.0%) | 0 (0.0%) |
| Total | 108 (100.0%) | 120 (100.0%) |
Physical Housing Characteristics in George
Housing Structures in George
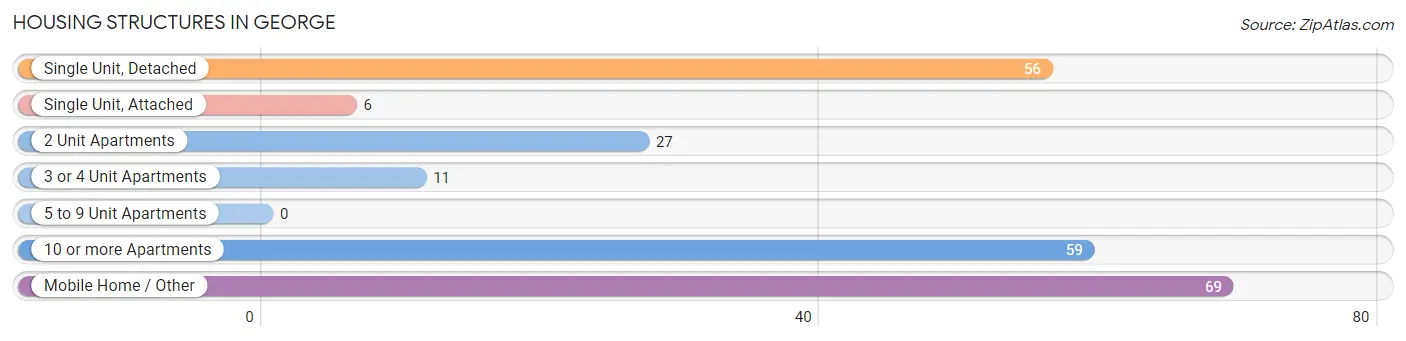
| Structure Type | # Housing Units | % Housing Units |
| Single Unit, Detached | 56 | 24.6% |
| Single Unit, Attached | 6 | 2.6% |
| 2 Unit Apartments | 27 | 11.8% |
| 3 or 4 Unit Apartments | 11 | 4.8% |
| 5 to 9 Unit Apartments | 0 | 0.0% |
| 10 or more Apartments | 59 | 25.9% |
| Mobile Home / Other | 69 | 30.3% |
| Total | 228 | 100.0% |
Housing Structures by Occupancy in George
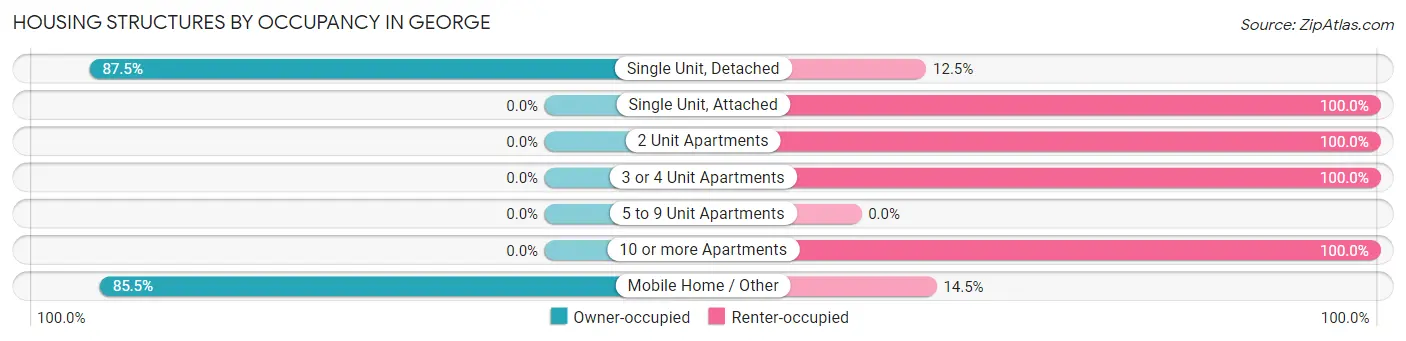
| Structure Type | Owner-occupied | Renter-occupied |
| Single Unit, Detached | 49 (87.5%) | 7 (12.5%) |
| Single Unit, Attached | 0 (0.0%) | 6 (100.0%) |
| 2 Unit Apartments | 0 (0.0%) | 27 (100.0%) |
| 3 or 4 Unit Apartments | 0 (0.0%) | 11 (100.0%) |
| 5 to 9 Unit Apartments | 0 (0.0%) | 0 (0.0%) |
| 10 or more Apartments | 0 (0.0%) | 59 (100.0%) |
| Mobile Home / Other | 59 (85.5%) | 10 (14.5%) |
| Total | 108 (47.4%) | 120 (52.6%) |
Housing Structures by Number of Rooms in George
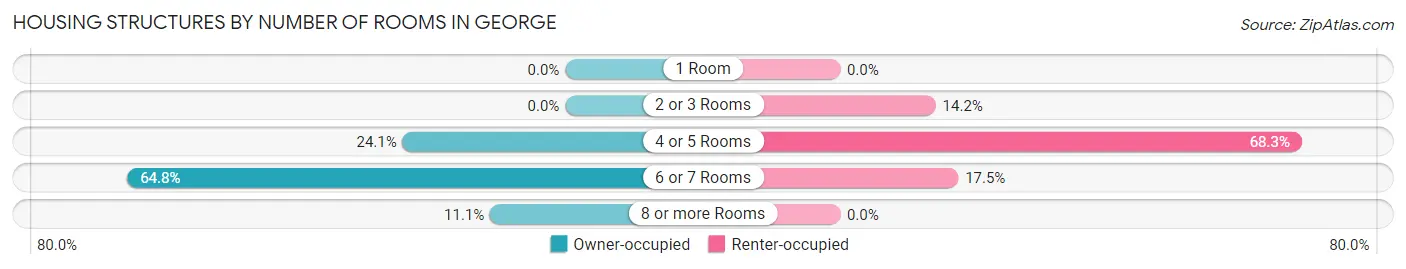
| Number of Rooms | Owner-occupied | Renter-occupied |
| 1 Room | 0 (0.0%) | 0 (0.0%) |
| 2 or 3 Rooms | 0 (0.0%) | 17 (14.2%) |
| 4 or 5 Rooms | 26 (24.1%) | 82 (68.3%) |
| 6 or 7 Rooms | 70 (64.8%) | 21 (17.5%) |
| 8 or more Rooms | 12 (11.1%) | 0 (0.0%) |
| Total | 108 (100.0%) | 120 (100.0%) |
Housing Structure by Heating Type in George
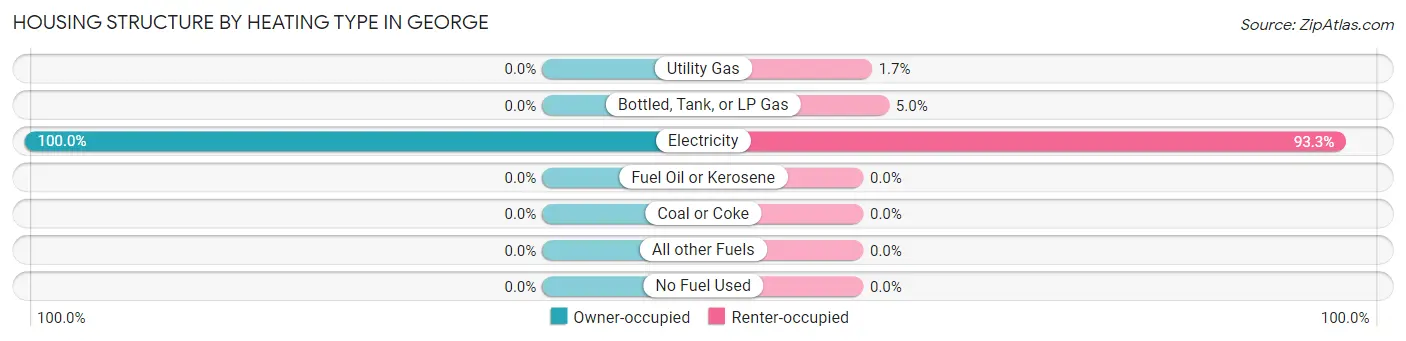
| Heating Type | Owner-occupied | Renter-occupied |
| Utility Gas | 0 (0.0%) | 2 (1.7%) |
| Bottled, Tank, or LP Gas | 0 (0.0%) | 6 (5.0%) |
| Electricity | 108 (100.0%) | 112 (93.3%) |
| Fuel Oil or Kerosene | 0 (0.0%) | 0 (0.0%) |
| Coal or Coke | 0 (0.0%) | 0 (0.0%) |
| All other Fuels | 0 (0.0%) | 0 (0.0%) |
| No Fuel Used | 0 (0.0%) | 0 (0.0%) |
| Total | 108 (100.0%) | 120 (100.0%) |
Household Vehicle Usage in George
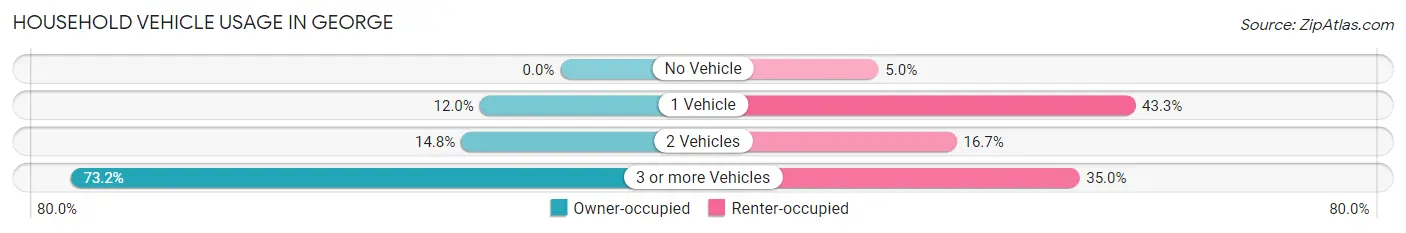
| Vehicles per Household | Owner-occupied | Renter-occupied |
| No Vehicle | 0 (0.0%) | 6 (5.0%) |
| 1 Vehicle | 13 (12.0%) | 52 (43.3%) |
| 2 Vehicles | 16 (14.8%) | 20 (16.7%) |
| 3 or more Vehicles | 79 (73.2%) | 42 (35.0%) |
| Total | 108 (100.0%) | 120 (100.0%) |
Real Estate & Mortgages in George
Real Estate and Mortgage Overview in George
| Characteristic | Without Mortgage | With Mortgage |
| Housing Units | 58 | 50 |
| Median Property Value | $166,300 | $159,800 |
| Median Household Income | $63,375 | $0 |
| Monthly Housing Costs | $485 | $0 |
| Real Estate Taxes | $946 | $0 |
Property Value by Mortgage Status in George
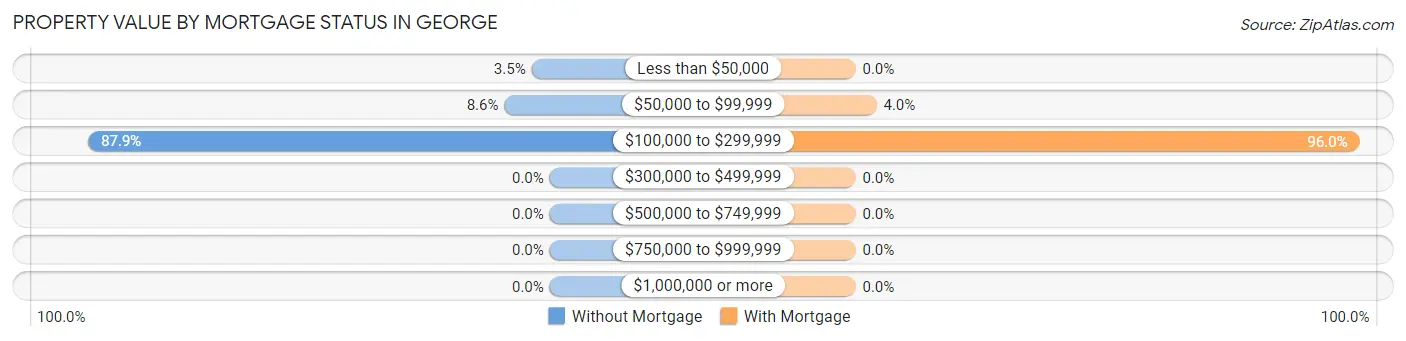
| Property Value | Without Mortgage | With Mortgage |
| Less than $50,000 | 2 (3.5%) | 0 (0.0%) |
| $50,000 to $99,999 | 5 (8.6%) | 2 (4.0%) |
| $100,000 to $299,999 | 51 (87.9%) | 48 (96.0%) |
| $300,000 to $499,999 | 0 (0.0%) | 0 (0.0%) |
| $500,000 to $749,999 | 0 (0.0%) | 0 (0.0%) |
| $750,000 to $999,999 | 0 (0.0%) | 0 (0.0%) |
| $1,000,000 or more | 0 (0.0%) | 0 (0.0%) |
| Total | 58 (100.0%) | 50 (100.0%) |
Household Income by Mortgage Status in George
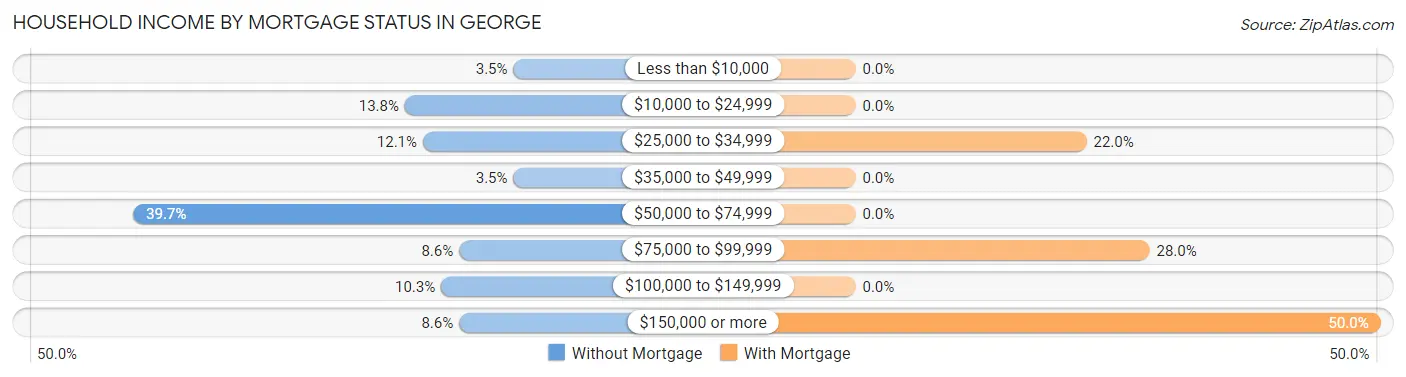
| Household Income | Without Mortgage | With Mortgage |
| Less than $10,000 | 2 (3.5%) | 0 (0.0%) |
| $10,000 to $24,999 | 8 (13.8%) | 0 (0.0%) |
| $25,000 to $34,999 | 7 (12.1%) | 11 (22.0%) |
| $35,000 to $49,999 | 2 (3.5%) | 0 (0.0%) |
| $50,000 to $74,999 | 23 (39.7%) | 0 (0.0%) |
| $75,000 to $99,999 | 5 (8.6%) | 14 (28.0%) |
| $100,000 to $149,999 | 6 (10.3%) | 0 (0.0%) |
| $150,000 or more | 5 (8.6%) | 25 (50.0%) |
| Total | 58 (100.0%) | 50 (100.0%) |
Property Value to Household Income Ratio in George
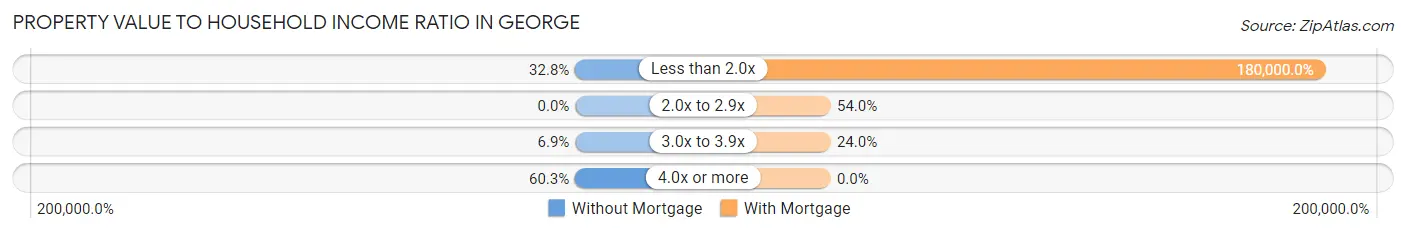
| Value-to-Income Ratio | Without Mortgage | With Mortgage |
| Less than 2.0x | 19 (32.8%) | 90,000 (180,000.0%) |
| 2.0x to 2.9x | 0 (0.0%) | 27 (54.0%) |
| 3.0x to 3.9x | 4 (6.9%) | 12 (24.0%) |
| 4.0x or more | 35 (60.3%) | 0 (0.0%) |
| Total | 58 (100.0%) | 50 (100.0%) |
Real Estate Taxes by Mortgage Status in George
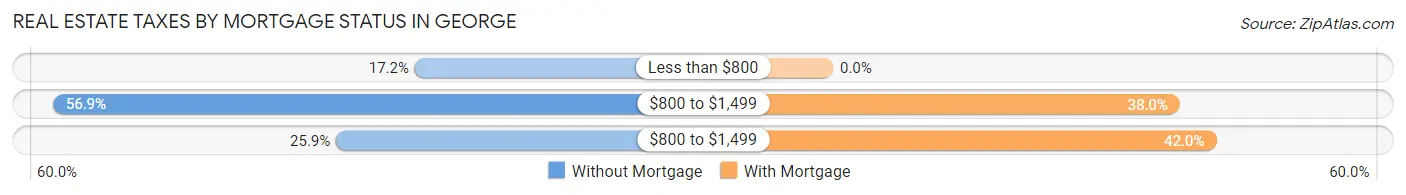
| Property Taxes | Without Mortgage | With Mortgage |
| Less than $800 | 10 (17.2%) | 0 (0.0%) |
| $800 to $1,499 | 33 (56.9%) | 19 (38.0%) |
| $800 to $1,499 | 15 (25.9%) | 21 (42.0%) |
| Total | 58 (100.0%) | 50 (100.0%) |
Health & Disability in George
Health Insurance Coverage by Age in George
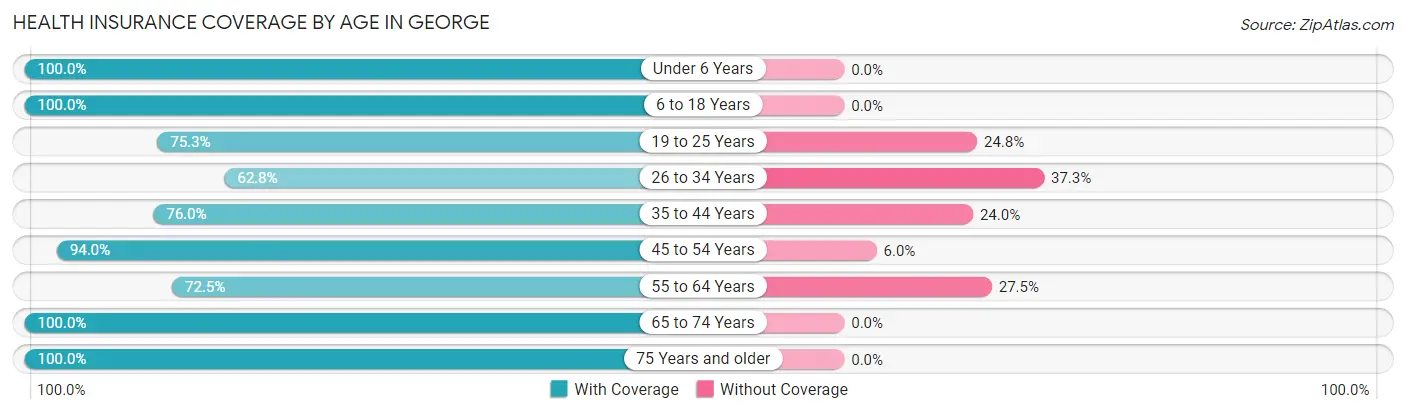
| Age Bracket | With Coverage | Without Coverage |
| Under 6 Years | 175 (100.0%) | 0 (0.0%) |
| 6 to 18 Years | 139 (100.0%) | 0 (0.0%) |
| 19 to 25 Years | 76 (75.2%) | 25 (24.7%) |
| 26 to 34 Years | 128 (62.7%) | 76 (37.2%) |
| 35 to 44 Years | 38 (76.0%) | 12 (24.0%) |
| 45 to 54 Years | 78 (94.0%) | 5 (6.0%) |
| 55 to 64 Years | 58 (72.5%) | 22 (27.5%) |
| 65 to 74 Years | 25 (100.0%) | 0 (0.0%) |
| 75 Years and older | 35 (100.0%) | 0 (0.0%) |
| Total | 752 (84.3%) | 140 (15.7%) |
Health Insurance Coverage by Citizenship Status in George

| Citizenship Status | With Coverage | Without Coverage |
| Native Born | 175 (100.0%) | 0 (0.0%) |
| Foreign Born, Citizen | 139 (100.0%) | 0 (0.0%) |
| Foreign Born, not a Citizen | 76 (75.2%) | 25 (24.7%) |
Health Insurance Coverage by Household Income in George
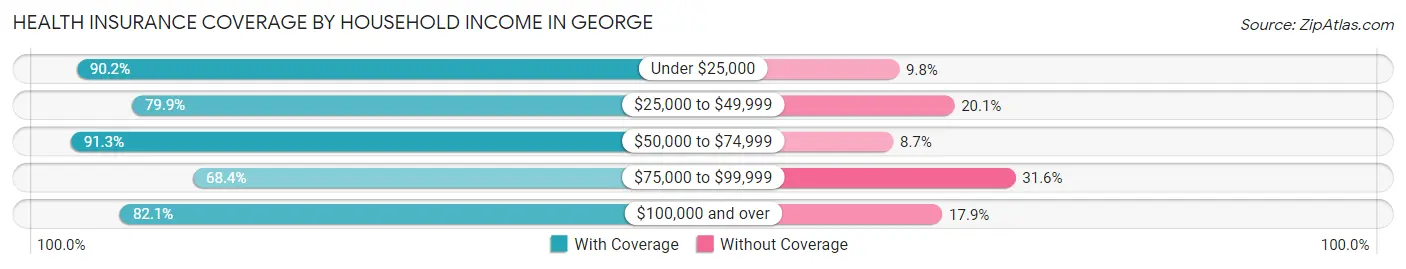
| Household Income | With Coverage | Without Coverage |
| Under $25,000 | 46 (90.2%) | 5 (9.8%) |
| $25,000 to $49,999 | 270 (79.9%) | 68 (20.1%) |
| $50,000 to $74,999 | 253 (91.3%) | 24 (8.7%) |
| $75,000 to $99,999 | 13 (68.4%) | 6 (31.6%) |
| $100,000 and over | 170 (82.1%) | 37 (17.9%) |
Public vs Private Health Insurance Coverage by Age in George
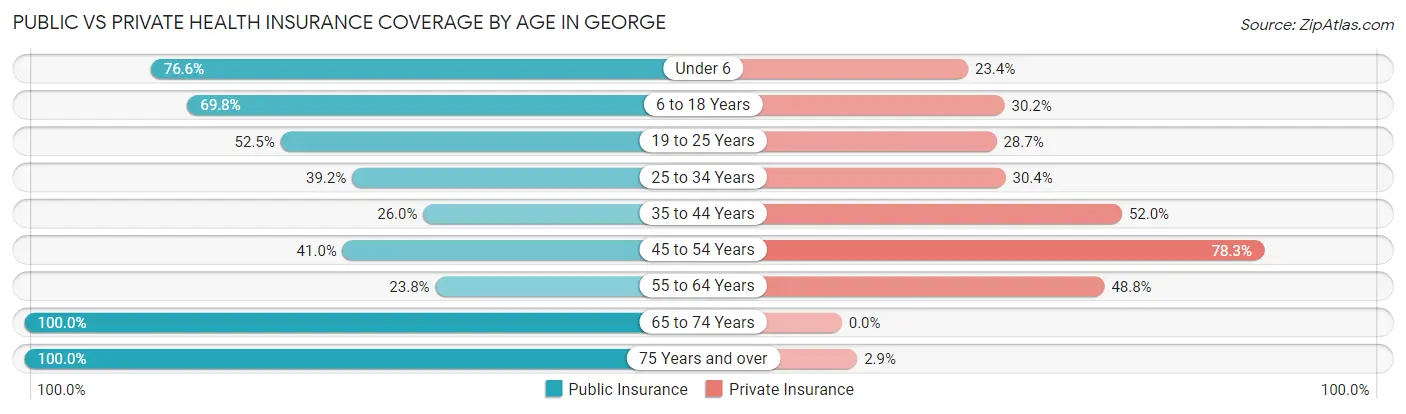
| Age Bracket | Public Insurance | Private Insurance |
| Under 6 | 134 (76.6%) | 41 (23.4%) |
| 6 to 18 Years | 97 (69.8%) | 42 (30.2%) |
| 19 to 25 Years | 53 (52.5%) | 29 (28.7%) |
| 25 to 34 Years | 80 (39.2%) | 62 (30.4%) |
| 35 to 44 Years | 13 (26.0%) | 26 (52.0%) |
| 45 to 54 Years | 34 (41.0%) | 65 (78.3%) |
| 55 to 64 Years | 19 (23.7%) | 39 (48.7%) |
| 65 to 74 Years | 25 (100.0%) | 0 (0.0%) |
| 75 Years and over | 35 (100.0%) | 1 (2.9%) |
| Total | 490 (54.9%) | 305 (34.2%) |
Disability Status by Sex by Age in George
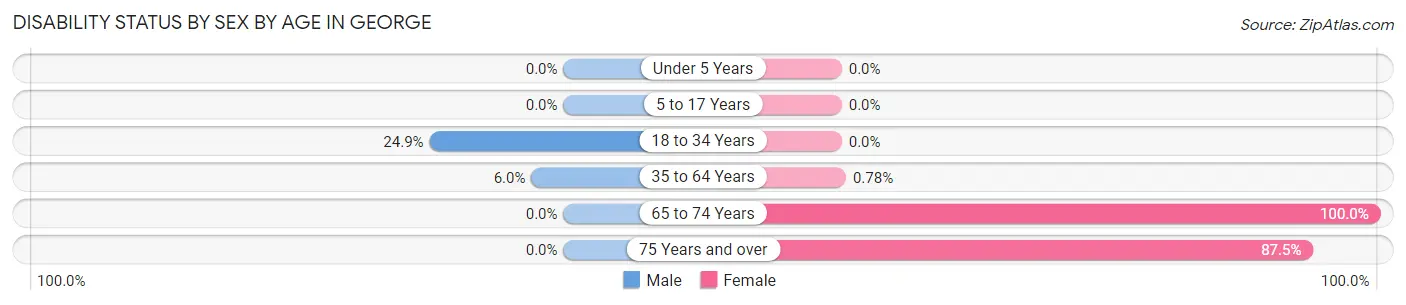
| Age Bracket | Male | Female |
| Under 5 Years | 0 (0.0%) | 0 (0.0%) |
| 5 to 17 Years | 0 (0.0%) | 0 (0.0%) |
| 18 to 34 Years | 43 (24.9%) | 0 (0.0%) |
| 35 to 64 Years | 5 (5.9%) | 1 (0.8%) |
| 65 to 74 Years | 0 (0.0%) | 7 (100.0%) |
| 75 Years and over | 0 (0.0%) | 7 (87.5%) |
Disability Class by Sex by Age in George
Disability Class: Hearing Difficulty
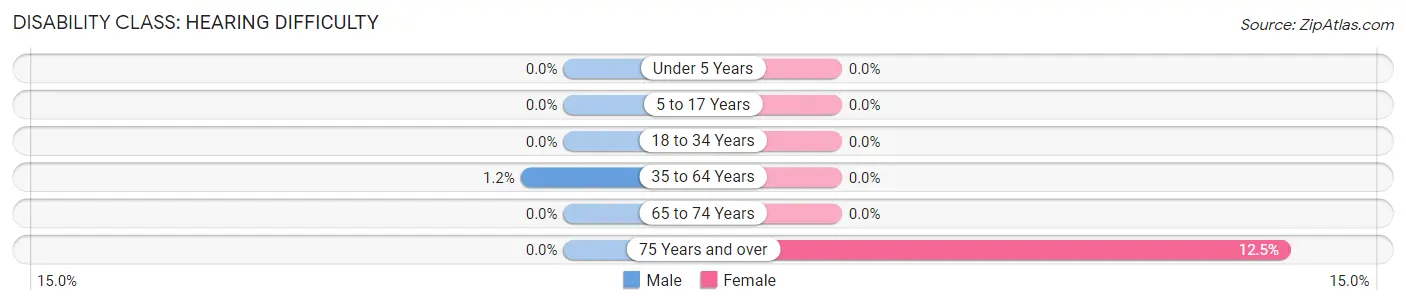
| Age Bracket | Male | Female |
| Under 5 Years | 0 (0.0%) | 0 (0.0%) |
| 5 to 17 Years | 0 (0.0%) | 0 (0.0%) |
| 18 to 34 Years | 0 (0.0%) | 0 (0.0%) |
| 35 to 64 Years | 1 (1.2%) | 0 (0.0%) |
| 65 to 74 Years | 0 (0.0%) | 0 (0.0%) |
| 75 Years and over | 0 (0.0%) | 1 (12.5%) |
Disability Class: Vision Difficulty
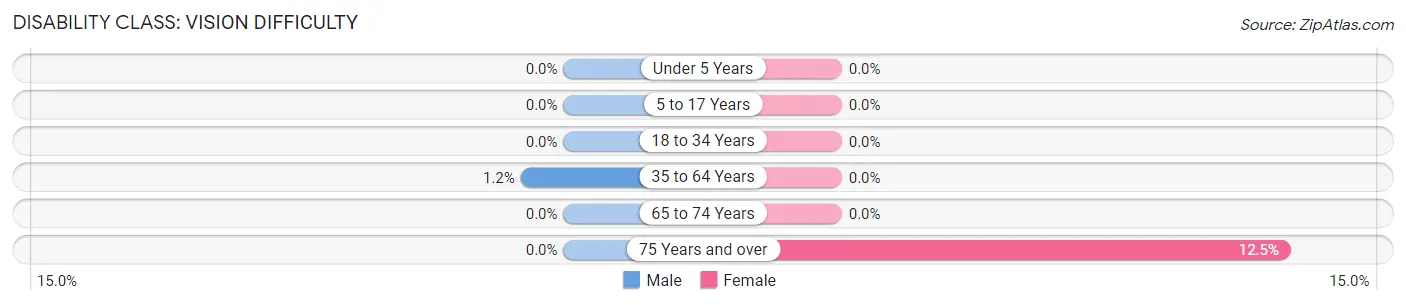
| Age Bracket | Male | Female |
| Under 5 Years | 0 (0.0%) | 0 (0.0%) |
| 5 to 17 Years | 0 (0.0%) | 0 (0.0%) |
| 18 to 34 Years | 0 (0.0%) | 0 (0.0%) |
| 35 to 64 Years | 1 (1.2%) | 0 (0.0%) |
| 65 to 74 Years | 0 (0.0%) | 0 (0.0%) |
| 75 Years and over | 0 (0.0%) | 1 (12.5%) |
Disability Class: Cognitive Difficulty
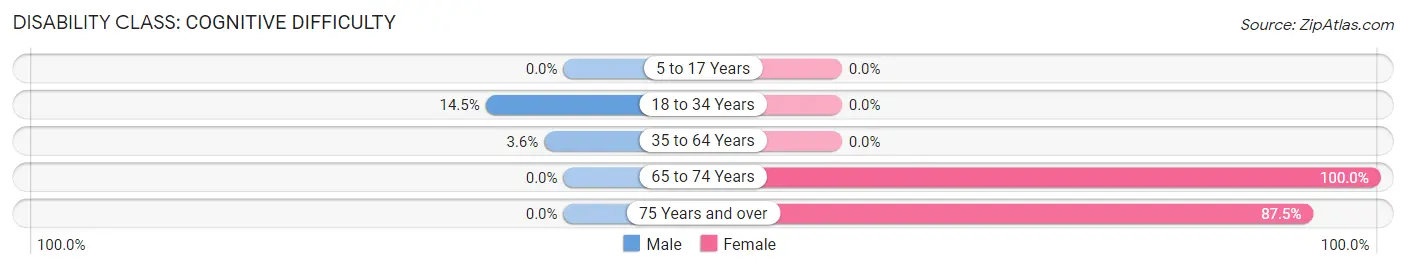
| Age Bracket | Male | Female |
| 5 to 17 Years | 0 (0.0%) | 0 (0.0%) |
| 18 to 34 Years | 25 (14.4%) | 0 (0.0%) |
| 35 to 64 Years | 3 (3.6%) | 0 (0.0%) |
| 65 to 74 Years | 0 (0.0%) | 7 (100.0%) |
| 75 Years and over | 0 (0.0%) | 7 (87.5%) |
Disability Class: Ambulatory Difficulty
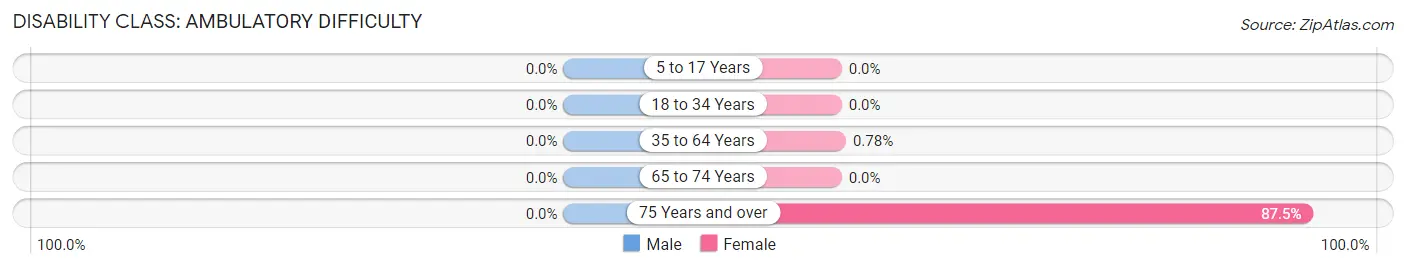
| Age Bracket | Male | Female |
| 5 to 17 Years | 0 (0.0%) | 0 (0.0%) |
| 18 to 34 Years | 0 (0.0%) | 0 (0.0%) |
| 35 to 64 Years | 0 (0.0%) | 1 (0.8%) |
| 65 to 74 Years | 0 (0.0%) | 0 (0.0%) |
| 75 Years and over | 0 (0.0%) | 7 (87.5%) |
Disability Class: Self-Care Difficulty

| Age Bracket | Male | Female |
| 5 to 17 Years | 0 (0.0%) | 0 (0.0%) |
| 18 to 34 Years | 18 (10.4%) | 0 (0.0%) |
| 35 to 64 Years | 0 (0.0%) | 0 (0.0%) |
| 65 to 74 Years | 0 (0.0%) | 0 (0.0%) |
| 75 Years and over | 0 (0.0%) | 1 (12.5%) |
Technology Access in George
Computing Device Access in George
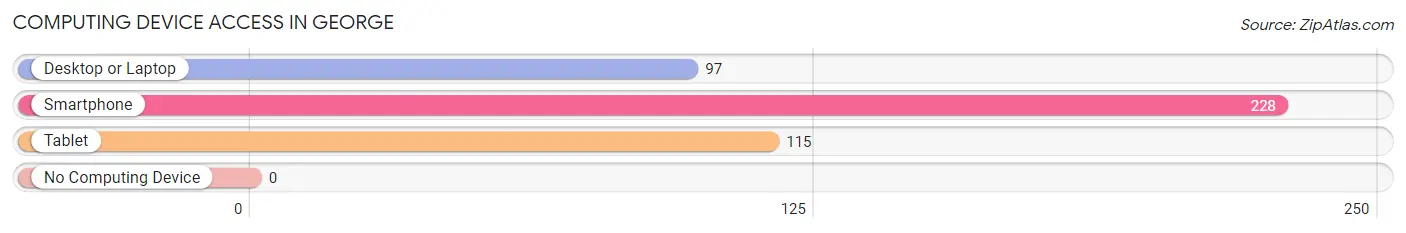
| Device Type | # Households | % Households |
| Desktop or Laptop | 97 | 42.5% |
| Smartphone | 228 | 100.0% |
| Tablet | 115 | 50.4% |
| No Computing Device | 0 | 0.0% |
| Total | 228 | 100.0% |
Internet Access in George
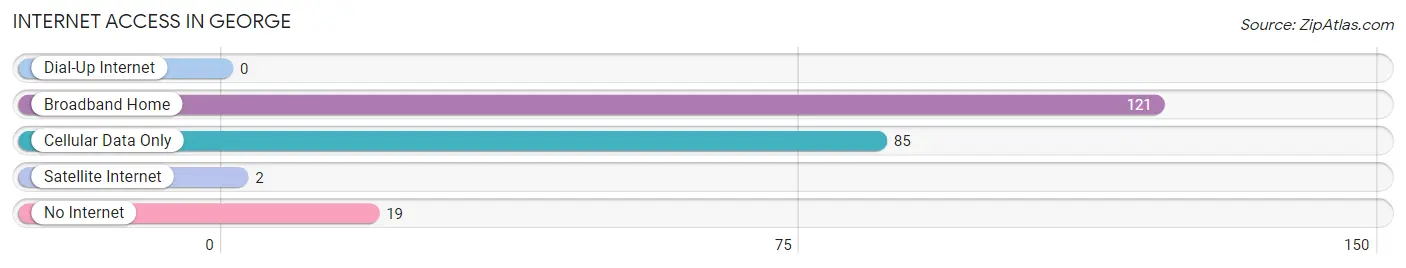
| Internet Type | # Households | % Households |
| Dial-Up Internet | 0 | 0.0% |
| Broadband Home | 121 | 53.1% |
| Cellular Data Only | 85 | 37.3% |
| Satellite Internet | 2 | 0.9% |
| No Internet | 19 | 8.3% |
| Total | 228 | 100.0% |
George Summary
George, Washington is a small city located in the southwestern corner of the state of Washington. It is situated in the foothills of the Cascade Mountains, and is the county seat of Grant County. The city is home to a population of approximately 3,924 people, according to the 2010 census.
History
The area that is now George, Washington was first inhabited by Native American tribes, including the Yakama, Palouse, and Nez Perce. The first European settlers arrived in the area in the late 1800s, and the town of George was officially incorporated in 1909. The city was named after George Washington, the first president of the United States.
Geography
George is located in the southwestern corner of Washington, in the foothills of the Cascade Mountains. The city is situated at an elevation of 1,845 feet above sea level. The city is located on the banks of the Columbia River, and is surrounded by the Grant County towns of Quincy, Ephrata, Moses Lake, and Royal City.
Climate
George has a semi-arid climate, with hot summers and cold winters. The average high temperature in the summer months is around 90 degrees Fahrenheit, while the average low temperature in the winter months is around 20 degrees Fahrenheit. The city receives an average of 8.5 inches of precipitation per year, with most of it falling in the winter months.
Economy
George’s economy is largely based on agriculture and tourism. The city is home to several wineries, as well as a number of fruit orchards and vegetable farms. The city is also home to a number of manufacturing companies, including a paper mill and a plastics factory. Tourism is also an important part of the local economy, with visitors coming to the area to enjoy the nearby lakes, rivers, and mountains.
Demographics
According to the 2010 census, the population of George was 3,924. The racial makeup of the city was 91.3% White, 0.7% African American, 0.7% Native American, 0.7% Asian, 0.2% Pacific Islander, 4.2% from other races, and 2.1% from two or more races. The median household income in the city was $37,917, and the median age was 37.7 years.
Conclusion
George, Washington is a small city located in the southwestern corner of the state of Washington. It is situated in the foothills of the Cascade Mountains, and is the county seat of Grant County. The city is home to a population of approximately 3,924 people, according to the 2010 census. The economy of George is largely based on agriculture and tourism, and the city is home to several wineries, as well as a number of manufacturing companies. The racial makeup of the city is 91.3% White, 0.7% African American, 0.7% Native American, 0.7% Asian, 0.2% Pacific Islander, 4.2% from other races, and 2.1% from two or more races. The median household income in the city was $37,917, and the median age was 37.7 years.
Common Questions
What is Per Capita Income in George?
Per Capita income in George is $14,729.
What is the Median Family Income in George?
Median Family Income in George is $56,250.
What is the Median Household income in George?
Median Household Income in George is $48,333.
What is Income or Wage Gap in George?
Income or Wage Gap in George is 20.5%.
Women in George earn 79.5 cents for every dollar earned by a man.
What is Inequality or Gini Index in George?
Inequality or Gini Index in George is 0.36.
What is the Total Population of George?
Total Population of George is 892.
What is the Total Male Population of George?
Total Male Population of George is 452.
What is the Total Female Population of George?
Total Female Population of George is 440.
What is the Ratio of Males per 100 Females in George?
There are 102.73 Males per 100 Females in George.
What is the Ratio of Females per 100 Males in George?
There are 97.35 Females per 100 Males in George.
What is the Median Population Age in George?
Median Population Age in George is 26.8 Years.
What is the Average Family Size in George
Average Family Size in George is 4.2 People.
What is the Average Household Size in George
Average Household Size in George is 3.9 People.
How Large is the Labor Force in George?
There are 418 People in the Labor Forcein in George.
What is the Percentage of People in the Labor Force in George?
68.0% of People are in the Labor Force in George.
What is the Unemployment Rate in George?
Unemployment Rate in George is 9.3%.