Cities with the Highest Percentage of Population Employed in Material Moving in Washington
RELATED REPORTS & OPTIONS
Material Moving
Washington
Compare Cities
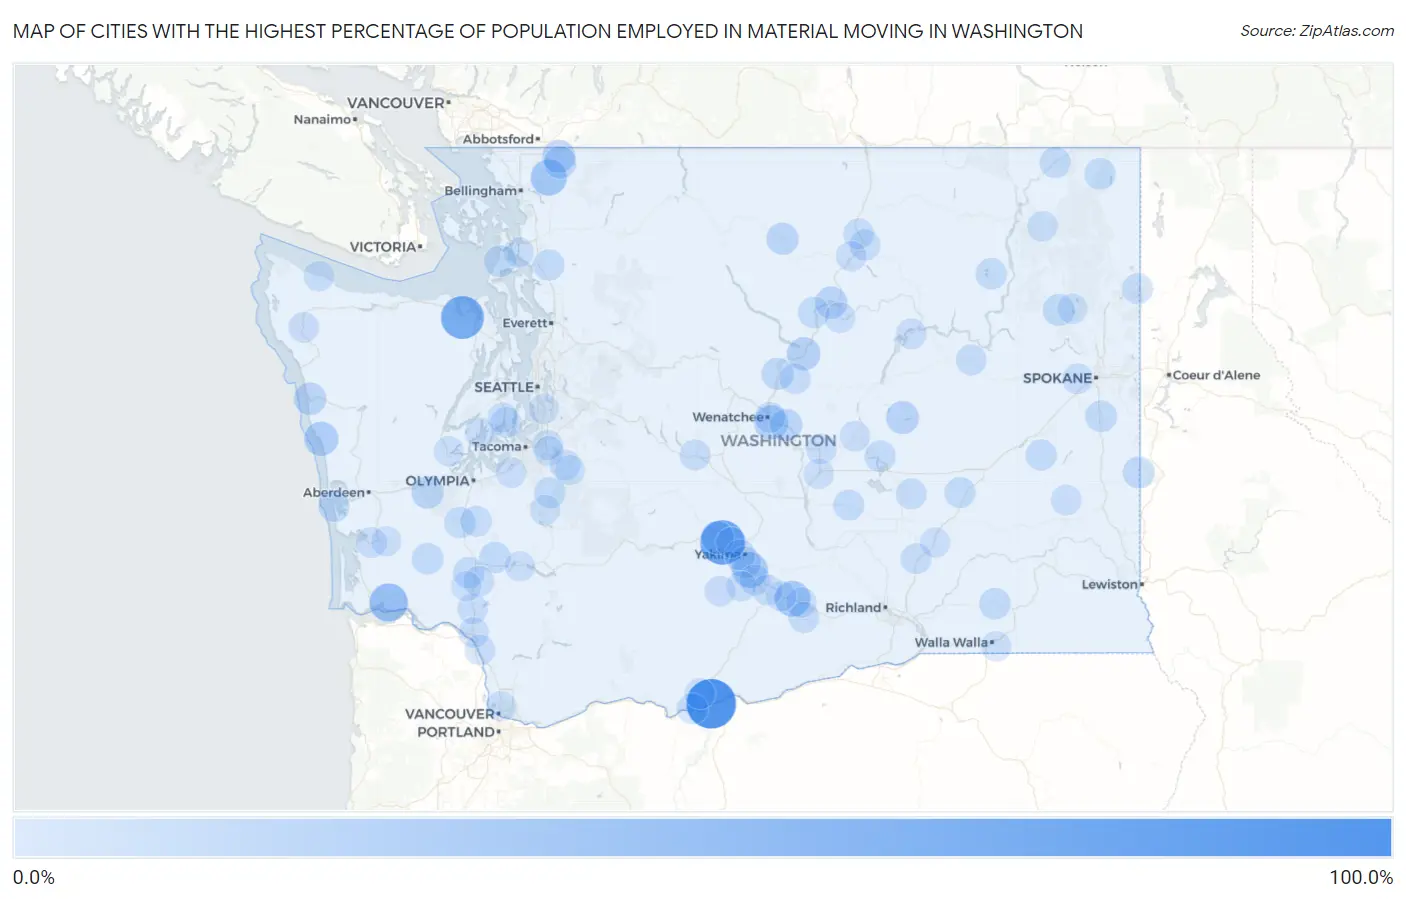
Map of Cities with the Highest Percentage of Population Employed in Material Moving in Washington
0.0%
100.0%
Cities with the Highest Percentage of Population Employed in Material Moving in Washington
| City | % Employed | vs State | vs National | |
| 1. | Maryhill | 100.0% | 3.7%(+96.3)#1 | 3.8%(+96.2)#23 |
| 2. | Cowiche | 75.2% | 3.7%(+71.6)#2 | 3.8%(+71.4)#43 |
| 3. | Blyn | 67.2% | 3.7%(+63.6)#3 | 3.8%(+63.4)#50 |
| 4. | Rosburg | 44.0% | 3.7%(+40.3)#4 | 3.8%(+40.2)#129 |
| 5. | Deming | 34.4% | 3.7%(+30.7)#5 | 3.8%(+30.5)#228 |
| 6. | Outlook | 32.7% | 3.7%(+29.0)#6 | 3.8%(+28.9)#258 |
| 7. | Parker | 32.3% | 3.7%(+28.6)#7 | 3.8%(+28.4)#264 |
| 8. | South Wenatchee | 25.8% | 3.7%(+22.1)#8 | 3.8%(+21.9)#419 |
| 9. | Santiago | 25.0% | 3.7%(+21.3)#9 | 3.8%(+21.2)#443 |
| 10. | Chelan Falls | 21.3% | 3.7%(+17.6)#10 | 3.8%(+17.5)#637 |
| 11. | Peaceful Valley | 19.8% | 3.7%(+16.2)#11 | 3.8%(+16.0)#741 |
| 12. | Wilson Creek | 19.6% | 3.7%(+16.0)#12 | 3.8%(+15.8)#753 |
| 13. | Tieton | 19.2% | 3.7%(+15.5)#13 | 3.8%(+15.4)#781 |
| 14. | Kendall | 17.5% | 3.7%(+13.8)#14 | 3.8%(+13.6)#979 |
| 15. | Queets | 17.2% | 3.7%(+13.6)#15 | 3.8%(+13.4)#1,004 |
| 16. | Malone | 16.9% | 3.7%(+13.2)#16 | 3.8%(+13.1)#1,054 |
| 17. | Brewster | 16.4% | 3.7%(+12.7)#17 | 3.8%(+12.6)#1,124 |
| 18. | Rock Island | 16.2% | 3.7%(+12.6)#18 | 3.8%(+12.4)#1,156 |
| 19. | Winthrop | 15.8% | 3.7%(+12.2)#19 | 3.8%(+12.0)#1,218 |
| 20. | Whidbey Island Station | 14.9% | 3.7%(+11.3)#20 | 3.8%(+11.1)#1,391 |
| 21. | Union Gap | 14.8% | 3.7%(+11.2)#21 | 3.8%(+11.0)#1,406 |
| 22. | Entiat | 14.8% | 3.7%(+11.2)#22 | 3.8%(+11.0)#1,414 |
| 23. | Farmington | 14.3% | 3.7%(+10.6)#23 | 3.8%(+10.5)#1,536 |
| 24. | Springdale | 13.7% | 3.7%(+10.0)#24 | 3.8%(+9.88)#1,699 |
| 25. | Onalaska | 13.3% | 3.7%(+9.67)#25 | 3.8%(+9.50)#1,802 |
| 26. | Pe Ell | 13.2% | 3.7%(+9.54)#26 | 3.8%(+9.37)#1,854 |
| 27. | Spangle | 13.1% | 3.7%(+9.44)#27 | 3.8%(+9.27)#1,889 |
| 28. | Prescott | 12.4% | 3.7%(+8.74)#28 | 3.8%(+8.57)#2,144 |
| 29. | Winlock | 12.3% | 3.7%(+8.64)#29 | 3.8%(+8.48)#2,171 |
| 30. | Pateros | 12.3% | 3.7%(+8.60)#30 | 3.8%(+8.44)#2,194 |
| 31. | Grand Mound | 12.0% | 3.7%(+8.36)#31 | 3.8%(+8.19)#2,281 |
| 32. | Metaline | 12.0% | 3.7%(+8.34)#32 | 3.8%(+8.17)#2,292 |
| 33. | Beacon Hill | 12.0% | 3.7%(+8.30)#33 | 3.8%(+8.13)#2,304 |
| 34. | Lake Mcmurray | 11.9% | 3.7%(+8.27)#34 | 3.8%(+8.10)#2,314 |
| 35. | Westport | 11.8% | 3.7%(+8.16)#35 | 3.8%(+7.99)#2,359 |
| 36. | Twin Lakes | 11.8% | 3.7%(+8.10)#36 | 3.8%(+7.93)#2,394 |
| 37. | Lind | 11.6% | 3.7%(+7.90)#37 | 3.8%(+7.74)#2,472 |
| 38. | Moses Lake North | 11.4% | 3.7%(+7.73)#38 | 3.8%(+7.56)#2,540 |
| 39. | Kapowsin | 11.3% | 3.7%(+7.66)#39 | 3.8%(+7.50)#2,571 |
| 40. | Lamont | 11.3% | 3.7%(+7.66)#40 | 3.8%(+7.49)#2,579 |
| 41. | Northport | 11.1% | 3.7%(+7.45)#41 | 3.8%(+7.28)#2,678 |
| 42. | Royal City | 11.0% | 3.7%(+7.32)#42 | 3.8%(+7.15)#2,740 |
| 43. | Wishram | 10.9% | 3.7%(+7.27)#43 | 3.8%(+7.11)#2,762 |
| 44. | Bucoda | 10.5% | 3.7%(+6.86)#44 | 3.8%(+6.70)#2,968 |
| 45. | Purdy | 10.5% | 3.7%(+6.79)#45 | 3.8%(+6.62)#3,013 |
| 46. | Cle Elum | 10.2% | 3.7%(+6.51)#46 | 3.8%(+6.34)#3,171 |
| 47. | Yakima | 10.0% | 3.7%(+6.33)#47 | 3.8%(+6.16)#3,319 |
| 48. | Newport | 10.0% | 3.7%(+6.32)#48 | 3.8%(+6.16)#3,322 |
| 49. | Mabton | 9.9% | 3.7%(+6.28)#49 | 3.8%(+6.12)#3,333 |
| 50. | Erlands Point | 9.8% | 3.7%(+6.16)#50 | 3.8%(+5.99)#3,411 |
| 51. | Waterville | 9.8% | 3.7%(+6.15)#51 | 3.8%(+5.98)#3,420 |
| 52. | North Omak | 9.8% | 3.7%(+6.11)#52 | 3.8%(+5.95)#3,450 |
| 53. | Mesa | 9.5% | 3.7%(+5.86)#53 | 3.8%(+5.69)#3,624 |
| 54. | Riverside | 9.5% | 3.7%(+5.80)#54 | 3.8%(+5.64)#3,688 |
| 55. | Creston | 9.5% | 3.7%(+5.80)#55 | 3.8%(+5.63)#3,691 |
| 56. | East Wenatchee | 9.4% | 3.7%(+5.79)#56 | 3.8%(+5.62)#3,702 |
| 57. | Warden | 9.4% | 3.7%(+5.76)#57 | 3.8%(+5.59)#3,737 |
| 58. | Wapato | 9.4% | 3.7%(+5.70)#58 | 3.8%(+5.53)#3,782 |
| 59. | South Prairie | 9.2% | 3.7%(+5.59)#59 | 3.8%(+5.42)#3,861 |
| 60. | Toppenish | 9.2% | 3.7%(+5.52)#60 | 3.8%(+5.35)#3,915 |
| 61. | South Bend | 9.2% | 3.7%(+5.51)#61 | 3.8%(+5.34)#3,923 |
| 62. | Sunnyside | 9.1% | 3.7%(+5.47)#62 | 3.8%(+5.30)#3,965 |
| 63. | Forks | 9.0% | 3.7%(+5.34)#63 | 3.8%(+5.18)#4,080 |
| 64. | Centerville | 9.0% | 3.7%(+5.29)#64 | 3.8%(+5.12)#4,120 |
| 65. | White Swan | 8.9% | 3.7%(+5.21)#65 | 3.8%(+5.05)#4,167 |
| 66. | Endicott | 8.9% | 3.7%(+5.21)#66 | 3.8%(+5.04)#4,170 |
| 67. | Bridgeport | 8.9% | 3.7%(+5.19)#67 | 3.8%(+5.03)#4,185 |
| 68. | Quincy | 8.8% | 3.7%(+5.11)#68 | 3.8%(+4.94)#4,262 |
| 69. | Ephrata | 8.8% | 3.7%(+5.10)#69 | 3.8%(+4.93)#4,268 |
| 70. | Eschbach | 8.5% | 3.7%(+4.80)#70 | 3.8%(+4.63)#4,540 |
| 71. | Toledo | 8.3% | 3.7%(+4.64)#71 | 3.8%(+4.47)#4,703 |
| 72. | Electric City | 8.3% | 3.7%(+4.64)#72 | 3.8%(+4.47)#4,709 |
| 73. | Castle Rock | 8.3% | 3.7%(+4.63)#73 | 3.8%(+4.47)#4,710 |
| 74. | Okanogan | 8.2% | 3.7%(+4.54)#74 | 3.8%(+4.37)#4,823 |
| 75. | Kalama | 8.0% | 3.7%(+4.37)#75 | 3.8%(+4.20)#5,004 |
| 76. | Fort Lewis | 8.0% | 3.7%(+4.33)#76 | 3.8%(+4.16)#5,052 |
| 77. | Airway Heights | 7.9% | 3.7%(+4.27)#77 | 3.8%(+4.10)#5,127 |
| 78. | Harrah | 7.8% | 3.7%(+4.18)#78 | 3.8%(+4.01)#5,242 |
| 79. | Clallam Bay | 7.8% | 3.7%(+4.17)#79 | 3.8%(+4.00)#5,264 |
| 80. | Kelso | 7.8% | 3.7%(+4.14)#80 | 3.8%(+3.98)#5,301 |
| 81. | Pacific | 7.8% | 3.7%(+4.14)#81 | 3.8%(+3.98)#5,306 |
| 82. | Colville | 7.8% | 3.7%(+4.11)#82 | 3.8%(+3.95)#5,334 |
| 83. | Eatonville | 7.6% | 3.7%(+3.96)#83 | 3.8%(+3.79)#5,525 |
| 84. | Connell | 7.6% | 3.7%(+3.94)#84 | 3.8%(+3.78)#5,548 |
| 85. | Granger | 7.6% | 3.7%(+3.92)#85 | 3.8%(+3.76)#5,569 |
| 86. | Hazel Dell | 7.5% | 3.7%(+3.85)#86 | 3.8%(+3.68)#5,663 |
| 87. | Walla Walla East | 7.4% | 3.7%(+3.77)#87 | 3.8%(+3.60)#5,768 |
| 88. | Burley | 7.3% | 3.7%(+3.65)#88 | 3.8%(+3.49)#5,922 |
| 89. | Tukwila | 7.3% | 3.7%(+3.60)#89 | 3.8%(+3.43)#6,010 |
| 90. | Shelton | 7.2% | 3.7%(+3.56)#90 | 3.8%(+3.39)#6,059 |
| 91. | Vader | 7.2% | 3.7%(+3.51)#91 | 3.8%(+3.34)#6,141 |
| 92. | George | 7.1% | 3.7%(+3.46)#92 | 3.8%(+3.29)#6,203 |
| 93. | Grapeview | 7.1% | 3.7%(+3.43)#93 | 3.8%(+3.26)#6,236 |
| 94. | La Conner | 7.1% | 3.7%(+3.42)#94 | 3.8%(+3.25)#6,251 |
| 95. | Loon Lake | 7.1% | 3.7%(+3.40)#95 | 3.8%(+3.23)#6,282 |
| 96. | Willapa | 7.0% | 3.7%(+3.38)#96 | 3.8%(+3.21)#6,313 |
| 97. | Marine View | 7.0% | 3.7%(+3.31)#97 | 3.8%(+3.15)#6,417 |
| 98. | Wilkeson | 6.9% | 3.7%(+3.27)#98 | 3.8%(+3.10)#6,488 |
| 99. | Sumner | 6.9% | 3.7%(+3.27)#99 | 3.8%(+3.10)#6,493 |
| 100. | Mossyrock | 6.9% | 3.7%(+3.23)#100 | 3.8%(+3.07)#6,542 |
Common Questions
What are the Top 10 Cities with the Highest Percentage of Population Employed in Material Moving in Washington?
Top 10 Cities with the Highest Percentage of Population Employed in Material Moving in Washington are:
#1
100.0%
#2
75.2%
#3
67.2%
#4
44.0%
#5
34.4%
#6
32.7%
#7
32.3%
#8
25.8%
#9
25.0%
#10
21.3%
What city has the Highest Percentage of Population Employed in Material Moving in Washington?
Maryhill has the Highest Percentage of Population Employed in Material Moving in Washington with 100.0%.
What is the Percentage of Population Employed in Material Moving in the State of Washington?
Percentage of Population Employed in Material Moving in Washington is 3.7%.
What is the Percentage of Population Employed in Material Moving in the United States?
Percentage of Population Employed in Material Moving in the United States is 3.8%.