Chelan, WA Map & Demographics
Chelan Map
Chelan Overview
$37,777
PER CAPITA INCOME
$78,370
AVG FAMILY INCOME
$75,099
AVG HOUSEHOLD INCOME
44.3%
WAGE / INCOME GAP [ % ]
55.7¢/ $1
WAGE / INCOME GAP [ $ ]
$7,377
FAMILY INCOME DEFICIT
0.42
INEQUALITY / GINI INDEX
4,269
TOTAL POPULATION
2,029
MALE POPULATION
2,240
FEMALE POPULATION
90.58
MALES / 100 FEMALES
110.40
FEMALES / 100 MALES
39.8
MEDIAN AGE
3.4
AVG FAMILY SIZE
2.5
AVG HOUSEHOLD SIZE
2,136
LABOR FORCE [ PEOPLE ]
61.6%
PERCENT IN LABOR FORCE
3.3%
UNEMPLOYMENT RATE
Chelan Zip Codes
Chelan Area Codes
Income in Chelan
Income Overview in Chelan
Per Capita Income in Chelan is $37,777, while median incomes of families and households are $78,370 and $75,099 respectively.
| Characteristic | Number | Measure |
| Per Capita Income | 4,269 | $37,777 |
| Median Family Income | 978 | $78,370 |
| Mean Family Income | 978 | $101,410 |
| Median Household Income | 1,719 | $75,099 |
| Mean Household Income | 1,719 | $88,450 |
| Income Deficit | 978 | $7,377 |
| Wage / Income Gap (%) | 4,269 | 44.26% |
| Wage / Income Gap ($) | 4,269 | 55.74¢ per $1 |
| Gini / Inequality Index | 4,269 | 0.42 |
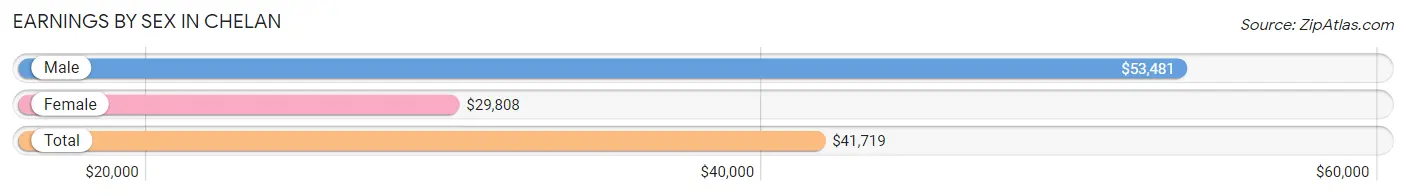
Earnings by Sex in Chelan
Average Earnings in Chelan are $41,719, $53,481 for men and $29,808 for women, a difference of 44.3%.
| Sex | Number | Average Earnings |
| Male | 1,205 (51.2%) | $53,481 |
| Female | 1,148 (48.8%) | $29,808 |
| Total | 2,353 (100.0%) | $41,719 |
Earnings by Sex by Income Bracket in Chelan
The most common earnings brackets in Chelan are $75,000 to $99,999 for men (218 | 18.1%) and $10,000 to $12,499 for women (158 | 13.8%).
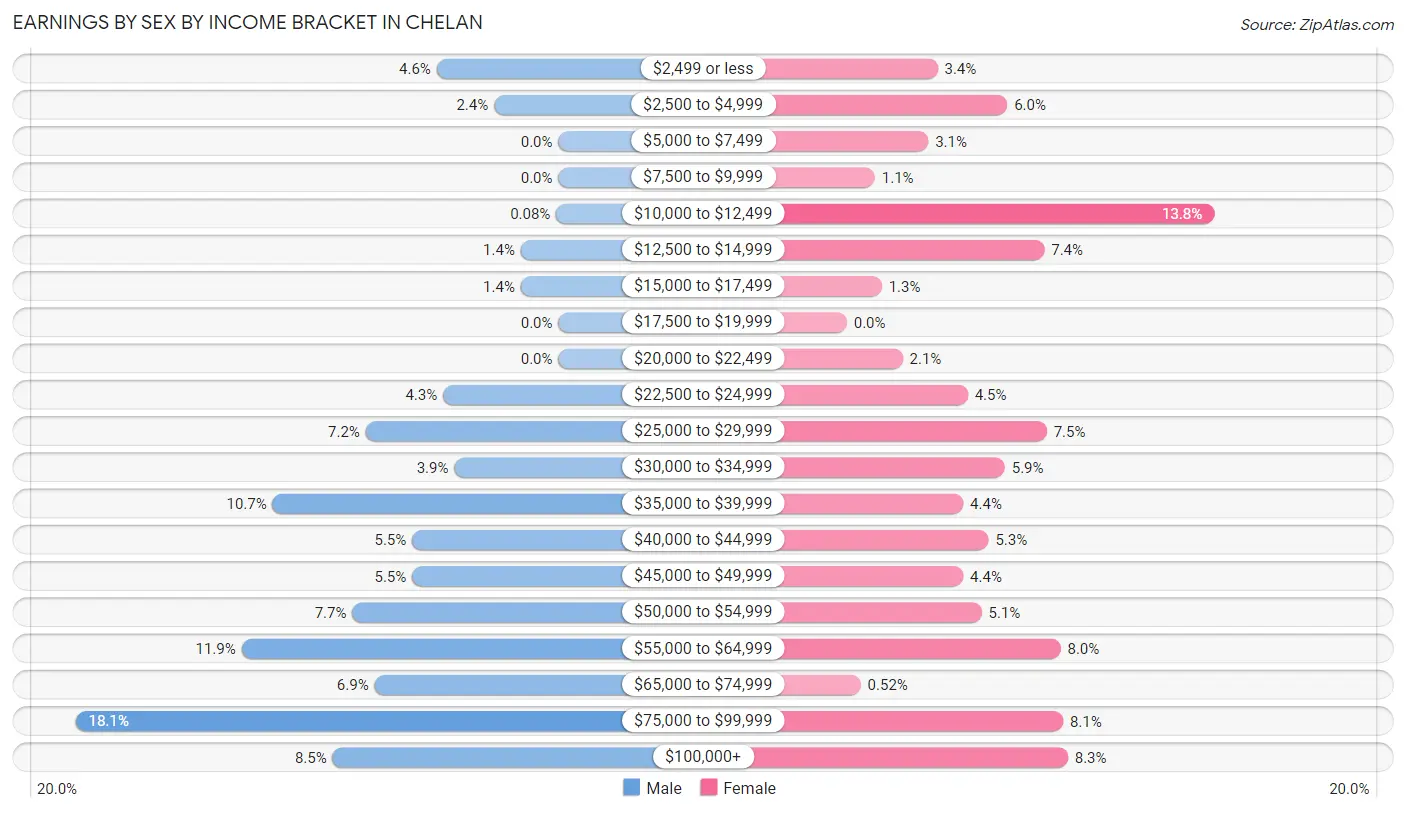
| Income | Male | Female |
| $2,499 or less | 55 (4.6%) | 39 (3.4%) |
| $2,500 to $4,999 | 29 (2.4%) | 69 (6.0%) |
| $5,000 to $7,499 | 0 (0.0%) | 35 (3.0%) |
| $7,500 to $9,999 | 0 (0.0%) | 12 (1.1%) |
| $10,000 to $12,499 | 1 (0.1%) | 158 (13.8%) |
| $12,500 to $14,999 | 17 (1.4%) | 85 (7.4%) |
| $15,000 to $17,499 | 17 (1.4%) | 15 (1.3%) |
| $17,500 to $19,999 | 0 (0.0%) | 0 (0.0%) |
| $20,000 to $22,499 | 0 (0.0%) | 24 (2.1%) |
| $22,500 to $24,999 | 52 (4.3%) | 52 (4.5%) |
| $25,000 to $29,999 | 87 (7.2%) | 86 (7.5%) |
| $30,000 to $34,999 | 47 (3.9%) | 68 (5.9%) |
| $35,000 to $39,999 | 129 (10.7%) | 50 (4.4%) |
| $40,000 to $44,999 | 66 (5.5%) | 61 (5.3%) |
| $45,000 to $49,999 | 66 (5.5%) | 50 (4.4%) |
| $50,000 to $54,999 | 93 (7.7%) | 58 (5.1%) |
| $55,000 to $64,999 | 143 (11.9%) | 92 (8.0%) |
| $65,000 to $74,999 | 83 (6.9%) | 6 (0.5%) |
| $75,000 to $99,999 | 218 (18.1%) | 93 (8.1%) |
| $100,000+ | 102 (8.5%) | 95 (8.3%) |
| Total | 1,205 (100.0%) | 1,148 (100.0%) |
Earnings by Sex by Educational Attainment in Chelan
Average earnings in Chelan are $54,879 for men and $42,795 for women, a difference of 22.0%. Men with an educational attainment of graduate degree enjoy the highest average annual earnings of $85,927, while those with less than high school education earn the least with $36,164. Women with an educational attainment of graduate degree earn the most with the average annual earnings of $76,076, while those with high school diploma education have the smallest earnings of $26,532.
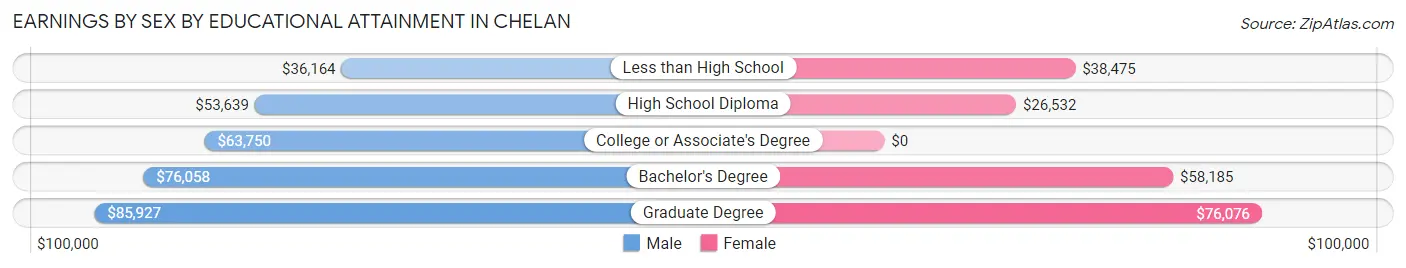
| Educational Attainment | Male Income | Female Income |
| Less than High School | $36,164 | $38,475 |
| High School Diploma | $53,639 | $26,532 |
| College or Associate's Degree | $63,750 | $0 |
| Bachelor's Degree | $76,058 | $58,185 |
| Graduate Degree | $85,927 | $76,076 |
| Total | $54,879 | $42,795 |
Family Income in Chelan
Family Income Brackets in Chelan
According to the Chelan family income data, there are 205 families falling into the $100,000 to $149,999 income range, which is the most common income bracket and makes up 21.0% of all families.
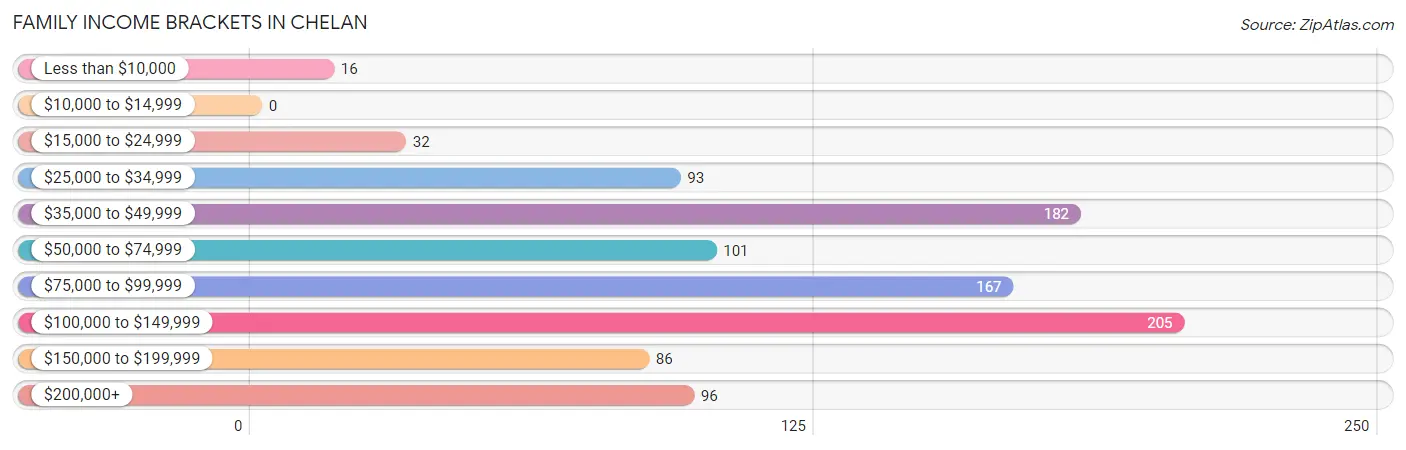
| Income Bracket | # Families | % Families |
| Less than $10,000 | 16 | 1.6% |
| $10,000 to $14,999 | 0 | 0.0% |
| $15,000 to $24,999 | 32 | 3.3% |
| $25,000 to $34,999 | 93 | 9.5% |
| $35,000 to $49,999 | 182 | 18.6% |
| $50,000 to $74,999 | 101 | 10.3% |
| $75,000 to $99,999 | 167 | 17.1% |
| $100,000 to $149,999 | 205 | 21.0% |
| $150,000 to $199,999 | 86 | 8.8% |
| $200,000+ | 96 | 9.8% |
Family Income by Famaliy Size in Chelan
3-person families (100 | 10.2%) account for the highest median family income in Chelan with $141,774 per family, while 3-person families (100 | 10.2%) have the highest median income of $47,258 per family member.
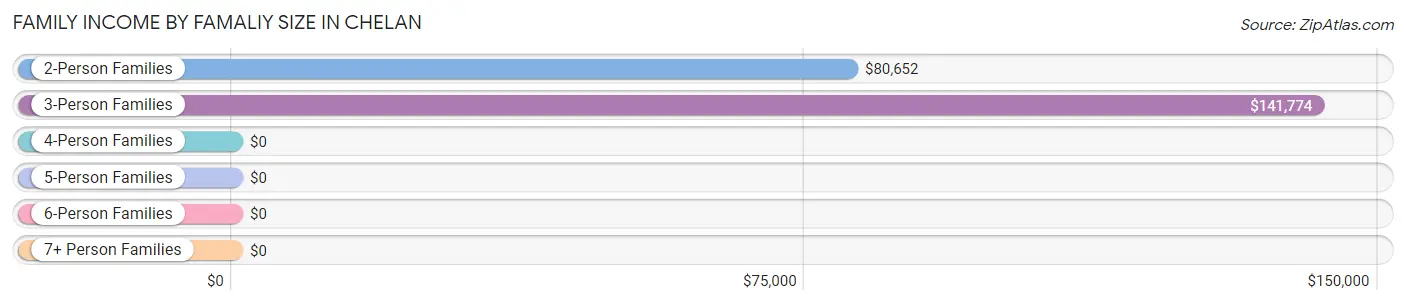
| Income Bracket | # Families | Median Income |
| 2-Person Families | 484 (49.5%) | $80,652 |
| 3-Person Families | 100 (10.2%) | $141,774 |
| 4-Person Families | 209 (21.4%) | $0 |
| 5-Person Families | 167 (17.1%) | $0 |
| 6-Person Families | 3 (0.3%) | $0 |
| 7+ Person Families | 15 (1.5%) | $0 |
| Total | 978 (100.0%) | $78,370 |
Family Income by Number of Earners in Chelan
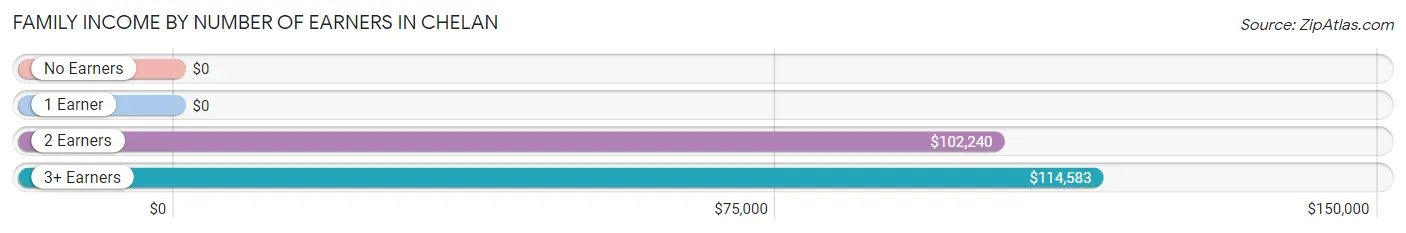
| Number of Earners | # Families | Median Income |
| No Earners | 155 (15.9%) | $0 |
| 1 Earner | 269 (27.5%) | $0 |
| 2 Earners | 419 (42.8%) | $102,240 |
| 3+ Earners | 135 (13.8%) | $114,583 |
| Total | 978 (100.0%) | $78,370 |
Household Income in Chelan
Household Income Brackets in Chelan
With 352 households falling in the category, the $75,000 to $99,999 income range is the most frequent in Chelan, accounting for 20.5% of all households. In contrast, only 33 households (1.9%) fall into the less than $10,000 income bracket, making it the least populous group.
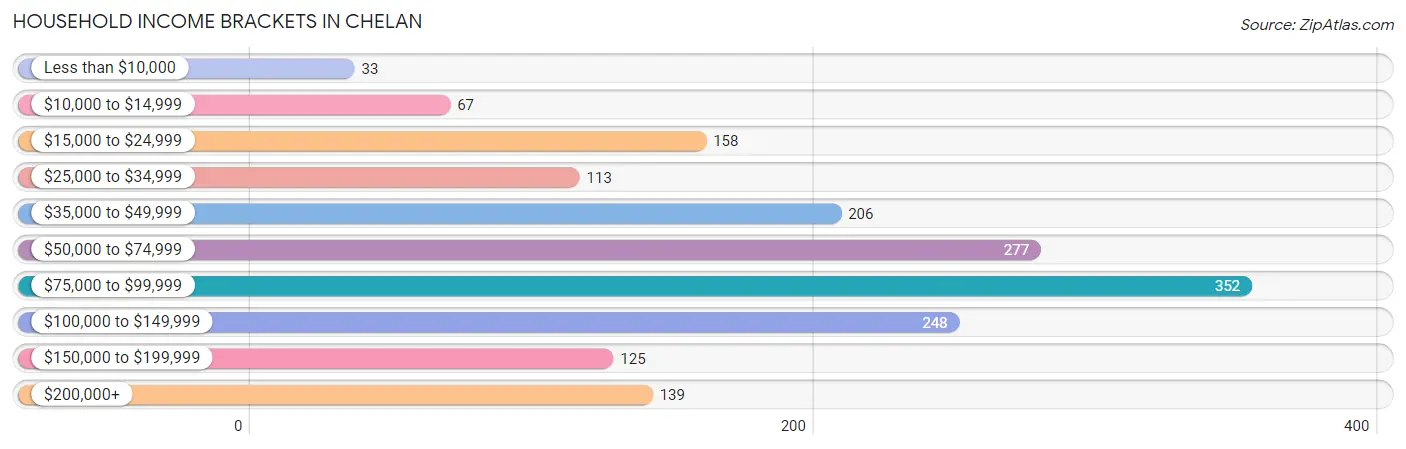
| Income Bracket | # Households | % Households |
| Less than $10,000 | 33 | 1.9% |
| $10,000 to $14,999 | 67 | 3.9% |
| $15,000 to $24,999 | 158 | 9.2% |
| $25,000 to $34,999 | 113 | 6.6% |
| $35,000 to $49,999 | 206 | 12.0% |
| $50,000 to $74,999 | 277 | 16.1% |
| $75,000 to $99,999 | 352 | 20.5% |
| $100,000 to $149,999 | 248 | 14.4% |
| $150,000 to $199,999 | 125 | 7.3% |
| $200,000+ | 139 | 8.1% |
Household Income by Householder Age in Chelan
The median household income in Chelan is $75,099, with the highest median household income of $79,402 found in the 45 to 64 years age bracket for the primary householder. A total of 538 households (31.3%) fall into this category. Meanwhile, the 15 to 24 years age bracket for the primary householder has the lowest median household income of $0, with 51 households (3.0%) in this group.
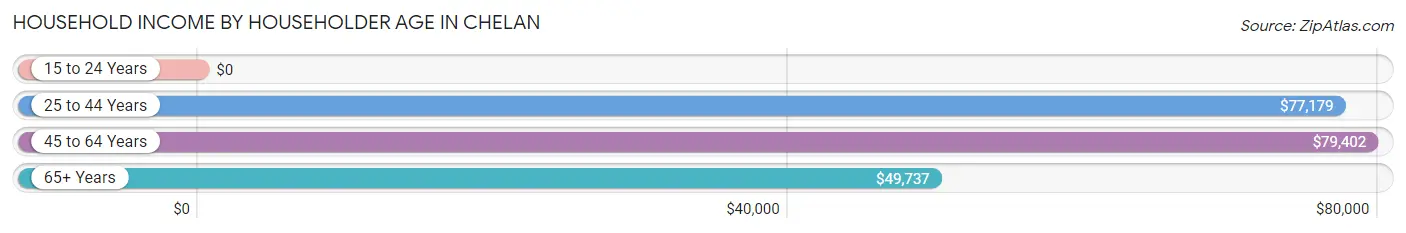
| Income Bracket | # Households | Median Income |
| 15 to 24 Years | 51 (3.0%) | $0 |
| 25 to 44 Years | 552 (32.1%) | $77,179 |
| 45 to 64 Years | 538 (31.3%) | $79,402 |
| 65+ Years | 578 (33.6%) | $49,737 |
| Total | 1,719 (100.0%) | $75,099 |
Poverty in Chelan
Income Below Poverty by Sex and Age in Chelan
With 11.4% poverty level for males and 6.7% for females among the residents of Chelan, under 5 year old males and 6 to 11 year old females are the most vulnerable to poverty, with 43 males (100.0%) and 64 females (50.0%) in their respective age groups living below the poverty level.
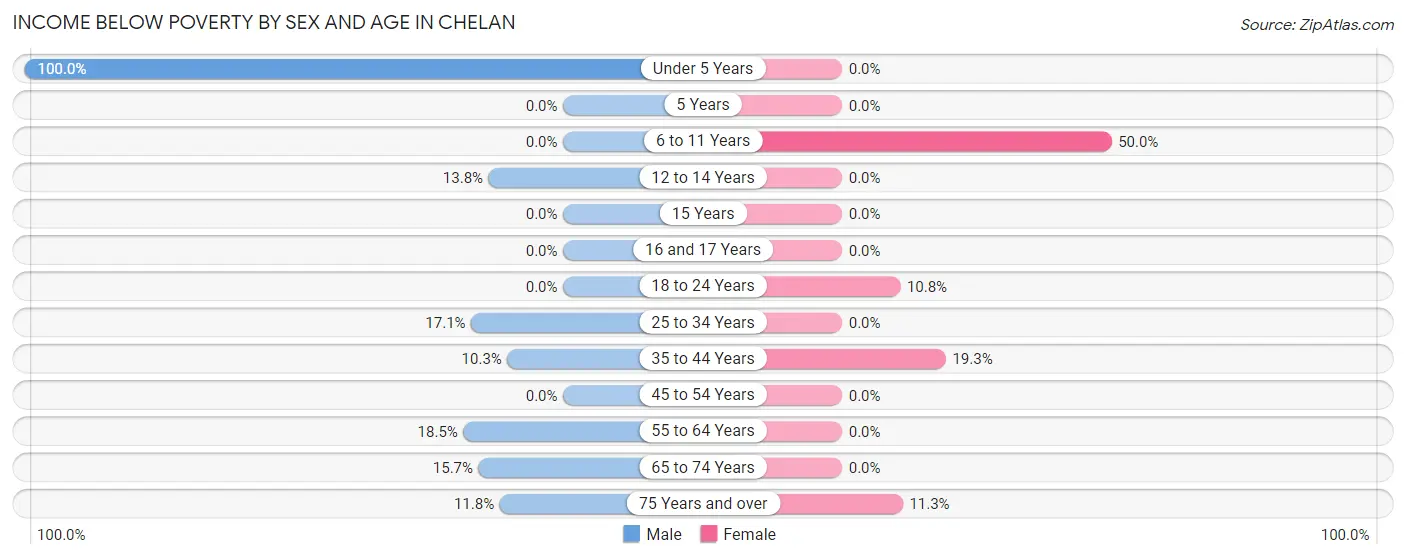
| Age Bracket | Male | Female |
| Under 5 Years | 43 (100.0%) | 0 (0.0%) |
| 5 Years | 0 (0.0%) | 0 (0.0%) |
| 6 to 11 Years | 0 (0.0%) | 64 (50.0%) |
| 12 to 14 Years | 30 (13.8%) | 0 (0.0%) |
| 15 Years | 0 (0.0%) | 0 (0.0%) |
| 16 and 17 Years | 0 (0.0%) | 0 (0.0%) |
| 18 to 24 Years | 0 (0.0%) | 26 (10.8%) |
| 25 to 34 Years | 28 (17.1%) | 0 (0.0%) |
| 35 to 44 Years | 30 (10.3%) | 41 (19.3%) |
| 45 to 54 Years | 0 (0.0%) | 0 (0.0%) |
| 55 to 64 Years | 47 (18.5%) | 0 (0.0%) |
| 65 to 74 Years | 37 (15.7%) | 0 (0.0%) |
| 75 Years and over | 16 (11.8%) | 17 (11.3%) |
| Total | 231 (11.4%) | 148 (6.7%) |
Income Above Poverty by Sex and Age in Chelan
According to the poverty statistics in Chelan, males aged 5 years and females aged under 5 years are the age groups that are most secure financially, with 100.0% of males and 100.0% of females in these age groups living above the poverty line.
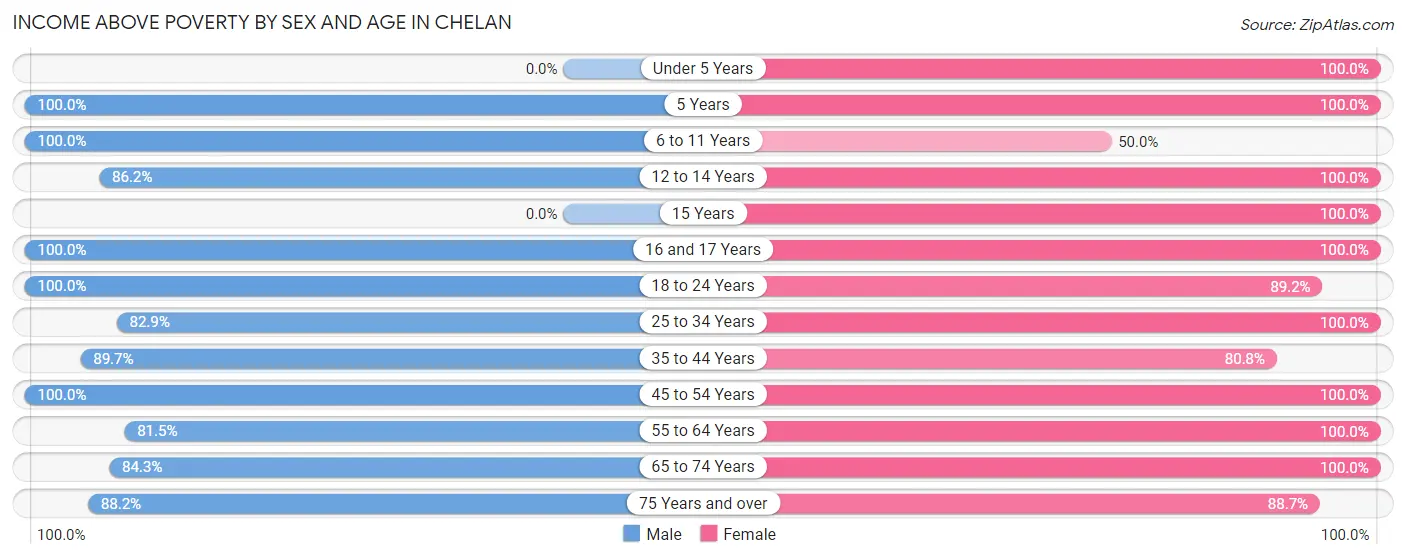
| Age Bracket | Male | Female |
| Under 5 Years | 0 (0.0%) | 124 (100.0%) |
| 5 Years | 37 (100.0%) | 34 (100.0%) |
| 6 to 11 Years | 76 (100.0%) | 64 (50.0%) |
| 12 to 14 Years | 187 (86.2%) | 112 (100.0%) |
| 15 Years | 0 (0.0%) | 30 (100.0%) |
| 16 and 17 Years | 20 (100.0%) | 68 (100.0%) |
| 18 to 24 Years | 163 (100.0%) | 215 (89.2%) |
| 25 to 34 Years | 136 (82.9%) | 330 (100.0%) |
| 35 to 44 Years | 260 (89.7%) | 172 (80.7%) |
| 45 to 54 Years | 388 (100.0%) | 128 (100.0%) |
| 55 to 64 Years | 207 (81.5%) | 232 (100.0%) |
| 65 to 74 Years | 199 (84.3%) | 412 (100.0%) |
| 75 Years and over | 120 (88.2%) | 134 (88.7%) |
| Total | 1,793 (88.6%) | 2,055 (93.3%) |
Income Below Poverty Among Married-Couple Families in Chelan
The poverty statistics for married-couple families in Chelan show that 8.1% or 69 of the total 852 families live below the poverty line. Families with 3 or 4 children have the highest poverty rate of 67.5%, comprising of 27 families. On the other hand, families with no children have the lowest poverty rate of 3.1%, which includes 16 families.
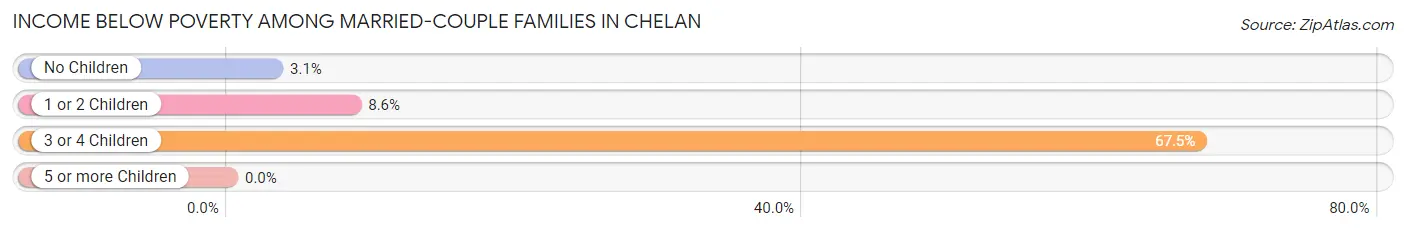
| Children | Above Poverty | Below Poverty |
| No Children | 493 (96.9%) | 16 (3.1%) |
| 1 or 2 Children | 277 (91.4%) | 26 (8.6%) |
| 3 or 4 Children | 13 (32.5%) | 27 (67.5%) |
| 5 or more Children | 0 (0.0%) | 0 (0.0%) |
| Total | 783 (91.9%) | 69 (8.1%) |
Income Below Poverty Among Single-Parent Households in Chelan
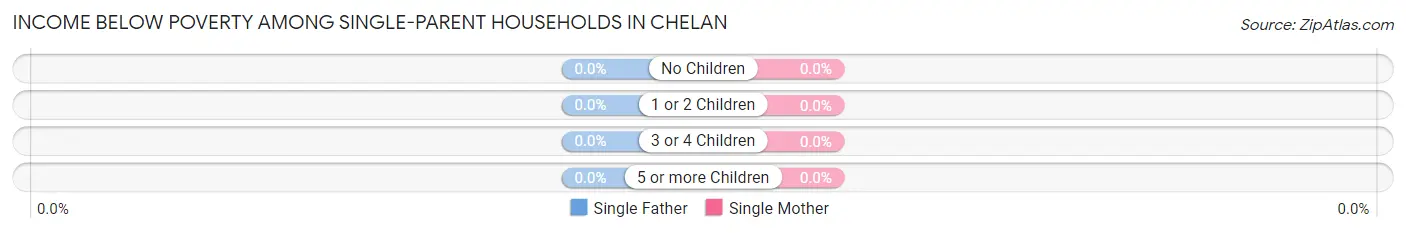
| Children | Single Father | Single Mother |
| No Children | 0 (0.0%) | 0 (0.0%) |
| 1 or 2 Children | 0 (0.0%) | 0 (0.0%) |
| 3 or 4 Children | 0 (0.0%) | 0 (0.0%) |
| 5 or more Children | 0 (0.0%) | 0 (0.0%) |
| Total | 0 (0.0%) | 0 (0.0%) |
Income Below Poverty Among Married-Couple vs Single-Parent Households in Chelan
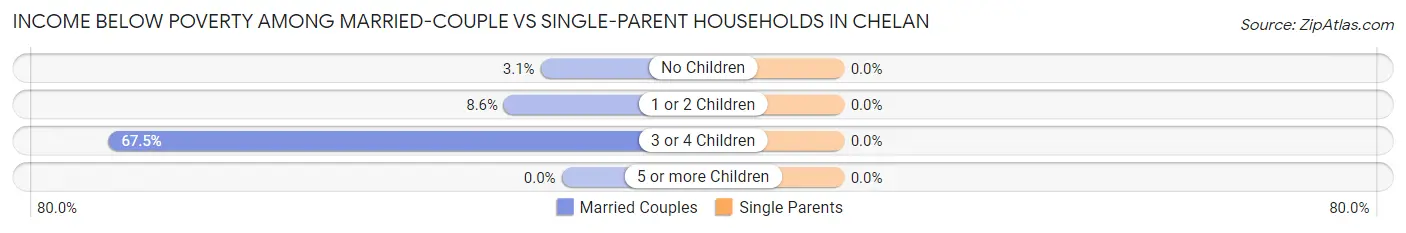
| Children | Married-Couple Families | Single-Parent Households |
| No Children | 16 (3.1%) | 0 (0.0%) |
| 1 or 2 Children | 26 (8.6%) | 0 (0.0%) |
| 3 or 4 Children | 27 (67.5%) | 0 (0.0%) |
| 5 or more Children | 0 (0.0%) | 0 (0.0%) |
| Total | 69 (8.1%) | 0 (0.0%) |
Race in Chelan
The most populous races in Chelan are White / Caucasian (2,973 | 69.6%), Hispanic or Latino (1,353 | 31.7%), and Two or more Races (633 | 14.8%).
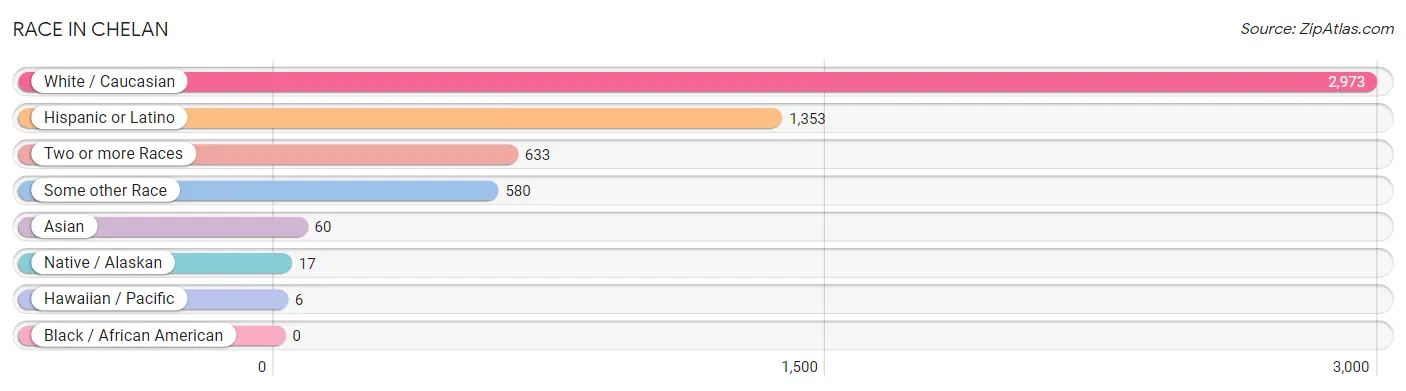
| Race | # Population | % Population |
| Asian | 60 | 1.4% |
| Black / African American | 0 | 0.0% |
| Hawaiian / Pacific | 6 | 0.1% |
| Hispanic or Latino | 1,353 | 31.7% |
| Native / Alaskan | 17 | 0.4% |
| White / Caucasian | 2,973 | 69.6% |
| Two or more Races | 633 | 14.8% |
| Some other Race | 580 | 13.6% |
| Total | 4,269 | 100.0% |
Ancestry in Chelan
The most populous ancestries reported in Chelan are Mexican (1,200 | 28.1%), German (909 | 21.3%), Irish (605 | 14.2%), Norwegian (309 | 7.2%), and English (297 | 7.0%), together accounting for 77.8% of all Chelan residents.
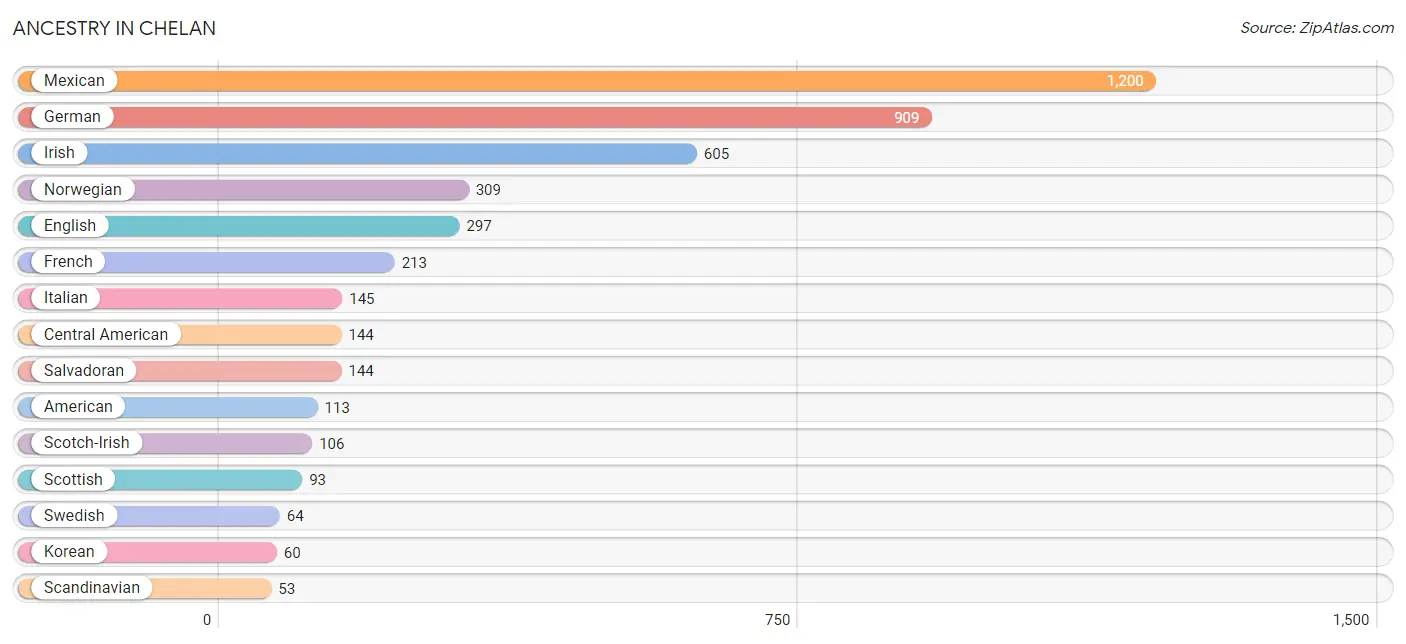
| Ancestry | # Population | % Population |
| American | 113 | 2.6% |
| Armenian | 42 | 1.0% |
| Celtic | 39 | 0.9% |
| Central American | 144 | 3.4% |
| Danish | 15 | 0.4% |
| Eastern European | 20 | 0.5% |
| English | 297 | 7.0% |
| Finnish | 15 | 0.4% |
| French | 213 | 5.0% |
| German | 909 | 21.3% |
| Hungarian | 14 | 0.3% |
| Irish | 605 | 14.2% |
| Italian | 145 | 3.4% |
| Korean | 60 | 1.4% |
| Mexican | 1,200 | 28.1% |
| Northern European | 10 | 0.2% |
| Norwegian | 309 | 7.2% |
| Polish | 9 | 0.2% |
| Puget Sound Salish | 6 | 0.1% |
| Russian | 21 | 0.5% |
| Salvadoran | 144 | 3.4% |
| Samoan | 6 | 0.1% |
| Scandinavian | 53 | 1.2% |
| Scotch-Irish | 106 | 2.5% |
| Scottish | 93 | 2.2% |
| Slovene | 4 | 0.1% |
| Swedish | 64 | 1.5% |
| Ukrainian | 44 | 1.0% |
| Yakama | 29 | 0.7% | View All 29 Rows |
Immigrants in Chelan
The most numerous immigrant groups reported in Chelan came from Central America (870 | 20.4%), Latin America (870 | 20.4%), Mexico (802 | 18.8%), El Salvador (68 | 1.6%), and Asia (60 | 1.4%), together accounting for 62.6% of all Chelan residents.
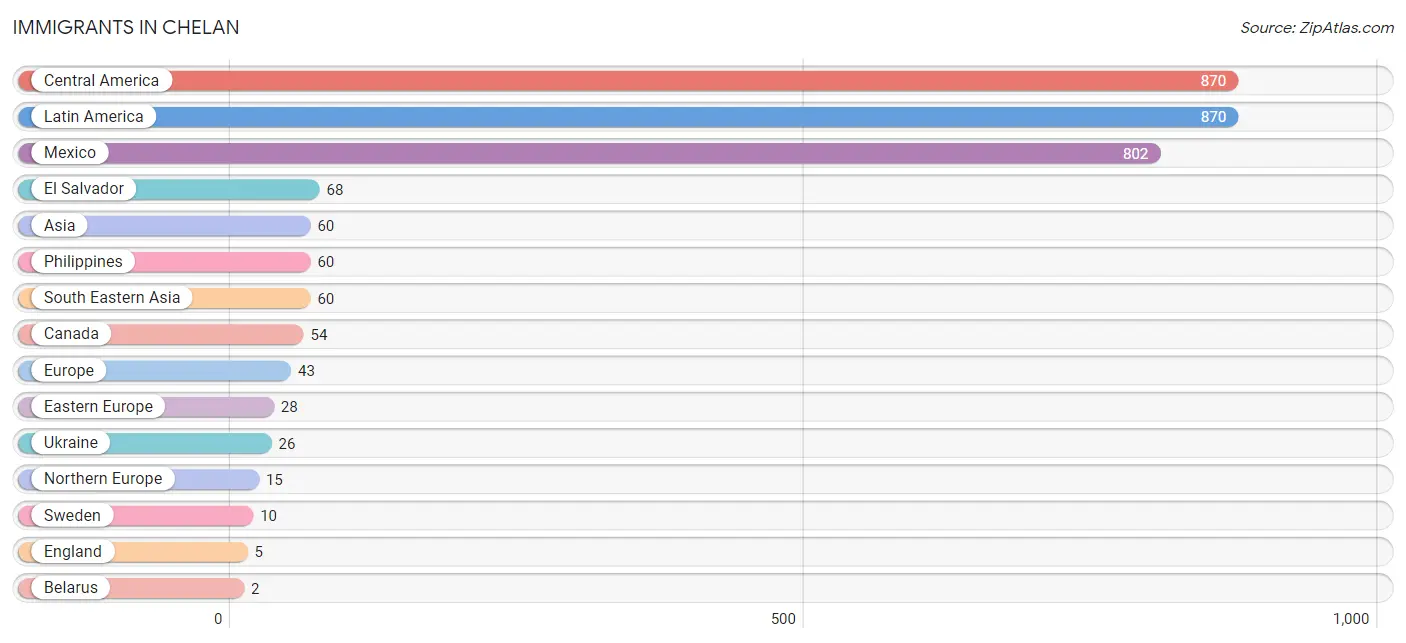
| Immigration Origin | # Population | % Population |
| Asia | 60 | 1.4% |
| Belarus | 2 | 0.1% |
| Canada | 54 | 1.3% |
| Central America | 870 | 20.4% |
| Eastern Europe | 28 | 0.7% |
| El Salvador | 68 | 1.6% |
| England | 5 | 0.1% |
| Europe | 43 | 1.0% |
| Latin America | 870 | 20.4% |
| Mexico | 802 | 18.8% |
| Northern Europe | 15 | 0.4% |
| Philippines | 60 | 1.4% |
| South Eastern Asia | 60 | 1.4% |
| Sweden | 10 | 0.2% |
| Ukraine | 26 | 0.6% | View All 15 Rows |
Sex and Age in Chelan
Sex and Age in Chelan
The most populous age groups in Chelan are 10 to 14 Years (217 | 10.7%) for men and 70 to 74 Years (228 | 10.2%) for women.
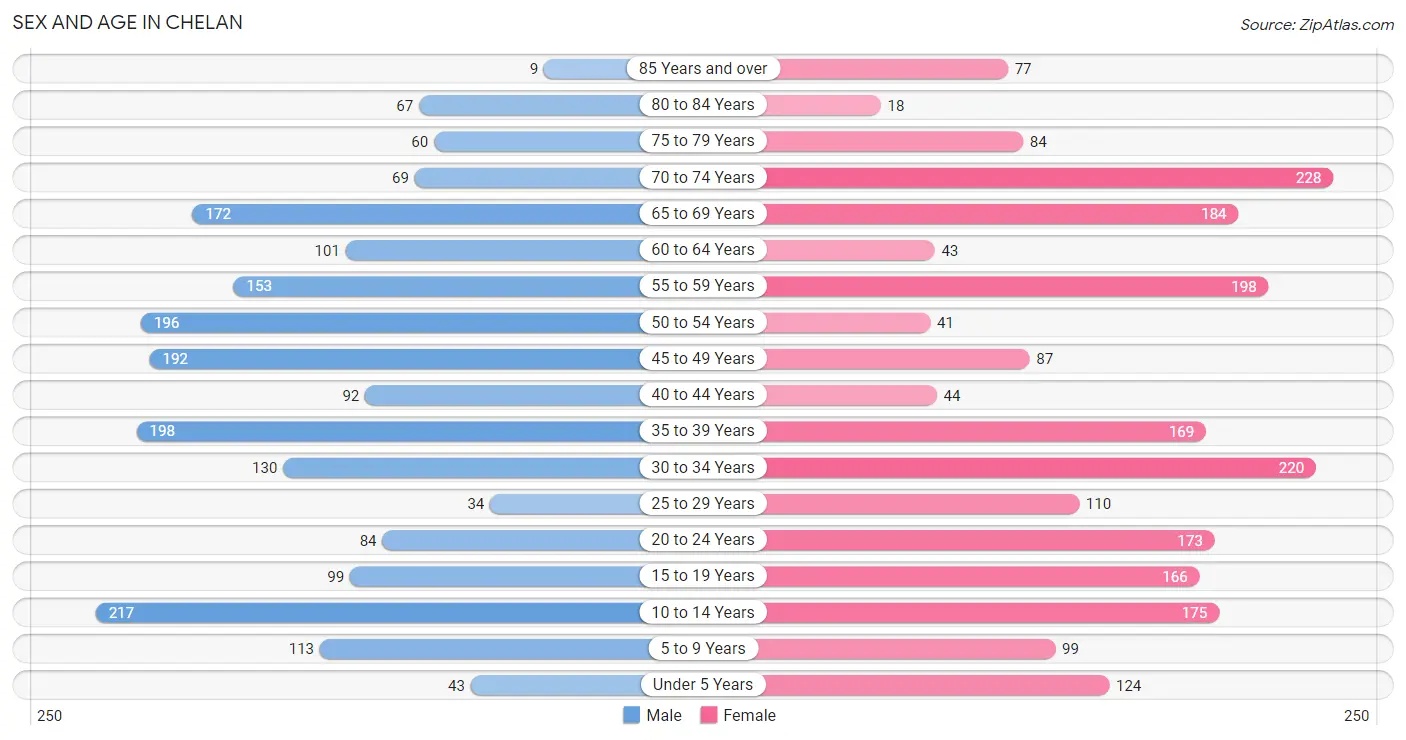
| Age Bracket | Male | Female |
| Under 5 Years | 43 (2.1%) | 124 (5.5%) |
| 5 to 9 Years | 113 (5.6%) | 99 (4.4%) |
| 10 to 14 Years | 217 (10.7%) | 175 (7.8%) |
| 15 to 19 Years | 99 (4.9%) | 166 (7.4%) |
| 20 to 24 Years | 84 (4.1%) | 173 (7.7%) |
| 25 to 29 Years | 34 (1.7%) | 110 (4.9%) |
| 30 to 34 Years | 130 (6.4%) | 220 (9.8%) |
| 35 to 39 Years | 198 (9.8%) | 169 (7.5%) |
| 40 to 44 Years | 92 (4.5%) | 44 (2.0%) |
| 45 to 49 Years | 192 (9.5%) | 87 (3.9%) |
| 50 to 54 Years | 196 (9.7%) | 41 (1.8%) |
| 55 to 59 Years | 153 (7.5%) | 198 (8.8%) |
| 60 to 64 Years | 101 (5.0%) | 43 (1.9%) |
| 65 to 69 Years | 172 (8.5%) | 184 (8.2%) |
| 70 to 74 Years | 69 (3.4%) | 228 (10.2%) |
| 75 to 79 Years | 60 (3.0%) | 84 (3.7%) |
| 80 to 84 Years | 67 (3.3%) | 18 (0.8%) |
| 85 Years and over | 9 (0.4%) | 77 (3.4%) |
| Total | 2,029 (100.0%) | 2,240 (100.0%) |
Families and Households in Chelan
Median Family Size in Chelan
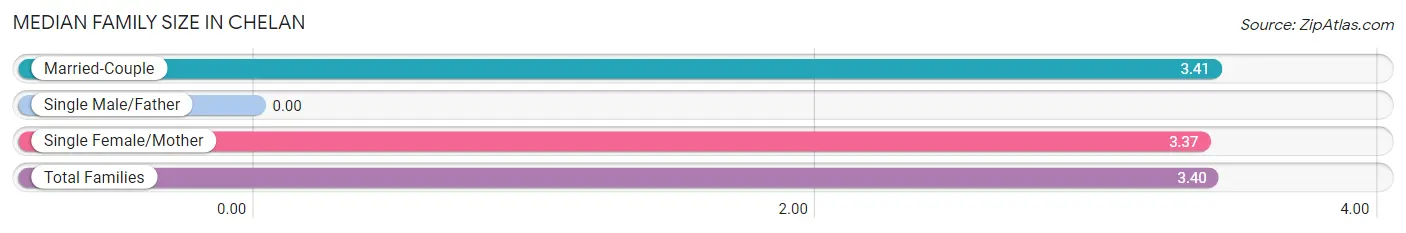
| Family Type | # Families | Family Size |
| Married-Couple | 852 (87.1%) | 3.41 |
| Single Male/Father | 0 (0.0%) | - |
| Single Female/Mother | 126 (12.9%) | 3.37 |
| Total Families | 978 (100.0%) | 3.40 |
Median Household Size in Chelan
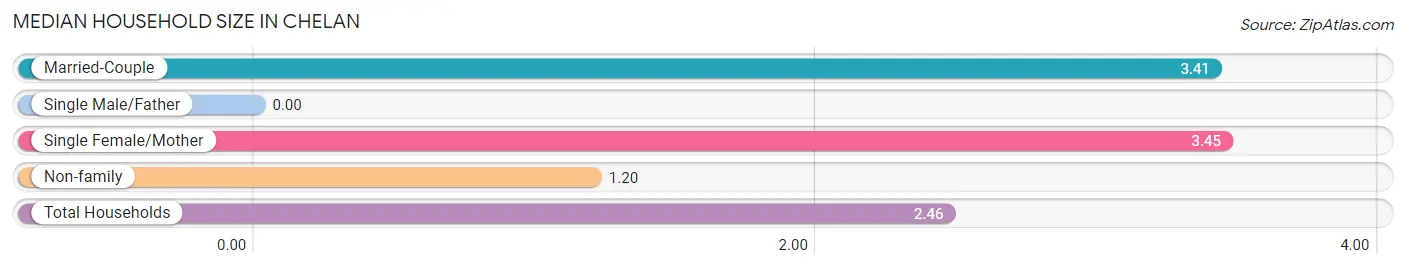
| Household Type | # Households | Household Size |
| Married-Couple | 852 (49.6%) | 3.41 |
| Single Male/Father | 0 (0.0%) | - |
| Single Female/Mother | 126 (7.3%) | 3.45 |
| Non-family | 741 (43.1%) | 1.20 |
| Total Households | 1,719 (100.0%) | 2.46 |
Household Size by Marriage Status in Chelan
Out of a total of 1,719 households in Chelan, 978 (56.9%) are family households, while 741 (43.1%) are nonfamily households. The most numerous type of family households are 2-person households, comprising 459, and the most common type of nonfamily households are 1-person households, comprising 610.
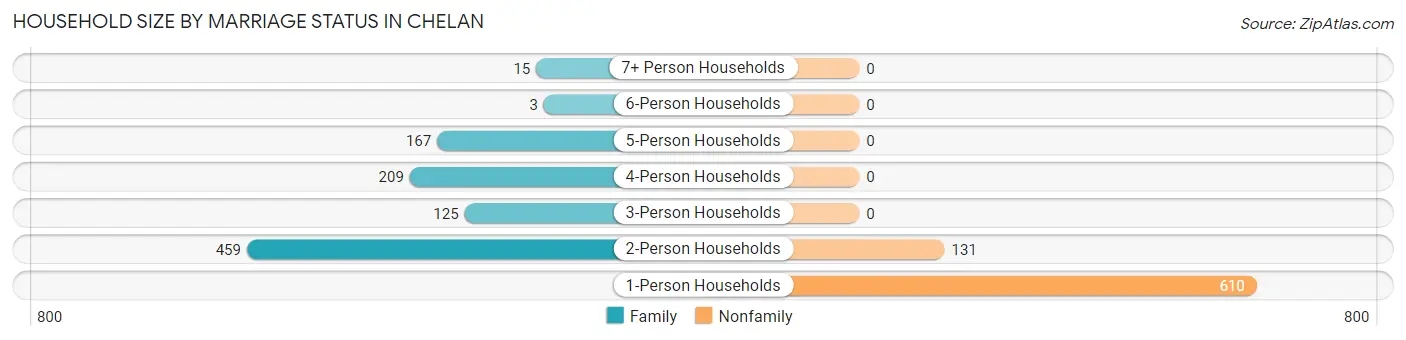
| Household Size | Family Households | Nonfamily Households |
| 1-Person Households | - | 610 (35.5%) |
| 2-Person Households | 459 (26.7%) | 131 (7.6%) |
| 3-Person Households | 125 (7.3%) | 0 (0.0%) |
| 4-Person Households | 209 (12.2%) | 0 (0.0%) |
| 5-Person Households | 167 (9.7%) | 0 (0.0%) |
| 6-Person Households | 3 (0.2%) | 0 (0.0%) |
| 7+ Person Households | 15 (0.9%) | 0 (0.0%) |
| Total | 978 (56.9%) | 741 (43.1%) |
Female Fertility in Chelan
Fertility by Age in Chelan
Average fertility rate in Chelan is 64.0 births per 1,000 women. Women in the age bracket of 20 to 34 years have the highest fertility rate with 99.0 births per 1,000 women. Women in the age bracket of 20 to 34 years acount for 80.6% of all women with births.
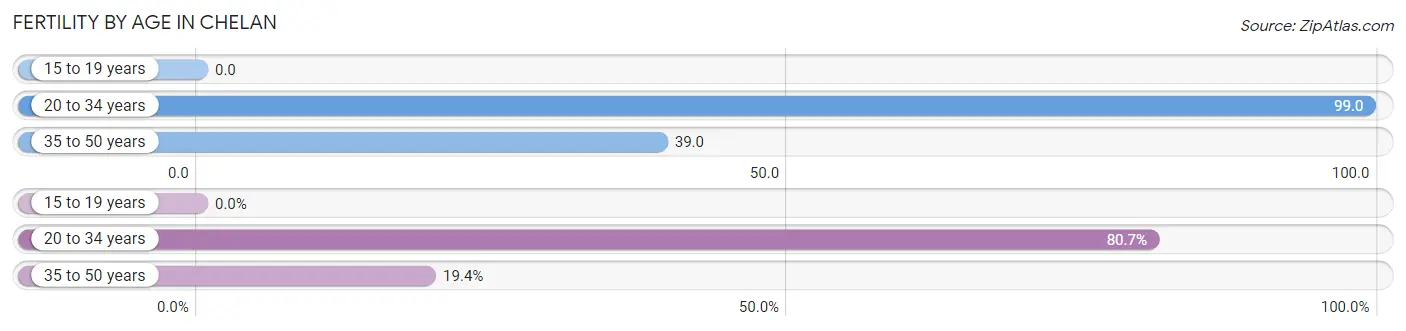
| Age Bracket | Women with Births | Births / 1,000 Women |
| 15 to 19 years | 0 (0.0%) | 0.0 |
| 20 to 34 years | 50 (80.6%) | 99.0 |
| 35 to 50 years | 12 (19.4%) | 39.0 |
| Total | 62 (100.0%) | 64.0 |
Fertility by Age by Marriage Status in Chelan
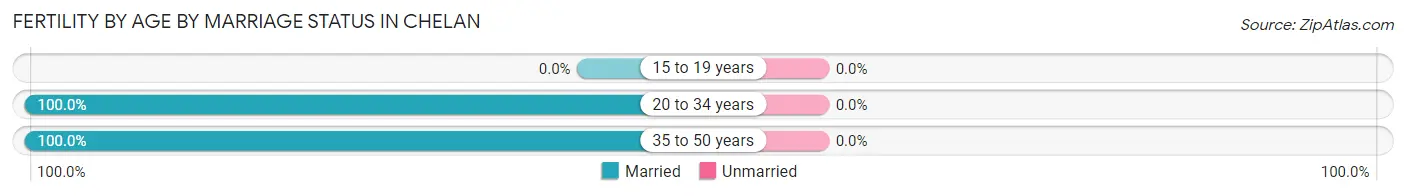
| Age Bracket | Married | Unmarried |
| 15 to 19 years | 0 (0.0%) | 0 (0.0%) |
| 20 to 34 years | 50 (100.0%) | 0 (0.0%) |
| 35 to 50 years | 12 (100.0%) | 0 (0.0%) |
| Total | 62 (100.0%) | 0 (0.0%) |
Fertility by Education in Chelan
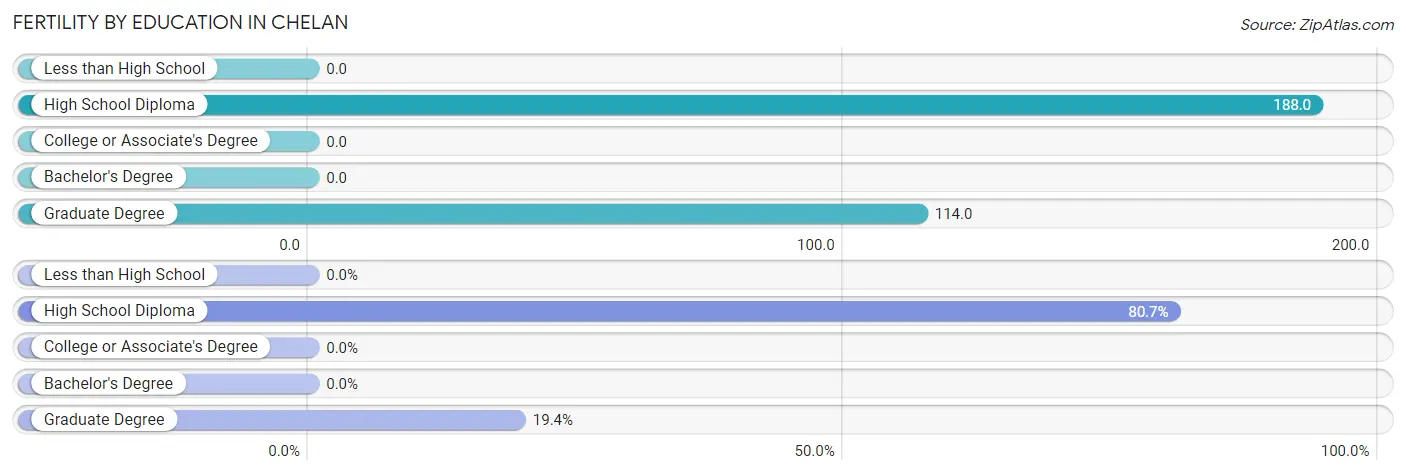
| Educational Attainment | Women with Births | Births / 1,000 Women |
| Less than High School | 0 (0.0%) | 0.0 |
| High School Diploma | 50 (80.6%) | 188.0 |
| College or Associate's Degree | 0 (0.0%) | 0.0 |
| Bachelor's Degree | 0 (0.0%) | 0.0 |
| Graduate Degree | 12 (19.4%) | 114.0 |
| Total | 62 (100.0%) | 64.0 |
Fertility by Education by Marriage Status in Chelan
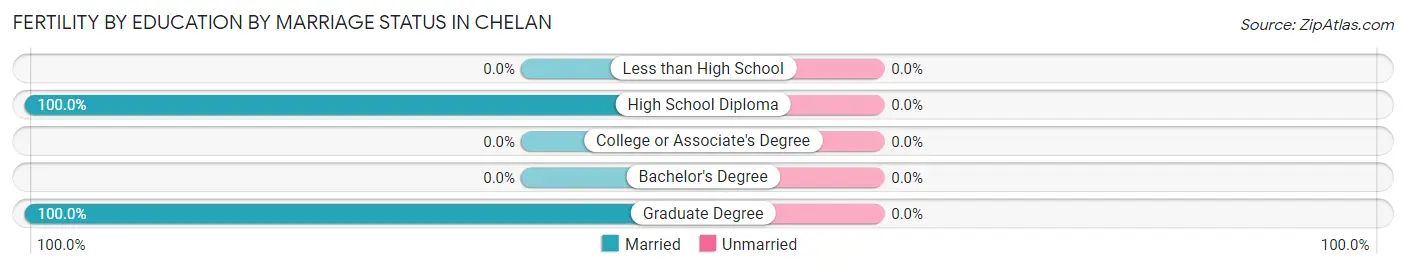
| Educational Attainment | Married | Unmarried |
| Less than High School | 0 (0.0%) | 0 (0.0%) |
| High School Diploma | 50 (100.0%) | 0 (0.0%) |
| College or Associate's Degree | 0 (0.0%) | 0 (0.0%) |
| Bachelor's Degree | 0 (0.0%) | 0 (0.0%) |
| Graduate Degree | 12 (100.0%) | 0 (0.0%) |
| Total | 62 (100.0%) | 0 (0.0%) |
Employment Characteristics in Chelan
Employment by Class of Employer in Chelan
Among the 2,054 employed individuals in Chelan, private company employees (1,355 | 66.0%), not-for-profit organizations (298 | 14.5%), and self-employed (not incorporated) (240 | 11.7%) make up the most common classes of employment.
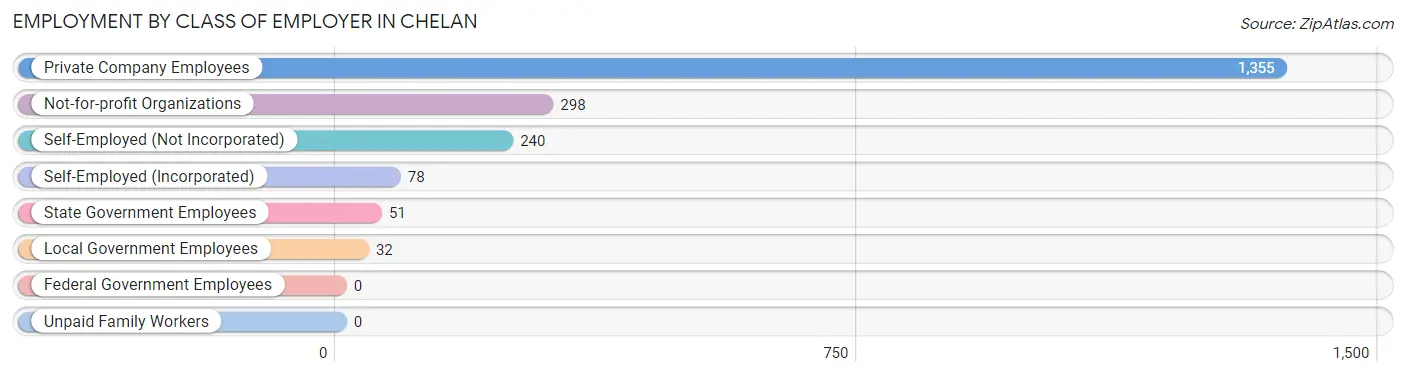
| Employer Class | # Employees | % Employees |
| Private Company Employees | 1,355 | 66.0% |
| Self-Employed (Incorporated) | 78 | 3.8% |
| Self-Employed (Not Incorporated) | 240 | 11.7% |
| Not-for-profit Organizations | 298 | 14.5% |
| Local Government Employees | 32 | 1.6% |
| State Government Employees | 51 | 2.5% |
| Federal Government Employees | 0 | 0.0% |
| Unpaid Family Workers | 0 | 0.0% |
| Total | 2,054 | 100.0% |
Employment Status by Age in Chelan
According to the labor force statistics for Chelan, out of the total population over 16 years of age (3,468), 61.6% or 2,136 individuals are in the labor force, with 3.3% or 70 of them unemployed. The age group with the highest labor force participation rate is 45 to 54 years, with 99.0% or 511 individuals in the labor force. Within the labor force, the 20 to 24 years age range has the highest percentage of unemployed individuals, with 27.6% or 51 of them being unemployed.
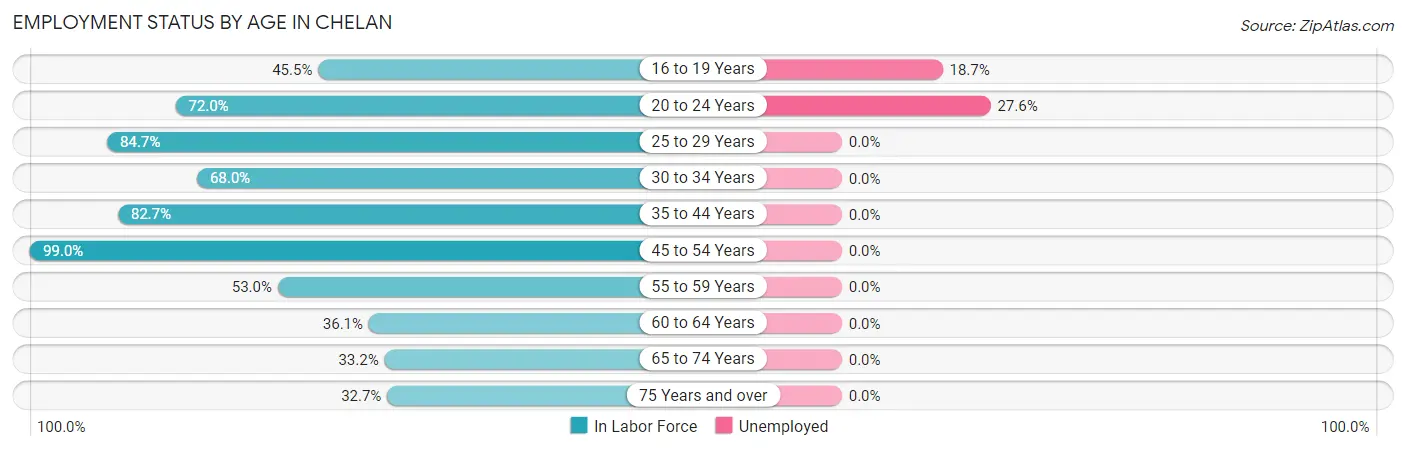
| Age Bracket | In Labor Force | Unemployed |
| 16 to 19 Years | 107 (45.5%) | 20 (18.7%) |
| 20 to 24 Years | 185 (72.0%) | 51 (27.6%) |
| 25 to 29 Years | 122 (84.7%) | 0 (0.0%) |
| 30 to 34 Years | 238 (68.0%) | 0 (0.0%) |
| 35 to 44 Years | 416 (82.7%) | 0 (0.0%) |
| 45 to 54 Years | 511 (99.0%) | 0 (0.0%) |
| 55 to 59 Years | 186 (53.0%) | 0 (0.0%) |
| 60 to 64 Years | 52 (36.1%) | 0 (0.0%) |
| 65 to 74 Years | 217 (33.2%) | 0 (0.0%) |
| 75 Years and over | 103 (32.7%) | 0 (0.0%) |
| Total | 2,136 (61.6%) | 70 (3.3%) |
Employment Status by Educational Attainment in Chelan
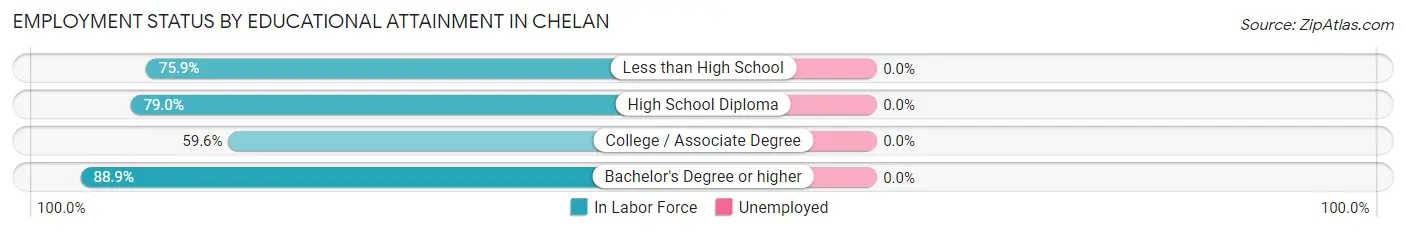
| Educational Attainment | In Labor Force | Unemployed |
| Less than High School | 337 (75.9%) | 0 (0.0%) |
| High School Diploma | 494 (79.0%) | 0 (0.0%) |
| College / Associate Degree | 286 (59.6%) | 0 (0.0%) |
| Bachelor's Degree or higher | 408 (88.9%) | 0 (0.0%) |
| Total | 1,524 (75.9%) | 0 (0.0%) |
Employment Occupations by Sex in Chelan
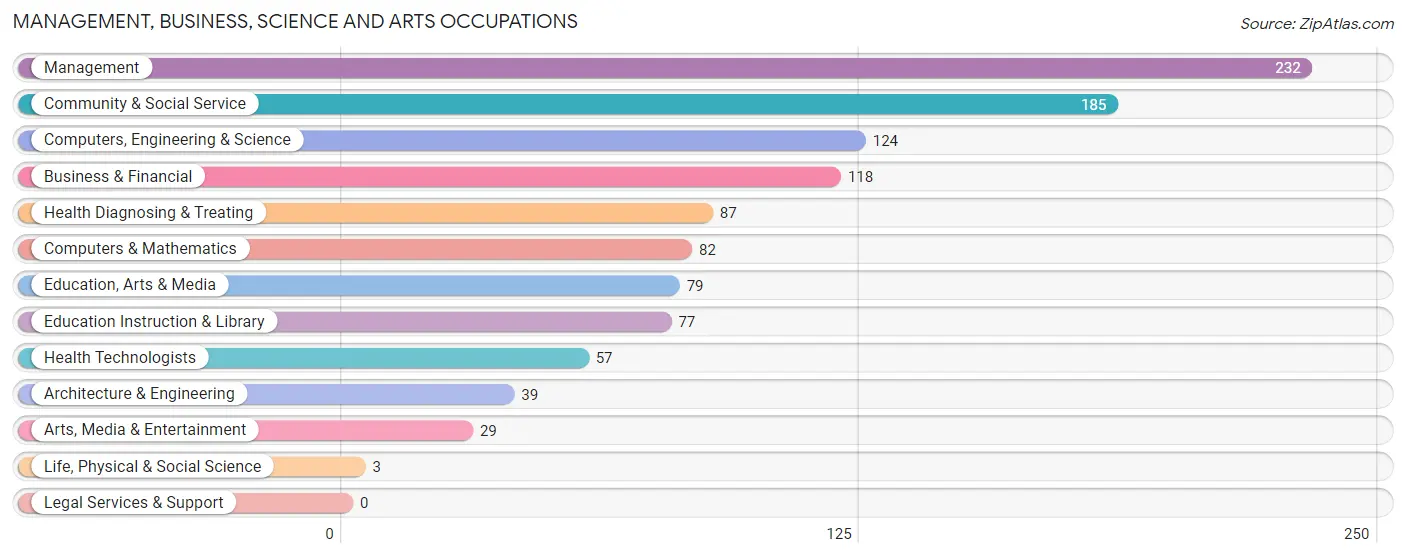
Management, Business, Science and Arts Occupations
The most common Management, Business, Science and Arts occupations in Chelan are Management (232 | 11.2%), Community & Social Service (185 | 8.9%), Computers, Engineering & Science (124 | 6.0%), Business & Financial (118 | 5.7%), and Health Diagnosing & Treating (87 | 4.2%).
Management, Business, Science and Arts Occupations by Sex
Within the Management, Business, Science and Arts occupations in Chelan, the most male-oriented occupations are Computers & Mathematics (100.0%), Architecture & Engineering (100.0%), and Computers, Engineering & Science (97.6%), while the most female-oriented occupations are Life, Physical & Social Science (100.0%), Education, Arts & Media (100.0%), and Health Diagnosing & Treating (64.4%).
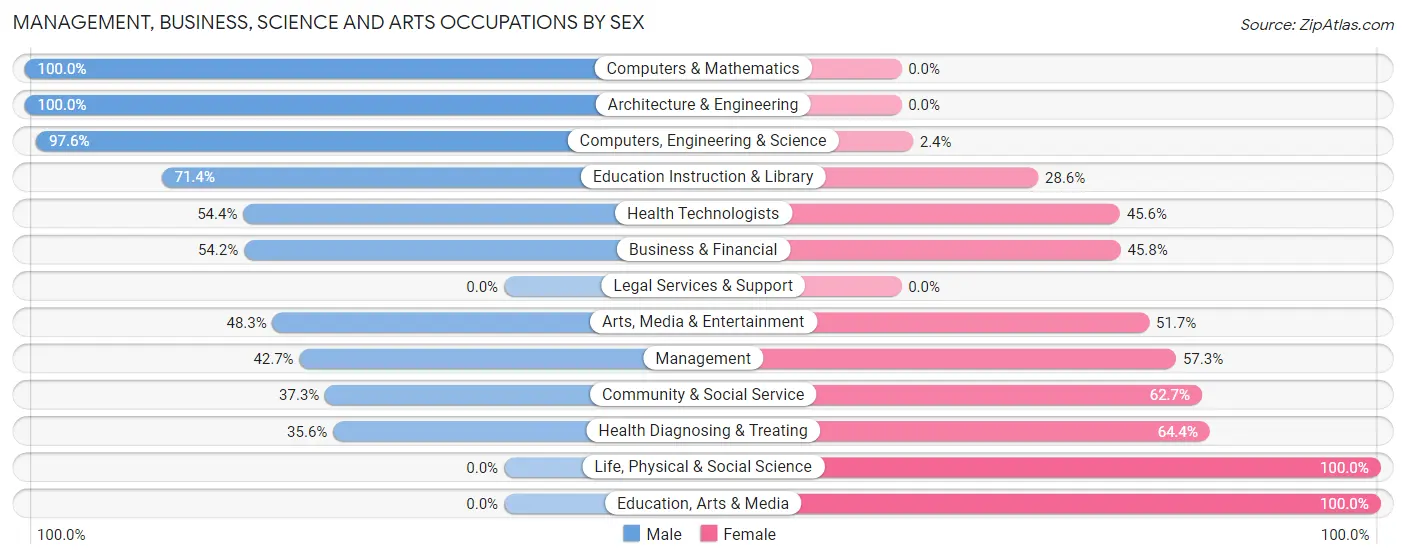
| Occupation | Male | Female |
| Management | 99 (42.7%) | 133 (57.3%) |
| Business & Financial | 64 (54.2%) | 54 (45.8%) |
| Computers, Engineering & Science | 121 (97.6%) | 3 (2.4%) |
| Computers & Mathematics | 82 (100.0%) | 0 (0.0%) |
| Architecture & Engineering | 39 (100.0%) | 0 (0.0%) |
| Life, Physical & Social Science | 0 (0.0%) | 3 (100.0%) |
| Community & Social Service | 69 (37.3%) | 116 (62.7%) |
| Education, Arts & Media | 0 (0.0%) | 79 (100.0%) |
| Legal Services & Support | 0 (0.0%) | 0 (0.0%) |
| Education Instruction & Library | 55 (71.4%) | 22 (28.6%) |
| Arts, Media & Entertainment | 14 (48.3%) | 15 (51.7%) |
| Health Diagnosing & Treating | 31 (35.6%) | 56 (64.4%) |
| Health Technologists | 31 (54.4%) | 26 (45.6%) |
| Total (Category) | 384 (51.5%) | 362 (48.5%) |
| Total (Overall) | 1,162 (56.2%) | 904 (43.8%) |
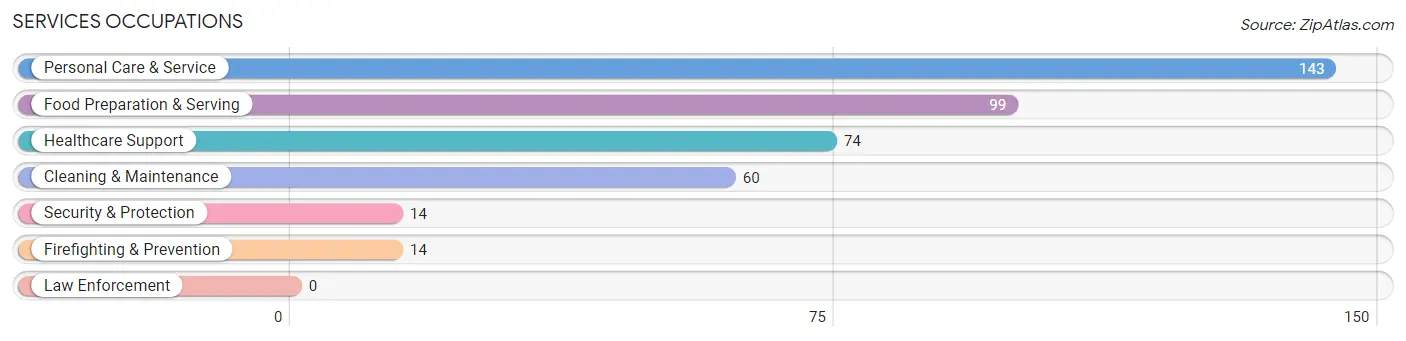
Services Occupations
The most common Services occupations in Chelan are Personal Care & Service (143 | 6.9%), Food Preparation & Serving (99 | 4.8%), Healthcare Support (74 | 3.6%), Cleaning & Maintenance (60 | 2.9%), and Security & Protection (14 | 0.7%).
Services Occupations by Sex
Within the Services occupations in Chelan, the most male-oriented occupations are Cleaning & Maintenance (70.0%), Food Preparation & Serving (42.4%), and Personal Care & Service (35.0%), while the most female-oriented occupations are Security & Protection (100.0%), Firefighting & Prevention (100.0%), and Healthcare Support (78.4%).
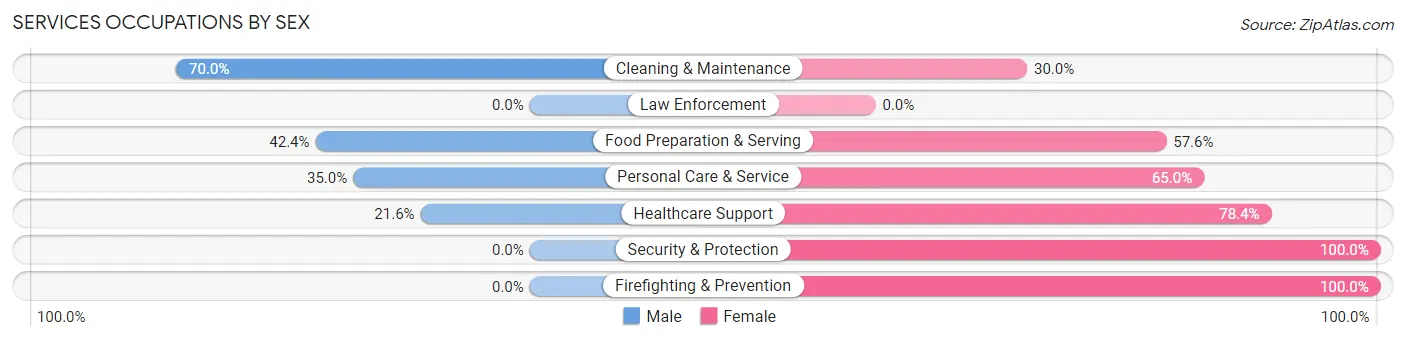
| Occupation | Male | Female |
| Healthcare Support | 16 (21.6%) | 58 (78.4%) |
| Security & Protection | 0 (0.0%) | 14 (100.0%) |
| Firefighting & Prevention | 0 (0.0%) | 14 (100.0%) |
| Law Enforcement | 0 (0.0%) | 0 (0.0%) |
| Food Preparation & Serving | 42 (42.4%) | 57 (57.6%) |
| Cleaning & Maintenance | 42 (70.0%) | 18 (30.0%) |
| Personal Care & Service | 50 (35.0%) | 93 (65.0%) |
| Total (Category) | 150 (38.5%) | 240 (61.5%) |
| Total (Overall) | 1,162 (56.2%) | 904 (43.8%) |
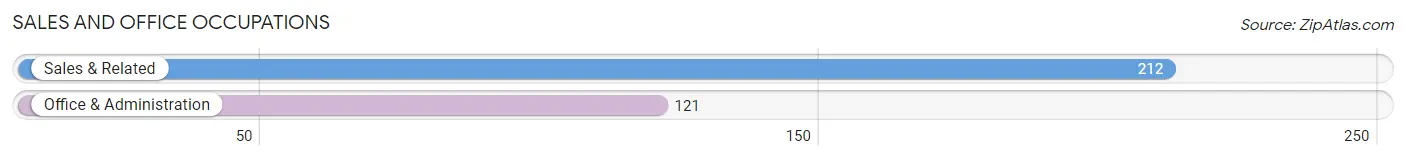
Sales and Office Occupations
The most common Sales and Office occupations in Chelan are Sales & Related (212 | 10.3%), and Office & Administration (121 | 5.9%).
Sales and Office Occupations by Sex
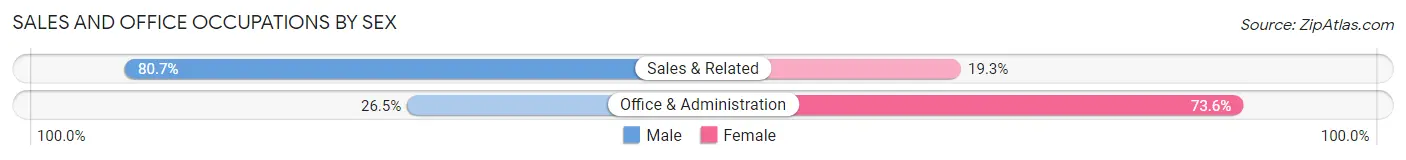
| Occupation | Male | Female |
| Sales & Related | 171 (80.7%) | 41 (19.3%) |
| Office & Administration | 32 (26.5%) | 89 (73.6%) |
| Total (Category) | 203 (61.0%) | 130 (39.0%) |
| Total (Overall) | 1,162 (56.2%) | 904 (43.8%) |
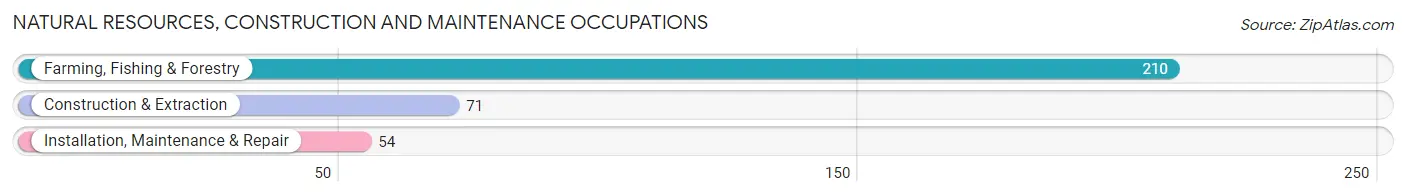
Natural Resources, Construction and Maintenance Occupations
The most common Natural Resources, Construction and Maintenance occupations in Chelan are Farming, Fishing & Forestry (210 | 10.2%), Construction & Extraction (71 | 3.4%), and Installation, Maintenance & Repair (54 | 2.6%).
Natural Resources, Construction and Maintenance Occupations by Sex
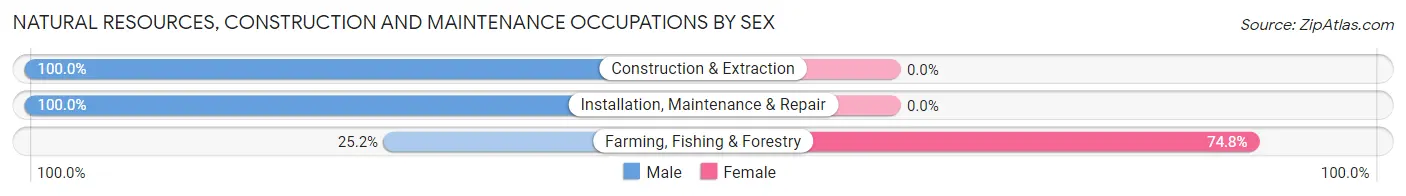
| Occupation | Male | Female |
| Farming, Fishing & Forestry | 53 (25.2%) | 157 (74.8%) |
| Construction & Extraction | 71 (100.0%) | 0 (0.0%) |
| Installation, Maintenance & Repair | 54 (100.0%) | 0 (0.0%) |
| Total (Category) | 178 (53.1%) | 157 (46.9%) |
| Total (Overall) | 1,162 (56.2%) | 904 (43.8%) |
Production, Transportation and Moving Occupations
The most common Production, Transportation and Moving occupations in Chelan are Transportation (157 | 7.6%), Material Moving (63 | 3.0%), and Production (42 | 2.0%).
Production, Transportation and Moving Occupations by Sex
| Occupation | Male | Female |
| Production | 42 (100.0%) | 0 (0.0%) |
| Transportation | 157 (100.0%) | 0 (0.0%) |
| Material Moving | 48 (76.2%) | 15 (23.8%) |
| Total (Category) | 247 (94.3%) | 15 (5.7%) |
| Total (Overall) | 1,162 (56.2%) | 904 (43.8%) |
Employment Industries by Sex in Chelan
Employment Industries in Chelan
The major employment industries in Chelan include Health Care & Social Assistance (297 | 14.4%), Retail Trade (274 | 13.3%), Agriculture, Fishing & Hunting (246 | 11.9%), Accommodation & Food Services (192 | 9.3%), and Transportation & Warehousing (173 | 8.4%).
Employment Industries by Sex in Chelan
The Chelan industries that see more men than women are Utilities (100.0%), Manufacturing (91.4%), and Construction (89.5%), whereas the industries that tend to have a higher number of women are Public Administration (100.0%), Wholesale Trade (66.7%), and Finance & Insurance (64.6%).
| Industry | Male | Female |
| Agriculture, Fishing & Hunting | 139 (56.5%) | 107 (43.5%) |
| Mining, Quarrying, & Extraction | 0 (0.0%) | 0 (0.0%) |
| Construction | 85 (89.5%) | 10 (10.5%) |
| Manufacturing | 64 (91.4%) | 6 (8.6%) |
| Wholesale Trade | 36 (33.3%) | 72 (66.7%) |
| Retail Trade | 201 (73.4%) | 73 (26.6%) |
| Transportation & Warehousing | 124 (71.7%) | 49 (28.3%) |
| Utilities | 45 (100.0%) | 0 (0.0%) |
| Information | 0 (0.0%) | 0 (0.0%) |
| Finance & Insurance | 17 (35.4%) | 31 (64.6%) |
| Real Estate, Rental & Leasing | 103 (83.1%) | 21 (16.9%) |
| Professional & Scientific | 14 (48.3%) | 15 (51.7%) |
| Enterprise Management | 0 (0.0%) | 0 (0.0%) |
| Administrative & Support | 0 (0.0%) | 0 (0.0%) |
| Educational Services | 55 (35.7%) | 99 (64.3%) |
| Health Care & Social Assistance | 139 (46.8%) | 158 (53.2%) |
| Arts, Entertainment & Recreation | 3 (60.0%) | 2 (40.0%) |
| Accommodation & Food Services | 90 (46.9%) | 102 (53.1%) |
| Public Administration | 0 (0.0%) | 14 (100.0%) |
| Total | 1,162 (56.2%) | 904 (43.8%) |
Education in Chelan
School Enrollment in Chelan
The most common levels of schooling among the 864 students in Chelan are middle school (328 | 38.0%), high school (186 | 21.5%), and elementary school (175 | 20.3%).
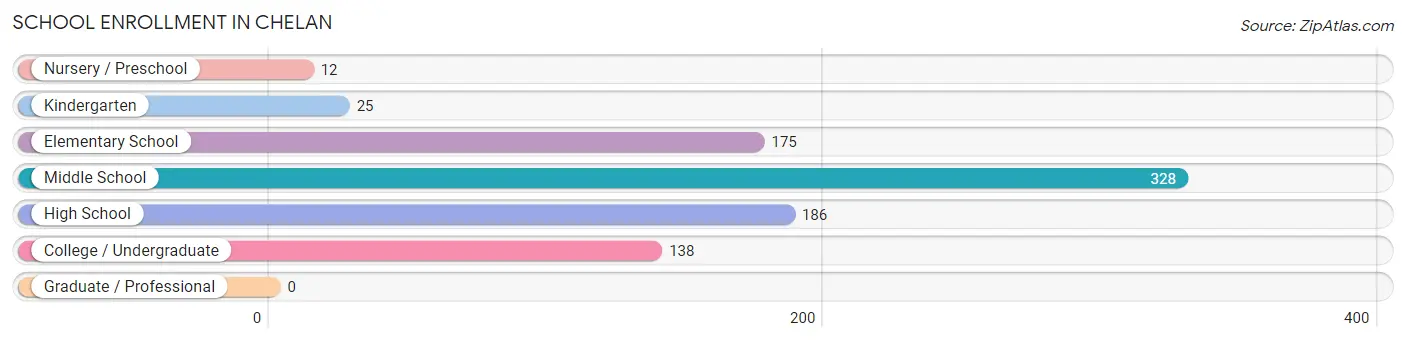
| School Level | # Students | % Students |
| Nursery / Preschool | 12 | 1.4% |
| Kindergarten | 25 | 2.9% |
| Elementary School | 175 | 20.3% |
| Middle School | 328 | 38.0% |
| High School | 186 | 21.5% |
| College / Undergraduate | 138 | 16.0% |
| Graduate / Professional | 0 | 0.0% |
| Total | 864 | 100.0% |
School Enrollment by Age by Funding Source in Chelan
Out of a total of 864 students who are enrolled in schools in Chelan, 34 (3.9%) attend a private institution, while the remaining 830 (96.1%) are enrolled in public schools. The age group of 35 years and over has the highest likelihood of being enrolled in private schools, with 19 (57.6% in the age bracket) enrolled. Conversely, the age group of 15 to 17 year olds has the lowest likelihood of being enrolled in a private school, with 118 (100.0% in the age bracket) attending a public institution.
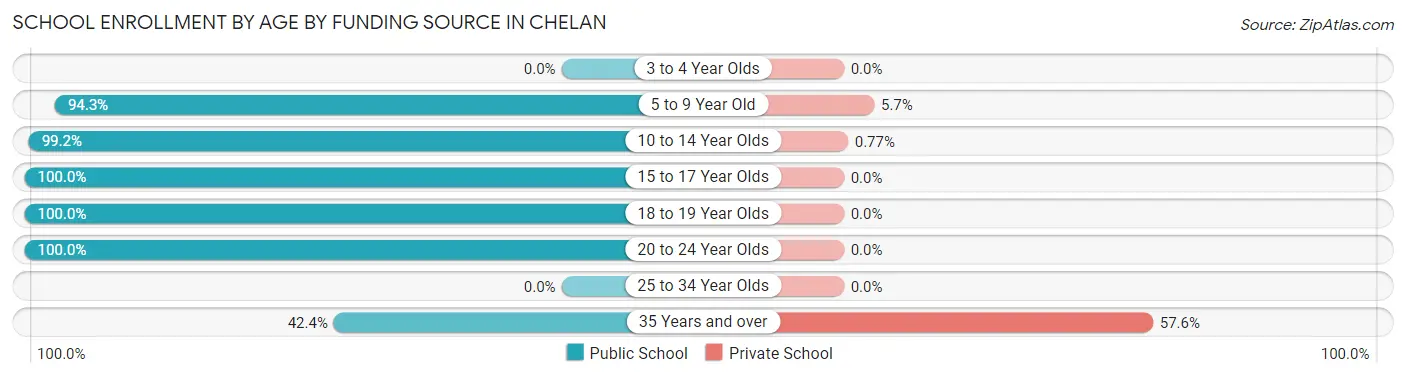
| Age Bracket | Public School | Private School |
| 3 to 4 Year Olds | 0 (0.0%) | 0 (0.0%) |
| 5 to 9 Year Old | 200 (94.3%) | 12 (5.7%) |
| 10 to 14 Year Olds | 389 (99.2%) | 3 (0.8%) |
| 15 to 17 Year Olds | 118 (100.0%) | 0 (0.0%) |
| 18 to 19 Year Olds | 80 (100.0%) | 0 (0.0%) |
| 20 to 24 Year Olds | 29 (100.0%) | 0 (0.0%) |
| 25 to 34 Year Olds | 0 (0.0%) | 0 (0.0%) |
| 35 Years and over | 14 (42.4%) | 19 (57.6%) |
| Total | 830 (96.1%) | 34 (3.9%) |
Educational Attainment by Field of Study in Chelan
Psychology (177 | 21.3%), education (114 | 13.7%), business (111 | 13.4%), engineering (109 | 13.1%), and science & technology (104 | 12.5%) are the most common fields of study among 830 individuals in Chelan who have obtained a bachelor's degree or higher.
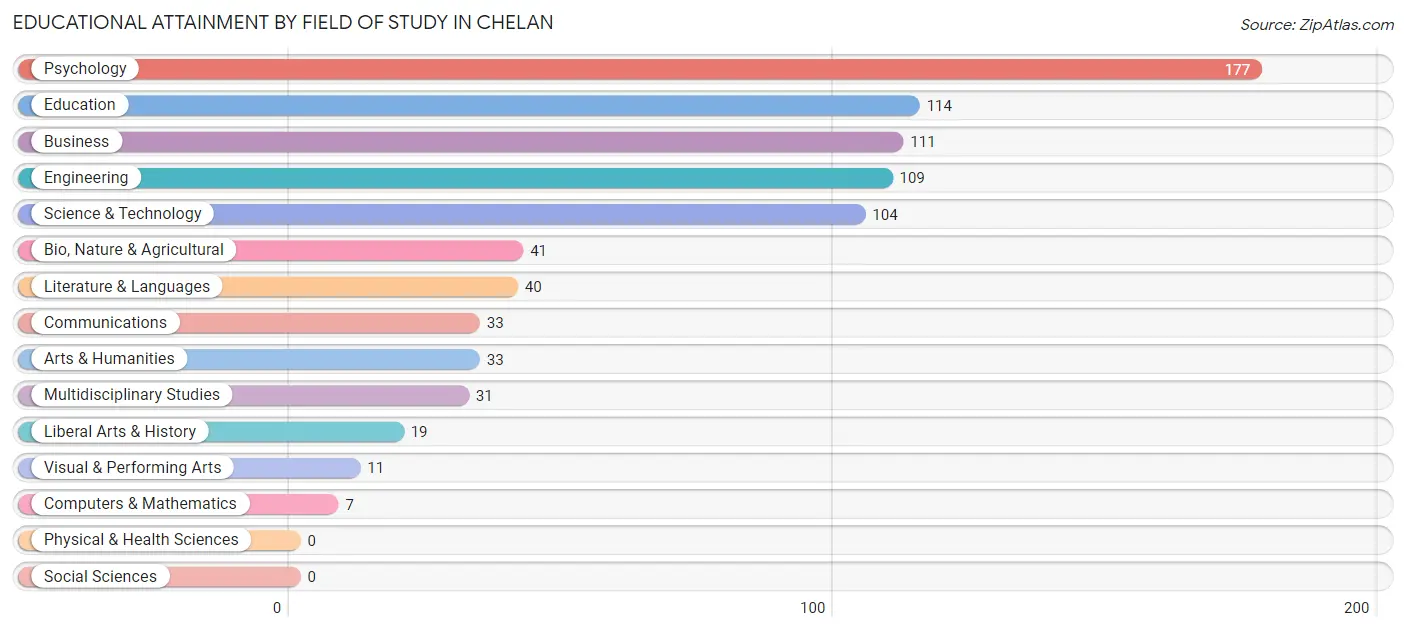
| Field of Study | # Graduates | % Graduates |
| Computers & Mathematics | 7 | 0.8% |
| Bio, Nature & Agricultural | 41 | 4.9% |
| Physical & Health Sciences | 0 | 0.0% |
| Psychology | 177 | 21.3% |
| Social Sciences | 0 | 0.0% |
| Engineering | 109 | 13.1% |
| Multidisciplinary Studies | 31 | 3.7% |
| Science & Technology | 104 | 12.5% |
| Business | 111 | 13.4% |
| Education | 114 | 13.7% |
| Literature & Languages | 40 | 4.8% |
| Liberal Arts & History | 19 | 2.3% |
| Visual & Performing Arts | 11 | 1.3% |
| Communications | 33 | 4.0% |
| Arts & Humanities | 33 | 4.0% |
| Total | 830 | 100.0% |
Transportation & Commute in Chelan
Vehicle Availability by Sex in Chelan
The most prevalent vehicle ownership categories in Chelan are males with 1 vehicle (440, accounting for 37.9%) and females with 1 vehicle (234, making up 49.3%).
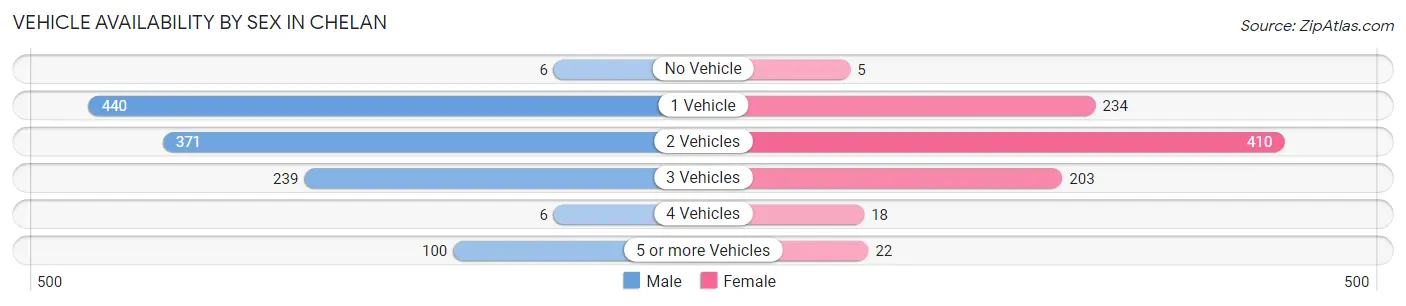
| Vehicles Available | Male | Female |
| No Vehicle | 6 (0.5%) | 5 (0.6%) |
| 1 Vehicle | 440 (37.9%) | 234 (26.2%) |
| 2 Vehicles | 371 (31.9%) | 410 (46.0%) |
| 3 Vehicles | 239 (20.6%) | 203 (22.8%) |
| 4 Vehicles | 6 (0.5%) | 18 (2.0%) |
| 5 or more Vehicles | 100 (8.6%) | 22 (2.5%) |
| Total | 1,162 (100.0%) | 892 (100.0%) |
Commute Time in Chelan
The most frequently occuring commute durations in Chelan are 5 to 9 minutes (442 commuters, 24.4%), 10 to 14 minutes (442 commuters, 24.4%), and less than 5 minutes (401 commuters, 22.1%).
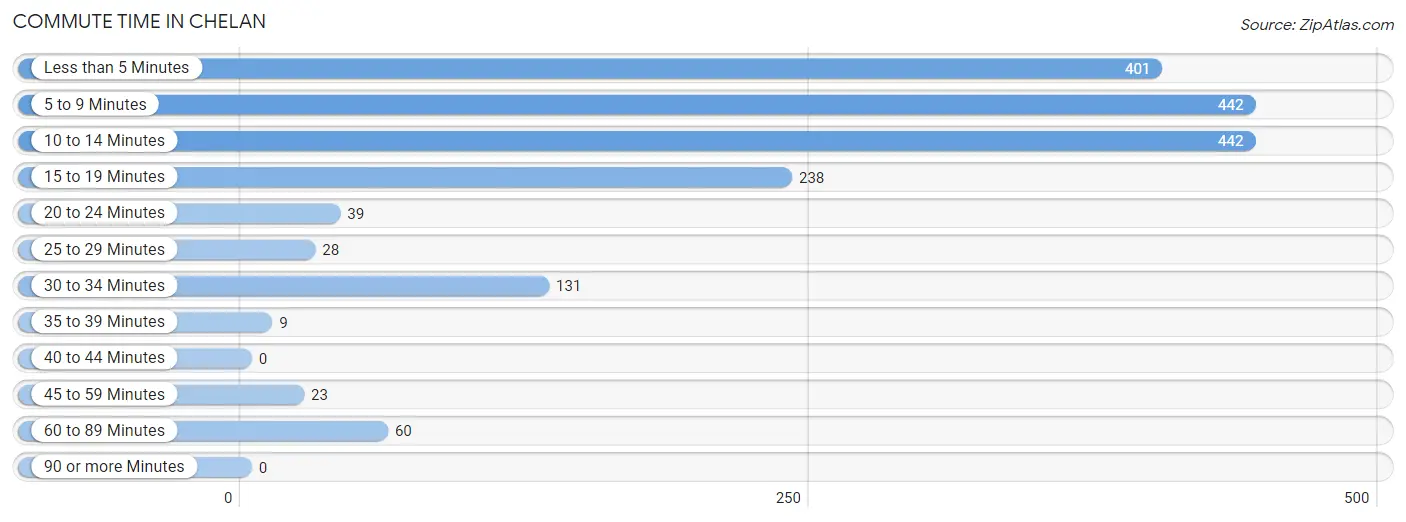
| Commute Time | # Commuters | % Commuters |
| Less than 5 Minutes | 401 | 22.1% |
| 5 to 9 Minutes | 442 | 24.4% |
| 10 to 14 Minutes | 442 | 24.4% |
| 15 to 19 Minutes | 238 | 13.1% |
| 20 to 24 Minutes | 39 | 2.1% |
| 25 to 29 Minutes | 28 | 1.5% |
| 30 to 34 Minutes | 131 | 7.2% |
| 35 to 39 Minutes | 9 | 0.5% |
| 40 to 44 Minutes | 0 | 0.0% |
| 45 to 59 Minutes | 23 | 1.3% |
| 60 to 89 Minutes | 60 | 3.3% |
| 90 or more Minutes | 0 | 0.0% |
Commute Time by Sex in Chelan
The most common commute times in Chelan are 5 to 9 minutes (300 commuters, 30.3%) for males and less than 5 minutes (272 commuters, 33.1%) for females.
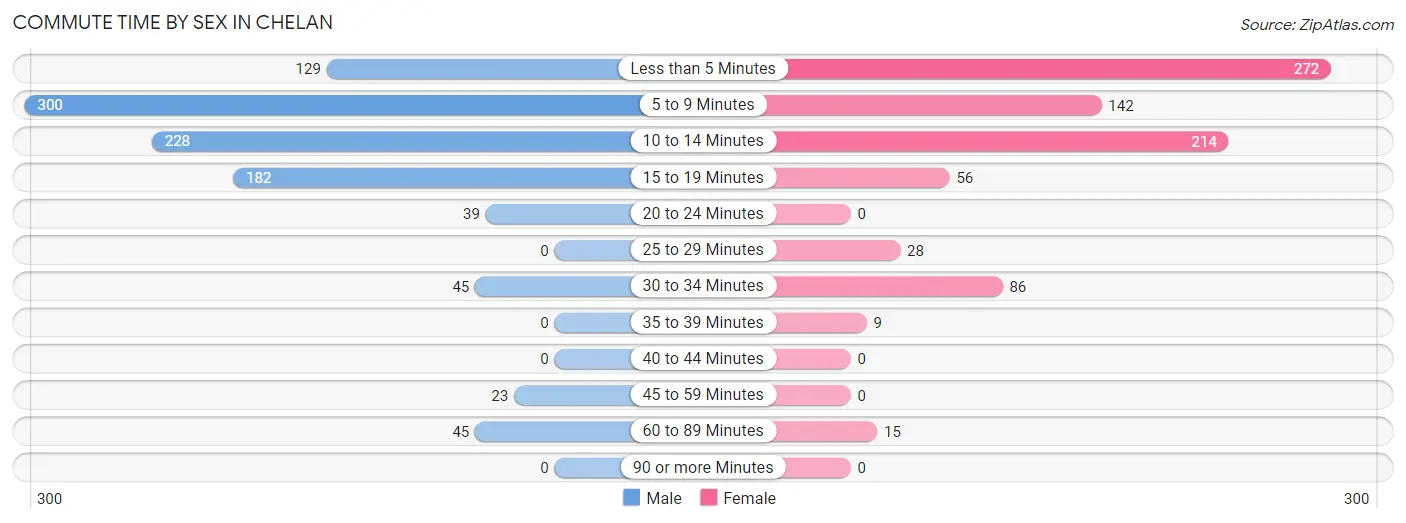
| Commute Time | Male | Female |
| Less than 5 Minutes | 129 (13.0%) | 272 (33.1%) |
| 5 to 9 Minutes | 300 (30.3%) | 142 (17.3%) |
| 10 to 14 Minutes | 228 (23.0%) | 214 (26.0%) |
| 15 to 19 Minutes | 182 (18.4%) | 56 (6.8%) |
| 20 to 24 Minutes | 39 (3.9%) | 0 (0.0%) |
| 25 to 29 Minutes | 0 (0.0%) | 28 (3.4%) |
| 30 to 34 Minutes | 45 (4.5%) | 86 (10.5%) |
| 35 to 39 Minutes | 0 (0.0%) | 9 (1.1%) |
| 40 to 44 Minutes | 0 (0.0%) | 0 (0.0%) |
| 45 to 59 Minutes | 23 (2.3%) | 0 (0.0%) |
| 60 to 89 Minutes | 45 (4.5%) | 15 (1.8%) |
| 90 or more Minutes | 0 (0.0%) | 0 (0.0%) |
Time of Departure to Work by Sex in Chelan
The most frequent times of departure to work in Chelan are 8:00 AM to 8:29 AM (213, 21.5%) for males and 7:30 AM to 7:59 AM (245, 29.8%) for females.
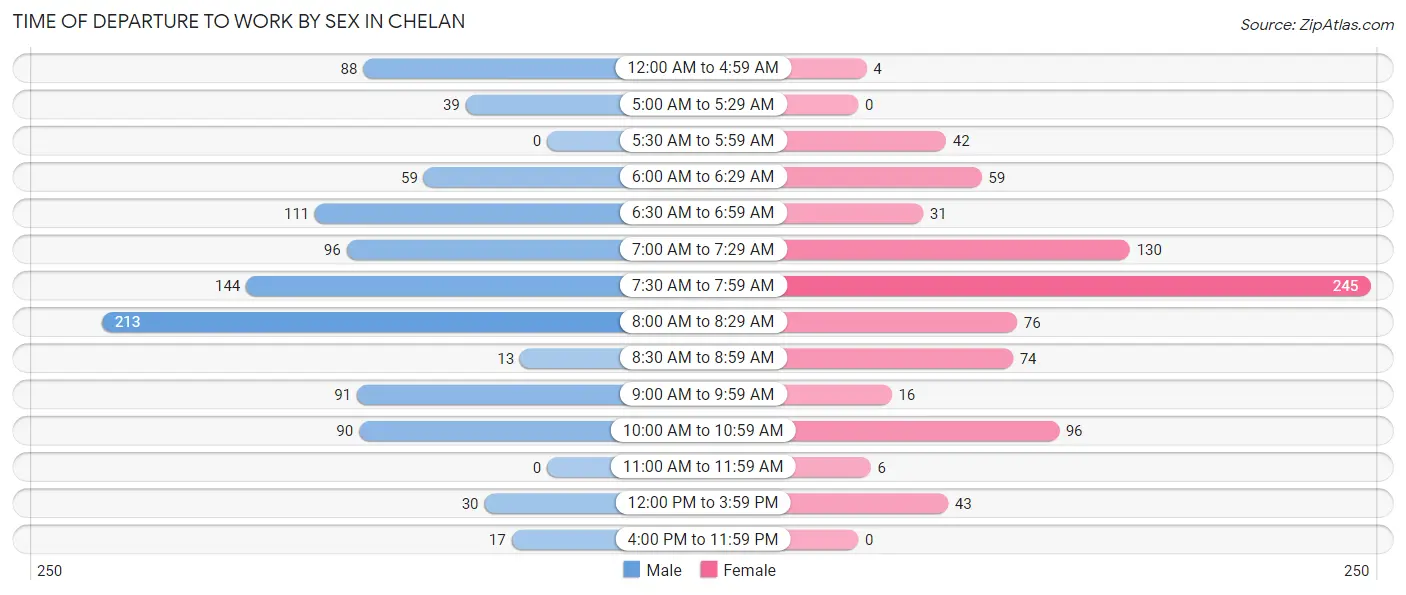
| Time of Departure | Male | Female |
| 12:00 AM to 4:59 AM | 88 (8.9%) | 4 (0.5%) |
| 5:00 AM to 5:29 AM | 39 (3.9%) | 0 (0.0%) |
| 5:30 AM to 5:59 AM | 0 (0.0%) | 42 (5.1%) |
| 6:00 AM to 6:29 AM | 59 (5.9%) | 59 (7.2%) |
| 6:30 AM to 6:59 AM | 111 (11.2%) | 31 (3.8%) |
| 7:00 AM to 7:29 AM | 96 (9.7%) | 130 (15.8%) |
| 7:30 AM to 7:59 AM | 144 (14.5%) | 245 (29.8%) |
| 8:00 AM to 8:29 AM | 213 (21.5%) | 76 (9.2%) |
| 8:30 AM to 8:59 AM | 13 (1.3%) | 74 (9.0%) |
| 9:00 AM to 9:59 AM | 91 (9.2%) | 16 (1.9%) |
| 10:00 AM to 10:59 AM | 90 (9.1%) | 96 (11.7%) |
| 11:00 AM to 11:59 AM | 0 (0.0%) | 6 (0.7%) |
| 12:00 PM to 3:59 PM | 30 (3.0%) | 43 (5.2%) |
| 4:00 PM to 11:59 PM | 17 (1.7%) | 0 (0.0%) |
| Total | 991 (100.0%) | 822 (100.0%) |
Housing Occupancy in Chelan
Occupancy by Ownership in Chelan
Of the total 1,719 dwellings in Chelan, owner-occupied units account for 904 (52.6%), while renter-occupied units make up 815 (47.4%).
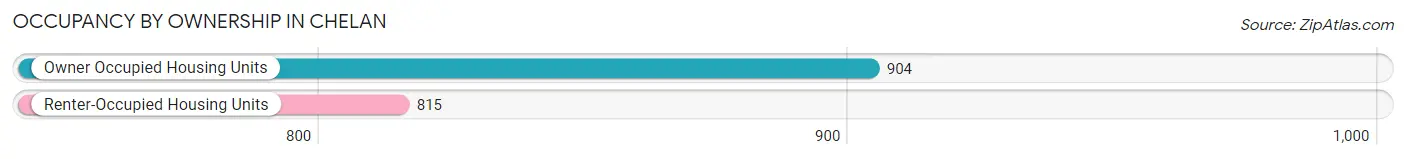
| Occupancy | # Housing Units | % Housing Units |
| Owner Occupied Housing Units | 904 | 52.6% |
| Renter-Occupied Housing Units | 815 | 47.4% |
| Total Occupied Housing Units | 1,719 | 100.0% |
Occupancy by Household Size in Chelan
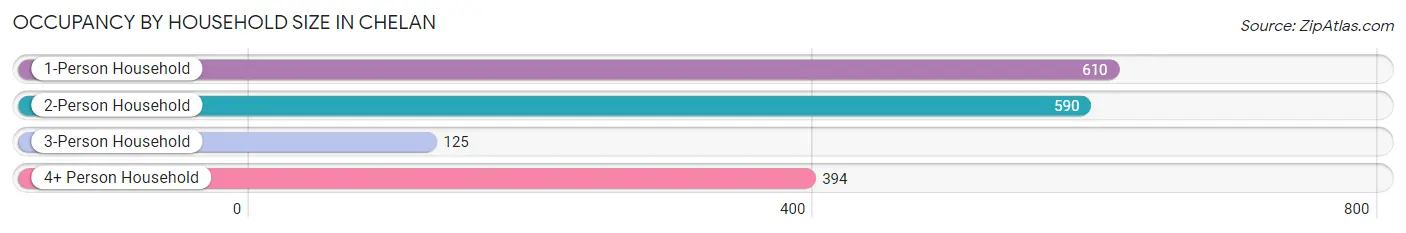
| Household Size | # Housing Units | % Housing Units |
| 1-Person Household | 610 | 35.5% |
| 2-Person Household | 590 | 34.3% |
| 3-Person Household | 125 | 7.3% |
| 4+ Person Household | 394 | 22.9% |
| Total Housing Units | 1,719 | 100.0% |
Occupancy by Ownership by Household Size in Chelan
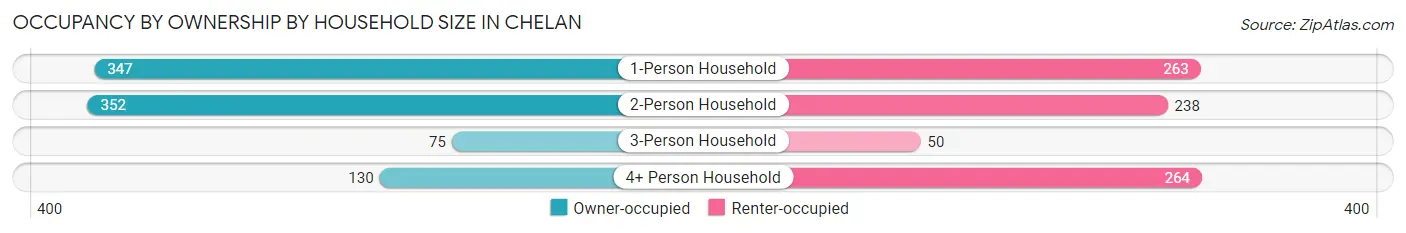
| Household Size | Owner-occupied | Renter-occupied |
| 1-Person Household | 347 (56.9%) | 263 (43.1%) |
| 2-Person Household | 352 (59.7%) | 238 (40.3%) |
| 3-Person Household | 75 (60.0%) | 50 (40.0%) |
| 4+ Person Household | 130 (33.0%) | 264 (67.0%) |
| Total Housing Units | 904 (52.6%) | 815 (47.4%) |
Occupancy by Educational Attainment in Chelan
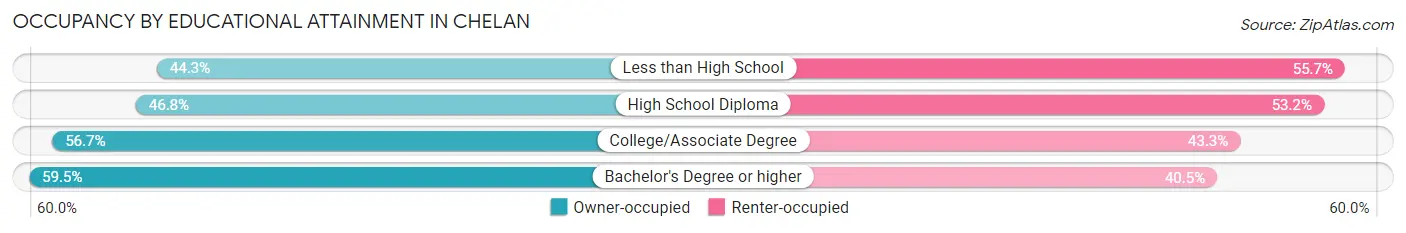
| Household Size | Owner-occupied | Renter-occupied |
| Less than High School | 135 (44.3%) | 170 (55.7%) |
| High School Diploma | 231 (46.8%) | 263 (53.2%) |
| College/Associate Degree | 186 (56.7%) | 142 (43.3%) |
| Bachelor's Degree or higher | 352 (59.5%) | 240 (40.5%) |
Occupancy by Age of Householder in Chelan
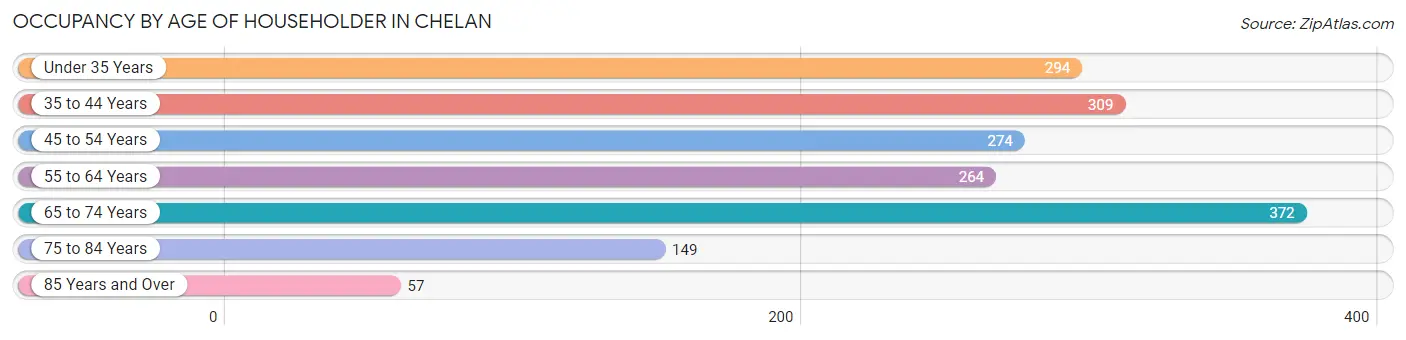
| Age Bracket | # Households | % Households |
| Under 35 Years | 294 | 17.1% |
| 35 to 44 Years | 309 | 18.0% |
| 45 to 54 Years | 274 | 15.9% |
| 55 to 64 Years | 264 | 15.4% |
| 65 to 74 Years | 372 | 21.6% |
| 75 to 84 Years | 149 | 8.7% |
| 85 Years and Over | 57 | 3.3% |
| Total | 1,719 | 100.0% |
Housing Finances in Chelan
Median Income by Occupancy in Chelan
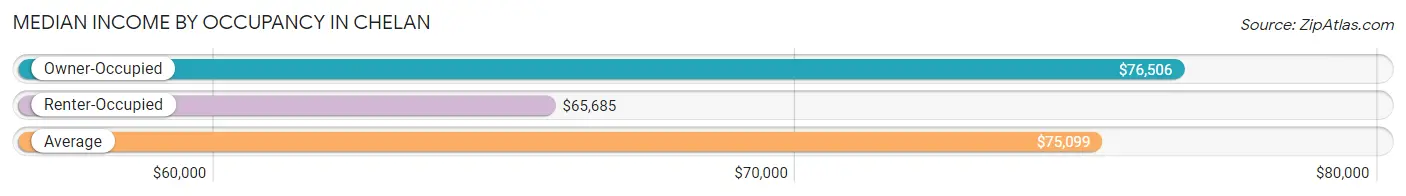
| Occupancy Type | # Households | Median Income |
| Owner-Occupied | 904 (52.6%) | $76,506 |
| Renter-Occupied | 815 (47.4%) | $65,685 |
| Average | 1,719 (100.0%) | $75,099 |
Occupancy by Householder Income Bracket in Chelan
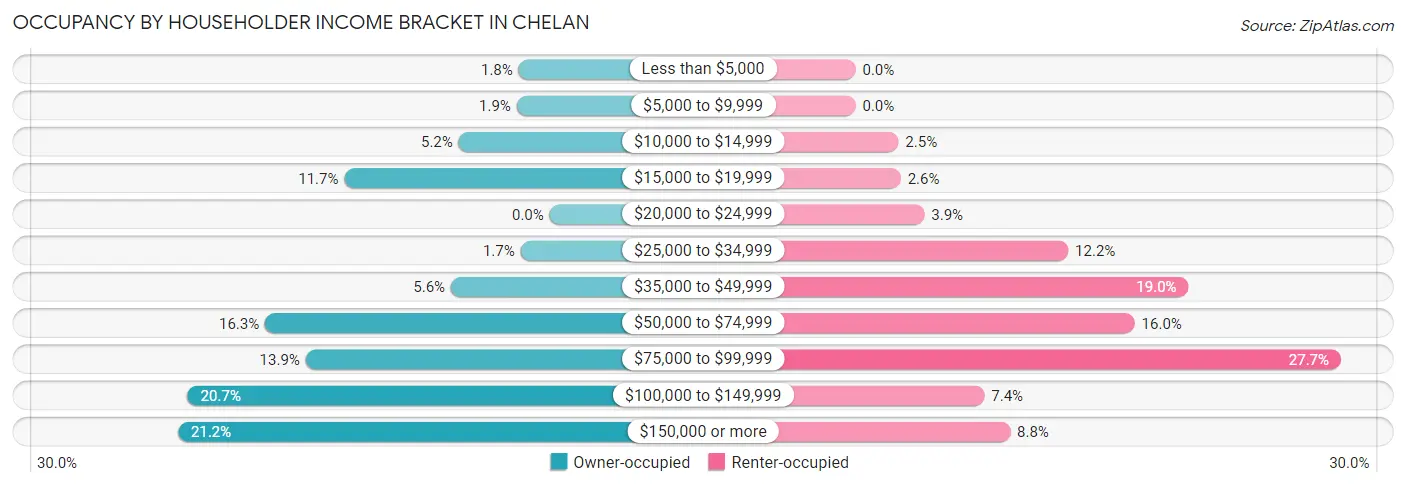
| Income Bracket | Owner-occupied | Renter-occupied |
| Less than $5,000 | 16 (1.8%) | 0 (0.0%) |
| $5,000 to $9,999 | 17 (1.9%) | 0 (0.0%) |
| $10,000 to $14,999 | 47 (5.2%) | 20 (2.5%) |
| $15,000 to $19,999 | 106 (11.7%) | 21 (2.6%) |
| $20,000 to $24,999 | 0 (0.0%) | 32 (3.9%) |
| $25,000 to $34,999 | 15 (1.7%) | 99 (12.1%) |
| $35,000 to $49,999 | 51 (5.6%) | 155 (19.0%) |
| $50,000 to $74,999 | 147 (16.3%) | 130 (16.0%) |
| $75,000 to $99,999 | 126 (13.9%) | 226 (27.7%) |
| $100,000 to $149,999 | 187 (20.7%) | 60 (7.4%) |
| $150,000 or more | 192 (21.2%) | 72 (8.8%) |
| Total | 904 (100.0%) | 815 (100.0%) |
Monthly Housing Cost Tiers in Chelan
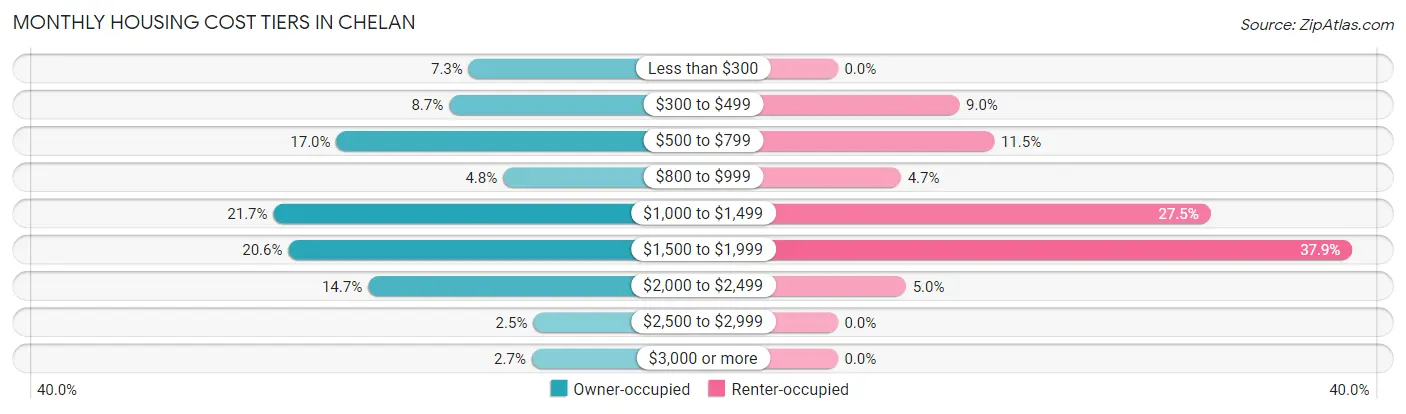
| Monthly Cost | Owner-occupied | Renter-occupied |
| Less than $300 | 66 (7.3%) | 0 (0.0%) |
| $300 to $499 | 79 (8.7%) | 73 (9.0%) |
| $500 to $799 | 154 (17.0%) | 94 (11.5%) |
| $800 to $999 | 43 (4.8%) | 38 (4.7%) |
| $1,000 to $1,499 | 196 (21.7%) | 224 (27.5%) |
| $1,500 to $1,999 | 186 (20.6%) | 309 (37.9%) |
| $2,000 to $2,499 | 133 (14.7%) | 41 (5.0%) |
| $2,500 to $2,999 | 23 (2.5%) | 0 (0.0%) |
| $3,000 or more | 24 (2.6%) | 0 (0.0%) |
| Total | 904 (100.0%) | 815 (100.0%) |
Physical Housing Characteristics in Chelan
Housing Structures in Chelan
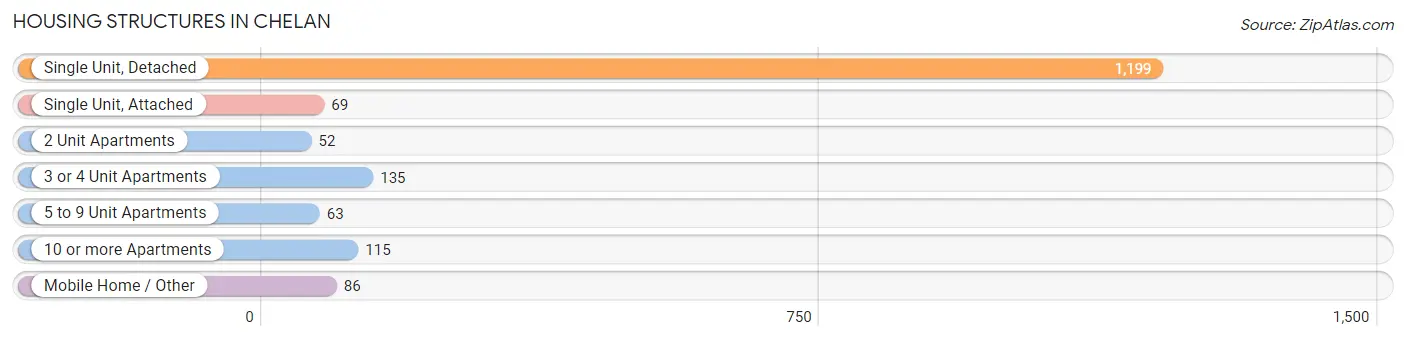
| Structure Type | # Housing Units | % Housing Units |
| Single Unit, Detached | 1,199 | 69.8% |
| Single Unit, Attached | 69 | 4.0% |
| 2 Unit Apartments | 52 | 3.0% |
| 3 or 4 Unit Apartments | 135 | 7.9% |
| 5 to 9 Unit Apartments | 63 | 3.7% |
| 10 or more Apartments | 115 | 6.7% |
| Mobile Home / Other | 86 | 5.0% |
| Total | 1,719 | 100.0% |
Housing Structures by Occupancy in Chelan
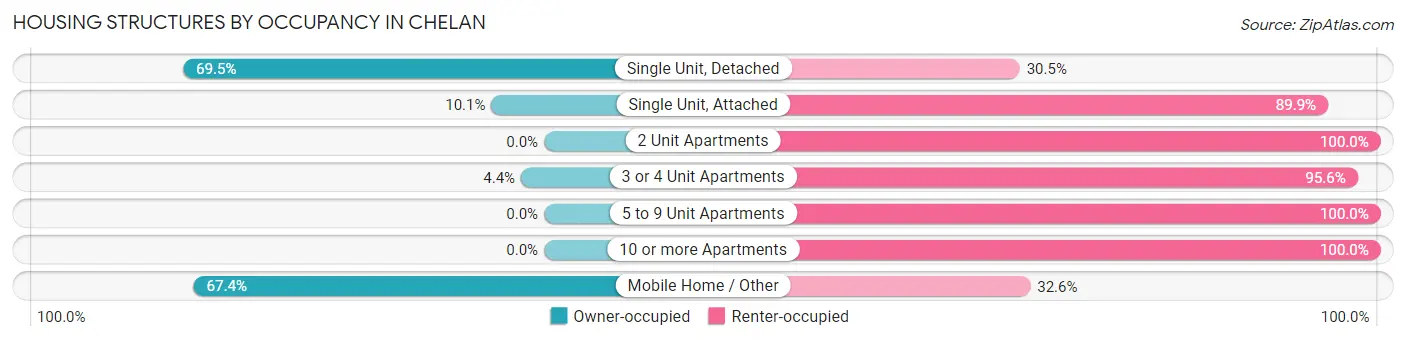
| Structure Type | Owner-occupied | Renter-occupied |
| Single Unit, Detached | 833 (69.5%) | 366 (30.5%) |
| Single Unit, Attached | 7 (10.1%) | 62 (89.9%) |
| 2 Unit Apartments | 0 (0.0%) | 52 (100.0%) |
| 3 or 4 Unit Apartments | 6 (4.4%) | 129 (95.6%) |
| 5 to 9 Unit Apartments | 0 (0.0%) | 63 (100.0%) |
| 10 or more Apartments | 0 (0.0%) | 115 (100.0%) |
| Mobile Home / Other | 58 (67.4%) | 28 (32.6%) |
| Total | 904 (52.6%) | 815 (47.4%) |
Housing Structures by Number of Rooms in Chelan
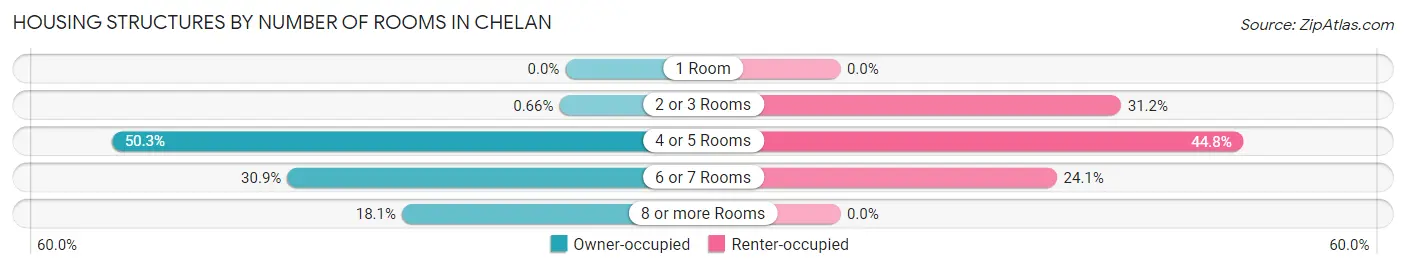
| Number of Rooms | Owner-occupied | Renter-occupied |
| 1 Room | 0 (0.0%) | 0 (0.0%) |
| 2 or 3 Rooms | 6 (0.7%) | 254 (31.2%) |
| 4 or 5 Rooms | 455 (50.3%) | 365 (44.8%) |
| 6 or 7 Rooms | 279 (30.9%) | 196 (24.0%) |
| 8 or more Rooms | 164 (18.1%) | 0 (0.0%) |
| Total | 904 (100.0%) | 815 (100.0%) |
Housing Structure by Heating Type in Chelan
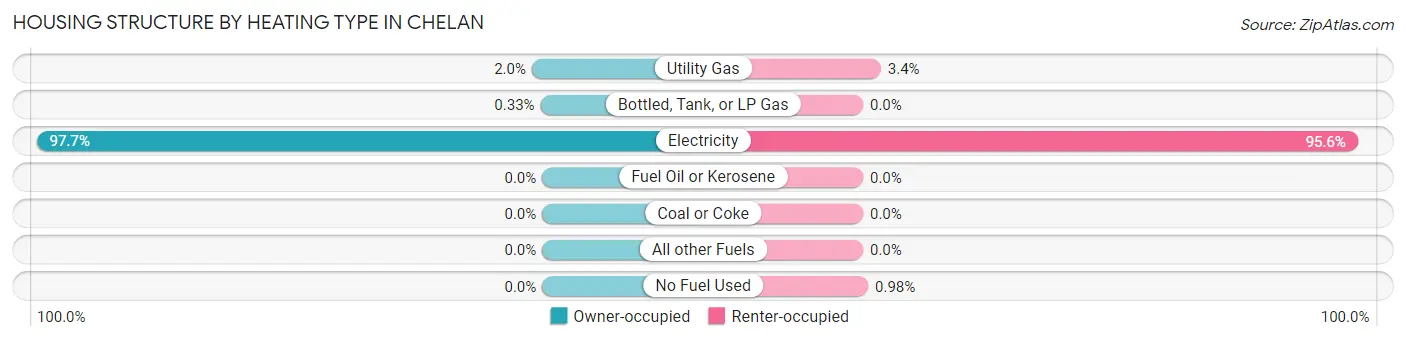
| Heating Type | Owner-occupied | Renter-occupied |
| Utility Gas | 18 (2.0%) | 28 (3.4%) |
| Bottled, Tank, or LP Gas | 3 (0.3%) | 0 (0.0%) |
| Electricity | 883 (97.7%) | 779 (95.6%) |
| Fuel Oil or Kerosene | 0 (0.0%) | 0 (0.0%) |
| Coal or Coke | 0 (0.0%) | 0 (0.0%) |
| All other Fuels | 0 (0.0%) | 0 (0.0%) |
| No Fuel Used | 0 (0.0%) | 8 (1.0%) |
| Total | 904 (100.0%) | 815 (100.0%) |
Household Vehicle Usage in Chelan
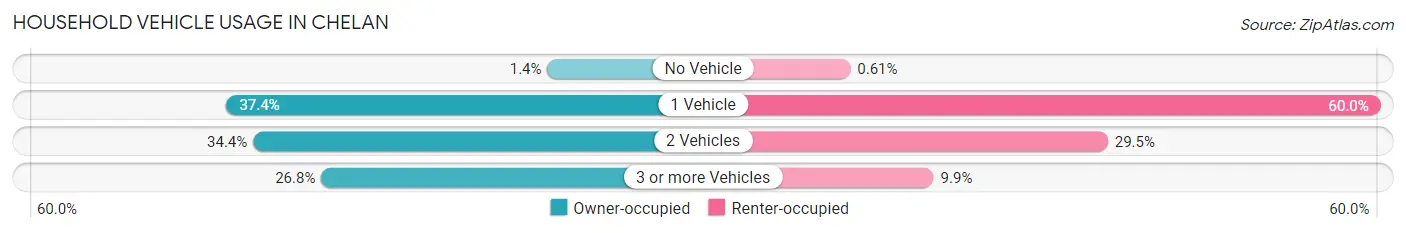
| Vehicles per Household | Owner-occupied | Renter-occupied |
| No Vehicle | 13 (1.4%) | 5 (0.6%) |
| 1 Vehicle | 338 (37.4%) | 489 (60.0%) |
| 2 Vehicles | 311 (34.4%) | 240 (29.4%) |
| 3 or more Vehicles | 242 (26.8%) | 81 (9.9%) |
| Total | 904 (100.0%) | 815 (100.0%) |
Real Estate & Mortgages in Chelan
Real Estate and Mortgage Overview in Chelan
| Characteristic | Without Mortgage | With Mortgage |
| Housing Units | 405 | 499 |
| Median Property Value | $479,900 | $366,000 |
| Median Household Income | $76,913 | $119 |
| Monthly Housing Costs | $670 | $24 |
| Real Estate Taxes | $3,342 | $0 |
Property Value by Mortgage Status in Chelan
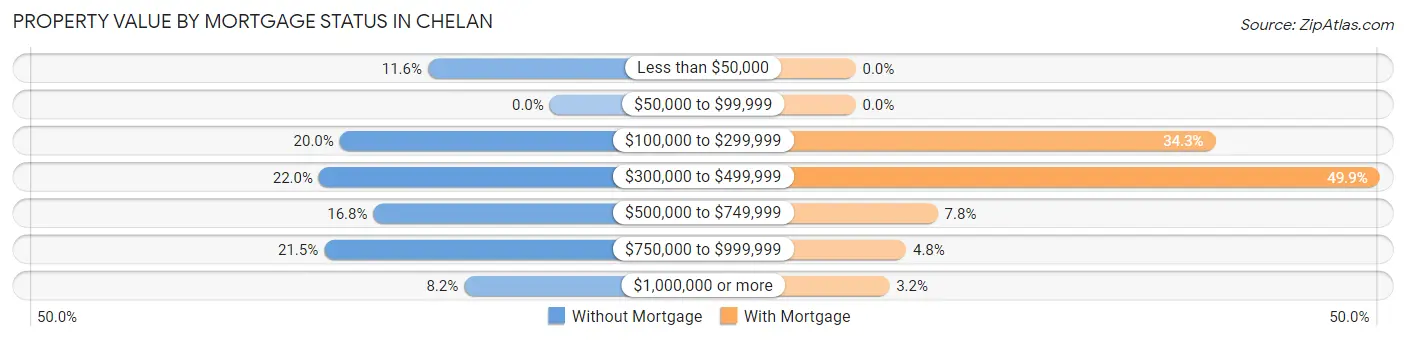
| Property Value | Without Mortgage | With Mortgage |
| Less than $50,000 | 47 (11.6%) | 0 (0.0%) |
| $50,000 to $99,999 | 0 (0.0%) | 0 (0.0%) |
| $100,000 to $299,999 | 81 (20.0%) | 171 (34.3%) |
| $300,000 to $499,999 | 89 (22.0%) | 249 (49.9%) |
| $500,000 to $749,999 | 68 (16.8%) | 39 (7.8%) |
| $750,000 to $999,999 | 87 (21.5%) | 24 (4.8%) |
| $1,000,000 or more | 33 (8.2%) | 16 (3.2%) |
| Total | 405 (100.0%) | 499 (100.0%) |
Household Income by Mortgage Status in Chelan
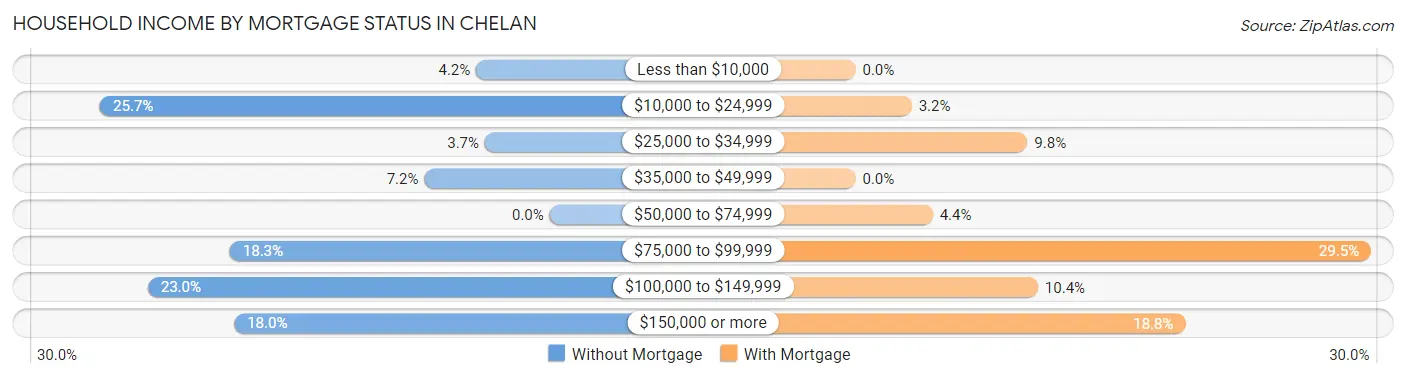
| Household Income | Without Mortgage | With Mortgage |
| Less than $10,000 | 17 (4.2%) | 0 (0.0%) |
| $10,000 to $24,999 | 104 (25.7%) | 16 (3.2%) |
| $25,000 to $34,999 | 15 (3.7%) | 49 (9.8%) |
| $35,000 to $49,999 | 29 (7.2%) | 0 (0.0%) |
| $50,000 to $74,999 | 0 (0.0%) | 22 (4.4%) |
| $75,000 to $99,999 | 74 (18.3%) | 147 (29.5%) |
| $100,000 to $149,999 | 93 (23.0%) | 52 (10.4%) |
| $150,000 or more | 73 (18.0%) | 94 (18.8%) |
| Total | 405 (100.0%) | 499 (100.0%) |
Property Value to Household Income Ratio in Chelan
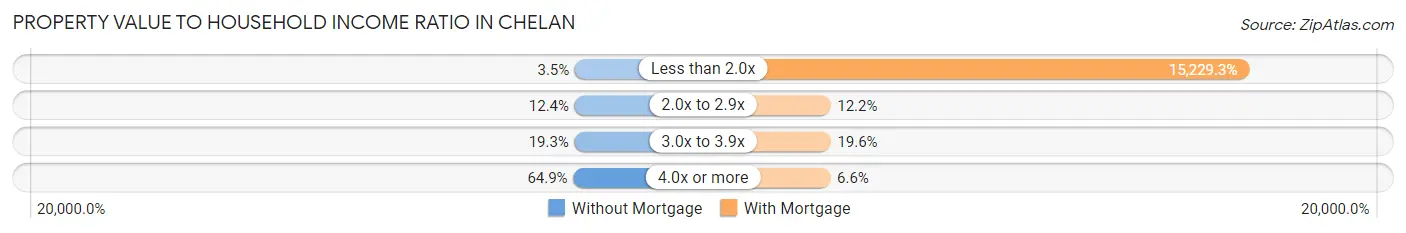
| Value-to-Income Ratio | Without Mortgage | With Mortgage |
| Less than 2.0x | 14 (3.5%) | 75,994 (15,229.3%) |
| 2.0x to 2.9x | 50 (12.3%) | 61 (12.2%) |
| 3.0x to 3.9x | 78 (19.3%) | 98 (19.6%) |
| 4.0x or more | 263 (64.9%) | 33 (6.6%) |
| Total | 405 (100.0%) | 499 (100.0%) |
Real Estate Taxes by Mortgage Status in Chelan
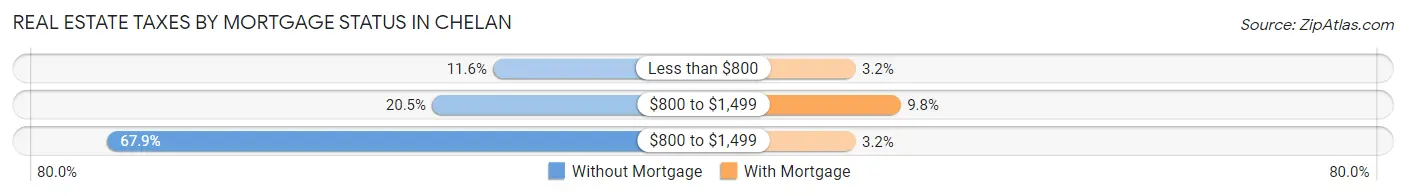
| Property Taxes | Without Mortgage | With Mortgage |
| Less than $800 | 47 (11.6%) | 16 (3.2%) |
| $800 to $1,499 | 83 (20.5%) | 49 (9.8%) |
| $800 to $1,499 | 275 (67.9%) | 16 (3.2%) |
| Total | 405 (100.0%) | 499 (100.0%) |
Health & Disability in Chelan
Health Insurance Coverage by Age in Chelan
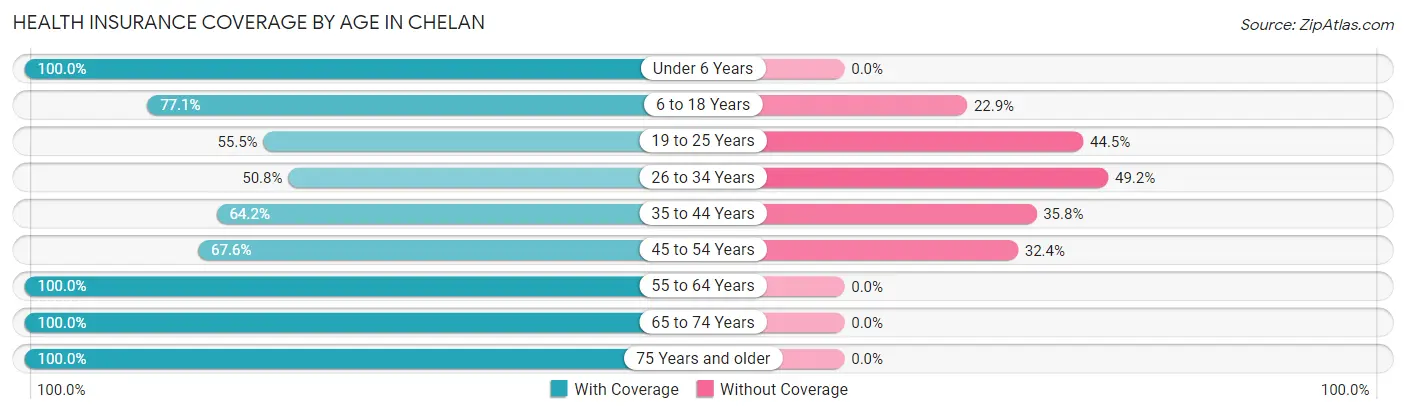
| Age Bracket | With Coverage | Without Coverage |
| Under 6 Years | 238 (100.0%) | 0 (0.0%) |
| 6 to 18 Years | 543 (77.1%) | 161 (22.9%) |
| 19 to 25 Years | 198 (55.5%) | 159 (44.5%) |
| 26 to 34 Years | 248 (50.8%) | 240 (49.2%) |
| 35 to 44 Years | 323 (64.2%) | 180 (35.8%) |
| 45 to 54 Years | 349 (67.6%) | 167 (32.4%) |
| 55 to 64 Years | 486 (100.0%) | 0 (0.0%) |
| 65 to 74 Years | 648 (100.0%) | 0 (0.0%) |
| 75 Years and older | 287 (100.0%) | 0 (0.0%) |
| Total | 3,320 (78.5%) | 907 (21.5%) |
Health Insurance Coverage by Citizenship Status in Chelan
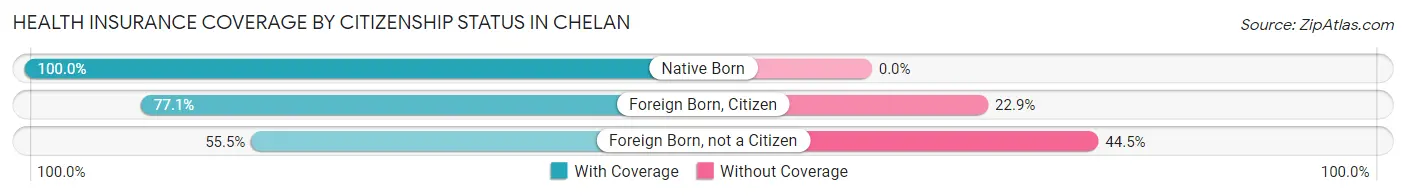
| Citizenship Status | With Coverage | Without Coverage |
| Native Born | 238 (100.0%) | 0 (0.0%) |
| Foreign Born, Citizen | 543 (77.1%) | 161 (22.9%) |
| Foreign Born, not a Citizen | 198 (55.5%) | 159 (44.5%) |
Health Insurance Coverage by Household Income in Chelan
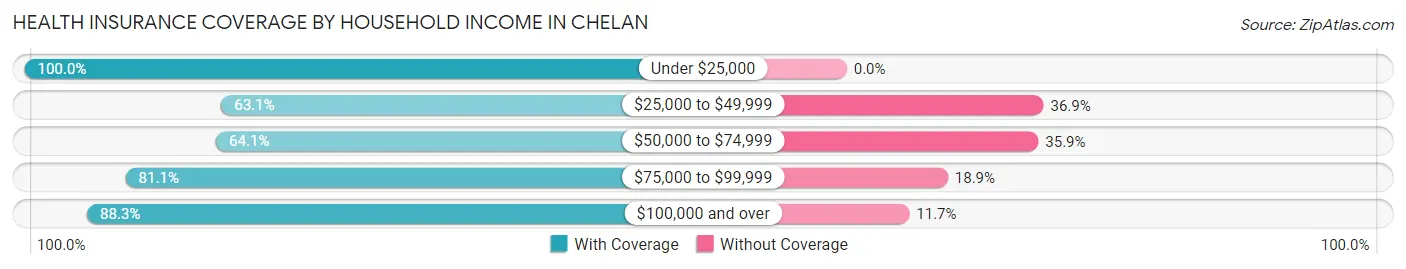
| Household Income | With Coverage | Without Coverage |
| Under $25,000 | 312 (100.0%) | 0 (0.0%) |
| $25,000 to $49,999 | 591 (63.1%) | 345 (36.9%) |
| $50,000 to $74,999 | 434 (64.1%) | 243 (35.9%) |
| $75,000 to $99,999 | 552 (81.1%) | 129 (18.9%) |
| $100,000 and over | 1,431 (88.3%) | 190 (11.7%) |
Public vs Private Health Insurance Coverage by Age in Chelan
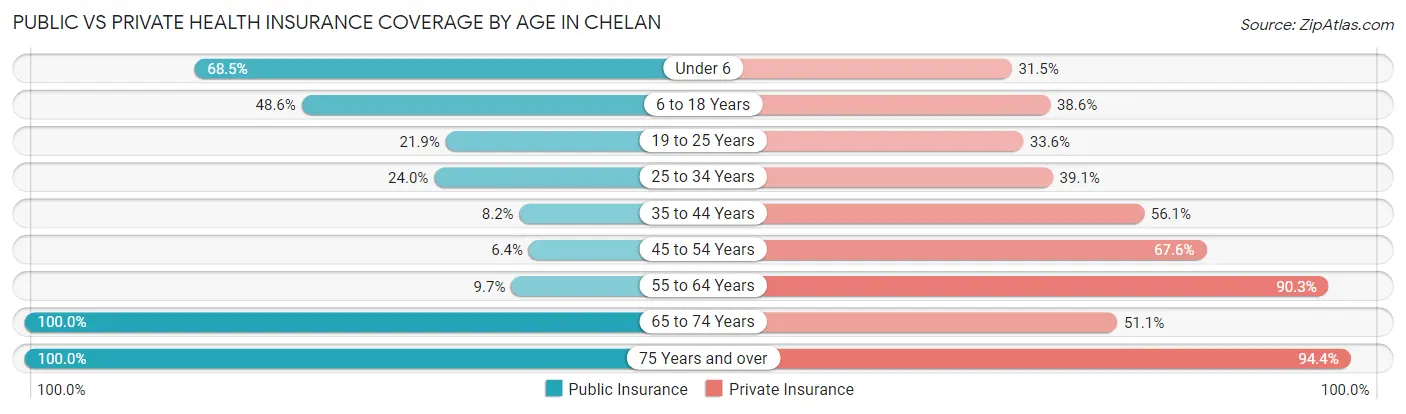
| Age Bracket | Public Insurance | Private Insurance |
| Under 6 | 163 (68.5%) | 75 (31.5%) |
| 6 to 18 Years | 342 (48.6%) | 272 (38.6%) |
| 19 to 25 Years | 78 (21.8%) | 120 (33.6%) |
| 25 to 34 Years | 117 (24.0%) | 191 (39.1%) |
| 35 to 44 Years | 41 (8.2%) | 282 (56.1%) |
| 45 to 54 Years | 33 (6.4%) | 349 (67.6%) |
| 55 to 64 Years | 47 (9.7%) | 439 (90.3%) |
| 65 to 74 Years | 648 (100.0%) | 331 (51.1%) |
| 75 Years and over | 287 (100.0%) | 271 (94.4%) |
| Total | 1,756 (41.5%) | 2,330 (55.1%) |
Disability Status by Sex by Age in Chelan
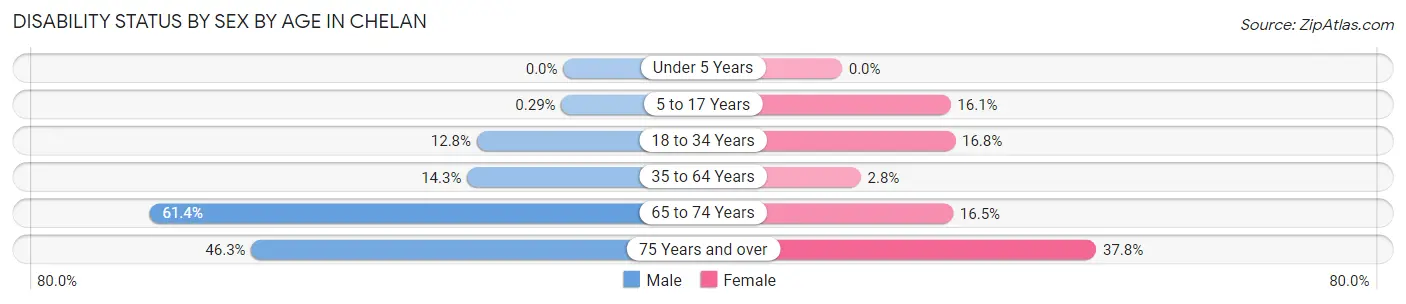
| Age Bracket | Male | Female |
| Under 5 Years | 0 (0.0%) | 0 (0.0%) |
| 5 to 17 Years | 1 (0.3%) | 60 (16.1%) |
| 18 to 34 Years | 42 (12.8%) | 96 (16.8%) |
| 35 to 64 Years | 133 (14.3%) | 16 (2.8%) |
| 65 to 74 Years | 145 (61.4%) | 68 (16.5%) |
| 75 Years and over | 63 (46.3%) | 57 (37.8%) |
Disability Class by Sex by Age in Chelan
Disability Class: Hearing Difficulty
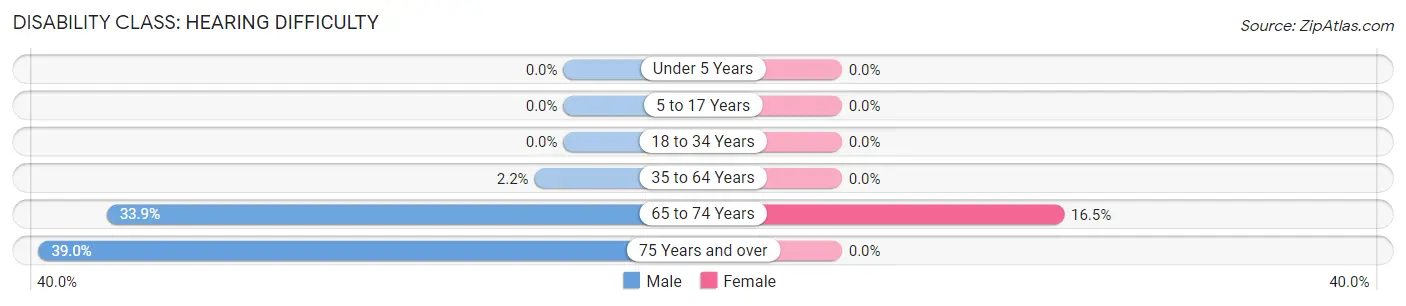
| Age Bracket | Male | Female |
| Under 5 Years | 0 (0.0%) | 0 (0.0%) |
| 5 to 17 Years | 0 (0.0%) | 0 (0.0%) |
| 18 to 34 Years | 0 (0.0%) | 0 (0.0%) |
| 35 to 64 Years | 20 (2.1%) | 0 (0.0%) |
| 65 to 74 Years | 80 (33.9%) | 68 (16.5%) |
| 75 Years and over | 53 (39.0%) | 0 (0.0%) |
Disability Class: Vision Difficulty
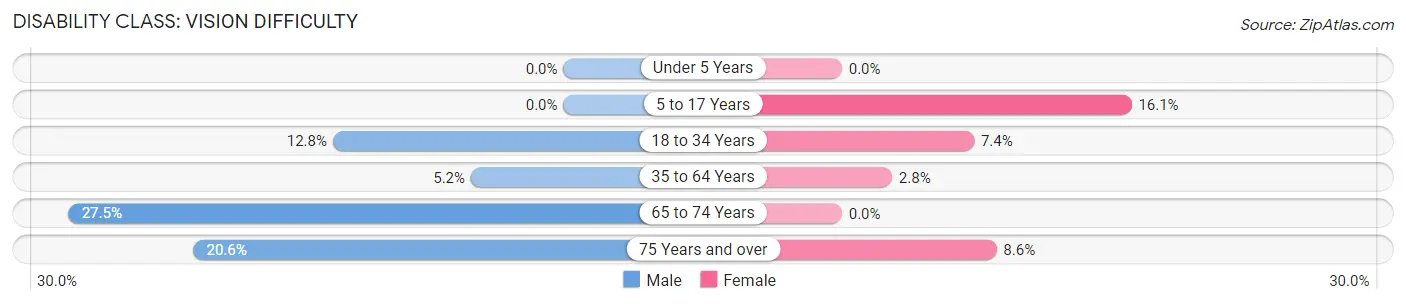
| Age Bracket | Male | Female |
| Under 5 Years | 0 (0.0%) | 0 (0.0%) |
| 5 to 17 Years | 0 (0.0%) | 60 (16.1%) |
| 18 to 34 Years | 42 (12.8%) | 42 (7.4%) |
| 35 to 64 Years | 48 (5.1%) | 16 (2.8%) |
| 65 to 74 Years | 65 (27.5%) | 0 (0.0%) |
| 75 Years and over | 28 (20.6%) | 13 (8.6%) |
Disability Class: Cognitive Difficulty

| Age Bracket | Male | Female |
| 5 to 17 Years | 1 (0.3%) | 0 (0.0%) |
| 18 to 34 Years | 0 (0.0%) | 54 (9.5%) |
| 35 to 64 Years | 0 (0.0%) | 0 (0.0%) |
| 65 to 74 Years | 0 (0.0%) | 0 (0.0%) |
| 75 Years and over | 28 (20.6%) | 0 (0.0%) |
Disability Class: Ambulatory Difficulty
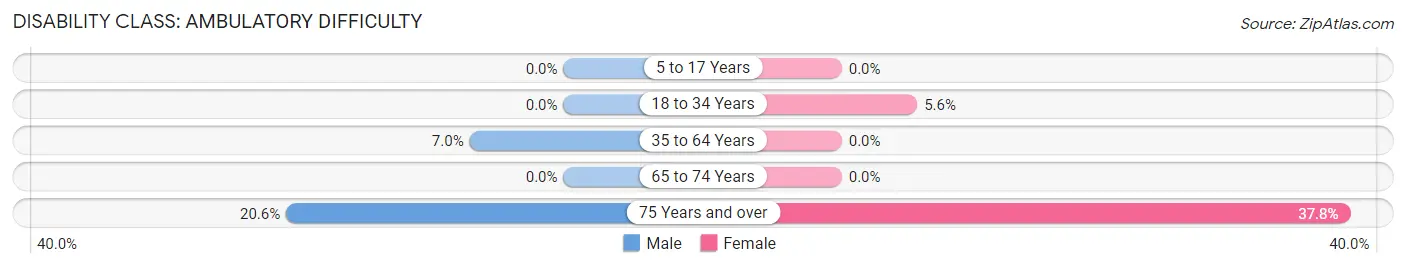
| Age Bracket | Male | Female |
| 5 to 17 Years | 0 (0.0%) | 0 (0.0%) |
| 18 to 34 Years | 0 (0.0%) | 32 (5.6%) |
| 35 to 64 Years | 65 (7.0%) | 0 (0.0%) |
| 65 to 74 Years | 0 (0.0%) | 0 (0.0%) |
| 75 Years and over | 28 (20.6%) | 57 (37.8%) |
Disability Class: Self-Care Difficulty
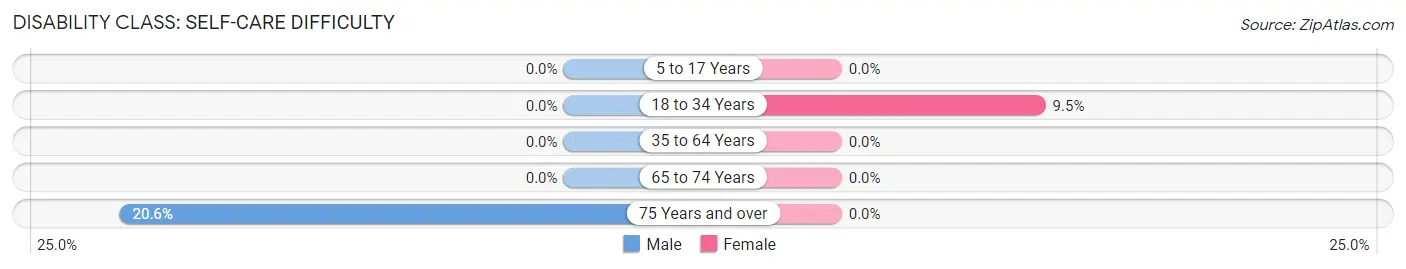
| Age Bracket | Male | Female |
| 5 to 17 Years | 0 (0.0%) | 0 (0.0%) |
| 18 to 34 Years | 0 (0.0%) | 54 (9.5%) |
| 35 to 64 Years | 0 (0.0%) | 0 (0.0%) |
| 65 to 74 Years | 0 (0.0%) | 0 (0.0%) |
| 75 Years and over | 28 (20.6%) | 0 (0.0%) |
Technology Access in Chelan
Computing Device Access in Chelan
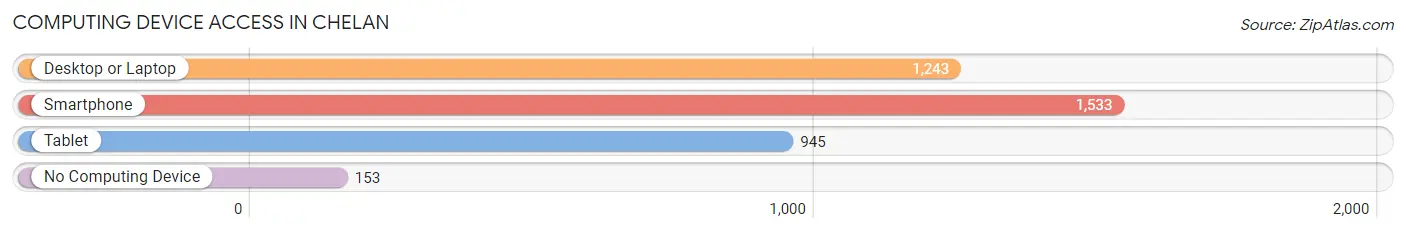
| Device Type | # Households | % Households |
| Desktop or Laptop | 1,243 | 72.3% |
| Smartphone | 1,533 | 89.2% |
| Tablet | 945 | 55.0% |
| No Computing Device | 153 | 8.9% |
| Total | 1,719 | 100.0% |
Internet Access in Chelan
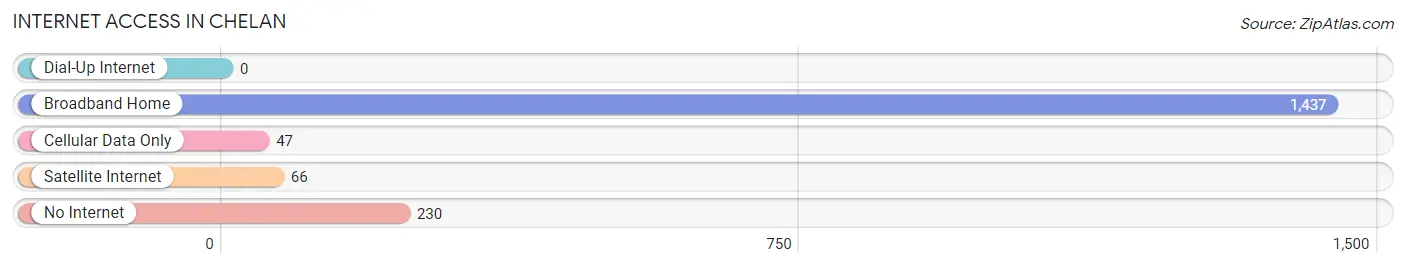
| Internet Type | # Households | % Households |
| Dial-Up Internet | 0 | 0.0% |
| Broadband Home | 1,437 | 83.6% |
| Cellular Data Only | 47 | 2.7% |
| Satellite Internet | 66 | 3.8% |
| No Internet | 230 | 13.4% |
| Total | 1,719 | 100.0% |
Chelan Summary
Chelan, Washington is a small city located in the north-central part of the state, in Chelan County. It is situated on the eastern shore of Lake Chelan, a 50.5-mile long lake that is the third deepest lake in the United States. The city is surrounded by the Cascade Mountains and is home to a population of approximately 4,000 people.
Geography
Chelan is located in the Wenatchee Valley, which is part of the Columbia Plateau. The city is situated on the eastern shore of Lake Chelan, which is the third deepest lake in the United States. The lake is 50.5 miles long and has a maximum depth of 1,486 feet. The lake is fed by the Stehekin River, which originates in the Cascade Mountains. The city is surrounded by the Cascade Mountains, which provide a stunning backdrop to the city. The city is located at an elevation of 1,082 feet above sea level.
Climate
Chelan has a semi-arid climate, with hot summers and cold winters. The average high temperature in the summer is around 85°F, while the average low temperature in the winter is around 20°F. The city receives an average of 11 inches of precipitation per year, with most of it falling in the winter months.
Demographics
As of the 2010 census, the population of Chelan was 4,060. The racial makeup of the city was 91.2% White, 0.7% African American, 0.7% Native American, 0.7% Asian, 0.2% Pacific Islander, 4.2% from other races, and 2.1% from two or more races. Hispanic or Latino of any race were 8.2% of the population.
Economy
The economy of Chelan is largely based on tourism and agriculture. The city is a popular destination for tourists, who come to enjoy the lake and the surrounding mountains. The city is also home to several wineries, which attract visitors from all over the world. Agriculture is also an important part of the local economy, with apples, cherries, and other fruits being grown in the area.
The city is also home to several businesses, including a hospital, a bank, and several retail stores. The city is also home to several manufacturing companies, including a boat manufacturer and a furniture manufacturer.
Conclusion
Chelan, Washington is a small city located in the north-central part of the state, in Chelan County. It is situated on the eastern shore of Lake Chelan, a 50.5-mile long lake that is the third deepest lake in the United States. The city is surrounded by the Cascade Mountains and is home to a population of approximately 4,000 people. The economy of Chelan is largely based on tourism and agriculture, with apples, cherries, and other fruits being grown in the area. The city is also home to several businesses, including a hospital, a bank, and several retail stores. The city has a semi-arid climate, with hot summers and cold winters.
Common Questions
What is Per Capita Income in Chelan?
Per Capita income in Chelan is $37,777.
What is the Median Family Income in Chelan?
Median Family Income in Chelan is $78,370.
What is the Median Household income in Chelan?
Median Household Income in Chelan is $75,099.
What is Income or Wage Gap in Chelan?
Income or Wage Gap in Chelan is 44.3%.
Women in Chelan earn 55.7 cents for every dollar earned by a man.
What is Family Income Deficit in Chelan?
Family Income Deficit in Chelan is $7,377.
Families that are below poverty line in Chelan earn $7,377 less on average than the poverty threshold level.
What is Inequality or Gini Index in Chelan?
Inequality or Gini Index in Chelan is 0.42.
What is the Total Population of Chelan?
Total Population of Chelan is 4,269.
What is the Total Male Population of Chelan?
Total Male Population of Chelan is 2,029.
What is the Total Female Population of Chelan?
Total Female Population of Chelan is 2,240.
What is the Ratio of Males per 100 Females in Chelan?
There are 90.58 Males per 100 Females in Chelan.
What is the Ratio of Females per 100 Males in Chelan?
There are 110.40 Females per 100 Males in Chelan.
What is the Median Population Age in Chelan?
Median Population Age in Chelan is 39.8 Years.
What is the Average Family Size in Chelan
Average Family Size in Chelan is 3.4 People.
What is the Average Household Size in Chelan
Average Household Size in Chelan is 2.5 People.
How Large is the Labor Force in Chelan?
There are 2,136 People in the Labor Forcein in Chelan.
What is the Percentage of People in the Labor Force in Chelan?
61.6% of People are in the Labor Force in Chelan.
What is the Unemployment Rate in Chelan?
Unemployment Rate in Chelan is 3.3%.