Oroville, WA Map & Demographics
Oroville Map
Oroville Overview
$18,755
PER CAPITA INCOME
$41,750
AVG FAMILY INCOME
$34,750
AVG HOUSEHOLD INCOME
26.6%
WAGE / INCOME GAP [ % ]
73.4¢/ $1
WAGE / INCOME GAP [ $ ]
0.42
INEQUALITY / GINI INDEX
1,753
TOTAL POPULATION
882
MALE POPULATION
871
FEMALE POPULATION
101.26
MALES / 100 FEMALES
98.75
FEMALES / 100 MALES
36.0
MEDIAN AGE
3.1
AVG FAMILY SIZE
2.3
AVG HOUSEHOLD SIZE
673
LABOR FORCE [ PEOPLE ]
51.9%
PERCENT IN LABOR FORCE
7.0%
UNEMPLOYMENT RATE
Oroville Zip Codes
Oroville Area Codes
Income in Oroville
Income Overview in Oroville
Per Capita Income in Oroville is $18,755, while median incomes of families and households are $41,750 and $34,750 respectively.
| Characteristic | Number | Measure |
| Per Capita Income | 1,753 | $18,755 |
| Median Family Income | 408 | $41,750 |
| Mean Family Income | 408 | $60,940 |
| Median Household Income | 740 | $34,750 |
| Mean Household Income | 740 | $46,912 |
| Income Deficit | 408 | $0 |
| Wage / Income Gap (%) | 1,753 | 26.63% |
| Wage / Income Gap ($) | 1,753 | 73.37¢ per $1 |
| Gini / Inequality Index | 1,753 | 0.42 |
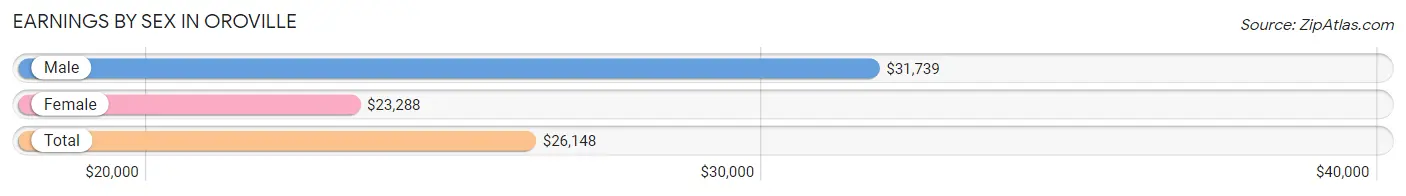
Earnings by Sex in Oroville
Average Earnings in Oroville are $26,148, $31,739 for men and $23,288 for women, a difference of 26.6%.
| Sex | Number | Average Earnings |
| Male | 400 (55.2%) | $31,739 |
| Female | 325 (44.8%) | $23,288 |
| Total | 725 (100.0%) | $26,148 |
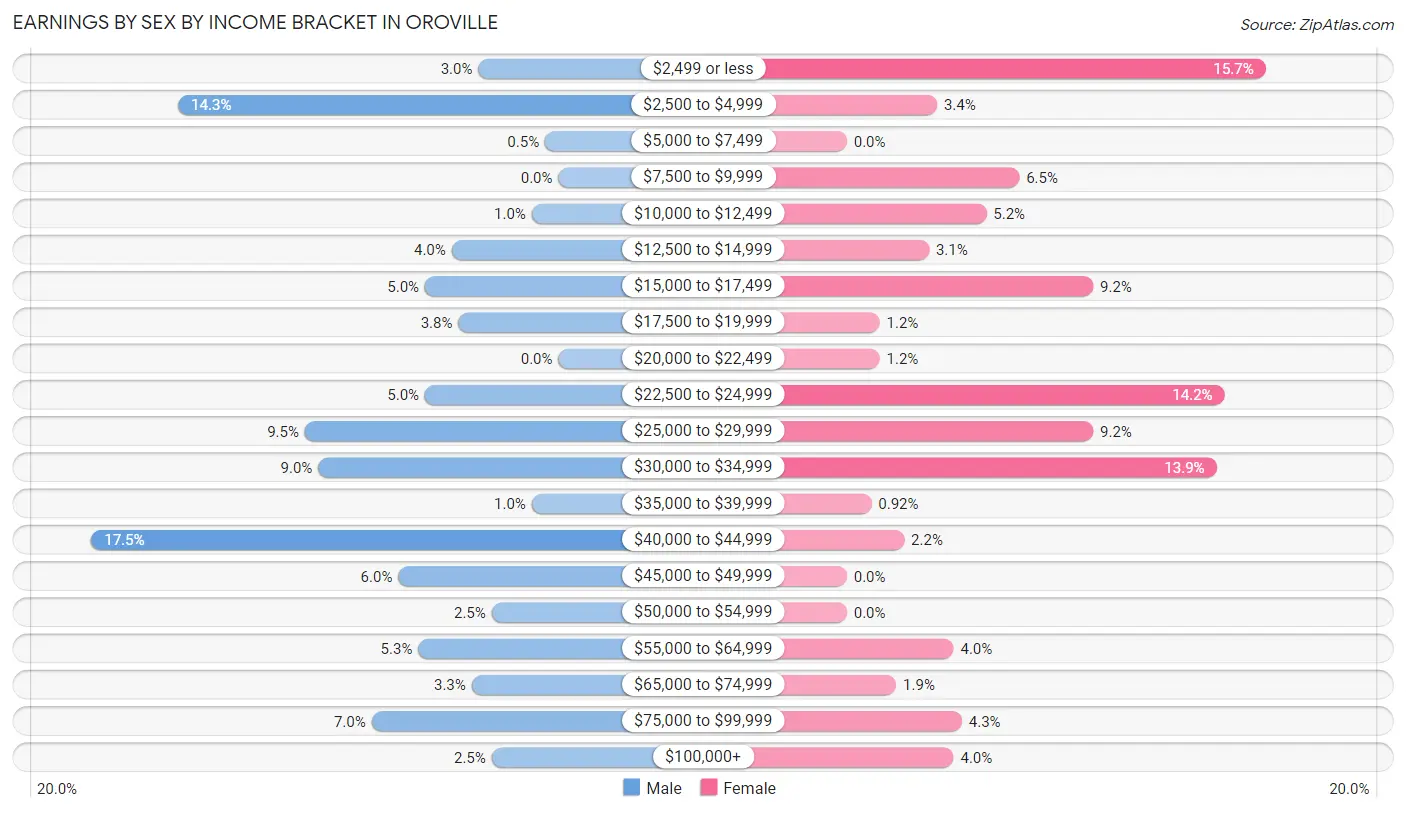
Earnings by Sex by Income Bracket in Oroville
The most common earnings brackets in Oroville are $40,000 to $44,999 for men (70 | 17.5%) and $2,499 or less for women (51 | 15.7%).
| Income | Male | Female |
| $2,499 or less | 12 (3.0%) | 51 (15.7%) |
| $2,500 to $4,999 | 57 (14.2%) | 11 (3.4%) |
| $5,000 to $7,499 | 2 (0.5%) | 0 (0.0%) |
| $7,500 to $9,999 | 0 (0.0%) | 21 (6.5%) |
| $10,000 to $12,499 | 4 (1.0%) | 17 (5.2%) |
| $12,500 to $14,999 | 16 (4.0%) | 10 (3.1%) |
| $15,000 to $17,499 | 20 (5.0%) | 30 (9.2%) |
| $17,500 to $19,999 | 15 (3.7%) | 4 (1.2%) |
| $20,000 to $22,499 | 0 (0.0%) | 4 (1.2%) |
| $22,500 to $24,999 | 20 (5.0%) | 46 (14.1%) |
| $25,000 to $29,999 | 38 (9.5%) | 30 (9.2%) |
| $30,000 to $34,999 | 36 (9.0%) | 45 (13.9%) |
| $35,000 to $39,999 | 4 (1.0%) | 3 (0.9%) |
| $40,000 to $44,999 | 70 (17.5%) | 7 (2.1%) |
| $45,000 to $49,999 | 24 (6.0%) | 0 (0.0%) |
| $50,000 to $54,999 | 10 (2.5%) | 0 (0.0%) |
| $55,000 to $64,999 | 21 (5.2%) | 13 (4.0%) |
| $65,000 to $74,999 | 13 (3.3%) | 6 (1.8%) |
| $75,000 to $99,999 | 28 (7.0%) | 14 (4.3%) |
| $100,000+ | 10 (2.5%) | 13 (4.0%) |
| Total | 400 (100.0%) | 325 (100.0%) |
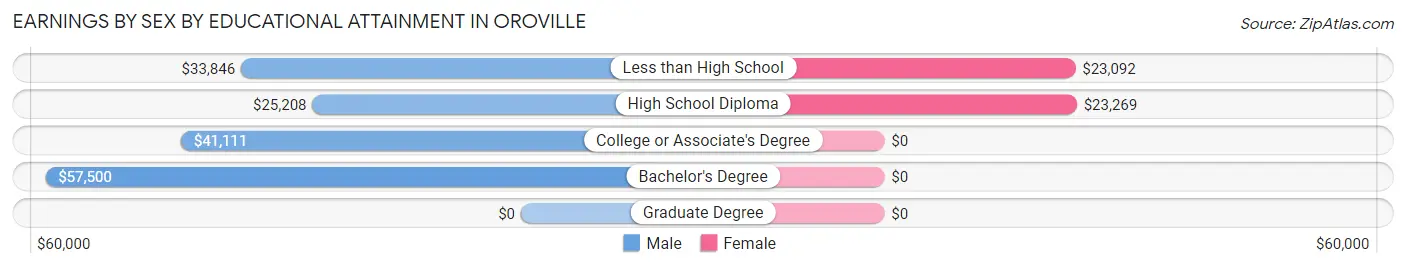
Earnings by Sex by Educational Attainment in Oroville
Average earnings in Oroville are $31,111 for men and $22,695 for women, a difference of 27.1%. Men with an educational attainment of bachelor's degree enjoy the highest average annual earnings of $57,500, while those with high school diploma education earn the least with $25,208. Women with an educational attainment of high school diploma earn the most with the average annual earnings of $23,269, while those with less than high school education have the smallest earnings of $23,092.
| Educational Attainment | Male Income | Female Income |
| Less than High School | $33,846 | $23,092 |
| High School Diploma | $25,208 | $23,269 |
| College or Associate's Degree | $41,111 | $0 |
| Bachelor's Degree | $57,500 | $0 |
| Graduate Degree | - | - |
| Total | $31,111 | $22,695 |
Family Income in Oroville
Family Income Brackets in Oroville
According to the Oroville family income data, there are 81 families falling into the $50,000 to $74,999 income range, which is the most common income bracket and makes up 19.9% of all families.
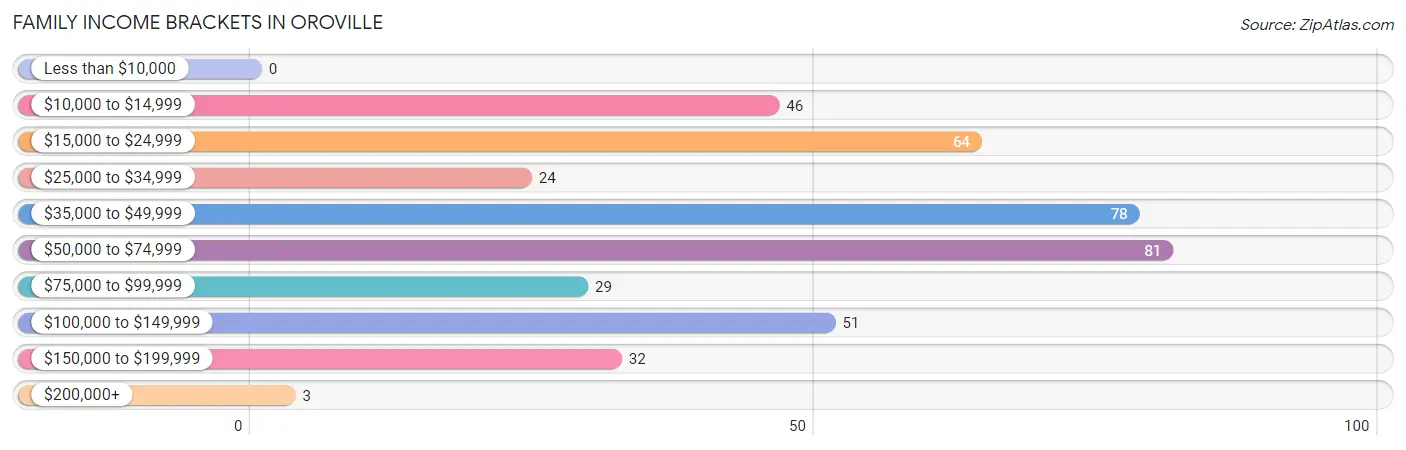
| Income Bracket | # Families | % Families |
| Less than $10,000 | 0 | 0.0% |
| $10,000 to $14,999 | 46 | 11.3% |
| $15,000 to $24,999 | 64 | 15.7% |
| $25,000 to $34,999 | 24 | 5.9% |
| $35,000 to $49,999 | 78 | 19.1% |
| $50,000 to $74,999 | 81 | 19.9% |
| $75,000 to $99,999 | 29 | 7.1% |
| $100,000 to $149,999 | 51 | 12.5% |
| $150,000 to $199,999 | 32 | 7.8% |
| $200,000+ | 3 | 0.7% |
Family Income by Famaliy Size in Oroville
6-person families (31 | 7.6%) account for the highest median family income in Oroville with $65,795 per family, while 2-person families (223 | 54.7%) have the highest median income of $19,716 per family member.
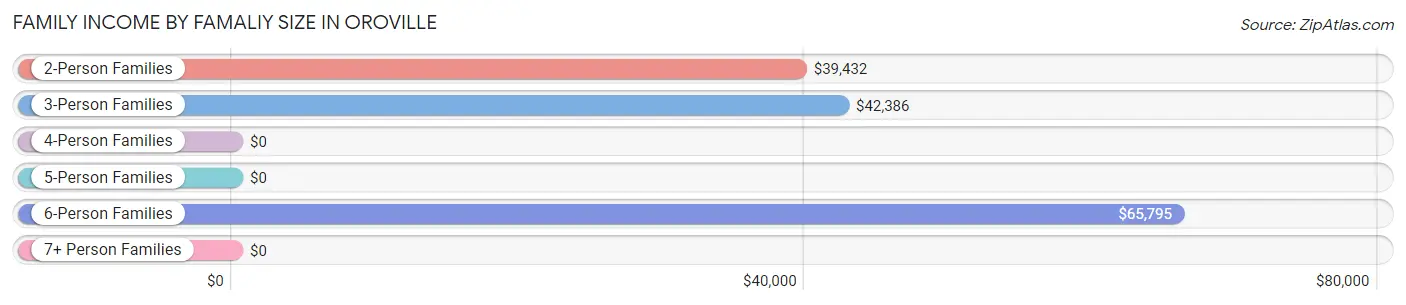
| Income Bracket | # Families | Median Income |
| 2-Person Families | 223 (54.7%) | $39,432 |
| 3-Person Families | 67 (16.4%) | $42,386 |
| 4-Person Families | 16 (3.9%) | $0 |
| 5-Person Families | 63 (15.4%) | $0 |
| 6-Person Families | 31 (7.6%) | $65,795 |
| 7+ Person Families | 8 (2.0%) | $0 |
| Total | 408 (100.0%) | $41,750 |
Family Income by Number of Earners in Oroville
The median family income in Oroville is $41,750, with families comprising 3+ earners (21) having the highest median family income of $120,625, while families with no earners (92) have the lowest median family income of $17,083, accounting for 5.1% and 22.6% of families, respectively.
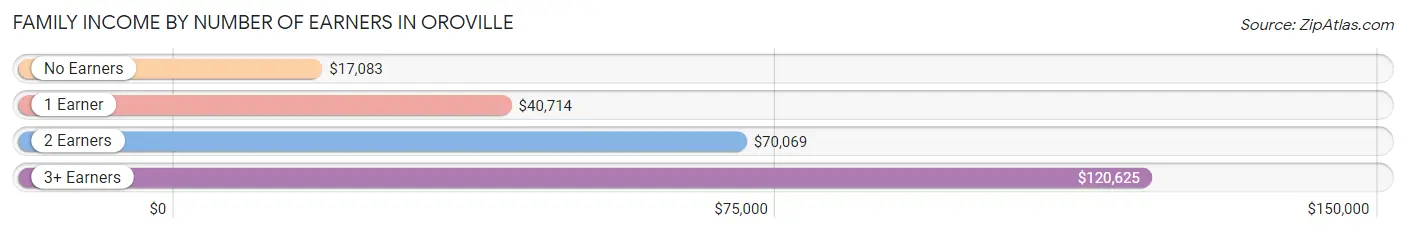
| Number of Earners | # Families | Median Income |
| No Earners | 92 (22.6%) | $17,083 |
| 1 Earner | 146 (35.8%) | $40,714 |
| 2 Earners | 149 (36.5%) | $70,069 |
| 3+ Earners | 21 (5.1%) | $120,625 |
| Total | 408 (100.0%) | $41,750 |
Household Income in Oroville
Household Income Brackets in Oroville
With 145 households falling in the category, the $35,000 to $49,999 income range is the most frequent in Oroville, accounting for 19.6% of all households. In contrast, only 3 households (0.4%) fall into the $200,000+ income bracket, making it the least populous group.
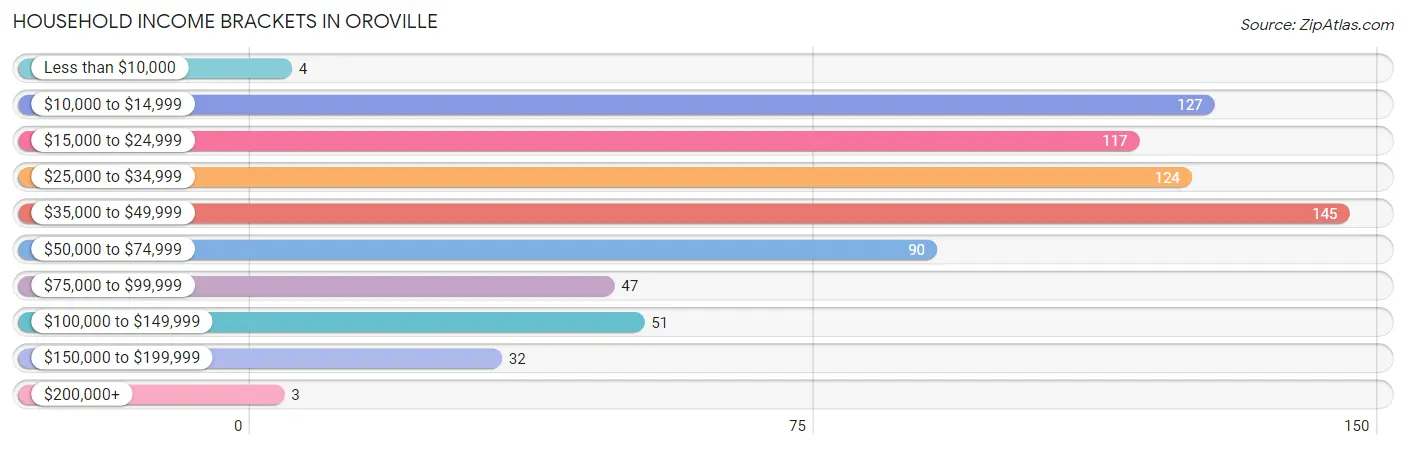
| Income Bracket | # Households | % Households |
| Less than $10,000 | 4 | 0.5% |
| $10,000 to $14,999 | 127 | 17.2% |
| $15,000 to $24,999 | 117 | 15.8% |
| $25,000 to $34,999 | 124 | 16.8% |
| $35,000 to $49,999 | 145 | 19.6% |
| $50,000 to $74,999 | 90 | 12.2% |
| $75,000 to $99,999 | 47 | 6.4% |
| $100,000 to $149,999 | 51 | 6.9% |
| $150,000 to $199,999 | 32 | 4.3% |
| $200,000+ | 3 | 0.4% |
Household Income by Householder Age in Oroville
The median household income in Oroville is $34,750, with the highest median household income of $39,063 found in the 25 to 44 years age bracket for the primary householder. A total of 165 households (22.3%) fall into this category. Meanwhile, the 15 to 24 years age bracket for the primary householder has the lowest median household income of $0, with 60 households (8.1%) in this group.
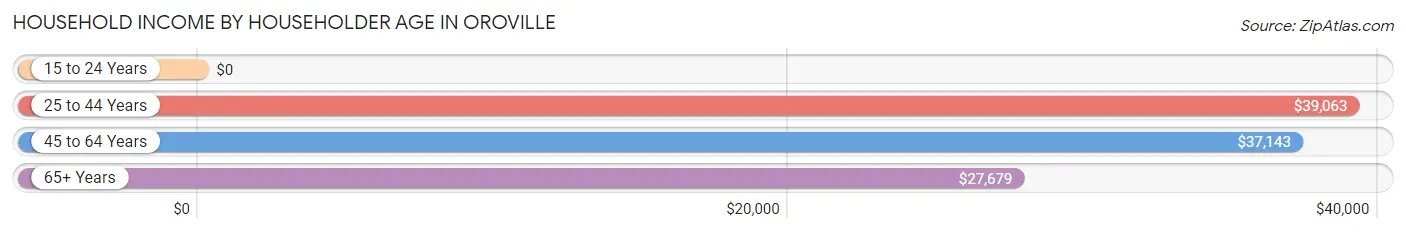
| Income Bracket | # Households | Median Income |
| 15 to 24 Years | 60 (8.1%) | $0 |
| 25 to 44 Years | 165 (22.3%) | $39,063 |
| 45 to 64 Years | 290 (39.2%) | $37,143 |
| 65+ Years | 225 (30.4%) | $27,679 |
| Total | 740 (100.0%) | $34,750 |
Poverty in Oroville
Income Below Poverty by Sex and Age in Oroville
With 29.5% poverty level for males and 35.9% for females among the residents of Oroville, 15 year old males and 12 to 14 year old females are the most vulnerable to poverty, with 4 males (100.0%) and 36 females (80.0%) in their respective age groups living below the poverty level.
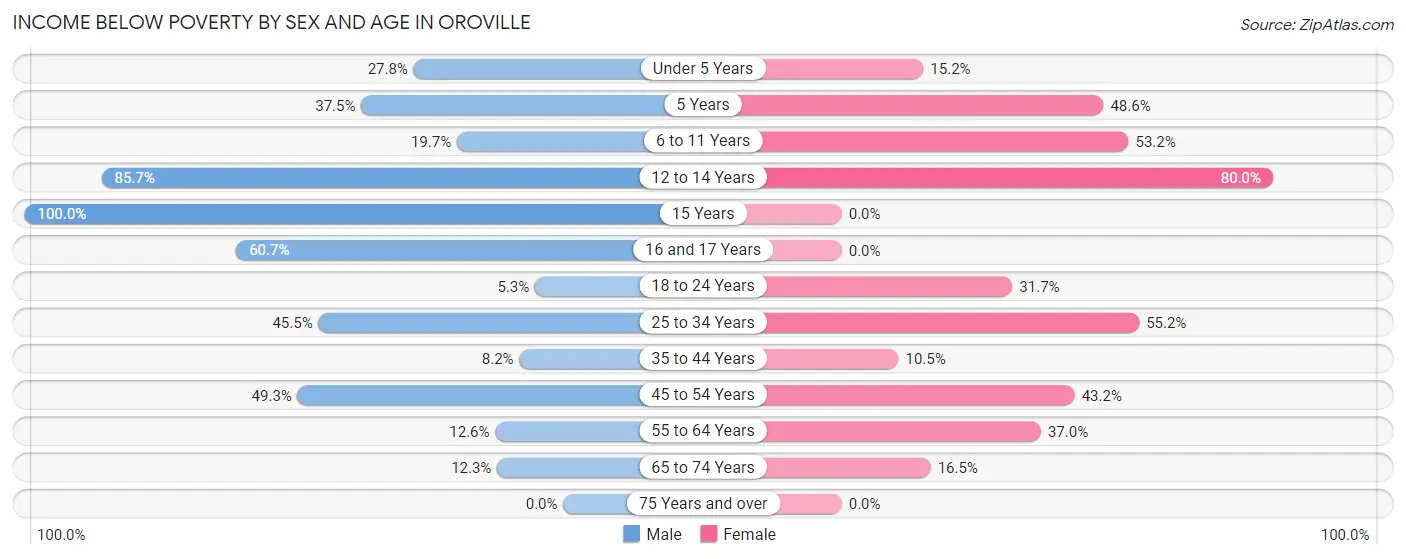
| Age Bracket | Male | Female |
| Under 5 Years | 30 (27.8%) | 10 (15.1%) |
| 5 Years | 3 (37.5%) | 17 (48.6%) |
| 6 to 11 Years | 15 (19.7%) | 33 (53.2%) |
| 12 to 14 Years | 24 (85.7%) | 36 (80.0%) |
| 15 Years | 4 (100.0%) | 0 (0.0%) |
| 16 and 17 Years | 17 (60.7%) | 0 (0.0%) |
| 18 to 24 Years | 3 (5.3%) | 19 (31.7%) |
| 25 to 34 Years | 60 (45.5%) | 69 (55.2%) |
| 35 to 44 Years | 4 (8.2%) | 4 (10.5%) |
| 45 to 54 Years | 73 (49.3%) | 64 (43.2%) |
| 55 to 64 Years | 13 (12.6%) | 44 (37.0%) |
| 65 to 74 Years | 14 (12.3%) | 17 (16.5%) |
| 75 Years and over | 0 (0.0%) | 0 (0.0%) |
| Total | 260 (29.5%) | 313 (35.9%) |
Income Above Poverty by Sex and Age in Oroville
According to the poverty statistics in Oroville, males aged 75 years and over and females aged 15 years are the age groups that are most secure financially, with 100.0% of males and 100.0% of females in these age groups living above the poverty line.
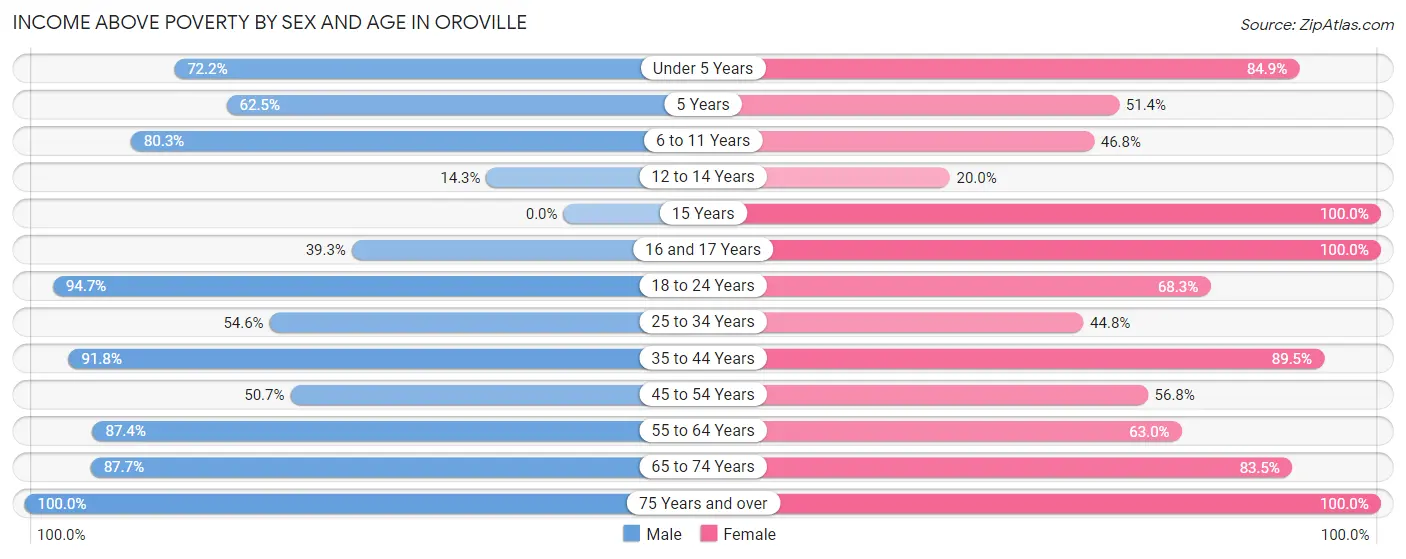
| Age Bracket | Male | Female |
| Under 5 Years | 78 (72.2%) | 56 (84.9%) |
| 5 Years | 5 (62.5%) | 18 (51.4%) |
| 6 to 11 Years | 61 (80.3%) | 29 (46.8%) |
| 12 to 14 Years | 4 (14.3%) | 9 (20.0%) |
| 15 Years | 0 (0.0%) | 25 (100.0%) |
| 16 and 17 Years | 11 (39.3%) | 5 (100.0%) |
| 18 to 24 Years | 54 (94.7%) | 41 (68.3%) |
| 25 to 34 Years | 72 (54.5%) | 56 (44.8%) |
| 35 to 44 Years | 45 (91.8%) | 34 (89.5%) |
| 45 to 54 Years | 75 (50.7%) | 84 (56.8%) |
| 55 to 64 Years | 90 (87.4%) | 75 (63.0%) |
| 65 to 74 Years | 100 (87.7%) | 86 (83.5%) |
| 75 Years and over | 27 (100.0%) | 40 (100.0%) |
| Total | 622 (70.5%) | 558 (64.1%) |
Income Below Poverty Among Married-Couple Families in Oroville
The poverty statistics for married-couple families in Oroville show that 5.5% or 14 of the total 253 families live below the poverty line. Families with 1 or 2 children have the highest poverty rate of 23.5%, comprising of 12 families. On the other hand, families with no children have the lowest poverty rate of 0.0%, which includes 0 families.
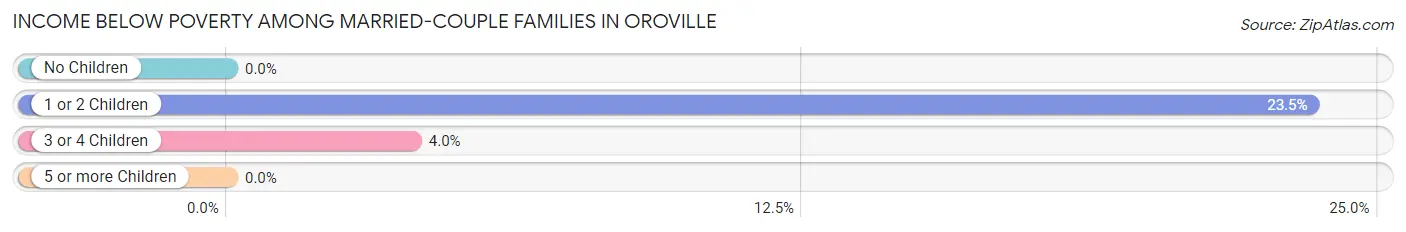
| Children | Above Poverty | Below Poverty |
| No Children | 152 (100.0%) | 0 (0.0%) |
| 1 or 2 Children | 39 (76.5%) | 12 (23.5%) |
| 3 or 4 Children | 48 (96.0%) | 2 (4.0%) |
| 5 or more Children | 0 (0.0%) | 0 (0.0%) |
| Total | 239 (94.5%) | 14 (5.5%) |
Income Below Poverty Among Single-Parent Households in Oroville
According to the poverty data in Oroville, 31.5% or 17 single-father households and 72.3% or 73 single-mother households are living below the poverty line. Among single-father households, those with no children have the highest poverty rate, with 17 households (51.5%) experiencing poverty. Likewise, among single-mother households, those with 5 or more children have the highest poverty rate, with 8 households (100.0%) falling below the poverty line.
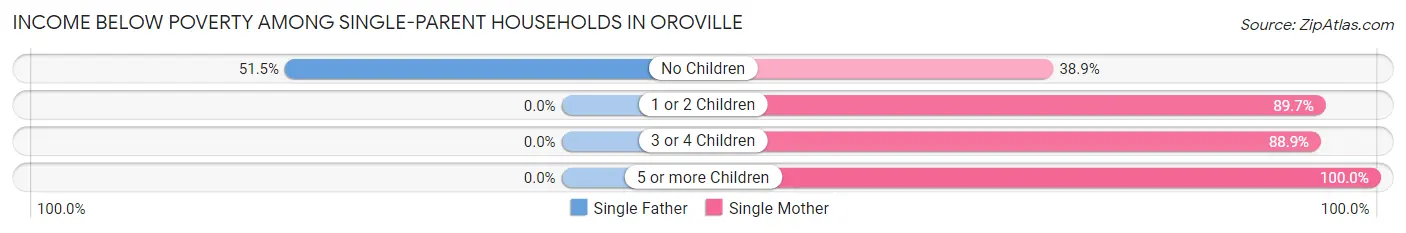
| Children | Single Father | Single Mother |
| No Children | 17 (51.5%) | 14 (38.9%) |
| 1 or 2 Children | 0 (0.0%) | 35 (89.7%) |
| 3 or 4 Children | 0 (0.0%) | 16 (88.9%) |
| 5 or more Children | 0 (0.0%) | 8 (100.0%) |
| Total | 17 (31.5%) | 73 (72.3%) |
Income Below Poverty Among Married-Couple vs Single-Parent Households in Oroville
The poverty data for Oroville shows that 14 of the married-couple family households (5.5%) and 90 of the single-parent households (58.1%) are living below the poverty level. Within the married-couple family households, those with 1 or 2 children have the highest poverty rate, with 12 households (23.5%) falling below the poverty line. Among the single-parent households, those with 5 or more children have the highest poverty rate, with 8 household (100.0%) living below poverty.
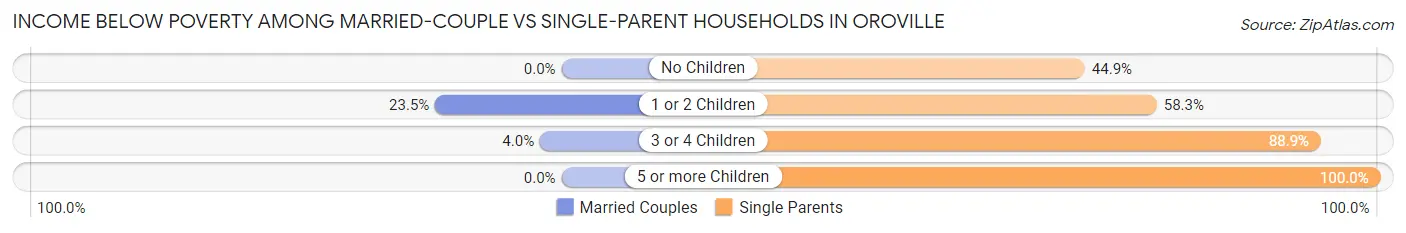
| Children | Married-Couple Families | Single-Parent Households |
| No Children | 0 (0.0%) | 31 (44.9%) |
| 1 or 2 Children | 12 (23.5%) | 35 (58.3%) |
| 3 or 4 Children | 2 (4.0%) | 16 (88.9%) |
| 5 or more Children | 0 (0.0%) | 8 (100.0%) |
| Total | 14 (5.5%) | 90 (58.1%) |
Race in Oroville
The most populous races in Oroville are White / Caucasian (1,102 | 62.9%), Hispanic or Latino (592 | 33.8%), and Some other Race (292 | 16.7%).
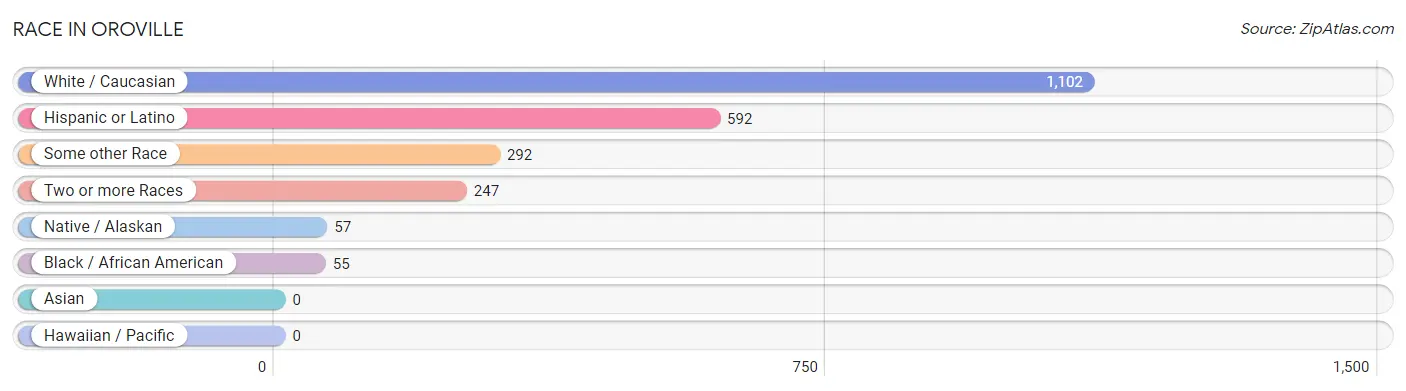
| Race | # Population | % Population |
| Asian | 0 | 0.0% |
| Black / African American | 55 | 3.1% |
| Hawaiian / Pacific | 0 | 0.0% |
| Hispanic or Latino | 592 | 33.8% |
| Native / Alaskan | 57 | 3.3% |
| White / Caucasian | 1,102 | 62.9% |
| Two or more Races | 247 | 14.1% |
| Some other Race | 292 | 16.7% |
| Total | 1,753 | 100.0% |
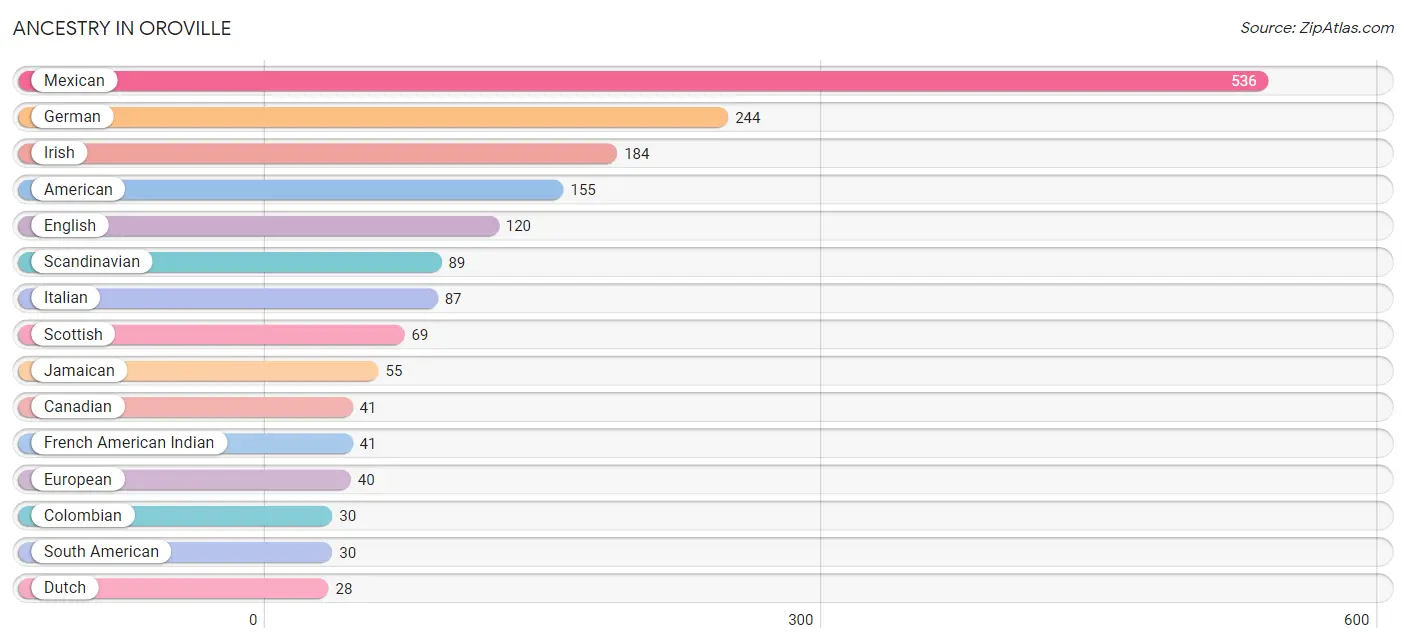
Ancestry in Oroville
The most populous ancestries reported in Oroville are Mexican (536 | 30.6%), German (244 | 13.9%), Irish (184 | 10.5%), American (155 | 8.8%), and English (120 | 6.9%), together accounting for 70.7% of all Oroville residents.
| Ancestry | # Population | % Population |
| African | 6 | 0.3% |
| American | 155 | 8.8% |
| Bhutanese | 3 | 0.2% |
| British | 27 | 1.5% |
| Canadian | 41 | 2.3% |
| Cherokee | 27 | 1.5% |
| Chickasaw | 5 | 0.3% |
| Colombian | 30 | 1.7% |
| Colville | 16 | 0.9% |
| Cuban | 10 | 0.6% |
| Czech | 4 | 0.2% |
| Danish | 10 | 0.6% |
| Dutch | 28 | 1.6% |
| English | 120 | 6.9% |
| European | 40 | 2.3% |
| French | 10 | 0.6% |
| French American Indian | 41 | 2.3% |
| German | 244 | 13.9% |
| Hungarian | 4 | 0.2% |
| Irish | 184 | 10.5% |
| Italian | 87 | 5.0% |
| Jamaican | 55 | 3.1% |
| Mexican | 536 | 30.6% |
| Norwegian | 18 | 1.0% |
| Pennsylvania German | 2 | 0.1% |
| Polish | 8 | 0.5% |
| Puerto Rican | 9 | 0.5% |
| Russian | 11 | 0.6% |
| Scandinavian | 89 | 5.1% |
| Scotch-Irish | 5 | 0.3% |
| Scottish | 69 | 3.9% |
| Sioux | 8 | 0.5% |
| South African | 10 | 0.6% |
| South American | 30 | 1.7% |
| Subsaharan African | 16 | 0.9% |
| Swedish | 27 | 1.5% |
| Tlingit-Haida | 23 | 1.3% |
| Welsh | 21 | 1.2% | View All 38 Rows |
Immigrants in Oroville
The most numerous immigrant groups reported in Oroville came from Latin America (263 | 15.0%), Central America (178 | 10.2%), Mexico (174 | 9.9%), Caribbean (55 | 3.1%), and Jamaica (55 | 3.1%), together accounting for 41.4% of all Oroville residents.
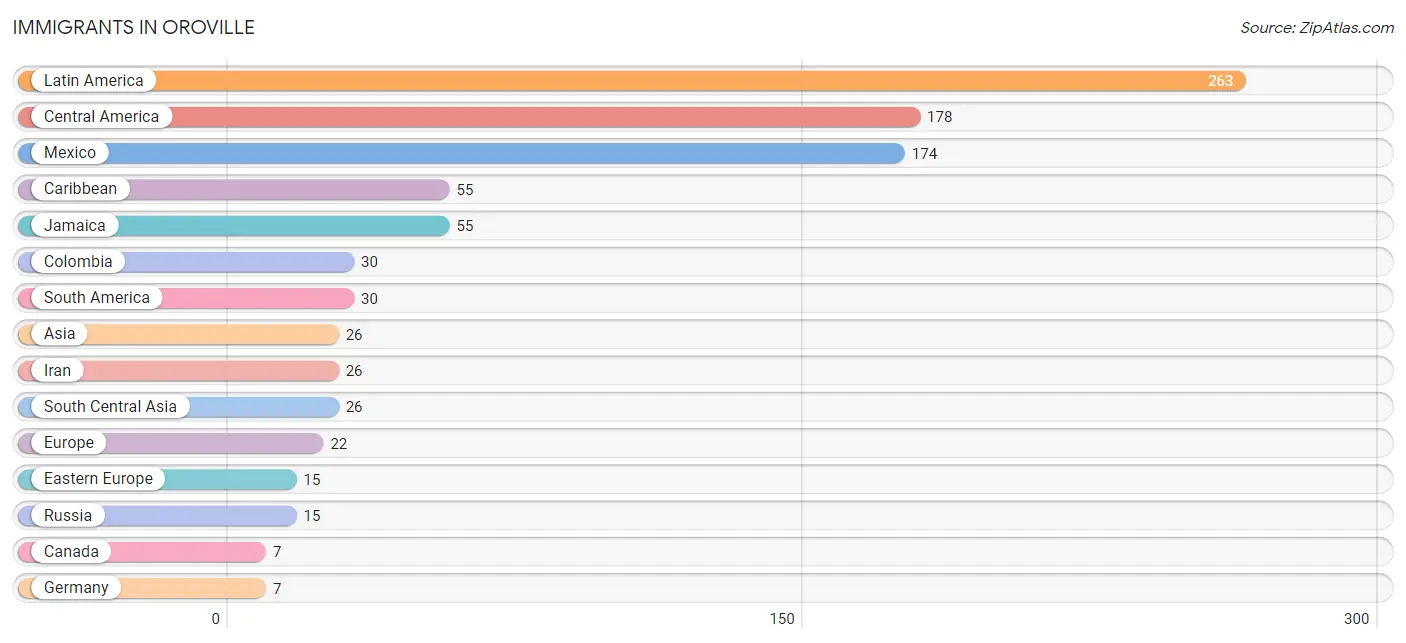
| Immigration Origin | # Population | % Population |
| Asia | 26 | 1.5% |
| Canada | 7 | 0.4% |
| Caribbean | 55 | 3.1% |
| Central America | 178 | 10.2% |
| Colombia | 30 | 1.7% |
| Eastern Europe | 15 | 0.9% |
| Europe | 22 | 1.3% |
| Germany | 7 | 0.4% |
| Guatemala | 4 | 0.2% |
| Iran | 26 | 1.5% |
| Jamaica | 55 | 3.1% |
| Latin America | 263 | 15.0% |
| Mexico | 174 | 9.9% |
| Russia | 15 | 0.9% |
| South America | 30 | 1.7% |
| South Central Asia | 26 | 1.5% |
| Western Europe | 7 | 0.4% | View All 17 Rows |
Sex and Age in Oroville
Sex and Age in Oroville
The most populous age groups in Oroville are Under 5 Years (108 | 12.2%) for men and 25 to 29 Years (92 | 10.6%) for women.
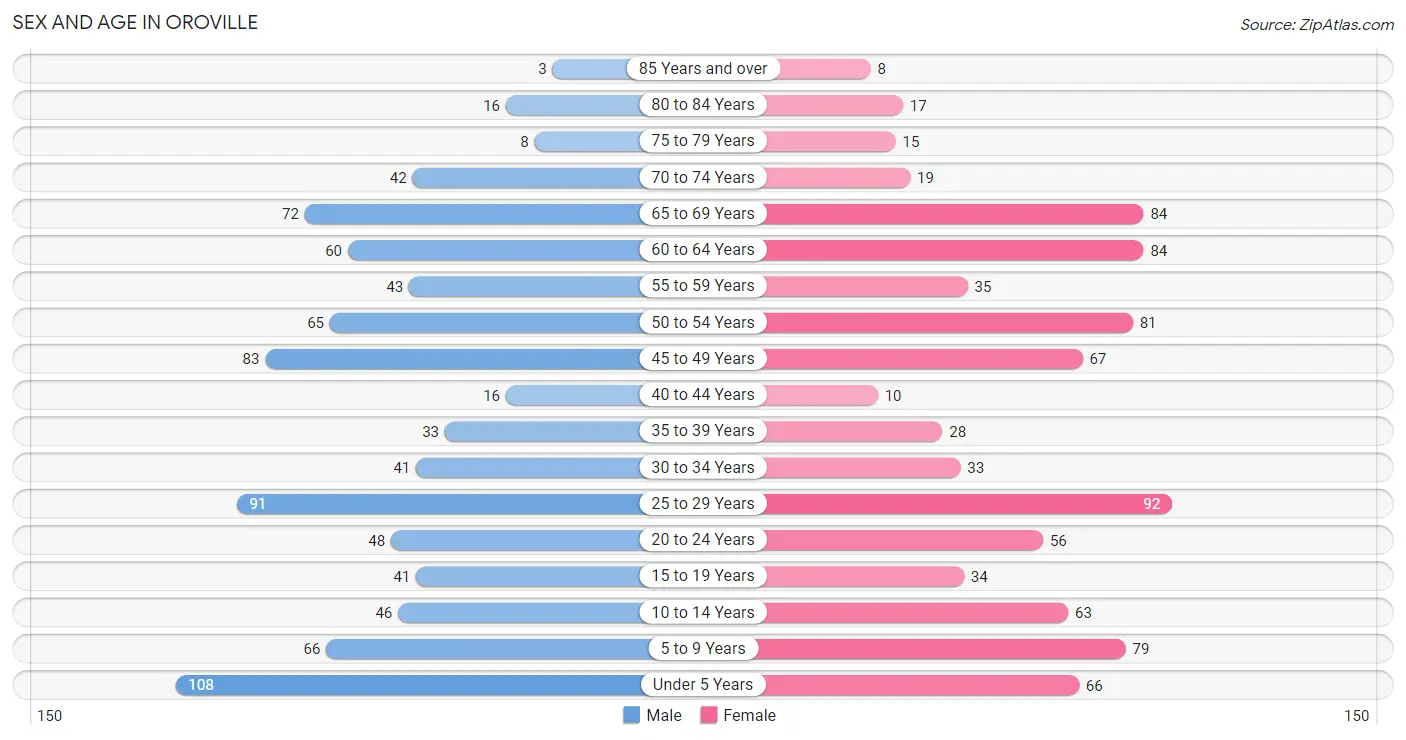
| Age Bracket | Male | Female |
| Under 5 Years | 108 (12.2%) | 66 (7.6%) |
| 5 to 9 Years | 66 (7.5%) | 79 (9.1%) |
| 10 to 14 Years | 46 (5.2%) | 63 (7.2%) |
| 15 to 19 Years | 41 (4.6%) | 34 (3.9%) |
| 20 to 24 Years | 48 (5.4%) | 56 (6.4%) |
| 25 to 29 Years | 91 (10.3%) | 92 (10.6%) |
| 30 to 34 Years | 41 (4.6%) | 33 (3.8%) |
| 35 to 39 Years | 33 (3.7%) | 28 (3.2%) |
| 40 to 44 Years | 16 (1.8%) | 10 (1.1%) |
| 45 to 49 Years | 83 (9.4%) | 67 (7.7%) |
| 50 to 54 Years | 65 (7.4%) | 81 (9.3%) |
| 55 to 59 Years | 43 (4.9%) | 35 (4.0%) |
| 60 to 64 Years | 60 (6.8%) | 84 (9.6%) |
| 65 to 69 Years | 72 (8.2%) | 84 (9.6%) |
| 70 to 74 Years | 42 (4.8%) | 19 (2.2%) |
| 75 to 79 Years | 8 (0.9%) | 15 (1.7%) |
| 80 to 84 Years | 16 (1.8%) | 17 (1.9%) |
| 85 Years and over | 3 (0.3%) | 8 (0.9%) |
| Total | 882 (100.0%) | 871 (100.0%) |
Families and Households in Oroville
Median Family Size in Oroville
The median family size in Oroville is 3.14 persons per family, with single female/mother families (101 | 24.7%) accounting for the largest median family size of 3.52 persons per family. On the other hand, single male/father families (54 | 13.2%) represent the smallest median family size with 1.81 persons per family.
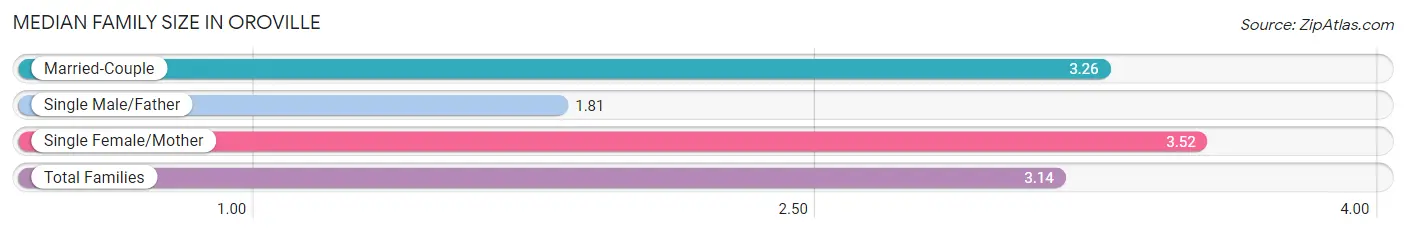
| Family Type | # Families | Family Size |
| Married-Couple | 253 (62.0%) | 3.26 |
| Single Male/Father | 54 (13.2%) | 1.81 |
| Single Female/Mother | 101 (24.7%) | 3.52 |
| Total Families | 408 (100.0%) | 3.14 |
Median Household Size in Oroville
The median household size in Oroville is 2.29 persons per household, with single female/mother households (101 | 13.7%) accounting for the largest median household size of 3.52 persons per household. non-family households (332 | 44.9%) represent the smallest median household size with 1.22 persons per household.
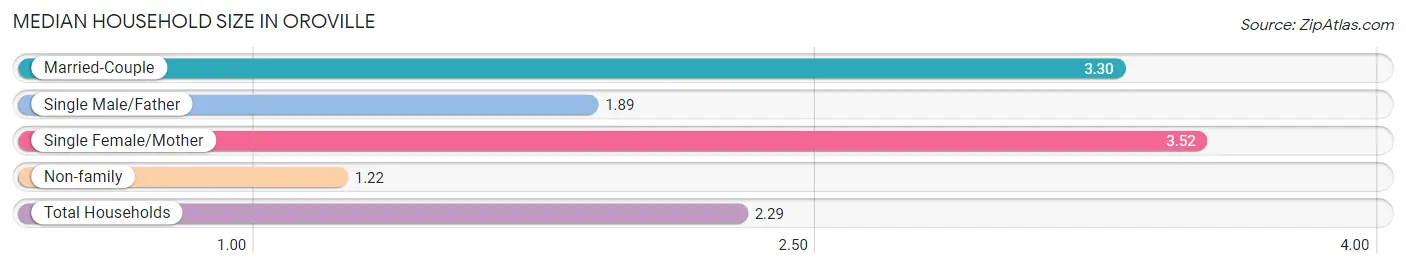
| Household Type | # Households | Household Size |
| Married-Couple | 253 (34.2%) | 3.30 |
| Single Male/Father | 54 (7.3%) | 1.89 |
| Single Female/Mother | 101 (13.7%) | 3.52 |
| Non-family | 332 (44.9%) | 1.22 |
| Total Households | 740 (100.0%) | 2.29 |
Household Size by Marriage Status in Oroville
Out of a total of 740 households in Oroville, 408 (55.1%) are family households, while 332 (44.9%) are nonfamily households. The most numerous type of family households are 2-person households, comprising 213, and the most common type of nonfamily households are 1-person households, comprising 256.
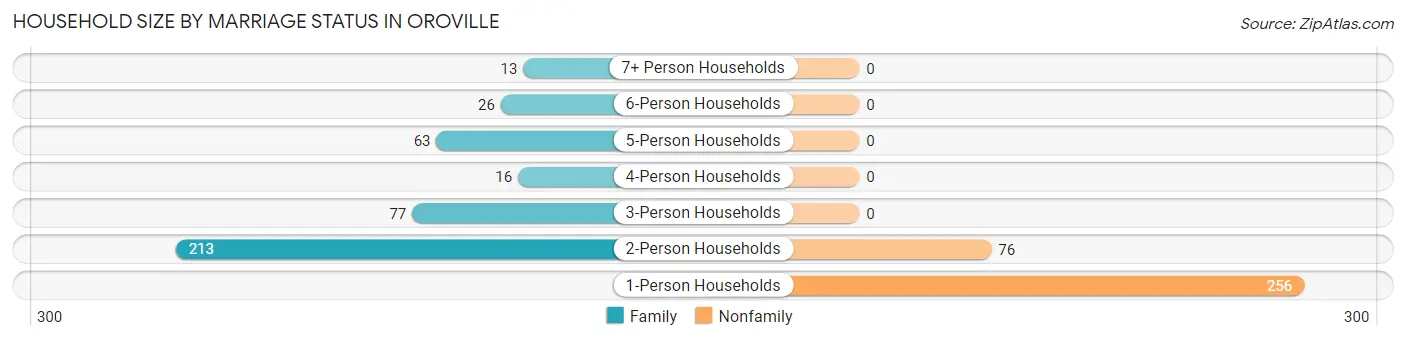
| Household Size | Family Households | Nonfamily Households |
| 1-Person Households | - | 256 (34.6%) |
| 2-Person Households | 213 (28.8%) | 76 (10.3%) |
| 3-Person Households | 77 (10.4%) | 0 (0.0%) |
| 4-Person Households | 16 (2.2%) | 0 (0.0%) |
| 5-Person Households | 63 (8.5%) | 0 (0.0%) |
| 6-Person Households | 26 (3.5%) | 0 (0.0%) |
| 7+ Person Households | 13 (1.8%) | 0 (0.0%) |
| Total | 408 (55.1%) | 332 (44.9%) |
Female Fertility in Oroville
Fertility by Age in Oroville
Average fertility rate in Oroville is 130.0 births per 1,000 women. Women in the age bracket of 20 to 34 years have the highest fertility rate with 232.0 births per 1,000 women. Women in the age bracket of 20 to 34 years acount for 100.0% of all women with births.
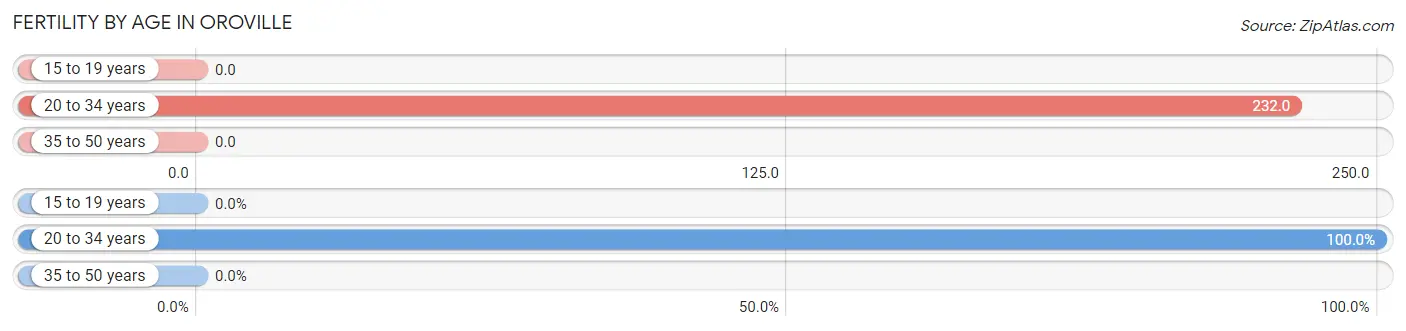
| Age Bracket | Women with Births | Births / 1,000 Women |
| 15 to 19 years | 0 (0.0%) | 0.0 |
| 20 to 34 years | 42 (100.0%) | 232.0 |
| 35 to 50 years | 0 (0.0%) | 0.0 |
| Total | 42 (100.0%) | 130.0 |
Fertility by Age by Marriage Status in Oroville
71.4% of women with births (42) in Oroville are married. The highest percentage of unmarried women with births falls into 20 to 34 years age bracket with 28.6% of them unmarried at the time of birth, while the lowest percentage of unmarried women with births belong to 20 to 34 years age bracket with 28.6% of them unmarried.
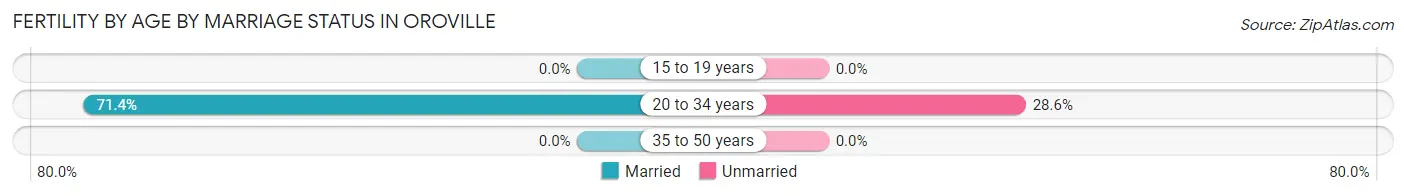
| Age Bracket | Married | Unmarried |
| 15 to 19 years | 0 (0.0%) | 0 (0.0%) |
| 20 to 34 years | 30 (71.4%) | 12 (28.6%) |
| 35 to 50 years | 0 (0.0%) | 0 (0.0%) |
| Total | 30 (71.4%) | 12 (28.6%) |
Fertility by Education in Oroville
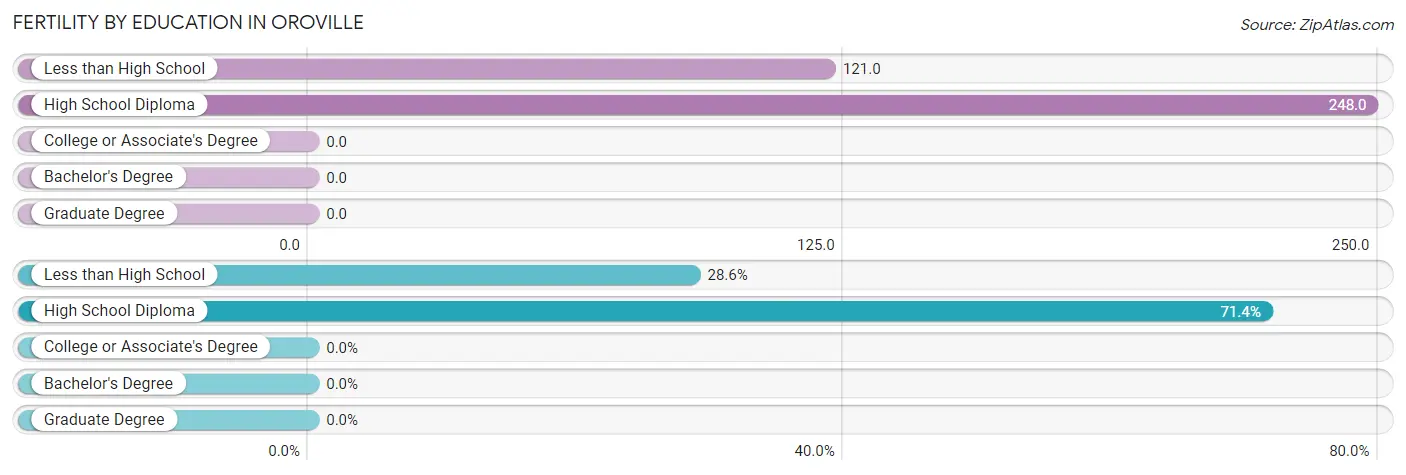
| Educational Attainment | Women with Births | Births / 1,000 Women |
| Less than High School | 12 (28.6%) | 121.0 |
| High School Diploma | 30 (71.4%) | 248.0 |
| College or Associate's Degree | 0 (0.0%) | 0.0 |
| Bachelor's Degree | 0 (0.0%) | 0.0 |
| Graduate Degree | 0 (0.0%) | 0.0 |
| Total | 42 (100.0%) | 130.0 |
Fertility by Education by Marriage Status in Oroville
28.6% of women with births in Oroville are unmarried. Women with the educational attainment of high school diploma are most likely to be married with 100.0% of them married at childbirth, while women with the educational attainment of less than high school are least likely to be married with 100.0% of them unmarried at childbirth.
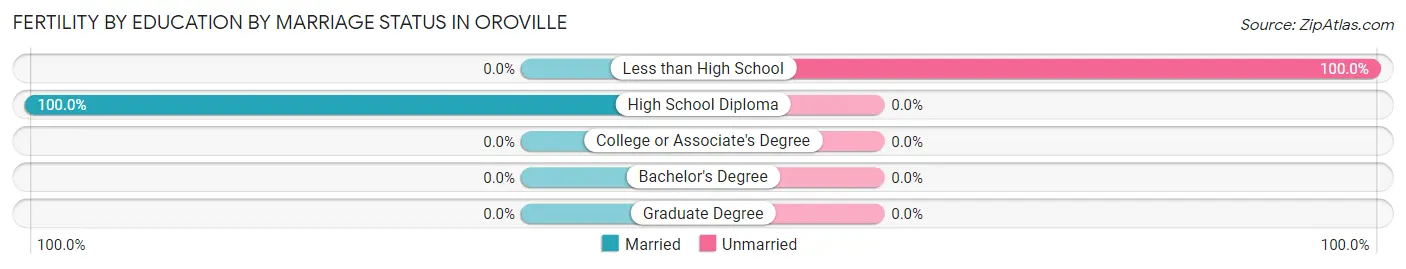
| Educational Attainment | Married | Unmarried |
| Less than High School | 0 (0.0%) | 12 (100.0%) |
| High School Diploma | 30 (100.0%) | 0 (0.0%) |
| College or Associate's Degree | 0 (0.0%) | 0 (0.0%) |
| Bachelor's Degree | 0 (0.0%) | 0 (0.0%) |
| Graduate Degree | 0 (0.0%) | 0 (0.0%) |
| Total | 30 (71.4%) | 12 (28.6%) |
Employment Characteristics in Oroville
Employment by Class of Employer in Oroville
Among the 581 employed individuals in Oroville, private company employees (312 | 53.7%), self-employed (not incorporated) (86 | 14.8%), and self-employed (incorporated) (74 | 12.7%) make up the most common classes of employment.
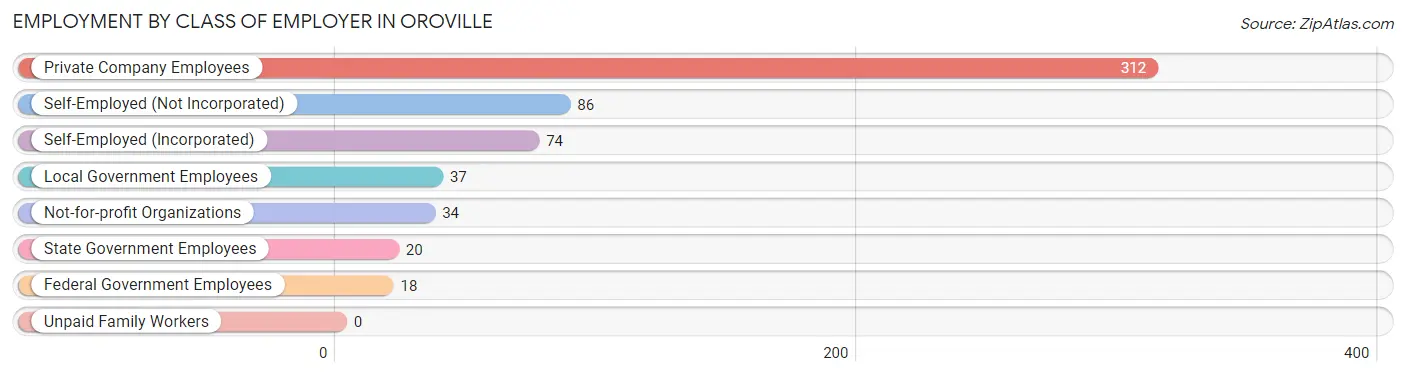
| Employer Class | # Employees | % Employees |
| Private Company Employees | 312 | 53.7% |
| Self-Employed (Incorporated) | 74 | 12.7% |
| Self-Employed (Not Incorporated) | 86 | 14.8% |
| Not-for-profit Organizations | 34 | 5.9% |
| Local Government Employees | 37 | 6.4% |
| State Government Employees | 20 | 3.4% |
| Federal Government Employees | 18 | 3.1% |
| Unpaid Family Workers | 0 | 0.0% |
| Total | 581 | 100.0% |
Employment Status by Age in Oroville
According to the labor force statistics for Oroville, out of the total population over 16 years of age (1,296), 51.9% or 673 individuals are in the labor force, with 7.0% or 47 of them unemployed. The age group with the highest labor force participation rate is 35 to 44 years, with 93.1% or 81 individuals in the labor force. Within the labor force, the 45 to 54 years age range has the highest percentage of unemployed individuals, with 12.6% or 28 of them being unemployed.
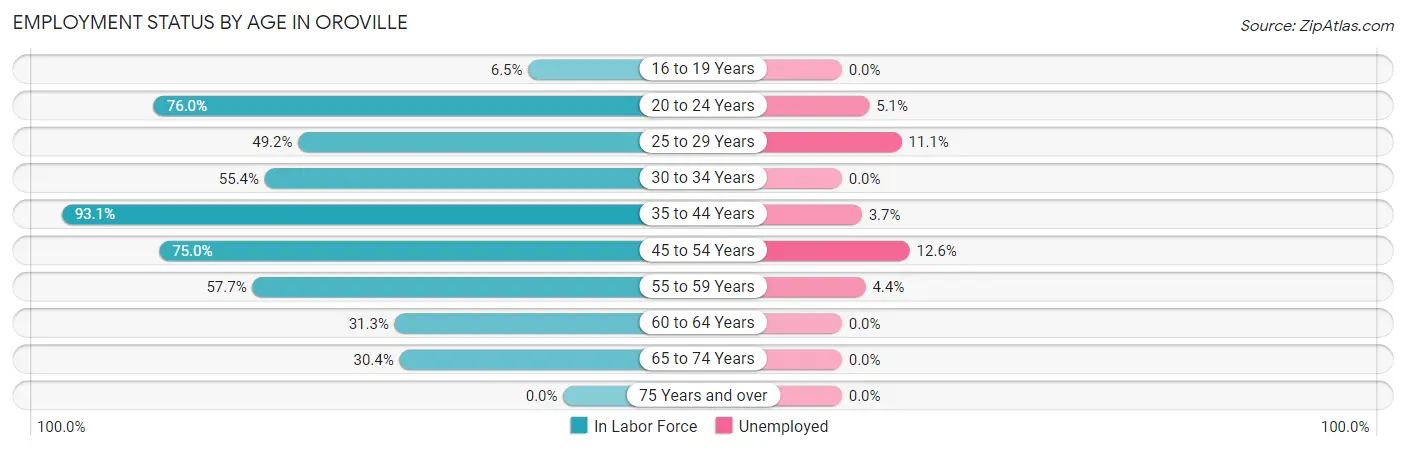
| Age Bracket | In Labor Force | Unemployed |
| 16 to 19 Years | 3 (6.5%) | 0 (0.0%) |
| 20 to 24 Years | 79 (76.0%) | 4 (5.1%) |
| 25 to 29 Years | 90 (49.2%) | 10 (11.1%) |
| 30 to 34 Years | 41 (55.4%) | 0 (0.0%) |
| 35 to 44 Years | 81 (93.1%) | 3 (3.7%) |
| 45 to 54 Years | 222 (75.0%) | 28 (12.6%) |
| 55 to 59 Years | 45 (57.7%) | 2 (4.4%) |
| 60 to 64 Years | 45 (31.3%) | 0 (0.0%) |
| 65 to 74 Years | 66 (30.4%) | 0 (0.0%) |
| 75 Years and over | 0 (0.0%) | 0 (0.0%) |
| Total | 673 (51.9%) | 47 (7.0%) |
Employment Status by Educational Attainment in Oroville
According to labor force statistics for Oroville, 60.8% of individuals (524) out of the total population between 25 and 64 years of age (862) are in the labor force, with 8.2% or 43 of them being unemployed. The group with the highest labor force participation rate are those with the educational attainment of bachelor's degree or higher, with 93.8% or 60 individuals in the labor force. Within the labor force, individuals with college / associate degree education have the highest percentage of unemployment, with 15.4% or 28 of them being unemployed.
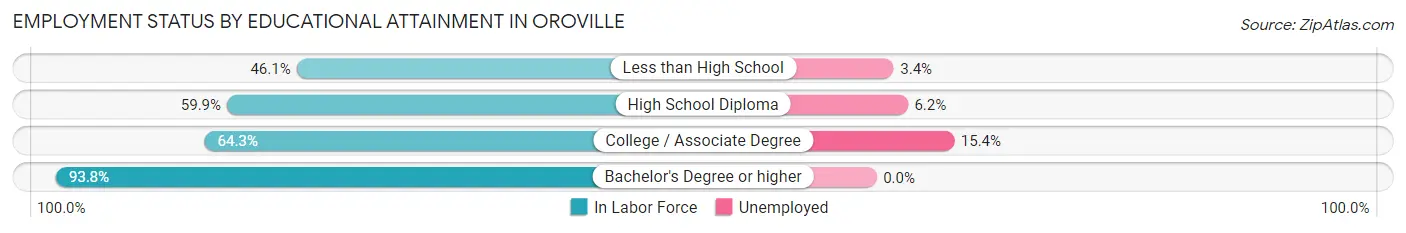
| Educational Attainment | In Labor Force | Unemployed |
| Less than High School | 89 (46.1%) | 7 (3.4%) |
| High School Diploma | 193 (59.9%) | 20 (6.2%) |
| College / Associate Degree | 182 (64.3%) | 44 (15.4%) |
| Bachelor's Degree or higher | 60 (93.8%) | 0 (0.0%) |
| Total | 524 (60.8%) | 71 (8.2%) |
Employment Occupations by Sex in Oroville
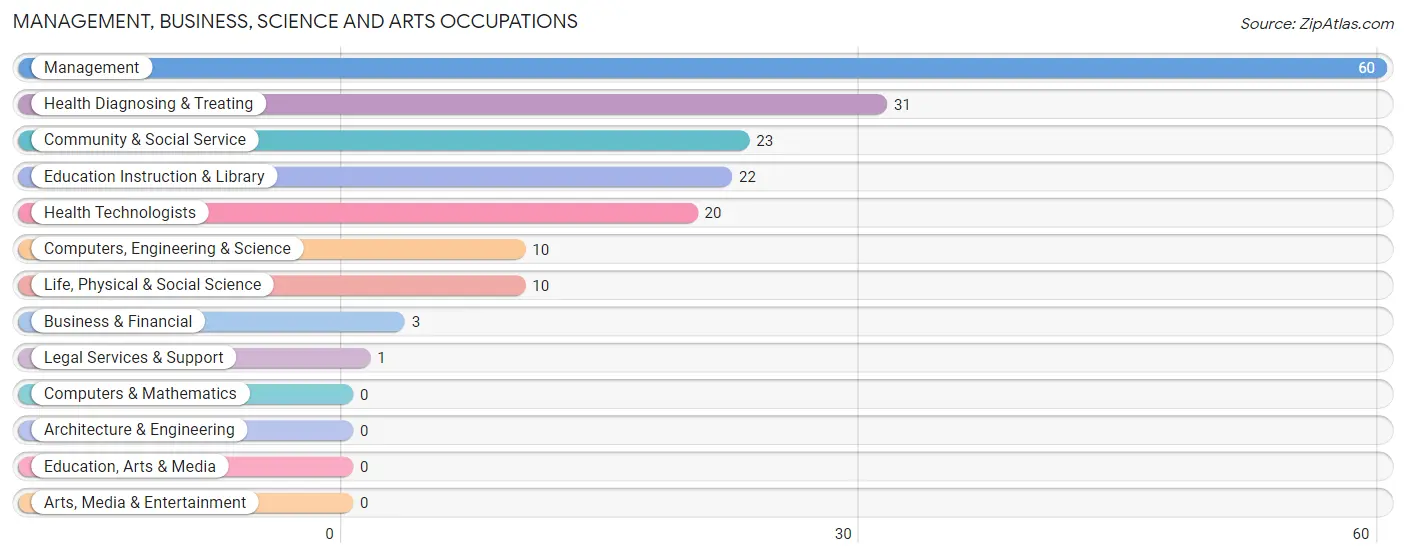
Management, Business, Science and Arts Occupations
The most common Management, Business, Science and Arts occupations in Oroville are Management (60 | 9.6%), Health Diagnosing & Treating (31 | 5.0%), Community & Social Service (23 | 3.7%), Education Instruction & Library (22 | 3.5%), and Health Technologists (20 | 3.2%).
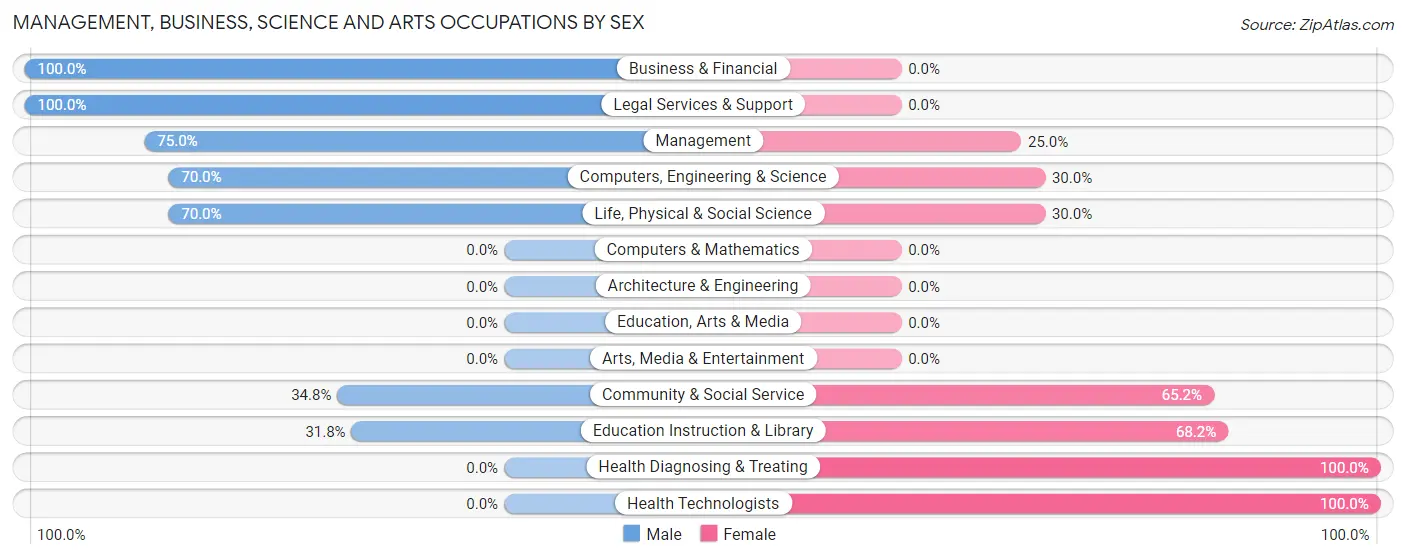
Management, Business, Science and Arts Occupations by Sex
Within the Management, Business, Science and Arts occupations in Oroville, the most male-oriented occupations are Business & Financial (100.0%), Legal Services & Support (100.0%), and Management (75.0%), while the most female-oriented occupations are Health Diagnosing & Treating (100.0%), Health Technologists (100.0%), and Education Instruction & Library (68.2%).
| Occupation | Male | Female |
| Management | 45 (75.0%) | 15 (25.0%) |
| Business & Financial | 3 (100.0%) | 0 (0.0%) |
| Computers, Engineering & Science | 7 (70.0%) | 3 (30.0%) |
| Computers & Mathematics | 0 (0.0%) | 0 (0.0%) |
| Architecture & Engineering | 0 (0.0%) | 0 (0.0%) |
| Life, Physical & Social Science | 7 (70.0%) | 3 (30.0%) |
| Community & Social Service | 8 (34.8%) | 15 (65.2%) |
| Education, Arts & Media | 0 (0.0%) | 0 (0.0%) |
| Legal Services & Support | 1 (100.0%) | 0 (0.0%) |
| Education Instruction & Library | 7 (31.8%) | 15 (68.2%) |
| Arts, Media & Entertainment | 0 (0.0%) | 0 (0.0%) |
| Health Diagnosing & Treating | 0 (0.0%) | 31 (100.0%) |
| Health Technologists | 0 (0.0%) | 20 (100.0%) |
| Total (Category) | 63 (49.6%) | 64 (50.4%) |
| Total (Overall) | 366 (58.6%) | 259 (41.4%) |
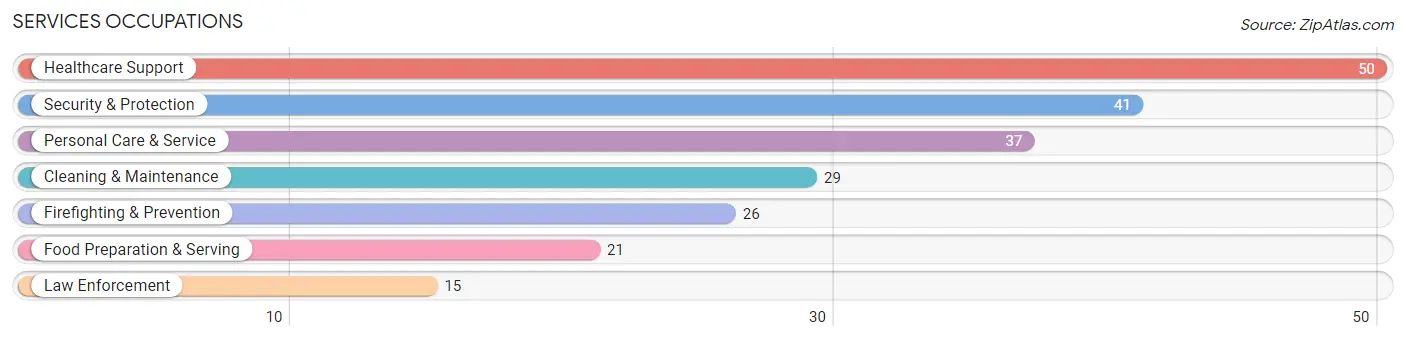
Services Occupations
The most common Services occupations in Oroville are Healthcare Support (50 | 8.0%), Security & Protection (41 | 6.6%), Personal Care & Service (37 | 5.9%), Cleaning & Maintenance (29 | 4.6%), and Firefighting & Prevention (26 | 4.2%).
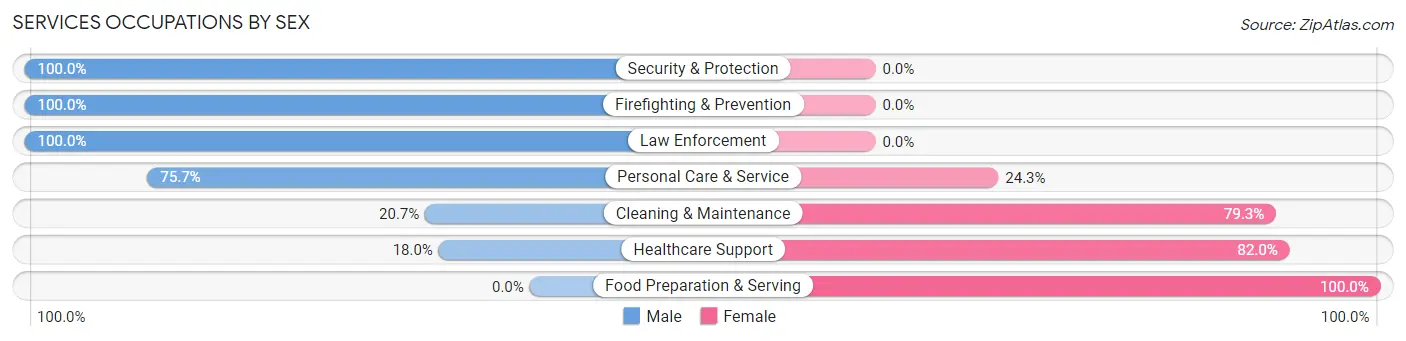
Services Occupations by Sex
Within the Services occupations in Oroville, the most male-oriented occupations are Security & Protection (100.0%), Firefighting & Prevention (100.0%), and Law Enforcement (100.0%), while the most female-oriented occupations are Food Preparation & Serving (100.0%), Healthcare Support (82.0%), and Cleaning & Maintenance (79.3%).
| Occupation | Male | Female |
| Healthcare Support | 9 (18.0%) | 41 (82.0%) |
| Security & Protection | 41 (100.0%) | 0 (0.0%) |
| Firefighting & Prevention | 26 (100.0%) | 0 (0.0%) |
| Law Enforcement | 15 (100.0%) | 0 (0.0%) |
| Food Preparation & Serving | 0 (0.0%) | 21 (100.0%) |
| Cleaning & Maintenance | 6 (20.7%) | 23 (79.3%) |
| Personal Care & Service | 28 (75.7%) | 9 (24.3%) |
| Total (Category) | 84 (47.2%) | 94 (52.8%) |
| Total (Overall) | 366 (58.6%) | 259 (41.4%) |
Sales and Office Occupations
The most common Sales and Office occupations in Oroville are Office & Administration (45 | 7.2%), and Sales & Related (44 | 7.0%).

Sales and Office Occupations by Sex

| Occupation | Male | Female |
| Sales & Related | 28 (63.6%) | 16 (36.4%) |
| Office & Administration | 0 (0.0%) | 45 (100.0%) |
| Total (Category) | 28 (31.5%) | 61 (68.5%) |
| Total (Overall) | 366 (58.6%) | 259 (41.4%) |
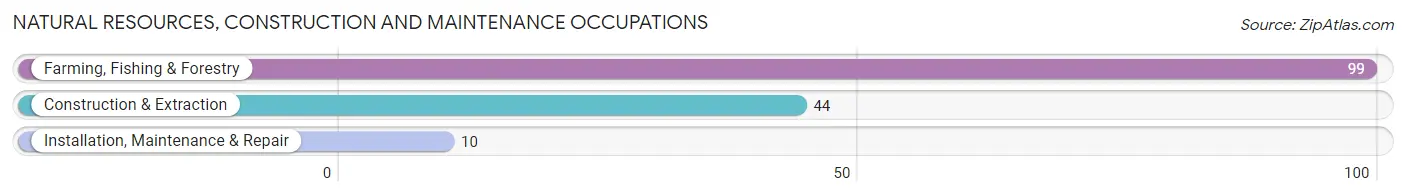
Natural Resources, Construction and Maintenance Occupations
The most common Natural Resources, Construction and Maintenance occupations in Oroville are Farming, Fishing & Forestry (99 | 15.8%), Construction & Extraction (44 | 7.0%), and Installation, Maintenance & Repair (10 | 1.6%).
Natural Resources, Construction and Maintenance Occupations by Sex
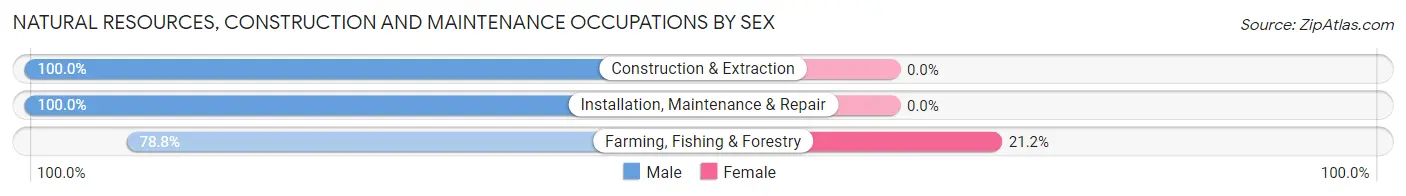
| Occupation | Male | Female |
| Farming, Fishing & Forestry | 78 (78.8%) | 21 (21.2%) |
| Construction & Extraction | 44 (100.0%) | 0 (0.0%) |
| Installation, Maintenance & Repair | 10 (100.0%) | 0 (0.0%) |
| Total (Category) | 132 (86.3%) | 21 (13.7%) |
| Total (Overall) | 366 (58.6%) | 259 (41.4%) |
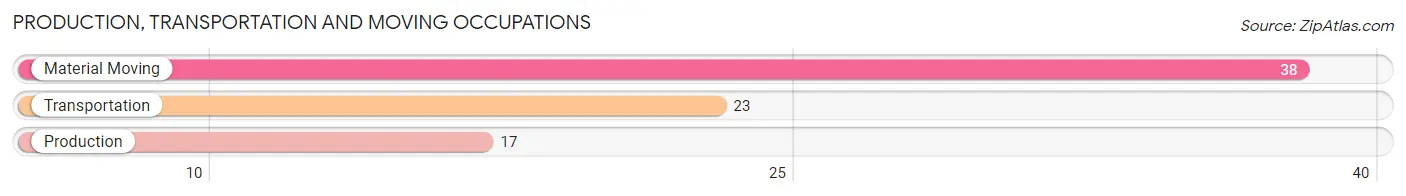
Production, Transportation and Moving Occupations
The most common Production, Transportation and Moving occupations in Oroville are Material Moving (38 | 6.1%), Transportation (23 | 3.7%), and Production (17 | 2.7%).
Production, Transportation and Moving Occupations by Sex
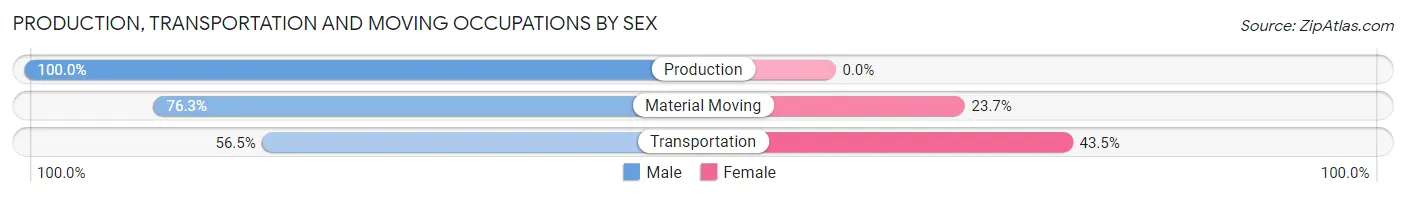
| Occupation | Male | Female |
| Production | 17 (100.0%) | 0 (0.0%) |
| Transportation | 13 (56.5%) | 10 (43.5%) |
| Material Moving | 29 (76.3%) | 9 (23.7%) |
| Total (Category) | 59 (75.6%) | 19 (24.4%) |
| Total (Overall) | 366 (58.6%) | 259 (41.4%) |
Employment Industries by Sex in Oroville
Employment Industries in Oroville
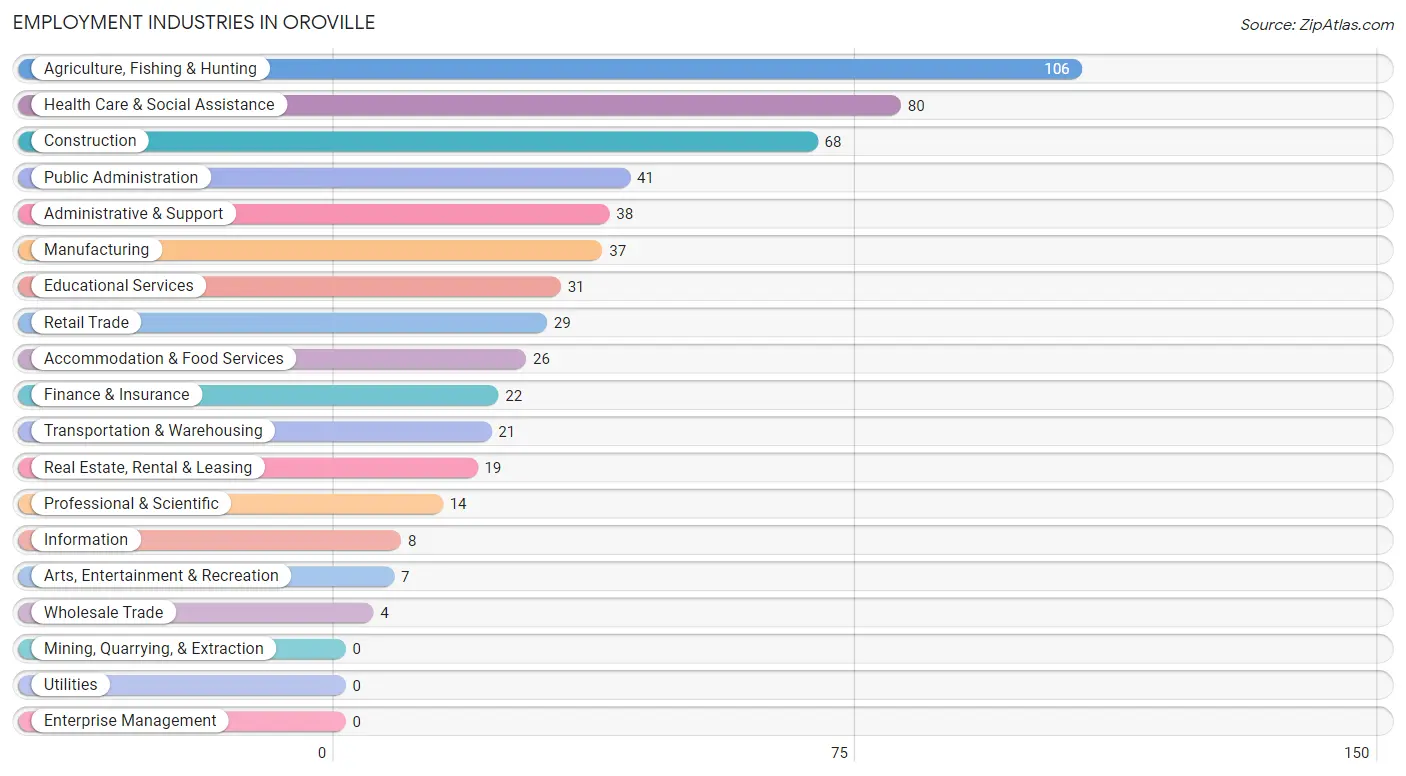
The major employment industries in Oroville include Agriculture, Fishing & Hunting (106 | 17.0%), Health Care & Social Assistance (80 | 12.8%), Construction (68 | 10.9%), Public Administration (41 | 6.6%), and Administrative & Support (38 | 6.1%).
Employment Industries by Sex in Oroville
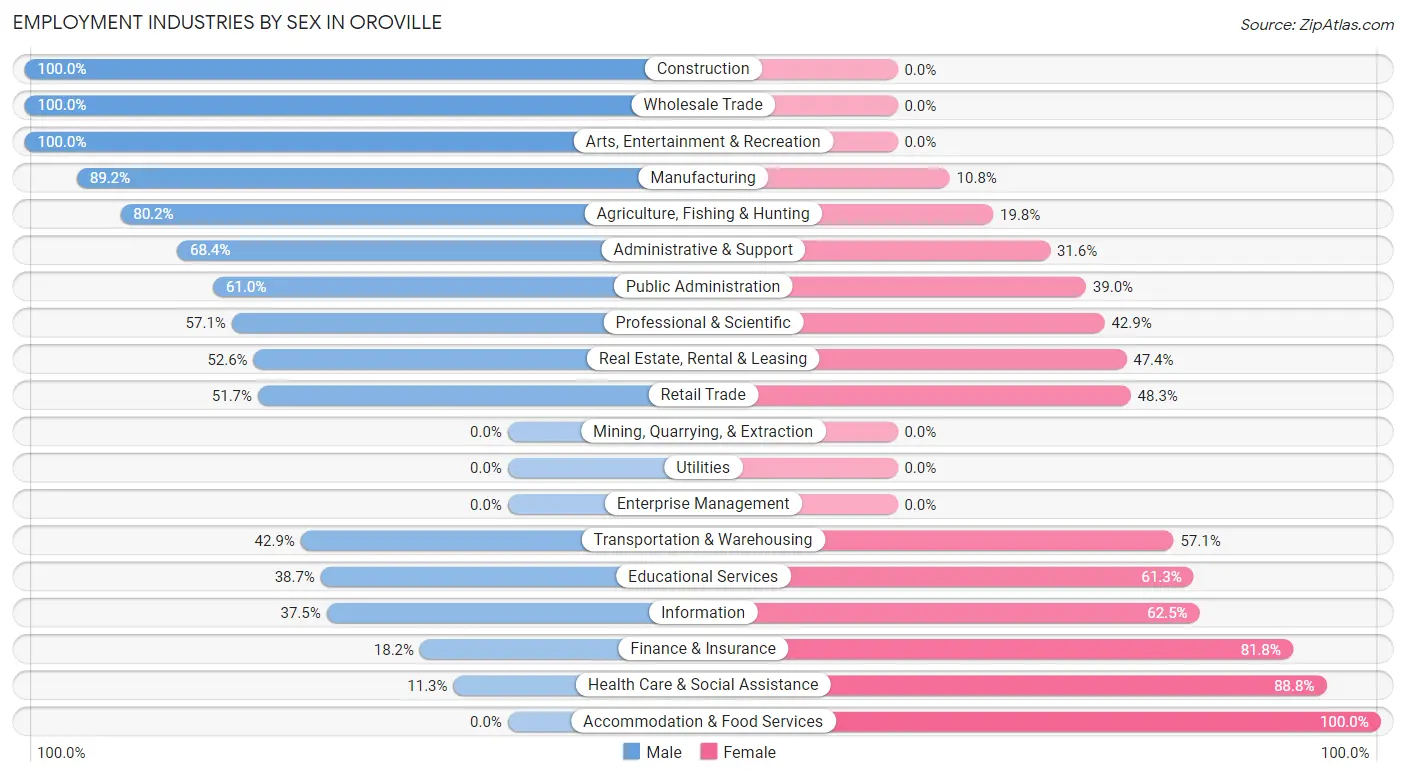
The Oroville industries that see more men than women are Construction (100.0%), Wholesale Trade (100.0%), and Arts, Entertainment & Recreation (100.0%), whereas the industries that tend to have a higher number of women are Accommodation & Food Services (100.0%), Health Care & Social Assistance (88.7%), and Finance & Insurance (81.8%).
| Industry | Male | Female |
| Agriculture, Fishing & Hunting | 85 (80.2%) | 21 (19.8%) |
| Mining, Quarrying, & Extraction | 0 (0.0%) | 0 (0.0%) |
| Construction | 68 (100.0%) | 0 (0.0%) |
| Manufacturing | 33 (89.2%) | 4 (10.8%) |
| Wholesale Trade | 4 (100.0%) | 0 (0.0%) |
| Retail Trade | 15 (51.7%) | 14 (48.3%) |
| Transportation & Warehousing | 9 (42.9%) | 12 (57.1%) |
| Utilities | 0 (0.0%) | 0 (0.0%) |
| Information | 3 (37.5%) | 5 (62.5%) |
| Finance & Insurance | 4 (18.2%) | 18 (81.8%) |
| Real Estate, Rental & Leasing | 10 (52.6%) | 9 (47.4%) |
| Professional & Scientific | 8 (57.1%) | 6 (42.9%) |
| Enterprise Management | 0 (0.0%) | 0 (0.0%) |
| Administrative & Support | 26 (68.4%) | 12 (31.6%) |
| Educational Services | 12 (38.7%) | 19 (61.3%) |
| Health Care & Social Assistance | 9 (11.3%) | 71 (88.7%) |
| Arts, Entertainment & Recreation | 7 (100.0%) | 0 (0.0%) |
| Accommodation & Food Services | 0 (0.0%) | 26 (100.0%) |
| Public Administration | 25 (61.0%) | 16 (39.0%) |
| Total | 366 (58.6%) | 259 (41.4%) |
Education in Oroville
School Enrollment in Oroville
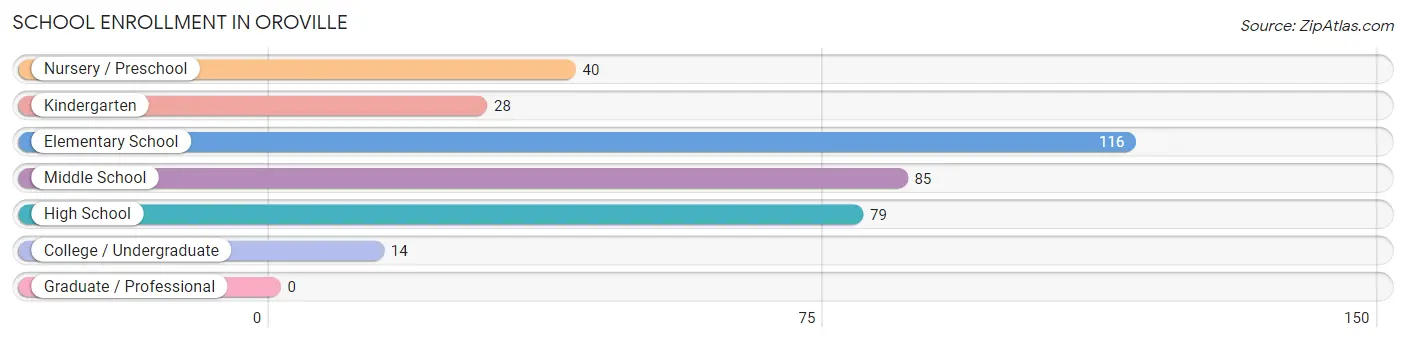
The most common levels of schooling among the 362 students in Oroville are elementary school (116 | 32.0%), middle school (85 | 23.5%), and high school (79 | 21.8%).
| School Level | # Students | % Students |
| Nursery / Preschool | 40 | 11.1% |
| Kindergarten | 28 | 7.7% |
| Elementary School | 116 | 32.0% |
| Middle School | 85 | 23.5% |
| High School | 79 | 21.8% |
| College / Undergraduate | 14 | 3.9% |
| Graduate / Professional | 0 | 0.0% |
| Total | 362 | 100.0% |
School Enrollment by Age by Funding Source in Oroville
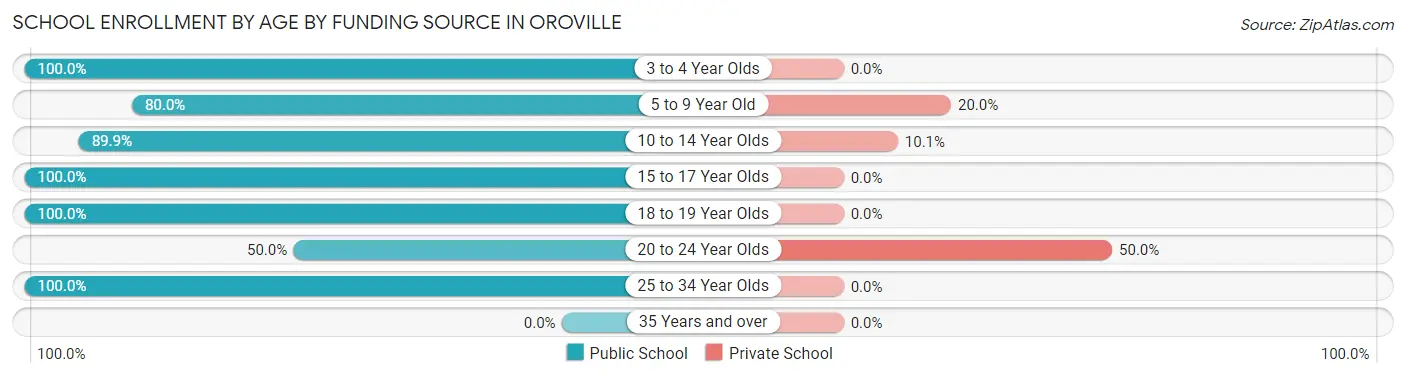
Out of a total of 362 students who are enrolled in schools in Oroville, 44 (12.2%) attend a private institution, while the remaining 318 (87.8%) are enrolled in public schools. The age group of 20 to 24 year olds has the highest likelihood of being enrolled in private schools, with 4 (50.0% in the age bracket) enrolled. Conversely, the age group of 3 to 4 year olds has the lowest likelihood of being enrolled in a private school, with 25 (100.0% in the age bracket) attending a public institution.
| Age Bracket | Public School | Private School |
| 3 to 4 Year Olds | 25 (100.0%) | 0 (0.0%) |
| 5 to 9 Year Old | 116 (80.0%) | 29 (20.0%) |
| 10 to 14 Year Olds | 98 (89.9%) | 11 (10.1%) |
| 15 to 17 Year Olds | 62 (100.0%) | 0 (0.0%) |
| 18 to 19 Year Olds | 7 (100.0%) | 0 (0.0%) |
| 20 to 24 Year Olds | 4 (50.0%) | 4 (50.0%) |
| 25 to 34 Year Olds | 6 (100.0%) | 0 (0.0%) |
| 35 Years and over | 0 (0.0%) | 0 (0.0%) |
| Total | 318 (87.8%) | 44 (12.2%) |
Educational Attainment by Field of Study in Oroville
Arts & humanities (31 | 29.8%), education (16 | 15.4%), psychology (15 | 14.4%), business (10 | 9.6%), and science & technology (9 | 8.6%) are the most common fields of study among 104 individuals in Oroville who have obtained a bachelor's degree or higher.
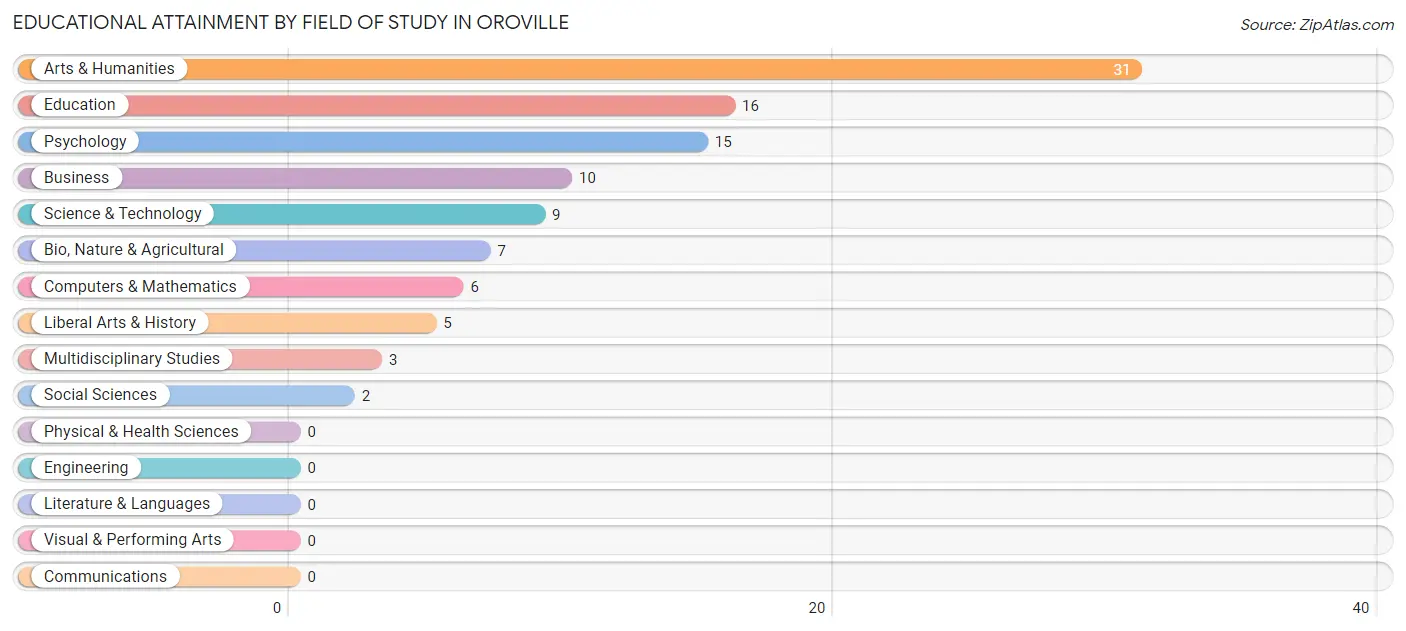
| Field of Study | # Graduates | % Graduates |
| Computers & Mathematics | 6 | 5.8% |
| Bio, Nature & Agricultural | 7 | 6.7% |
| Physical & Health Sciences | 0 | 0.0% |
| Psychology | 15 | 14.4% |
| Social Sciences | 2 | 1.9% |
| Engineering | 0 | 0.0% |
| Multidisciplinary Studies | 3 | 2.9% |
| Science & Technology | 9 | 8.6% |
| Business | 10 | 9.6% |
| Education | 16 | 15.4% |
| Literature & Languages | 0 | 0.0% |
| Liberal Arts & History | 5 | 4.8% |
| Visual & Performing Arts | 0 | 0.0% |
| Communications | 0 | 0.0% |
| Arts & Humanities | 31 | 29.8% |
| Total | 104 | 100.0% |
Transportation & Commute in Oroville
Vehicle Availability by Sex in Oroville
The most prevalent vehicle ownership categories in Oroville are males with 2 vehicles (105, accounting for 36.1%) and females with 2 vehicles (93, making up 44.7%).
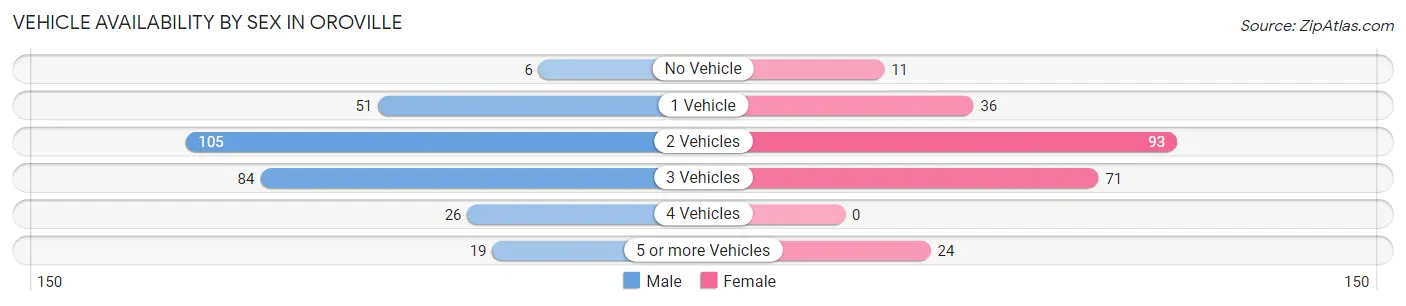
| Vehicles Available | Male | Female |
| No Vehicle | 6 (2.1%) | 11 (4.7%) |
| 1 Vehicle | 51 (17.5%) | 36 (15.3%) |
| 2 Vehicles | 105 (36.1%) | 93 (39.6%) |
| 3 Vehicles | 84 (28.9%) | 71 (30.2%) |
| 4 Vehicles | 26 (8.9%) | 0 (0.0%) |
| 5 or more Vehicles | 19 (6.5%) | 24 (10.2%) |
| Total | 291 (100.0%) | 235 (100.0%) |
Commute Time in Oroville
The most frequently occuring commute durations in Oroville are less than 5 minutes (191 commuters, 36.6%), 5 to 9 minutes (122 commuters, 23.4%), and 20 to 24 minutes (112 commuters, 21.5%).
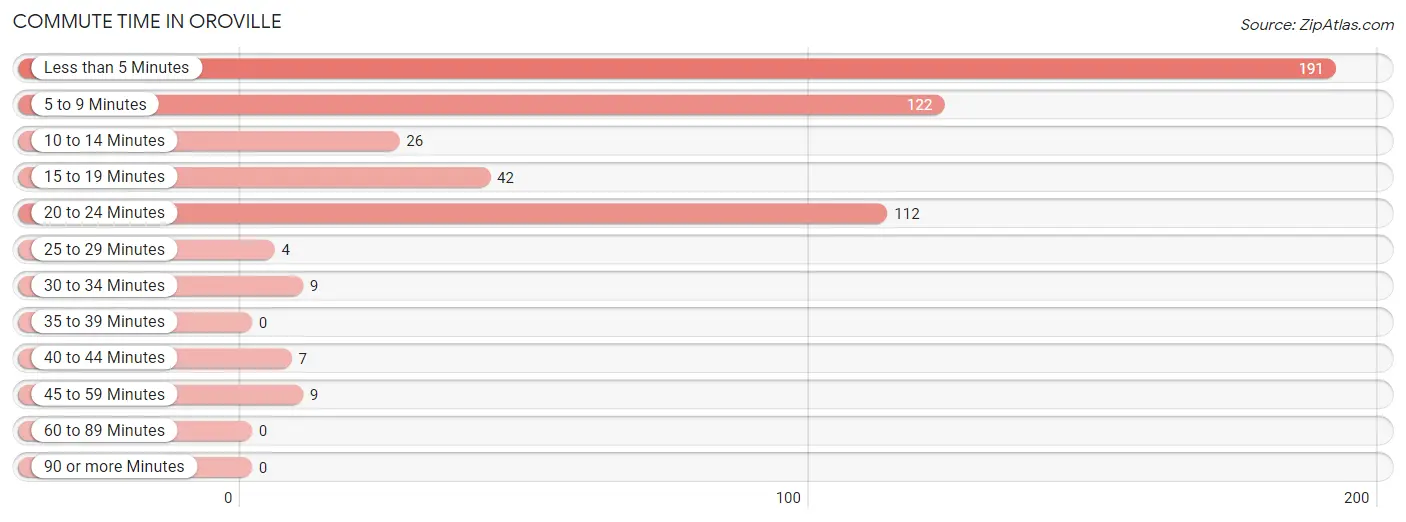
| Commute Time | # Commuters | % Commuters |
| Less than 5 Minutes | 191 | 36.6% |
| 5 to 9 Minutes | 122 | 23.4% |
| 10 to 14 Minutes | 26 | 5.0% |
| 15 to 19 Minutes | 42 | 8.1% |
| 20 to 24 Minutes | 112 | 21.5% |
| 25 to 29 Minutes | 4 | 0.8% |
| 30 to 34 Minutes | 9 | 1.7% |
| 35 to 39 Minutes | 0 | 0.0% |
| 40 to 44 Minutes | 7 | 1.3% |
| 45 to 59 Minutes | 9 | 1.7% |
| 60 to 89 Minutes | 0 | 0.0% |
| 90 or more Minutes | 0 | 0.0% |
Commute Time by Sex in Oroville
The most common commute times in Oroville are less than 5 minutes (102 commuters, 31.8%) for males and less than 5 minutes (89 commuters, 44.3%) for females.
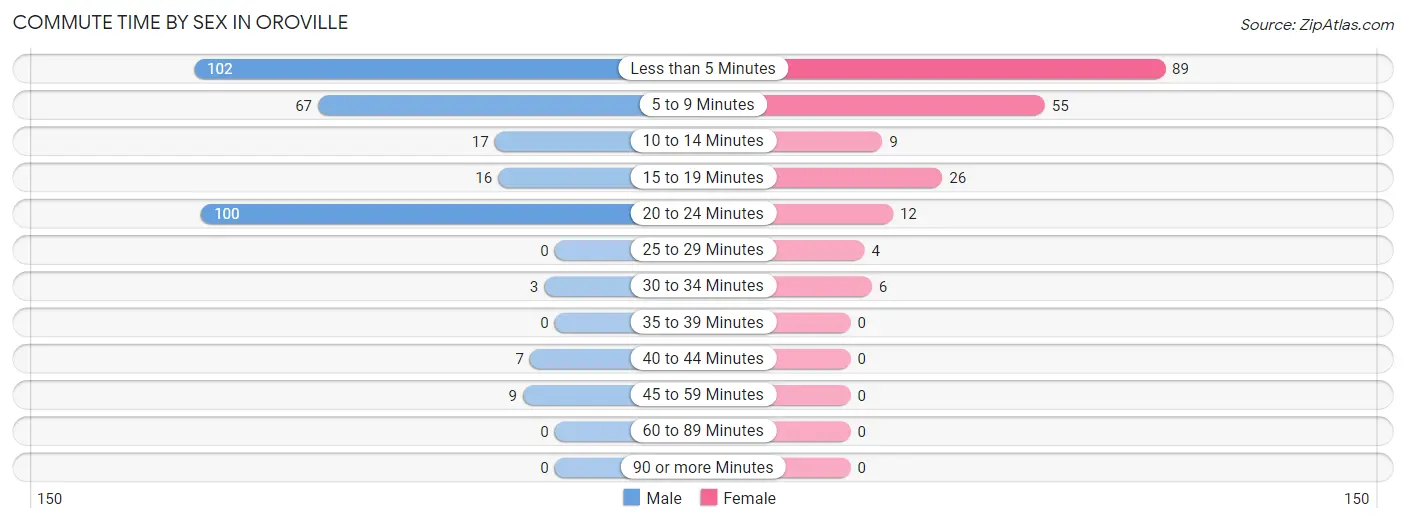
| Commute Time | Male | Female |
| Less than 5 Minutes | 102 (31.8%) | 89 (44.3%) |
| 5 to 9 Minutes | 67 (20.9%) | 55 (27.4%) |
| 10 to 14 Minutes | 17 (5.3%) | 9 (4.5%) |
| 15 to 19 Minutes | 16 (5.0%) | 26 (12.9%) |
| 20 to 24 Minutes | 100 (31.1%) | 12 (6.0%) |
| 25 to 29 Minutes | 0 (0.0%) | 4 (2.0%) |
| 30 to 34 Minutes | 3 (0.9%) | 6 (3.0%) |
| 35 to 39 Minutes | 0 (0.0%) | 0 (0.0%) |
| 40 to 44 Minutes | 7 (2.2%) | 0 (0.0%) |
| 45 to 59 Minutes | 9 (2.8%) | 0 (0.0%) |
| 60 to 89 Minutes | 0 (0.0%) | 0 (0.0%) |
| 90 or more Minutes | 0 (0.0%) | 0 (0.0%) |
Time of Departure to Work by Sex in Oroville
The most frequent times of departure to work in Oroville are 7:00 AM to 7:29 AM (109, 34.0%) for males and 9:00 AM to 9:59 AM (37, 18.4%) for females.
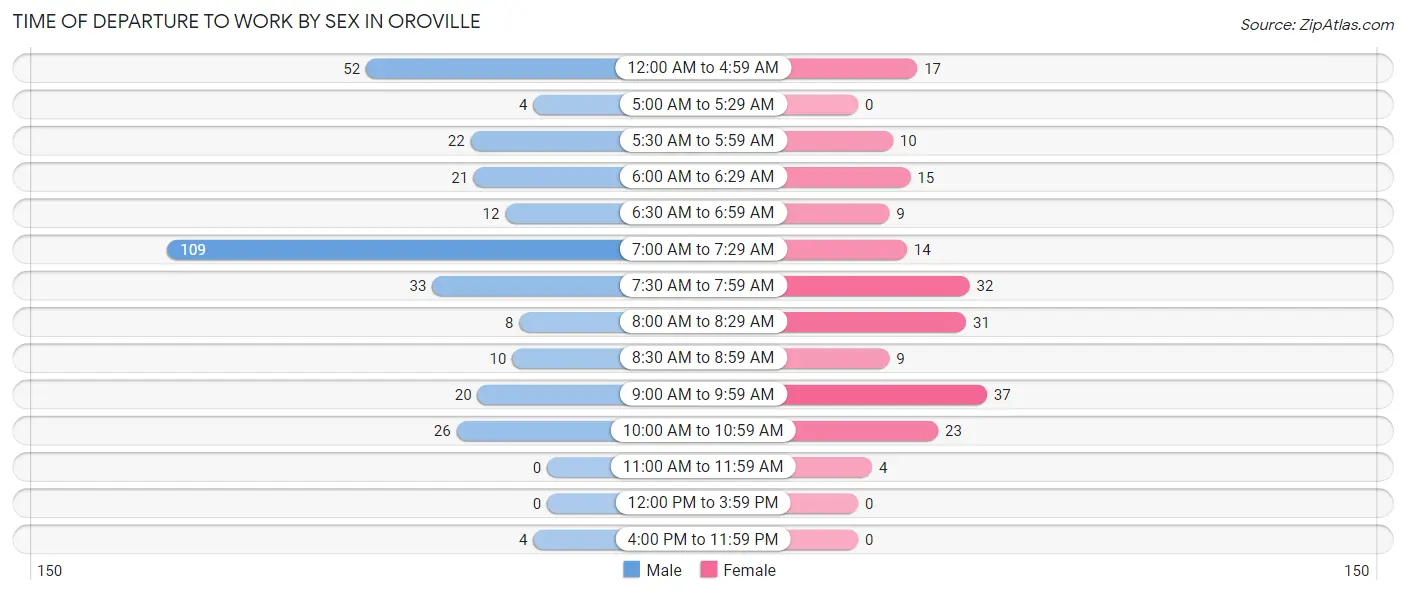
| Time of Departure | Male | Female |
| 12:00 AM to 4:59 AM | 52 (16.2%) | 17 (8.5%) |
| 5:00 AM to 5:29 AM | 4 (1.3%) | 0 (0.0%) |
| 5:30 AM to 5:59 AM | 22 (6.9%) | 10 (5.0%) |
| 6:00 AM to 6:29 AM | 21 (6.5%) | 15 (7.5%) |
| 6:30 AM to 6:59 AM | 12 (3.7%) | 9 (4.5%) |
| 7:00 AM to 7:29 AM | 109 (34.0%) | 14 (7.0%) |
| 7:30 AM to 7:59 AM | 33 (10.3%) | 32 (15.9%) |
| 8:00 AM to 8:29 AM | 8 (2.5%) | 31 (15.4%) |
| 8:30 AM to 8:59 AM | 10 (3.1%) | 9 (4.5%) |
| 9:00 AM to 9:59 AM | 20 (6.2%) | 37 (18.4%) |
| 10:00 AM to 10:59 AM | 26 (8.1%) | 23 (11.4%) |
| 11:00 AM to 11:59 AM | 0 (0.0%) | 4 (2.0%) |
| 12:00 PM to 3:59 PM | 0 (0.0%) | 0 (0.0%) |
| 4:00 PM to 11:59 PM | 4 (1.3%) | 0 (0.0%) |
| Total | 321 (100.0%) | 201 (100.0%) |
Housing Occupancy in Oroville
Occupancy by Ownership in Oroville
Of the total 740 dwellings in Oroville, owner-occupied units account for 390 (52.7%), while renter-occupied units make up 350 (47.3%).
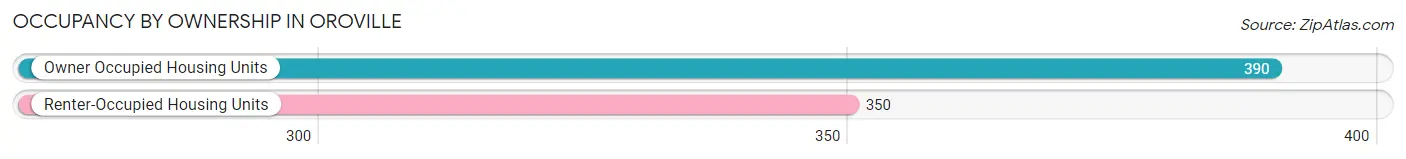
| Occupancy | # Housing Units | % Housing Units |
| Owner Occupied Housing Units | 390 | 52.7% |
| Renter-Occupied Housing Units | 350 | 47.3% |
| Total Occupied Housing Units | 740 | 100.0% |
Occupancy by Household Size in Oroville
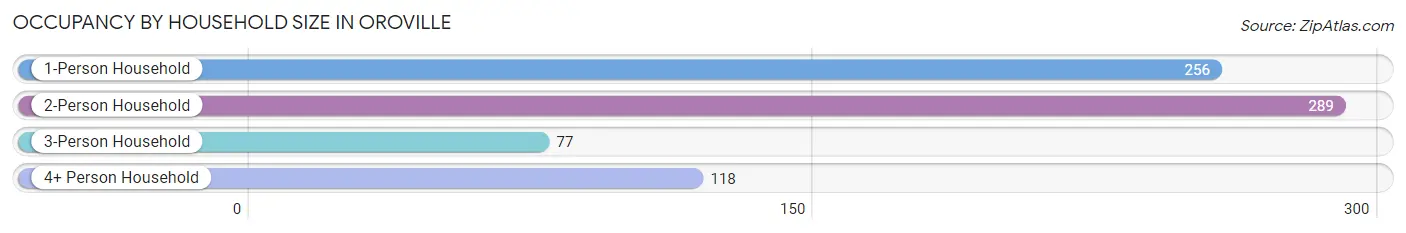
| Household Size | # Housing Units | % Housing Units |
| 1-Person Household | 256 | 34.6% |
| 2-Person Household | 289 | 39.1% |
| 3-Person Household | 77 | 10.4% |
| 4+ Person Household | 118 | 16.0% |
| Total Housing Units | 740 | 100.0% |
Occupancy by Ownership by Household Size in Oroville
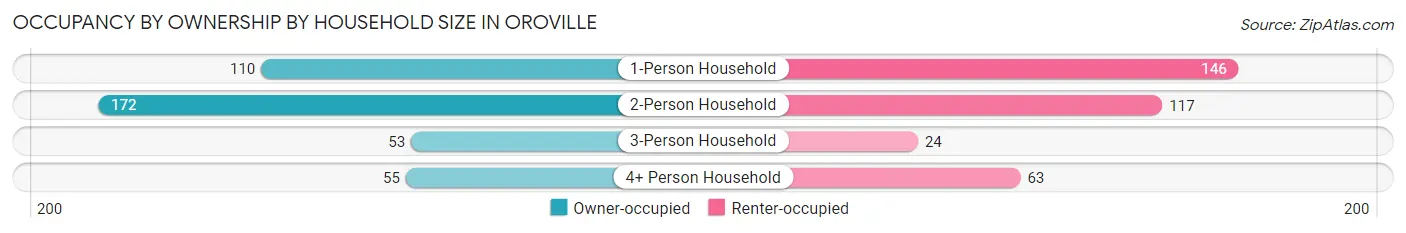
| Household Size | Owner-occupied | Renter-occupied |
| 1-Person Household | 110 (43.0%) | 146 (57.0%) |
| 2-Person Household | 172 (59.5%) | 117 (40.5%) |
| 3-Person Household | 53 (68.8%) | 24 (31.2%) |
| 4+ Person Household | 55 (46.6%) | 63 (53.4%) |
| Total Housing Units | 390 (52.7%) | 350 (47.3%) |
Occupancy by Educational Attainment in Oroville
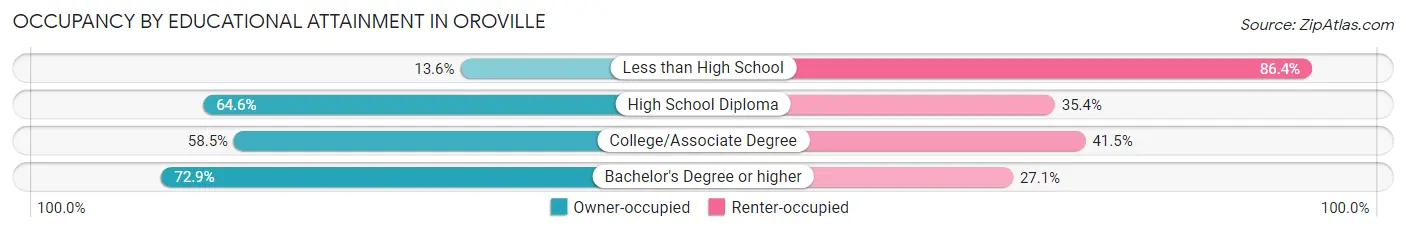
| Household Size | Owner-occupied | Renter-occupied |
| Less than High School | 20 (13.6%) | 127 (86.4%) |
| High School Diploma | 155 (64.6%) | 85 (35.4%) |
| College/Associate Degree | 172 (58.5%) | 122 (41.5%) |
| Bachelor's Degree or higher | 43 (72.9%) | 16 (27.1%) |
Occupancy by Age of Householder in Oroville
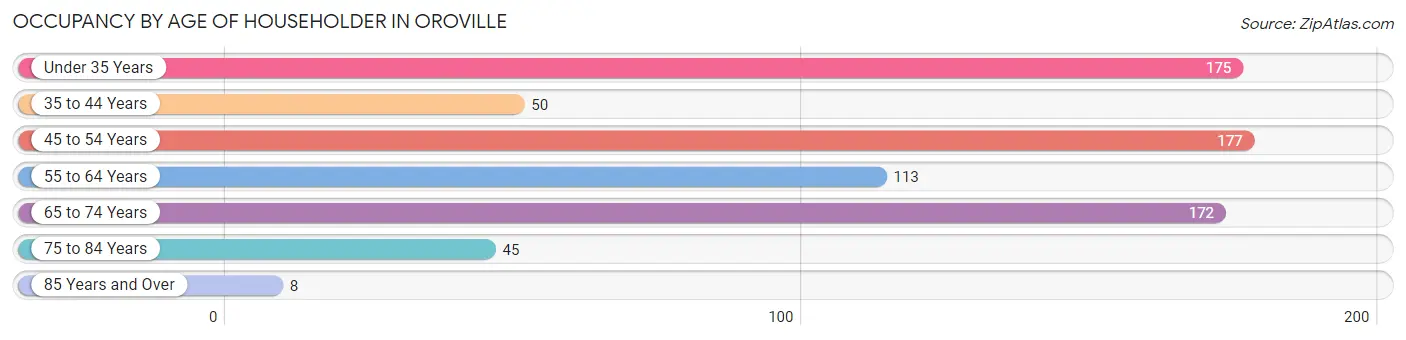
| Age Bracket | # Households | % Households |
| Under 35 Years | 175 | 23.6% |
| 35 to 44 Years | 50 | 6.8% |
| 45 to 54 Years | 177 | 23.9% |
| 55 to 64 Years | 113 | 15.3% |
| 65 to 74 Years | 172 | 23.2% |
| 75 to 84 Years | 45 | 6.1% |
| 85 Years and Over | 8 | 1.1% |
| Total | 740 | 100.0% |
Housing Finances in Oroville
Median Income by Occupancy in Oroville
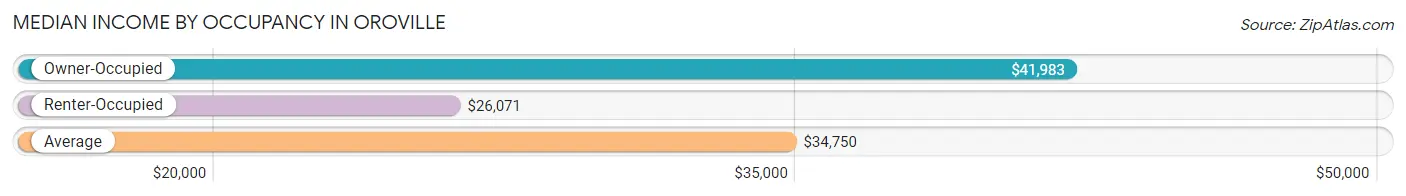
| Occupancy Type | # Households | Median Income |
| Owner-Occupied | 390 (52.7%) | $41,983 |
| Renter-Occupied | 350 (47.3%) | $26,071 |
| Average | 740 (100.0%) | $34,750 |
Occupancy by Householder Income Bracket in Oroville
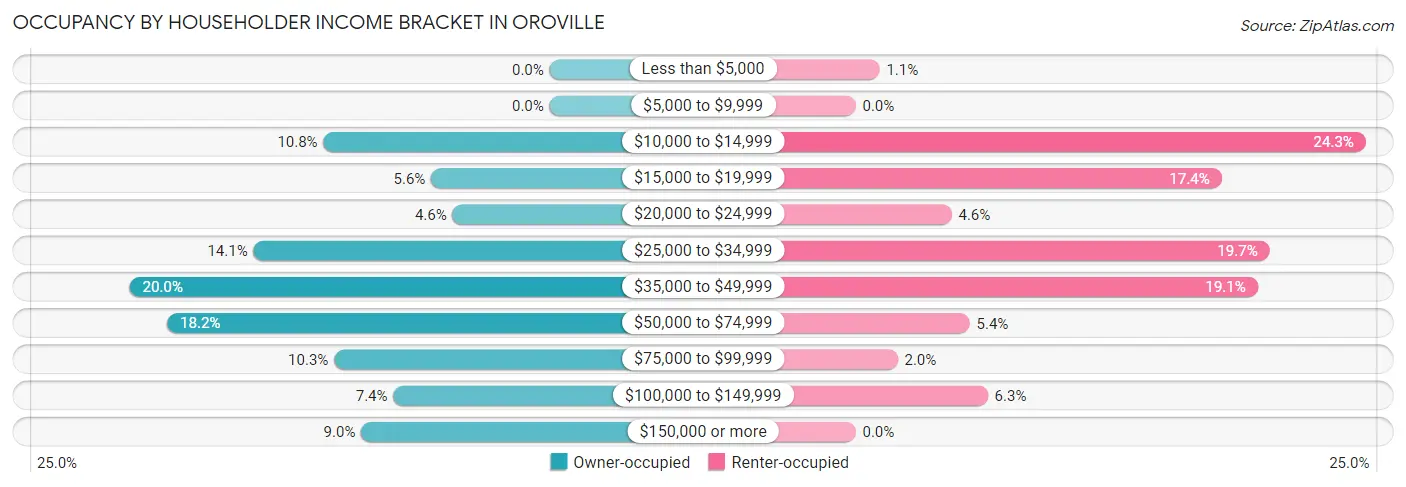
| Income Bracket | Owner-occupied | Renter-occupied |
| Less than $5,000 | 0 (0.0%) | 4 (1.1%) |
| $5,000 to $9,999 | 0 (0.0%) | 0 (0.0%) |
| $10,000 to $14,999 | 42 (10.8%) | 85 (24.3%) |
| $15,000 to $19,999 | 22 (5.6%) | 61 (17.4%) |
| $20,000 to $24,999 | 18 (4.6%) | 16 (4.6%) |
| $25,000 to $34,999 | 55 (14.1%) | 69 (19.7%) |
| $35,000 to $49,999 | 78 (20.0%) | 67 (19.1%) |
| $50,000 to $74,999 | 71 (18.2%) | 19 (5.4%) |
| $75,000 to $99,999 | 40 (10.3%) | 7 (2.0%) |
| $100,000 to $149,999 | 29 (7.4%) | 22 (6.3%) |
| $150,000 or more | 35 (9.0%) | 0 (0.0%) |
| Total | 390 (100.0%) | 350 (100.0%) |
Monthly Housing Cost Tiers in Oroville
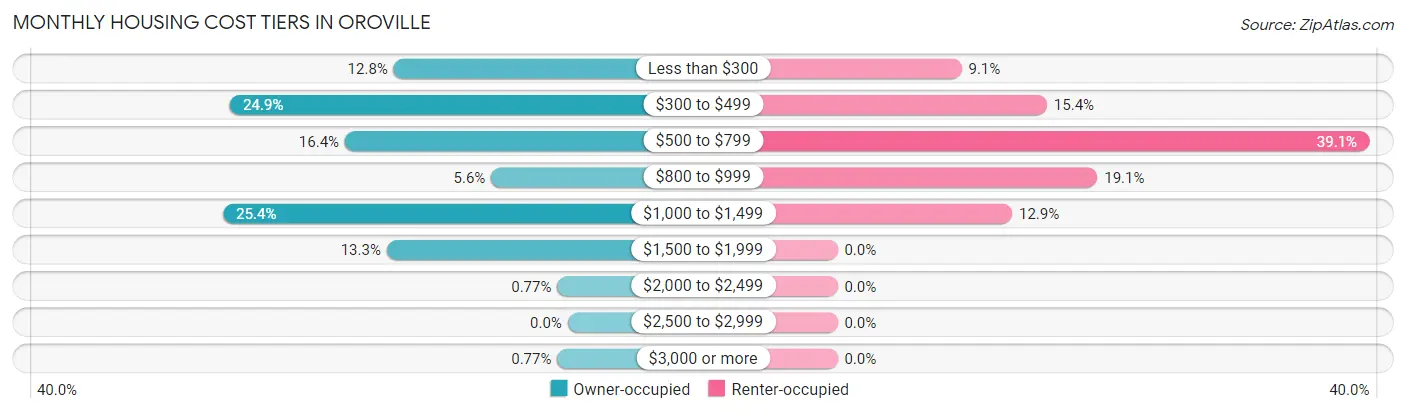
| Monthly Cost | Owner-occupied | Renter-occupied |
| Less than $300 | 50 (12.8%) | 32 (9.1%) |
| $300 to $499 | 97 (24.9%) | 54 (15.4%) |
| $500 to $799 | 64 (16.4%) | 137 (39.1%) |
| $800 to $999 | 22 (5.6%) | 67 (19.1%) |
| $1,000 to $1,499 | 99 (25.4%) | 45 (12.9%) |
| $1,500 to $1,999 | 52 (13.3%) | 0 (0.0%) |
| $2,000 to $2,499 | 3 (0.8%) | 0 (0.0%) |
| $2,500 to $2,999 | 0 (0.0%) | 0 (0.0%) |
| $3,000 or more | 3 (0.8%) | 0 (0.0%) |
| Total | 390 (100.0%) | 350 (100.0%) |
Physical Housing Characteristics in Oroville
Housing Structures in Oroville
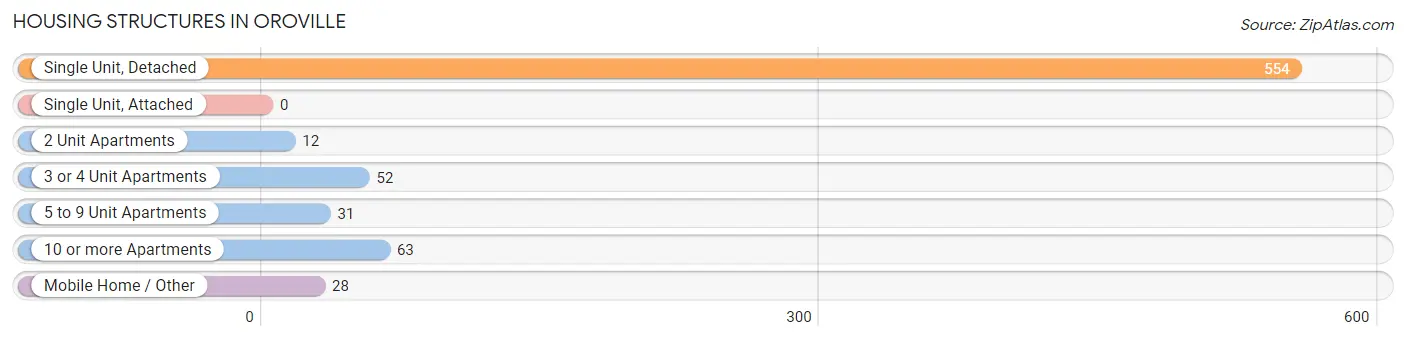
| Structure Type | # Housing Units | % Housing Units |
| Single Unit, Detached | 554 | 74.9% |
| Single Unit, Attached | 0 | 0.0% |
| 2 Unit Apartments | 12 | 1.6% |
| 3 or 4 Unit Apartments | 52 | 7.0% |
| 5 to 9 Unit Apartments | 31 | 4.2% |
| 10 or more Apartments | 63 | 8.5% |
| Mobile Home / Other | 28 | 3.8% |
| Total | 740 | 100.0% |
Housing Structures by Occupancy in Oroville
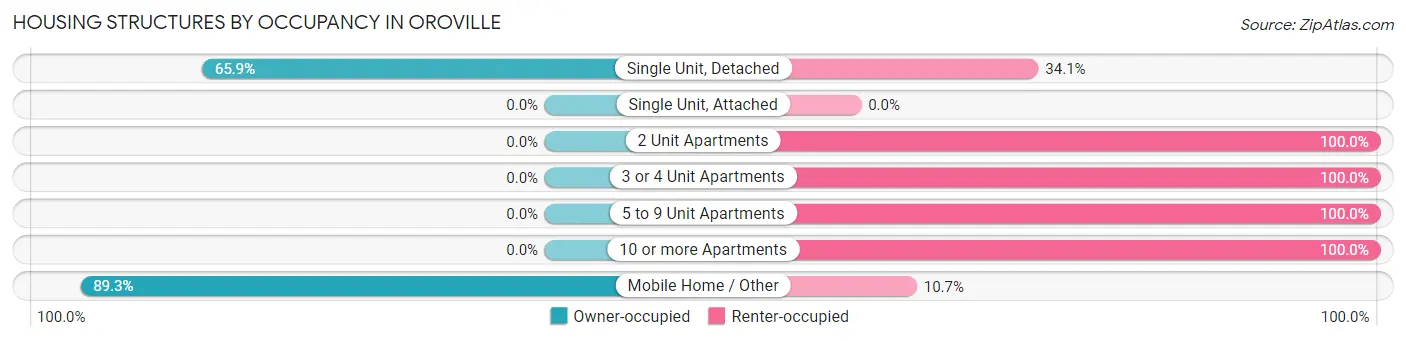
| Structure Type | Owner-occupied | Renter-occupied |
| Single Unit, Detached | 365 (65.9%) | 189 (34.1%) |
| Single Unit, Attached | 0 (0.0%) | 0 (0.0%) |
| 2 Unit Apartments | 0 (0.0%) | 12 (100.0%) |
| 3 or 4 Unit Apartments | 0 (0.0%) | 52 (100.0%) |
| 5 to 9 Unit Apartments | 0 (0.0%) | 31 (100.0%) |
| 10 or more Apartments | 0 (0.0%) | 63 (100.0%) |
| Mobile Home / Other | 25 (89.3%) | 3 (10.7%) |
| Total | 390 (52.7%) | 350 (47.3%) |
Housing Structures by Number of Rooms in Oroville
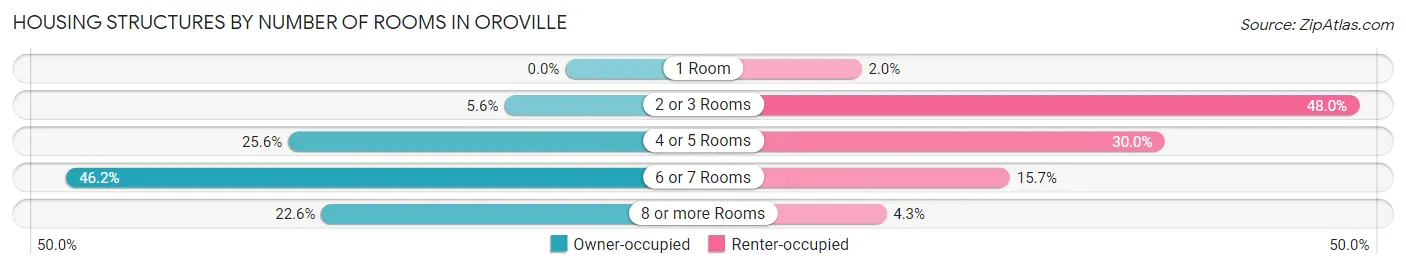
| Number of Rooms | Owner-occupied | Renter-occupied |
| 1 Room | 0 (0.0%) | 7 (2.0%) |
| 2 or 3 Rooms | 22 (5.6%) | 168 (48.0%) |
| 4 or 5 Rooms | 100 (25.6%) | 105 (30.0%) |
| 6 or 7 Rooms | 180 (46.2%) | 55 (15.7%) |
| 8 or more Rooms | 88 (22.6%) | 15 (4.3%) |
| Total | 390 (100.0%) | 350 (100.0%) |
Housing Structure by Heating Type in Oroville
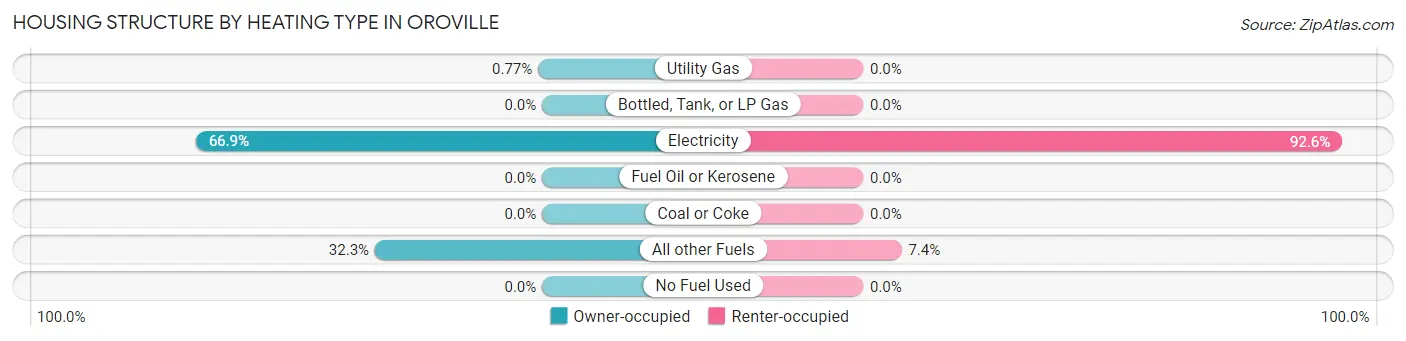
| Heating Type | Owner-occupied | Renter-occupied |
| Utility Gas | 3 (0.8%) | 0 (0.0%) |
| Bottled, Tank, or LP Gas | 0 (0.0%) | 0 (0.0%) |
| Electricity | 261 (66.9%) | 324 (92.6%) |
| Fuel Oil or Kerosene | 0 (0.0%) | 0 (0.0%) |
| Coal or Coke | 0 (0.0%) | 0 (0.0%) |
| All other Fuels | 126 (32.3%) | 26 (7.4%) |
| No Fuel Used | 0 (0.0%) | 0 (0.0%) |
| Total | 390 (100.0%) | 350 (100.0%) |
Household Vehicle Usage in Oroville
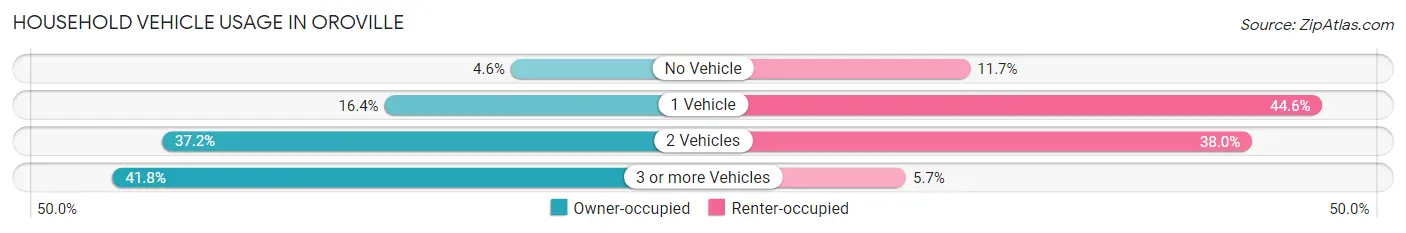
| Vehicles per Household | Owner-occupied | Renter-occupied |
| No Vehicle | 18 (4.6%) | 41 (11.7%) |
| 1 Vehicle | 64 (16.4%) | 156 (44.6%) |
| 2 Vehicles | 145 (37.2%) | 133 (38.0%) |
| 3 or more Vehicles | 163 (41.8%) | 20 (5.7%) |
| Total | 390 (100.0%) | 350 (100.0%) |
Real Estate & Mortgages in Oroville
Real Estate and Mortgage Overview in Oroville
| Characteristic | Without Mortgage | With Mortgage |
| Housing Units | 187 | 203 |
| Median Property Value | $148,200 | $167,200 |
| Median Household Income | $40,529 | $24 |
| Monthly Housing Costs | $409 | $3 |
| Real Estate Taxes | $1,151 | $9 |
Property Value by Mortgage Status in Oroville
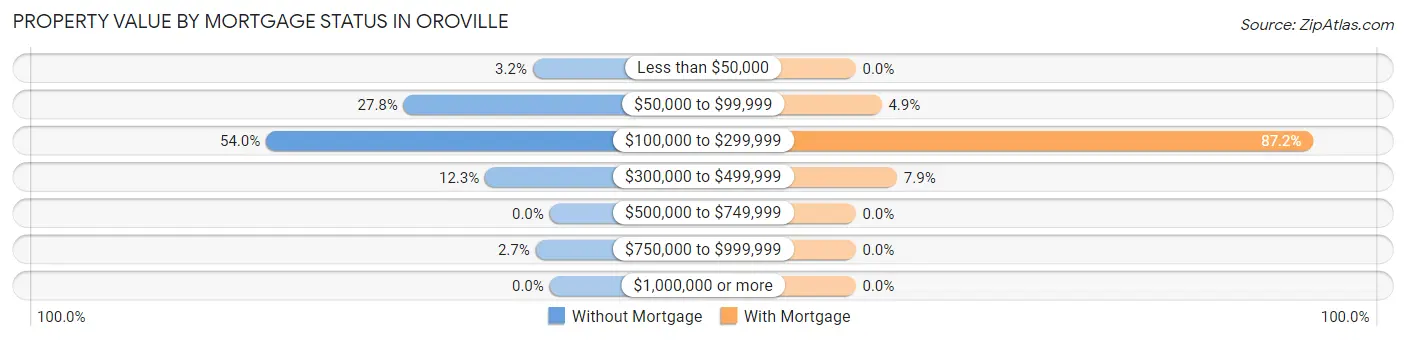
| Property Value | Without Mortgage | With Mortgage |
| Less than $50,000 | 6 (3.2%) | 0 (0.0%) |
| $50,000 to $99,999 | 52 (27.8%) | 10 (4.9%) |
| $100,000 to $299,999 | 101 (54.0%) | 177 (87.2%) |
| $300,000 to $499,999 | 23 (12.3%) | 16 (7.9%) |
| $500,000 to $749,999 | 0 (0.0%) | 0 (0.0%) |
| $750,000 to $999,999 | 5 (2.7%) | 0 (0.0%) |
| $1,000,000 or more | 0 (0.0%) | 0 (0.0%) |
| Total | 187 (100.0%) | 203 (100.0%) |
Household Income by Mortgage Status in Oroville
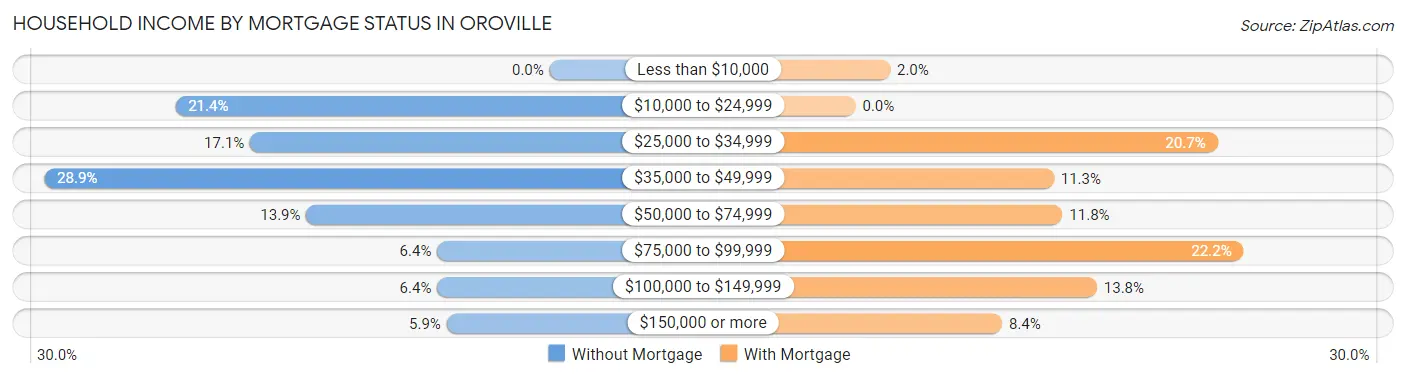
| Household Income | Without Mortgage | With Mortgage |
| Less than $10,000 | 0 (0.0%) | 4 (2.0%) |
| $10,000 to $24,999 | 40 (21.4%) | 0 (0.0%) |
| $25,000 to $34,999 | 32 (17.1%) | 42 (20.7%) |
| $35,000 to $49,999 | 54 (28.9%) | 23 (11.3%) |
| $50,000 to $74,999 | 26 (13.9%) | 24 (11.8%) |
| $75,000 to $99,999 | 12 (6.4%) | 45 (22.2%) |
| $100,000 to $149,999 | 12 (6.4%) | 28 (13.8%) |
| $150,000 or more | 11 (5.9%) | 17 (8.4%) |
| Total | 187 (100.0%) | 203 (100.0%) |
Property Value to Household Income Ratio in Oroville
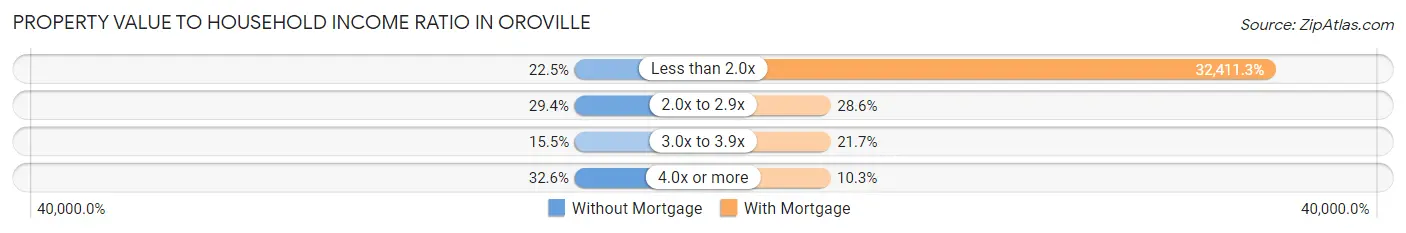
| Value-to-Income Ratio | Without Mortgage | With Mortgage |
| Less than 2.0x | 42 (22.5%) | 65,795 (32,411.3%) |
| 2.0x to 2.9x | 55 (29.4%) | 58 (28.6%) |
| 3.0x to 3.9x | 29 (15.5%) | 44 (21.7%) |
| 4.0x or more | 61 (32.6%) | 21 (10.3%) |
| Total | 187 (100.0%) | 203 (100.0%) |
Real Estate Taxes by Mortgage Status in Oroville
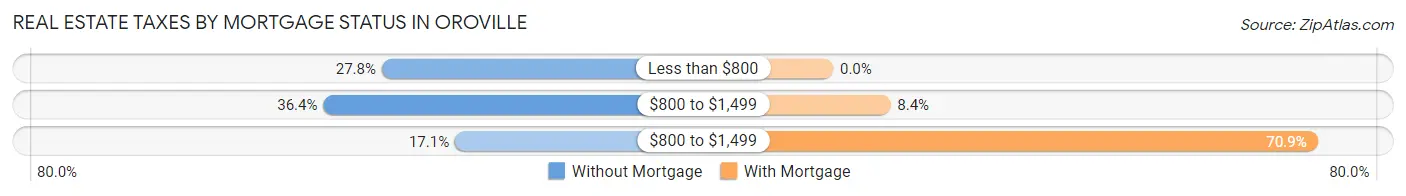
| Property Taxes | Without Mortgage | With Mortgage |
| Less than $800 | 52 (27.8%) | 0 (0.0%) |
| $800 to $1,499 | 68 (36.4%) | 17 (8.4%) |
| $800 to $1,499 | 32 (17.1%) | 144 (70.9%) |
| Total | 187 (100.0%) | 203 (100.0%) |
Health & Disability in Oroville
Health Insurance Coverage by Age in Oroville
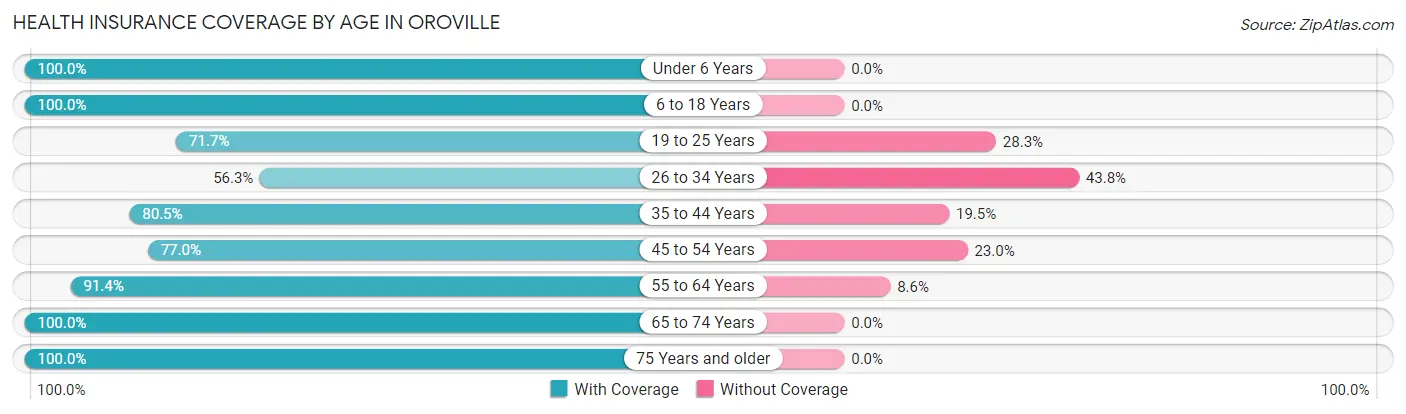
| Age Bracket | With Coverage | Without Coverage |
| Under 6 Years | 217 (100.0%) | 0 (0.0%) |
| 6 to 18 Years | 280 (100.0%) | 0 (0.0%) |
| 19 to 25 Years | 137 (71.7%) | 54 (28.3%) |
| 26 to 34 Years | 99 (56.2%) | 77 (43.8%) |
| 35 to 44 Years | 70 (80.5%) | 17 (19.5%) |
| 45 to 54 Years | 228 (77.0%) | 68 (23.0%) |
| 55 to 64 Years | 203 (91.4%) | 19 (8.6%) |
| 65 to 74 Years | 217 (100.0%) | 0 (0.0%) |
| 75 Years and older | 67 (100.0%) | 0 (0.0%) |
| Total | 1,518 (86.6%) | 235 (13.4%) |
Health Insurance Coverage by Citizenship Status in Oroville
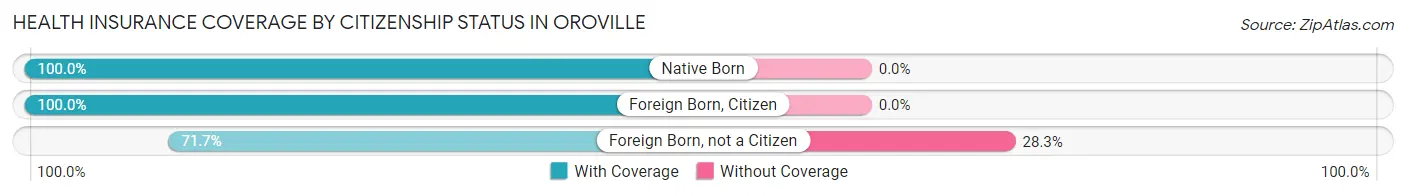
| Citizenship Status | With Coverage | Without Coverage |
| Native Born | 217 (100.0%) | 0 (0.0%) |
| Foreign Born, Citizen | 280 (100.0%) | 0 (0.0%) |
| Foreign Born, not a Citizen | 137 (71.7%) | 54 (28.3%) |
Health Insurance Coverage by Household Income in Oroville
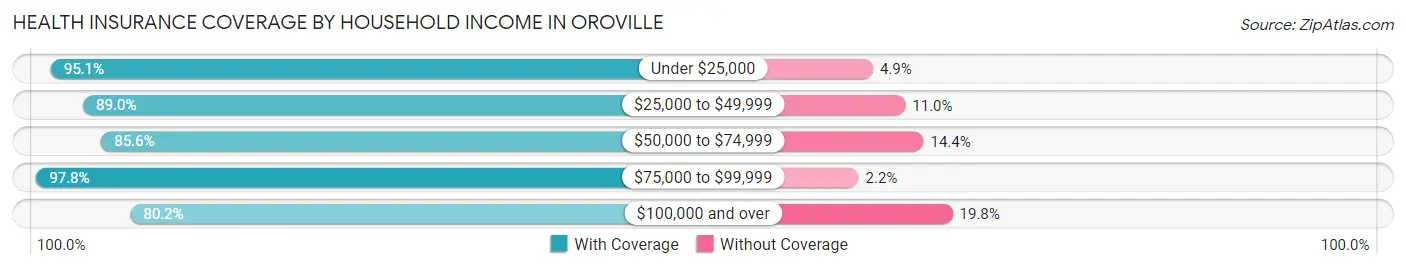
| Household Income | With Coverage | Without Coverage |
| Under $25,000 | 387 (95.1%) | 20 (4.9%) |
| $25,000 to $49,999 | 552 (89.0%) | 68 (11.0%) |
| $50,000 to $74,999 | 268 (85.6%) | 45 (14.4%) |
| $75,000 to $99,999 | 133 (97.8%) | 3 (2.2%) |
| $100,000 and over | 178 (80.2%) | 44 (19.8%) |
Public vs Private Health Insurance Coverage by Age in Oroville
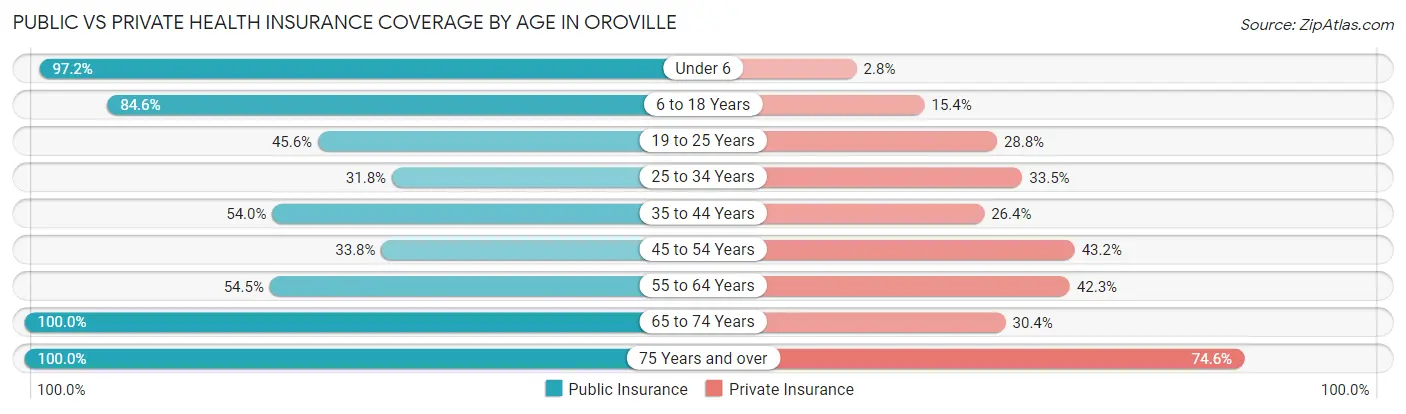
| Age Bracket | Public Insurance | Private Insurance |
| Under 6 | 211 (97.2%) | 6 (2.8%) |
| 6 to 18 Years | 237 (84.6%) | 43 (15.4%) |
| 19 to 25 Years | 87 (45.6%) | 55 (28.8%) |
| 25 to 34 Years | 56 (31.8%) | 59 (33.5%) |
| 35 to 44 Years | 47 (54.0%) | 23 (26.4%) |
| 45 to 54 Years | 100 (33.8%) | 128 (43.2%) |
| 55 to 64 Years | 121 (54.5%) | 94 (42.3%) |
| 65 to 74 Years | 217 (100.0%) | 66 (30.4%) |
| 75 Years and over | 67 (100.0%) | 50 (74.6%) |
| Total | 1,143 (65.2%) | 524 (29.9%) |
Disability Status by Sex by Age in Oroville
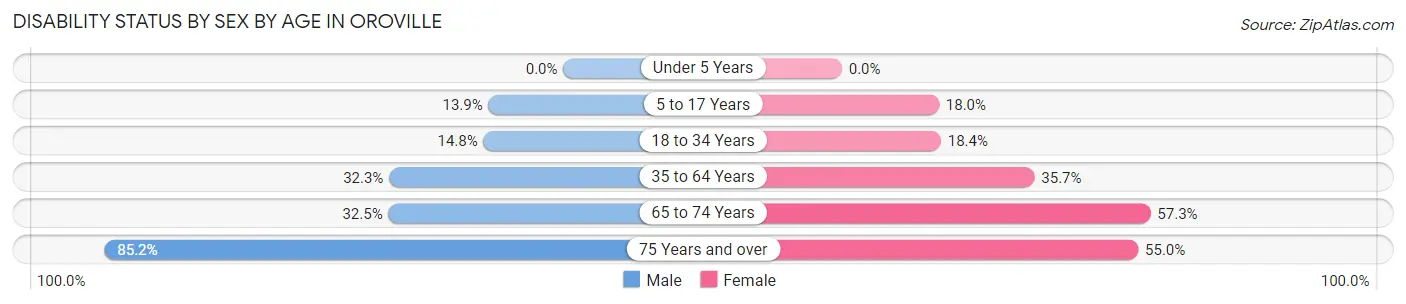
| Age Bracket | Male | Female |
| Under 5 Years | 0 (0.0%) | 0 (0.0%) |
| 5 to 17 Years | 20 (13.9%) | 31 (18.0%) |
| 18 to 34 Years | 28 (14.8%) | 34 (18.4%) |
| 35 to 64 Years | 97 (32.3%) | 109 (35.7%) |
| 65 to 74 Years | 37 (32.5%) | 59 (57.3%) |
| 75 Years and over | 23 (85.2%) | 22 (55.0%) |
Disability Class by Sex by Age in Oroville
Disability Class: Hearing Difficulty
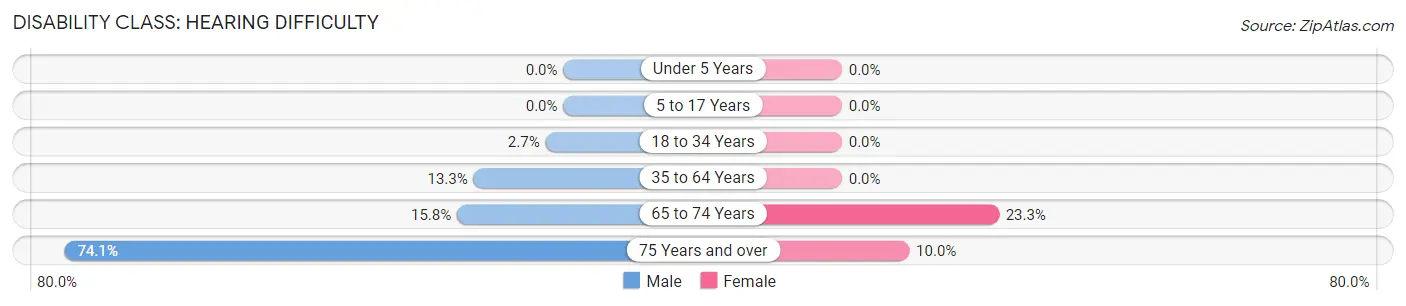
| Age Bracket | Male | Female |
| Under 5 Years | 0 (0.0%) | 0 (0.0%) |
| 5 to 17 Years | 0 (0.0%) | 0 (0.0%) |
| 18 to 34 Years | 5 (2.6%) | 0 (0.0%) |
| 35 to 64 Years | 40 (13.3%) | 0 (0.0%) |
| 65 to 74 Years | 18 (15.8%) | 24 (23.3%) |
| 75 Years and over | 20 (74.1%) | 4 (10.0%) |
Disability Class: Vision Difficulty
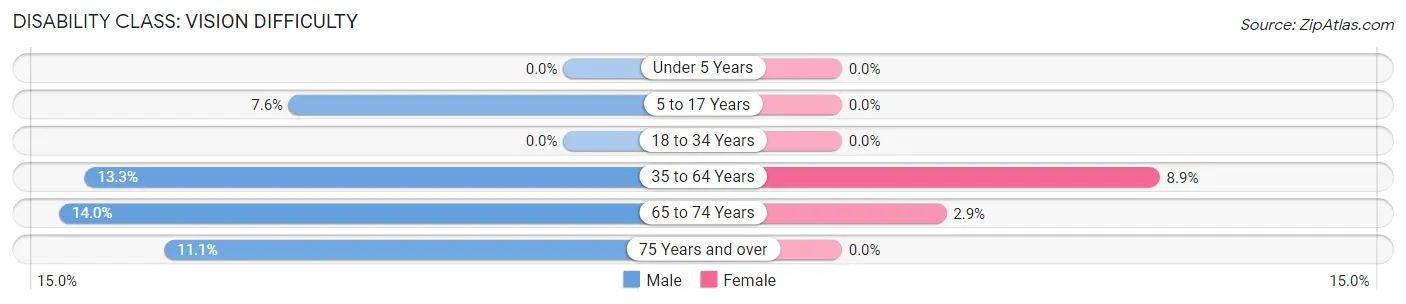
| Age Bracket | Male | Female |
| Under 5 Years | 0 (0.0%) | 0 (0.0%) |
| 5 to 17 Years | 11 (7.6%) | 0 (0.0%) |
| 18 to 34 Years | 0 (0.0%) | 0 (0.0%) |
| 35 to 64 Years | 40 (13.3%) | 27 (8.8%) |
| 65 to 74 Years | 16 (14.0%) | 3 (2.9%) |
| 75 Years and over | 3 (11.1%) | 0 (0.0%) |
Disability Class: Cognitive Difficulty
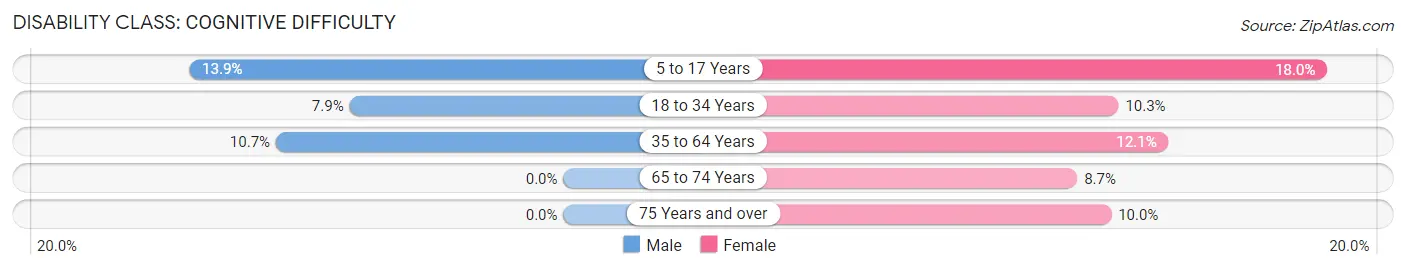
| Age Bracket | Male | Female |
| 5 to 17 Years | 20 (13.9%) | 31 (18.0%) |
| 18 to 34 Years | 15 (7.9%) | 19 (10.3%) |
| 35 to 64 Years | 32 (10.7%) | 37 (12.1%) |
| 65 to 74 Years | 0 (0.0%) | 9 (8.7%) |
| 75 Years and over | 0 (0.0%) | 4 (10.0%) |
Disability Class: Ambulatory Difficulty
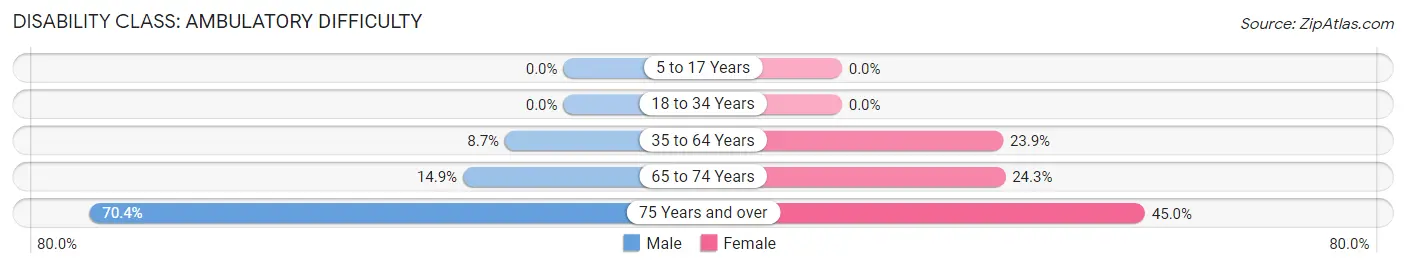
| Age Bracket | Male | Female |
| 5 to 17 Years | 0 (0.0%) | 0 (0.0%) |
| 18 to 34 Years | 0 (0.0%) | 0 (0.0%) |
| 35 to 64 Years | 26 (8.7%) | 73 (23.9%) |
| 65 to 74 Years | 17 (14.9%) | 25 (24.3%) |
| 75 Years and over | 19 (70.4%) | 18 (45.0%) |
Disability Class: Self-Care Difficulty
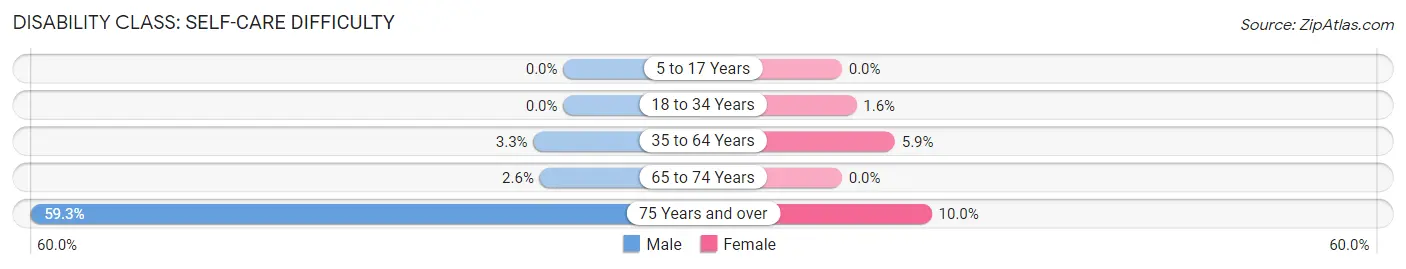
| Age Bracket | Male | Female |
| 5 to 17 Years | 0 (0.0%) | 0 (0.0%) |
| 18 to 34 Years | 0 (0.0%) | 3 (1.6%) |
| 35 to 64 Years | 10 (3.3%) | 18 (5.9%) |
| 65 to 74 Years | 3 (2.6%) | 0 (0.0%) |
| 75 Years and over | 16 (59.3%) | 4 (10.0%) |
Technology Access in Oroville
Computing Device Access in Oroville
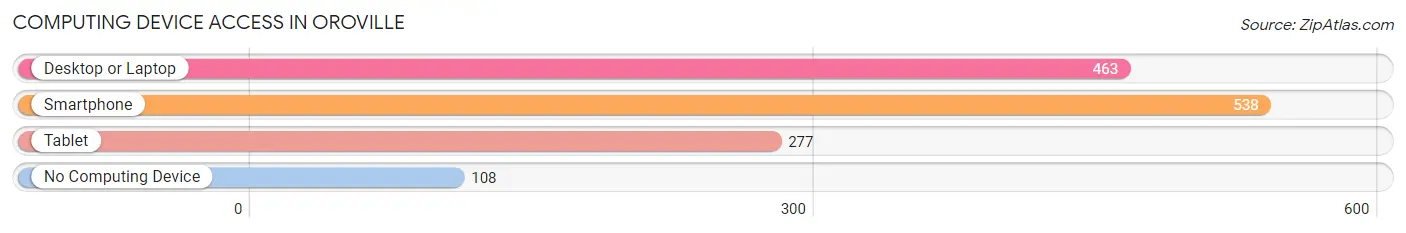
| Device Type | # Households | % Households |
| Desktop or Laptop | 463 | 62.6% |
| Smartphone | 538 | 72.7% |
| Tablet | 277 | 37.4% |
| No Computing Device | 108 | 14.6% |
| Total | 740 | 100.0% |
Internet Access in Oroville
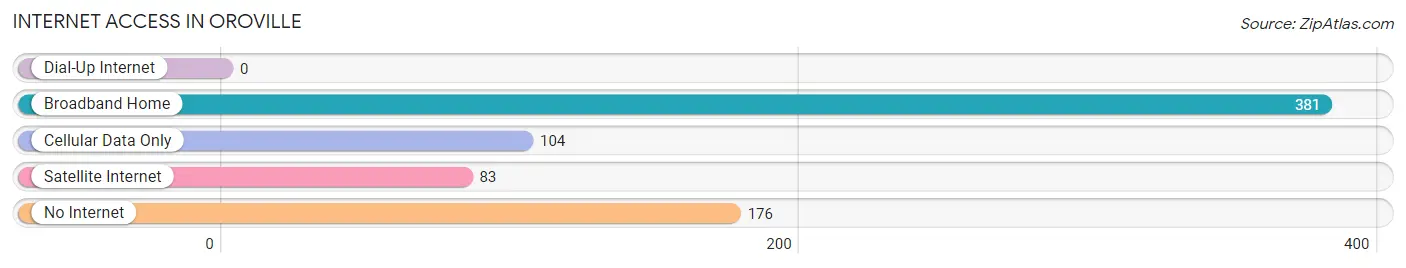
| Internet Type | # Households | % Households |
| Dial-Up Internet | 0 | 0.0% |
| Broadband Home | 381 | 51.5% |
| Cellular Data Only | 104 | 14.1% |
| Satellite Internet | 83 | 11.2% |
| No Internet | 176 | 23.8% |
| Total | 740 | 100.0% |
Oroville Summary
Oroville is a city located in Okanogan County, Washington, United States. The population was 1,845 at the 2010 census. It is the county seat of Okanogan County. The city is located on the eastern shore of Osoyoos Lake, a large lake that straddles the U.S.-Canada border.
History
Oroville was founded in 1891 by a group of settlers from the nearby town of Chesaw. The settlers were looking for a place to settle and build a new town. The town was named after the nearby Oroville Indian Reservation. The town was officially incorporated in 1895.
In the early 1900s, Oroville was a bustling town with a variety of businesses, including a hotel, a bank, a sawmill, a general store, and a post office. The town was also home to a number of saloons and gambling halls.
In the 1920s, the town began to decline as the timber industry in the area began to decline. The Great Depression of the 1930s further exacerbated the town's decline. By the 1940s, the town had become a virtual ghost town.
In the 1950s, the town began to experience a resurgence as the timber industry began to recover. The town also began to attract tourists to the area, as the nearby Osoyoos Lake became a popular destination for fishing and boating.
Geography
Oroville is located at 48°59′N 119°37′W (48.983, -119.619). According to the United States Census Bureau, the city has a total area of 1.2 square miles (3.1 km2), all of it land.
Economy
Oroville's economy is largely based on tourism and agriculture. The town is home to a number of wineries, as well as a number of fruit orchards. The town is also home to a number of small businesses, including restaurants, shops, and other services.
Demographics
As of the census of 2010, there were 1,845 people, 745 households, and 463 families residing in the city. The population density was 1,541.7 people per square mile (595.2/km2). There were 845 housing units at an average density of 708.3 per square mile (273.7/km2). The racial makeup of the city was 87.2% White, 0.2% African American, 1.2% Native American, 0.7% Asian, 0.1% Pacific Islander, 8.2% from other races, and 2.6% from two or more races. Hispanic or Latino of any race were 16.2% of the population.
There were 745 households, out of which 28.2% had children under the age of 18 living with them, 44.2% were married couples living together, 12.7% had a female householder with no husband present, and 36.3% were non-families. 30.2% of all households were made up of individuals, and 13.2% had someone living alone who was 65 years of age or older. The average household size was 2.45 and the average family size was 3.03.
In the city, the population was spread out, with 25.2% under the age of 18, 8.2% from 18 to 24, 24.2% from 25 to 44, 25.2% from 45 to 64, and 17.2% who were 65 years of age or older. The median age was 38 years. For every 100 females, there were 97.2 males. For every 100 females age 18 and over, there were 94.2 males.
The median income for a household in the city was $30,000, and the median income for a family was $35,000. Males had a median income of $30,000 versus $20,000 for females. The per capita income for the city was $15,000. About 11.2% of families and 14.2% of the population were below the poverty line, including 18.2% of those under age 18 and 8.2% of those age 65 or over.
Common Questions
What is Per Capita Income in Oroville?
Per Capita income in Oroville is $18,755.
What is the Median Family Income in Oroville?
Median Family Income in Oroville is $41,750.
What is the Median Household income in Oroville?
Median Household Income in Oroville is $34,750.
What is Income or Wage Gap in Oroville?
Income or Wage Gap in Oroville is 26.6%.
Women in Oroville earn 73.4 cents for every dollar earned by a man.
What is Inequality or Gini Index in Oroville?
Inequality or Gini Index in Oroville is 0.42.
What is the Total Population of Oroville?
Total Population of Oroville is 1,753.
What is the Total Male Population of Oroville?
Total Male Population of Oroville is 882.
What is the Total Female Population of Oroville?
Total Female Population of Oroville is 871.
What is the Ratio of Males per 100 Females in Oroville?
There are 101.26 Males per 100 Females in Oroville.
What is the Ratio of Females per 100 Males in Oroville?
There are 98.75 Females per 100 Males in Oroville.
What is the Median Population Age in Oroville?
Median Population Age in Oroville is 36.0 Years.
What is the Average Family Size in Oroville
Average Family Size in Oroville is 3.1 People.
What is the Average Household Size in Oroville
Average Household Size in Oroville is 2.3 People.
How Large is the Labor Force in Oroville?
There are 673 People in the Labor Forcein in Oroville.
What is the Percentage of People in the Labor Force in Oroville?
51.9% of People are in the Labor Force in Oroville.
What is the Unemployment Rate in Oroville?
Unemployment Rate in Oroville is 7.0%.