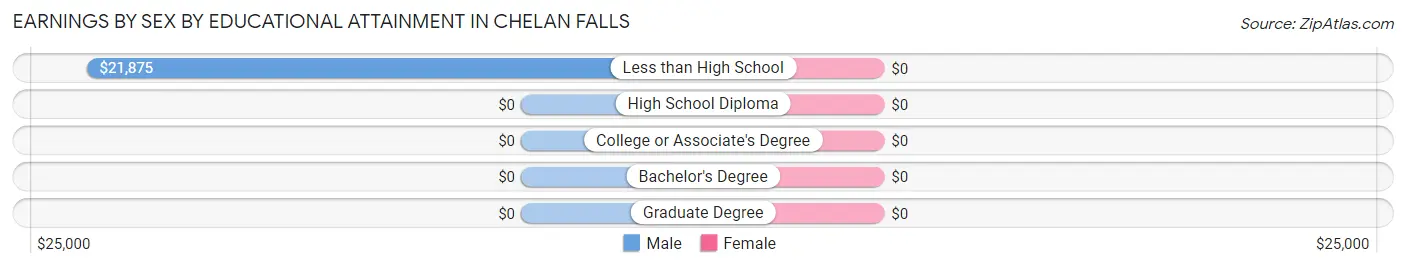
Earnings by Sex by Educational Attainment in Chelan Falls
Educational Attainment
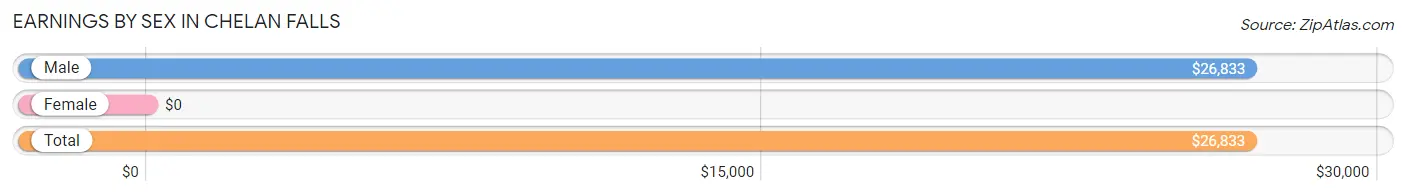
Male Income
Female Income
Less than High School
$21,875
$0
High School Diploma
-
-
College or Associate's Degree
-
-
Bachelor's Degree
-
-
Graduate Degree
-
-
Total
$30,458
$0
Family Income in Chelan Falls
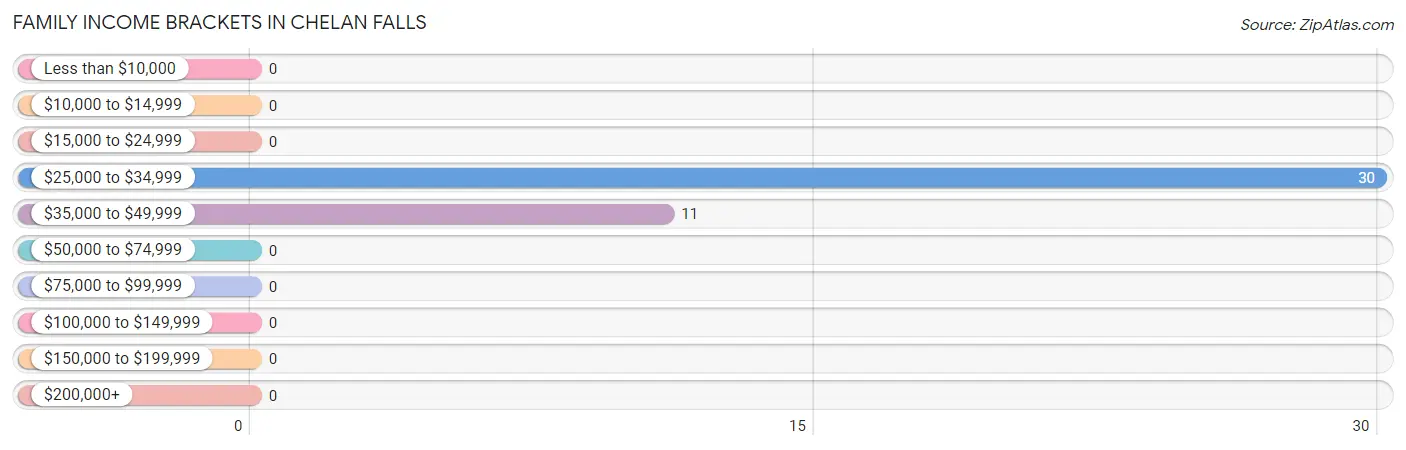
Family Income Brackets in Chelan Falls
According to the Chelan Falls family income data, there are 30 families falling into the $25,000 to $34,999 income range, which is the most common income bracket and makes up 73.2% of all families.
Income Bracket
# Families
% Families
Less than $10,000
0
0.0%
$10,000 to $14,999
0
0.0%
$15,000 to $24,999
0
0.0%
$25,000 to $34,999
30
73.2%
$35,000 to $49,999
11
26.8%
$50,000 to $74,999
0
0.0%
$75,000 to $99,999
0
0.0%
$100,000 to $149,999
0
0.0%
$150,000 to $199,999
0
0.0%
$200,000+
0
0.0%
Family Income by Famaliy Size in Chelan Falls
Income Bracket
# Families
Median Income
2-Person Families
41 (100.0%)
$0
3-Person Families
0 (0.0%)
$0
4-Person Families
0 (0.0%)
$0
5-Person Families
0 (0.0%)
$0
6-Person Families
0 (0.0%)
$0
7+ Person Families
0 (0.0%)
$0
Total
41 (100.0%)
$0
Family Income by Number of Earners in Chelan Falls
Number of Earners
# Families
Median Income
No Earners
0 (0.0%)
$0
1 Earner
30 (73.2%)
$0
2 Earners
11 (26.8%)
$0
3+ Earners
0 (0.0%)
$0
Total
41 (100.0%)
$0
Household Income in Chelan Falls
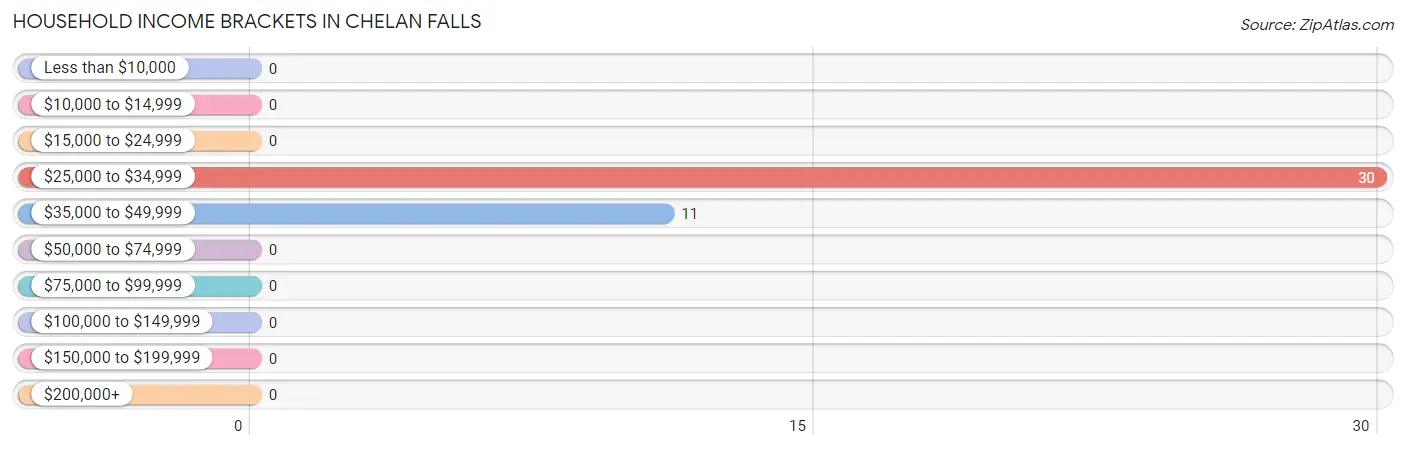
Household Income Brackets in Chelan Falls
With 30 households falling in the category, the $25,000 to $34,999 income range is the most frequent in Chelan Falls, accounting for 73.2% of all households.
Income Bracket
# Households
% Households
Less than $10,000
0
0.0%
$10,000 to $14,999
0
0.0%
$15,000 to $24,999
0
0.0%
$25,000 to $34,999
30
73.2%
$35,000 to $49,999
11
26.8%
$50,000 to $74,999
0
0.0%
$75,000 to $99,999
0
0.0%
$100,000 to $149,999
0
0.0%
$150,000 to $199,999
0
0.0%
$200,000+
0
0.0%
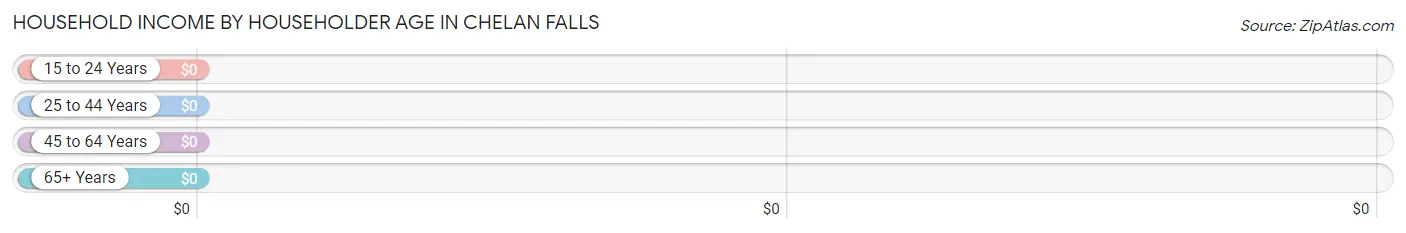
Household Income by Householder Age in Chelan Falls
Income Bracket
# Households
Median Income
15 to 24 Years
0 (0.0%)
$0
25 to 44 Years
11 (26.8%)
$0
45 to 64 Years
30 (73.2%)
$0
65+ Years
0 (0.0%)
$0
Total
41 (100.0%)
$0
Poverty in Chelan Falls
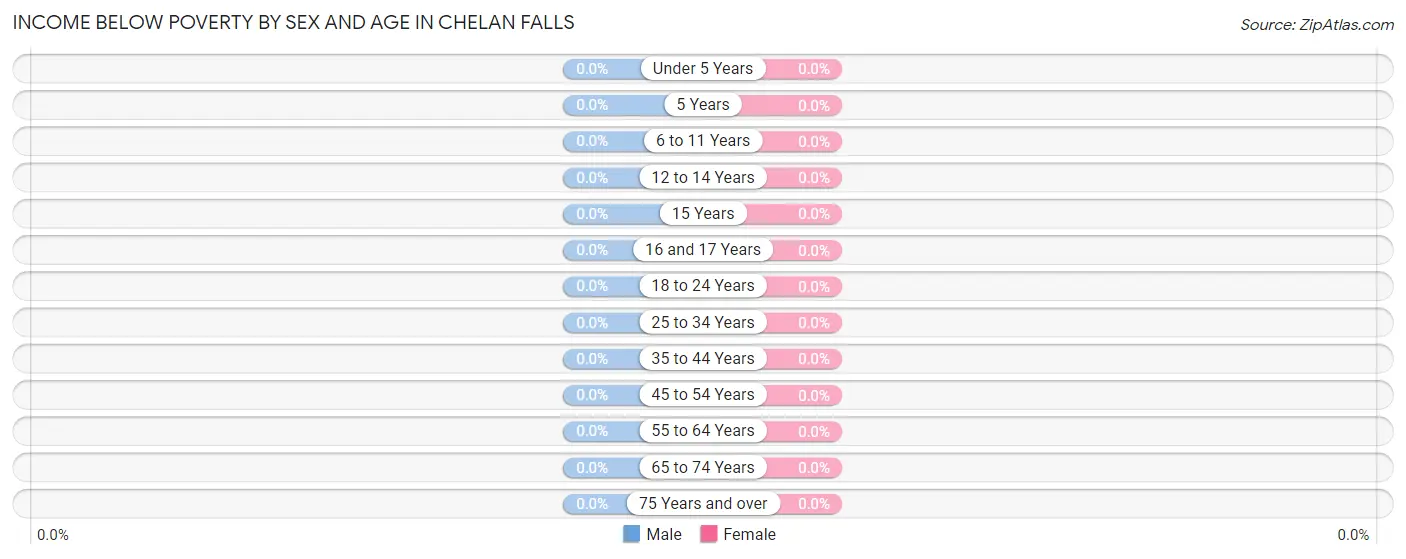
Income Below Poverty by Sex and Age in Chelan Falls
Age Bracket
Male
Female
Under 5 Years
0 (0.0%)
0 (0.0%)
5 Years
0 (0.0%)
0 (0.0%)
6 to 11 Years
0 (0.0%)
0 (0.0%)
12 to 14 Years
0 (0.0%)
0 (0.0%)
15 Years
0 (0.0%)
0 (0.0%)
16 and 17 Years
0 (0.0%)
0 (0.0%)
18 to 24 Years
0 (0.0%)
0 (0.0%)
25 to 34 Years
0 (0.0%)
0 (0.0%)
35 to 44 Years
0 (0.0%)
0 (0.0%)
45 to 54 Years
0 (0.0%)
0 (0.0%)
55 to 64 Years
0 (0.0%)
0 (0.0%)
65 to 74 Years
0 (0.0%)
0 (0.0%)
75 Years and over
0 (0.0%)
0 (0.0%)
Total
0 (0.0%)
0 (0.0%)
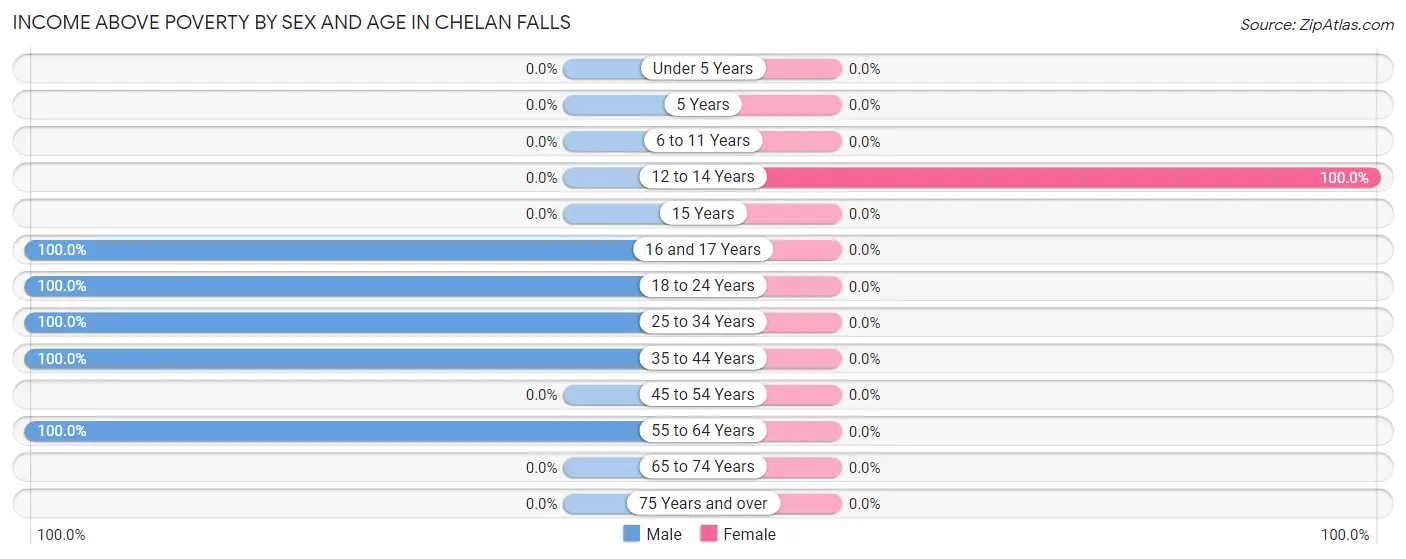
Income Above Poverty by Sex and Age in Chelan Falls
According to the poverty statistics in Chelan Falls, males aged 16 and 17 years and females aged 12 to 14 years are the age groups that are most secure financially, with 100.0% of males and 100.0% of females in these age groups living above the poverty line.
Age Bracket
Male
Female
Under 5 Years
0 (0.0%)
0 (0.0%)
5 Years
0 (0.0%)
0 (0.0%)
6 to 11 Years
0 (0.0%)
0 (0.0%)
12 to 14 Years
0 (0.0%)
34 (100.0%)
15 Years
0 (0.0%)
0 (0.0%)
16 and 17 Years
2 (100.0%)
0 (0.0%)
18 to 24 Years
17 (100.0%)
0 (0.0%)
25 to 34 Years
17 (100.0%)
0 (0.0%)
35 to 44 Years
4 (100.0%)
0 (0.0%)
45 to 54 Years
0 (0.0%)
0 (0.0%)
55 to 64 Years
32 (100.0%)
0 (0.0%)
65 to 74 Years
0 (0.0%)
0 (0.0%)
75 Years and over
0 (0.0%)
0 (0.0%)
Total
72 (100.0%)
34 (100.0%)
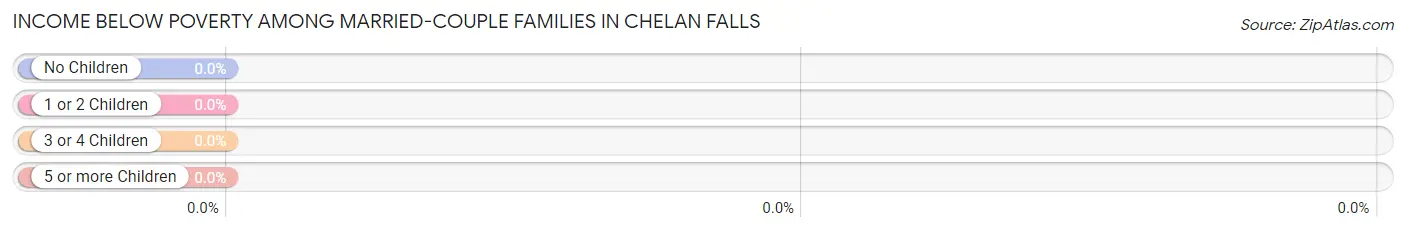
Income Below Poverty Among Married-Couple Families in Chelan Falls
Children
Above Poverty
Below Poverty
No Children
11 (100.0%)
0 (0.0%)
1 or 2 Children
0 (0.0%)
0 (0.0%)
3 or 4 Children
0 (0.0%)
0 (0.0%)
5 or more Children
0 (0.0%)
0 (0.0%)
Total
11 (100.0%)
0 (0.0%)
Income Below Poverty Among Single-Parent Households in Chelan Falls
Children
Single Father
Single Mother
No Children
0 (0.0%)
0 (0.0%)
1 or 2 Children
0 (0.0%)
0 (0.0%)
3 or 4 Children
0 (0.0%)
0 (0.0%)
5 or more Children
0 (0.0%)
0 (0.0%)
Total
0 (0.0%)
0 (0.0%)
Income Below Poverty Among Married-Couple vs Single-Parent Households in Chelan Falls
Children
Married-Couple Families
Single-Parent Households
No Children
0 (0.0%)
0 (0.0%)
1 or 2 Children
0 (0.0%)
0 (0.0%)
3 or 4 Children
0 (0.0%)
0 (0.0%)
5 or more Children
0 (0.0%)
0 (0.0%)
Total
0 (0.0%)
0 (0.0%)
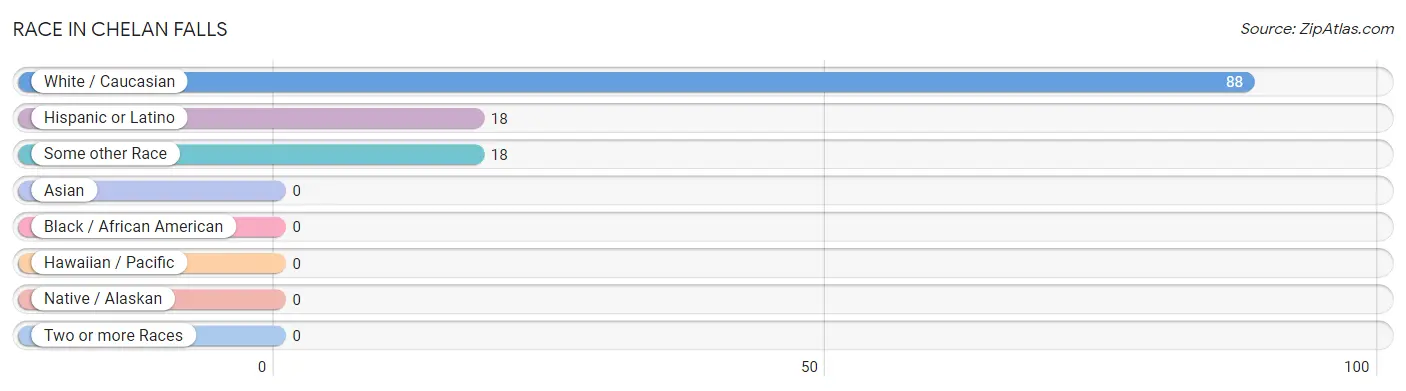
Race in Chelan Falls
The most populous races in Chelan Falls are White / Caucasian (88 | 83.0%), Hispanic or Latino (18 | 17.0%), and Some other Race (18 | 17.0%).
Race
# Population
% Population
Asian
0
0.0%
Black / African American
0
0.0%
Hawaiian / Pacific
0
0.0%
Hispanic or Latino
18
17.0%
Native / Alaskan
0
0.0%
White / Caucasian
88
83.0%
Two or more Races
0
0.0%
Some other Race
18
17.0%
Total
106
100.0%
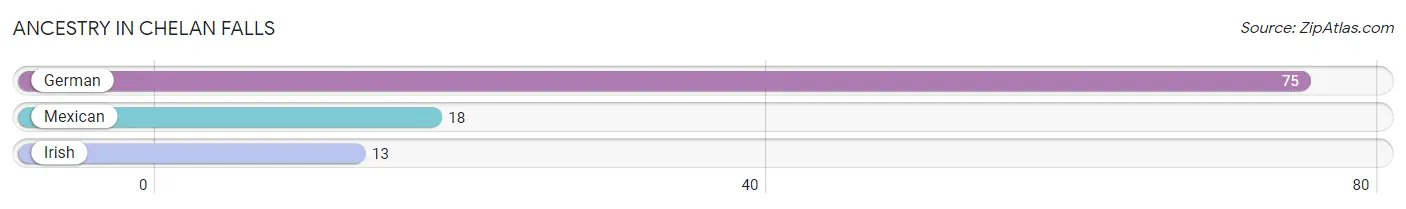
Ancestry in Chelan Falls
The most populous ancestries reported in Chelan Falls are German (75 | 70.8%), Mexican (18 | 17.0%), and Irish (13 | 12.3%), together accounting for 100.0% of all Chelan Falls residents.
Ancestry
# Population
% Population
German
75
70.8%
Irish
13
12.3%
Mexican
18
17.0%
View All 3 Rows
Immigrants in Chelan Falls
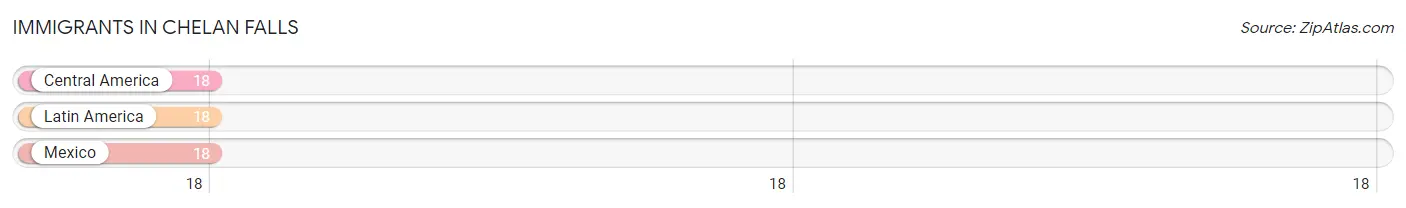
The most numerous immigrant groups reported in Chelan Falls came from Central America (18 | 17.0%), Latin America (18 | 17.0%), and Mexico (18 | 17.0%), together accounting for 50.9% of all Chelan Falls residents.
Immigration Origin
# Population
% Population
Central America
18
17.0%
Latin America
18
17.0%
Mexico
18
17.0%
View All 3 Rows
Sex and Age in Chelan Falls
Sex and Age in Chelan Falls
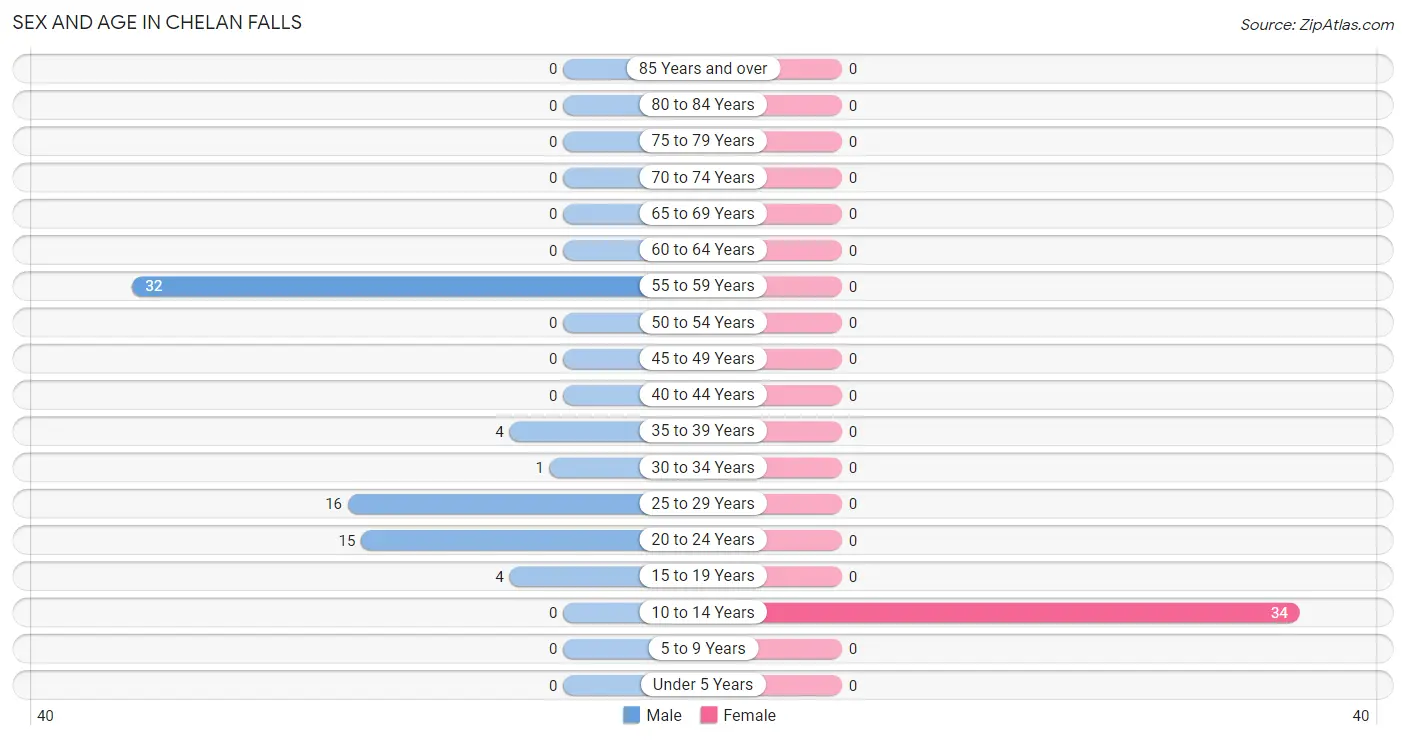
The most populous age groups in Chelan Falls are 55 to 59 Years (32 | 44.4%) for men and 10 to 14 Years (34 | 100.0%) for women.
Age Bracket
Male
Female
Under 5 Years
0 (0.0%)
0 (0.0%)
5 to 9 Years
0 (0.0%)
0 (0.0%)
10 to 14 Years
0 (0.0%)
34 (100.0%)
15 to 19 Years
4 (5.6%)
0 (0.0%)
20 to 24 Years
15 (20.8%)
0 (0.0%)
25 to 29 Years
16 (22.2%)
0 (0.0%)
30 to 34 Years
1 (1.4%)
0 (0.0%)
35 to 39 Years
4 (5.6%)
0 (0.0%)
40 to 44 Years
0 (0.0%)
0 (0.0%)
45 to 49 Years
0 (0.0%)
0 (0.0%)
50 to 54 Years
0 (0.0%)
0 (0.0%)
55 to 59 Years
32 (44.4%)
0 (0.0%)
60 to 64 Years
0 (0.0%)
0 (0.0%)
65 to 69 Years
0 (0.0%)
0 (0.0%)
70 to 74 Years
0 (0.0%)
0 (0.0%)
75 to 79 Years
0 (0.0%)
0 (0.0%)
80 to 84 Years
0 (0.0%)
0 (0.0%)
85 Years and over
0 (0.0%)
0 (0.0%)
Total
72 (100.0%)
34 (100.0%)
Families and Households in Chelan Falls
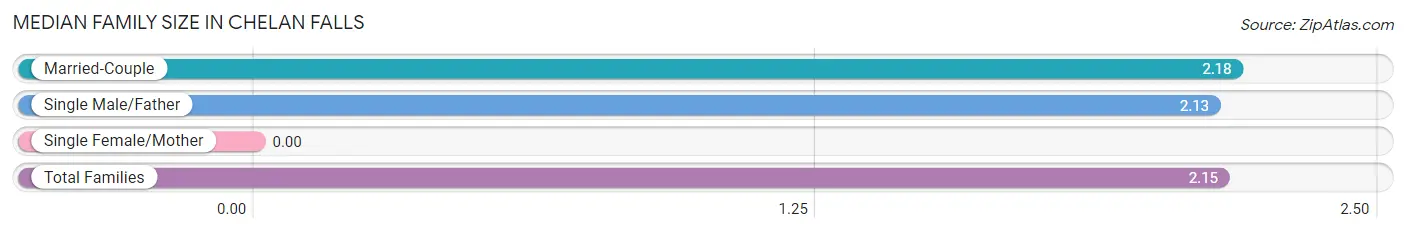
Median Family Size in Chelan Falls
Family Type
# Families
Family Size
Married-Couple
11 (26.8%)
2.18
Single Male/Father
30 (73.2%)
2.13
Single Female/Mother
0 (0.0%)
-
Total Families
41 (100.0%)
2.15
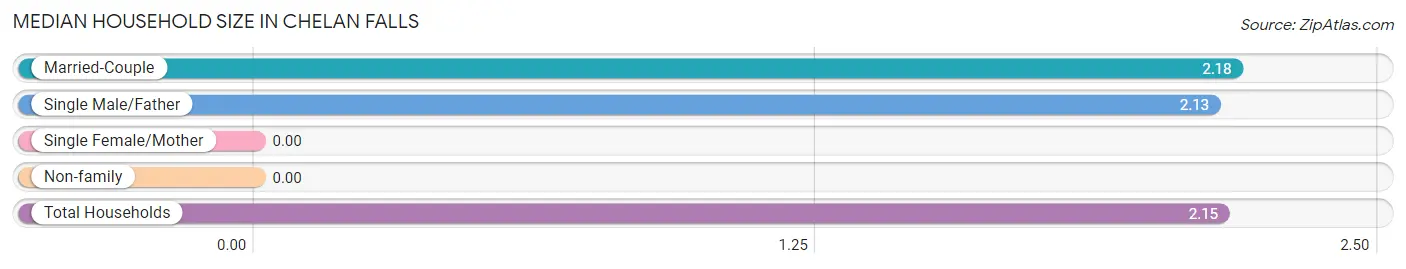
Median Household Size in Chelan Falls
Household Type
# Households
Household Size
Married-Couple
11 (26.8%)
2.18
Single Male/Father
30 (73.2%)
2.13
Single Female/Mother
0 (0.0%)
-
Non-family
0 (0.0%)
-
Total Households
41 (100.0%)
2.15
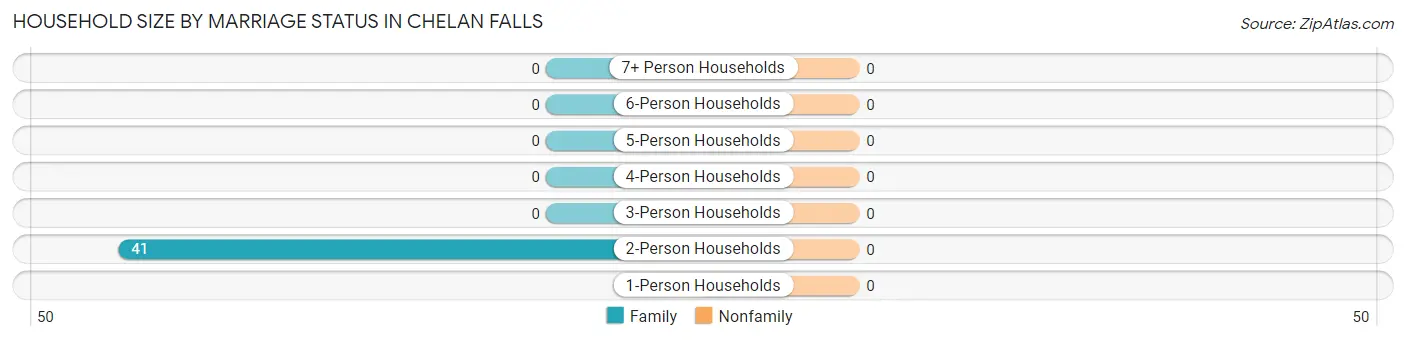
Household Size by Marriage Status in Chelan Falls
Household Size
Family Households
Nonfamily Households
1-Person Households
-
0 (0.0%)
2-Person Households
41 (100.0%)
0 (0.0%)
3-Person Households
0 (0.0%)
0 (0.0%)
4-Person Households
0 (0.0%)
0 (0.0%)
5-Person Households
0 (0.0%)
0 (0.0%)
6-Person Households
0 (0.0%)
0 (0.0%)
7+ Person Households
0 (0.0%)
0 (0.0%)
Total
41 (100.0%)
0 (0.0%)
Female Fertility in Chelan Falls
Fertility by Age in Chelan Falls
Age Bracket
Women with Births
Births / 1,000 Women
15 to 19 years
0 (0.0%)
0.0
20 to 34 years
0 (0.0%)
0.0
35 to 50 years
0 (0.0%)
0.0
Total
0 (0.0%)
0.0
Fertility by Age by Marriage Status in Chelan Falls
Age Bracket
Married
Unmarried
15 to 19 years
0 (0.0%)
0 (0.0%)
20 to 34 years
0 (0.0%)
0 (0.0%)
35 to 50 years
0 (0.0%)
0 (0.0%)
Total
0 (0.0%)
0 (0.0%)
Fertility by Education in Chelan Falls
Educational Attainment
Women with Births
Births / 1,000 Women
Less than High School
0 (0.0%)
0.0
High School Diploma
0 (0.0%)
0.0
College or Associate's Degree
0 (0.0%)
0.0
Bachelor's Degree
0 (0.0%)
0.0
Graduate Degree
0 (0.0%)
0.0
Total
0 (0.0%)
0.0
Fertility by Education by Marriage Status in Chelan Falls
Educational Attainment
Married
Unmarried
Less than High School
0 (0.0%)
0 (0.0%)
High School Diploma
0 (0.0%)
0 (0.0%)
College or Associate's Degree
0 (0.0%)
0 (0.0%)
Bachelor's Degree
0 (0.0%)
0 (0.0%)
Graduate Degree
0 (0.0%)
0 (0.0%)
Total
0 (0.0%)
0 (0.0%)
Employment Characteristics in Chelan Falls
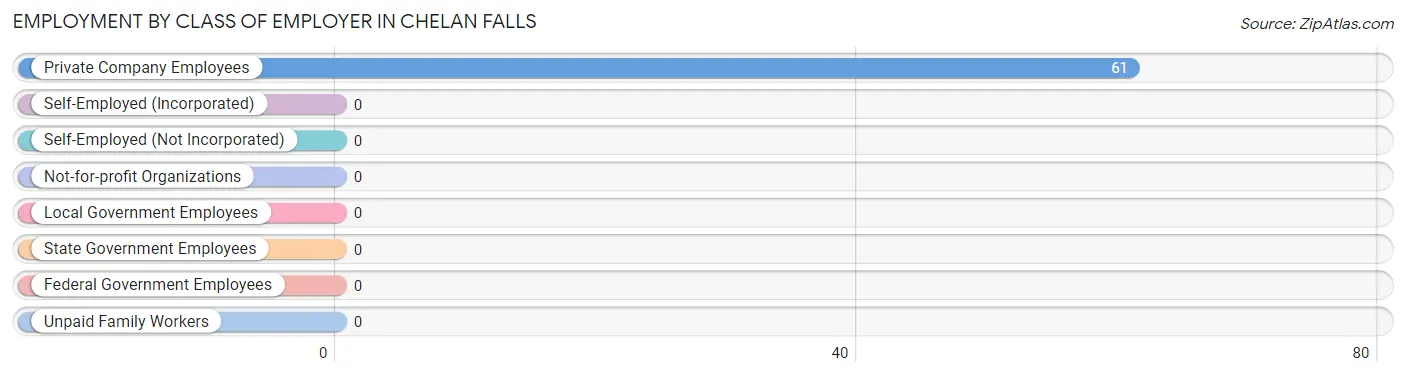
Employment by Class of Employer in Chelan Falls
Among the 61 employed individuals in Chelan Falls, , and private company employees (61 | 100.0%) make up the most common classes of employment.
Employer Class
# Employees
% Employees
Private Company Employees
61
100.0%
Self-Employed (Incorporated)
0
0.0%
Self-Employed (Not Incorporated)
0
0.0%
Not-for-profit Organizations
0
0.0%
Local Government Employees
0
0.0%
State Government Employees
0
0.0%
Federal Government Employees
0
0.0%
Unpaid Family Workers
0
0.0%
Total
61
100.0%
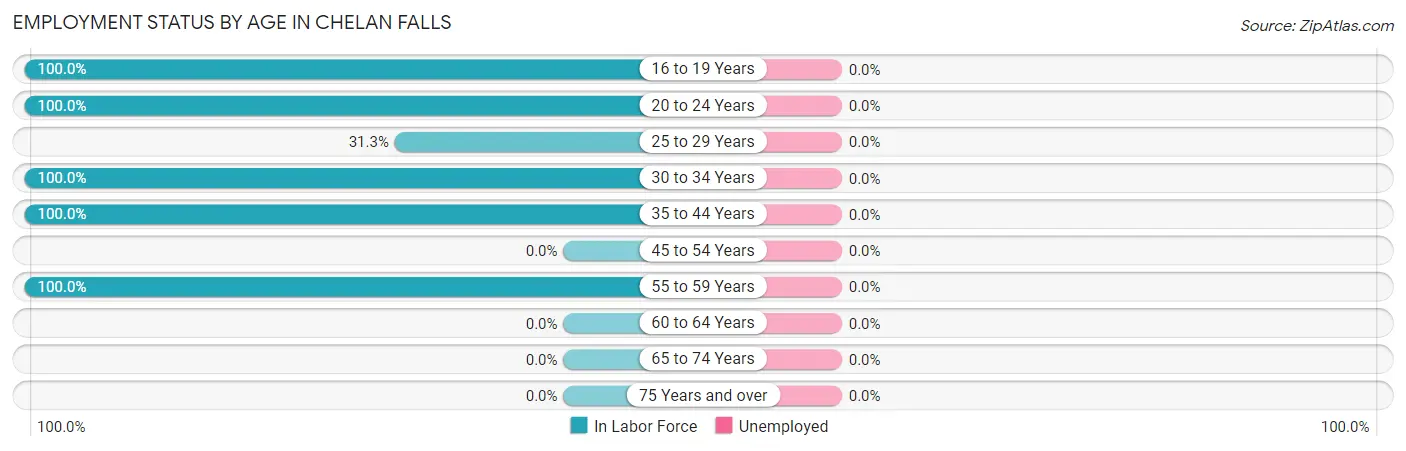
Employment Status by Age in Chelan Falls
Age Bracket
In Labor Force
Unemployed
16 to 19 Years
4 (100.0%)
0 (0.0%)
20 to 24 Years
15 (100.0%)
0 (0.0%)
25 to 29 Years
5 (31.3%)
0 (0.0%)
30 to 34 Years
1 (100.0%)
0 (0.0%)
35 to 44 Years
4 (100.0%)
0 (0.0%)
45 to 54 Years
0 (0.0%)
0 (0.0%)
55 to 59 Years
32 (100.0%)
0 (0.0%)
60 to 64 Years
0 (0.0%)
0 (0.0%)
65 to 74 Years
0 (0.0%)
0 (0.0%)
75 Years and over
0 (0.0%)
0 (0.0%)
Total
61 (84.7%)
0 (0.0%)
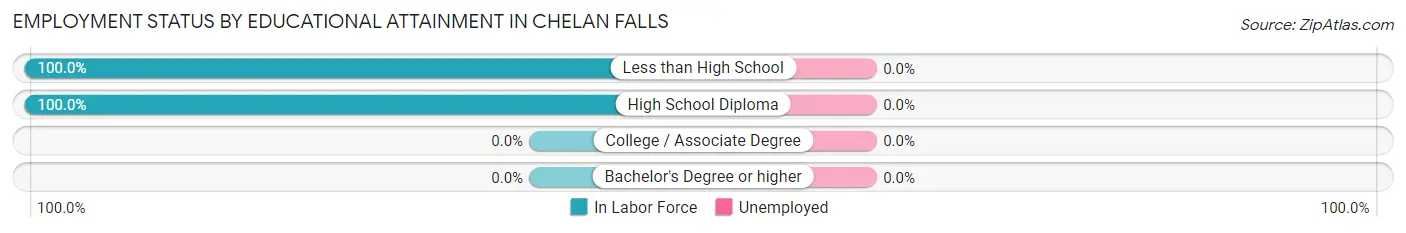
Employment Status by Educational Attainment in Chelan Falls
Educational Attainment
In Labor Force
Unemployed
Less than High School
12 (100.0%)
0 (0.0%)
High School Diploma
30 (100.0%)
0 (0.0%)
College / Associate Degree
0 (0.0%)
0 (0.0%)
Bachelor's Degree or higher
0 (0.0%)
0 (0.0%)
Total
42 (79.2%)
0 (0.0%)
Employment Occupations by Sex in Chelan Falls
Management, Business, Science and Arts Occupations
Management, Business, Science and Arts Occupations by Sex
Occupation
Male
Female
Management
0 (0.0%)
0 (0.0%)
Business & Financial
0 (0.0%)
0 (0.0%)
Computers, Engineering & Science
0 (0.0%)
0 (0.0%)
Computers & Mathematics
0 (0.0%)
0 (0.0%)
Architecture & Engineering
0 (0.0%)
0 (0.0%)
Life, Physical & Social Science
0 (0.0%)
0 (0.0%)
Community & Social Service
0 (0.0%)
0 (0.0%)
Education, Arts & Media
0 (0.0%)
0 (0.0%)
Legal Services & Support
0 (0.0%)
0 (0.0%)
Education Instruction & Library
0 (0.0%)
0 (0.0%)
Arts, Media & Entertainment
0 (0.0%)
0 (0.0%)
Health Diagnosing & Treating
0 (0.0%)
0 (0.0%)
Health Technologists
0 (0.0%)
0 (0.0%)
Total (Category)
0 (0.0%)
0 (0.0%)
Total (Overall)
61 (100.0%)
0 (0.0%)
Services Occupations
Services Occupations by Sex
Occupation
Male
Female
Healthcare Support
0 (0.0%)
0 (0.0%)
Security & Protection
0 (0.0%)
0 (0.0%)
Firefighting & Prevention
0 (0.0%)
0 (0.0%)
Law Enforcement
0 (0.0%)
0 (0.0%)
Food Preparation & Serving
0 (0.0%)
0 (0.0%)
Cleaning & Maintenance
0 (0.0%)
0 (0.0%)
Personal Care & Service
0 (0.0%)
0 (0.0%)
Total (Category)
0 (0.0%)
0 (0.0%)
Total (Overall)
61 (100.0%)
0 (0.0%)
Sales and Office Occupations
Sales and Office Occupations by Sex
Occupation
Male
Female
Sales & Related
0 (0.0%)
0 (0.0%)
Office & Administration
0 (0.0%)
0 (0.0%)
Total (Category)
0 (0.0%)
0 (0.0%)
Total (Overall)
61 (100.0%)
0 (0.0%)
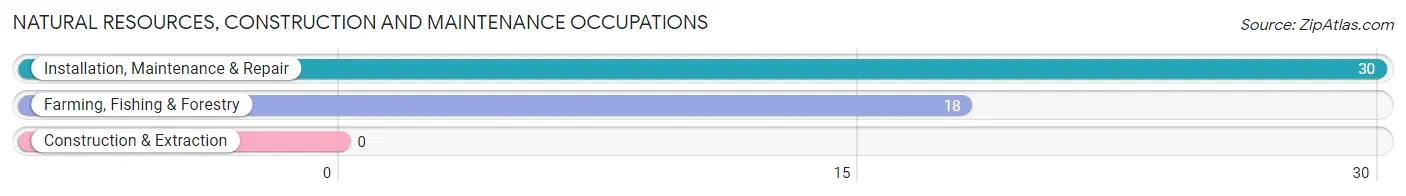
Natural Resources, Construction and Maintenance Occupations
The most common Natural Resources, Construction and Maintenance occupations in Chelan Falls are Installation, Maintenance & Repair (30 | 49.2%), and Farming, Fishing & Forestry (18 | 29.5%).
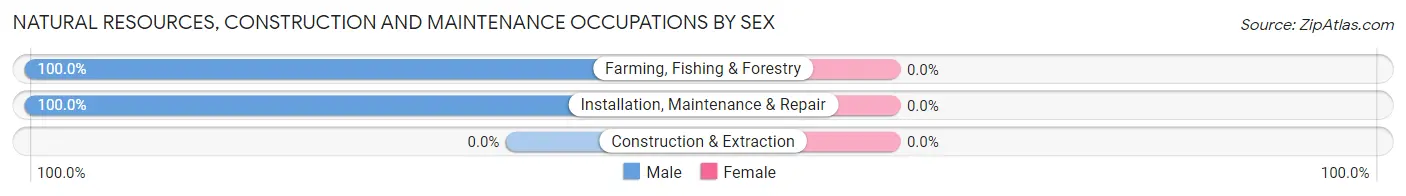
Natural Resources, Construction and Maintenance Occupations by Sex
Occupation
Male
Female
Farming, Fishing & Forestry
18 (100.0%)
0 (0.0%)
Construction & Extraction
0 (0.0%)
0 (0.0%)
Installation, Maintenance & Repair
30 (100.0%)
0 (0.0%)
Total (Category)
48 (100.0%)
0 (0.0%)
Total (Overall)
61 (100.0%)
0 (0.0%)
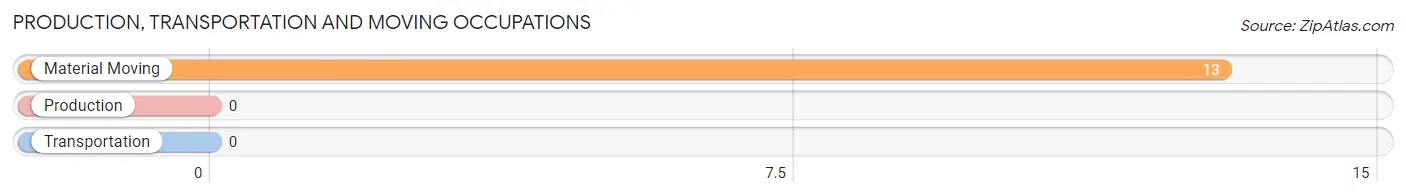
Production, Transportation and Moving Occupations
The most common Production, Transportation and Moving occupations in Chelan Falls are , and Material Moving (13 | 21.3%).
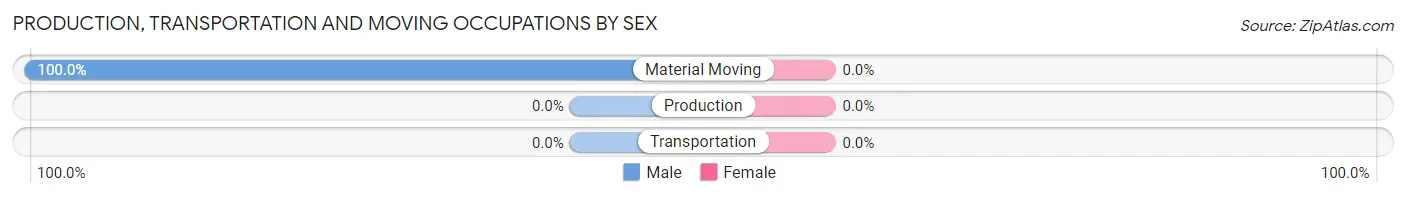
Production, Transportation and Moving Occupations by Sex
Occupation
Male
Female
Production
0 (0.0%)
0 (0.0%)
Transportation
0 (0.0%)
0 (0.0%)
Material Moving
13 (100.0%)
0 (0.0%)
Total (Category)
13 (100.0%)
0 (0.0%)
Total (Overall)
61 (100.0%)
0 (0.0%)
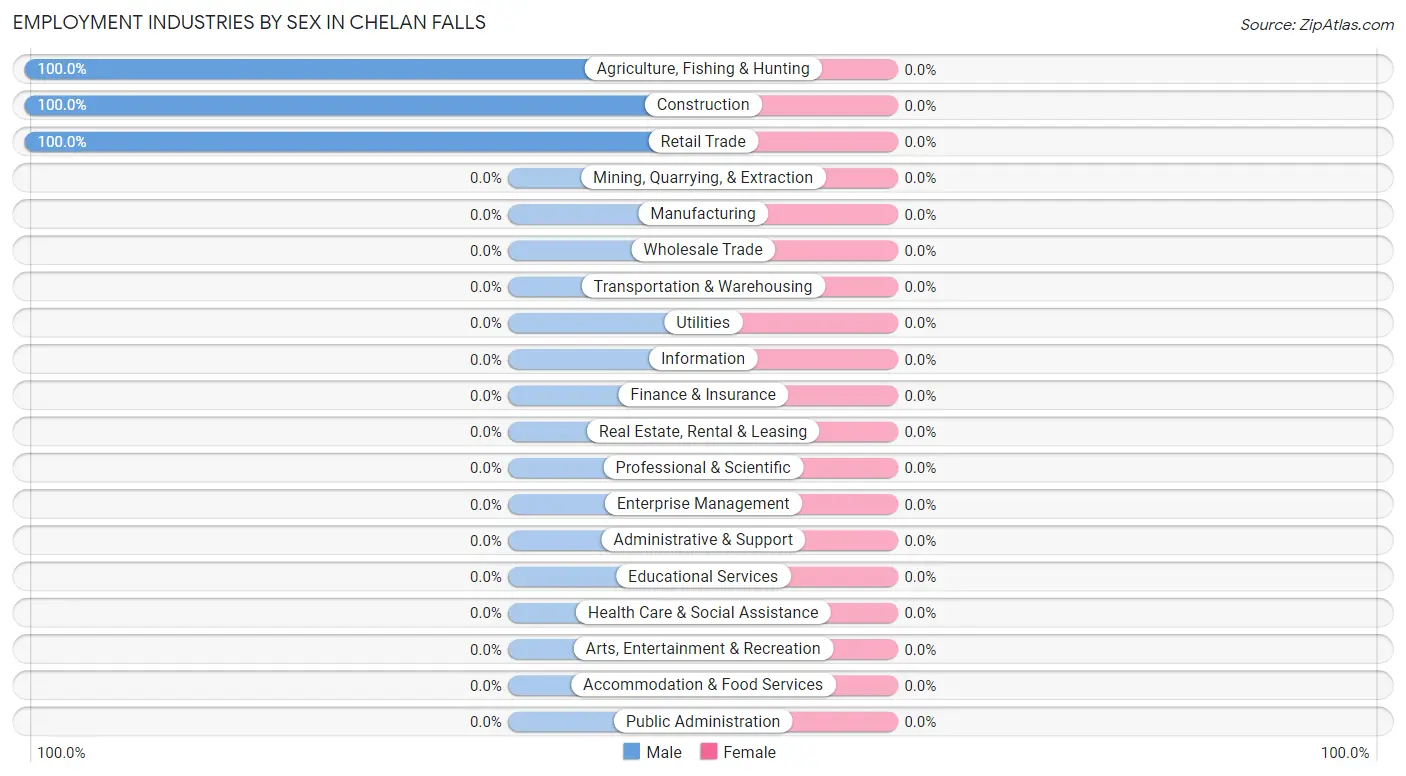
Employment Industries by Sex in Chelan Falls
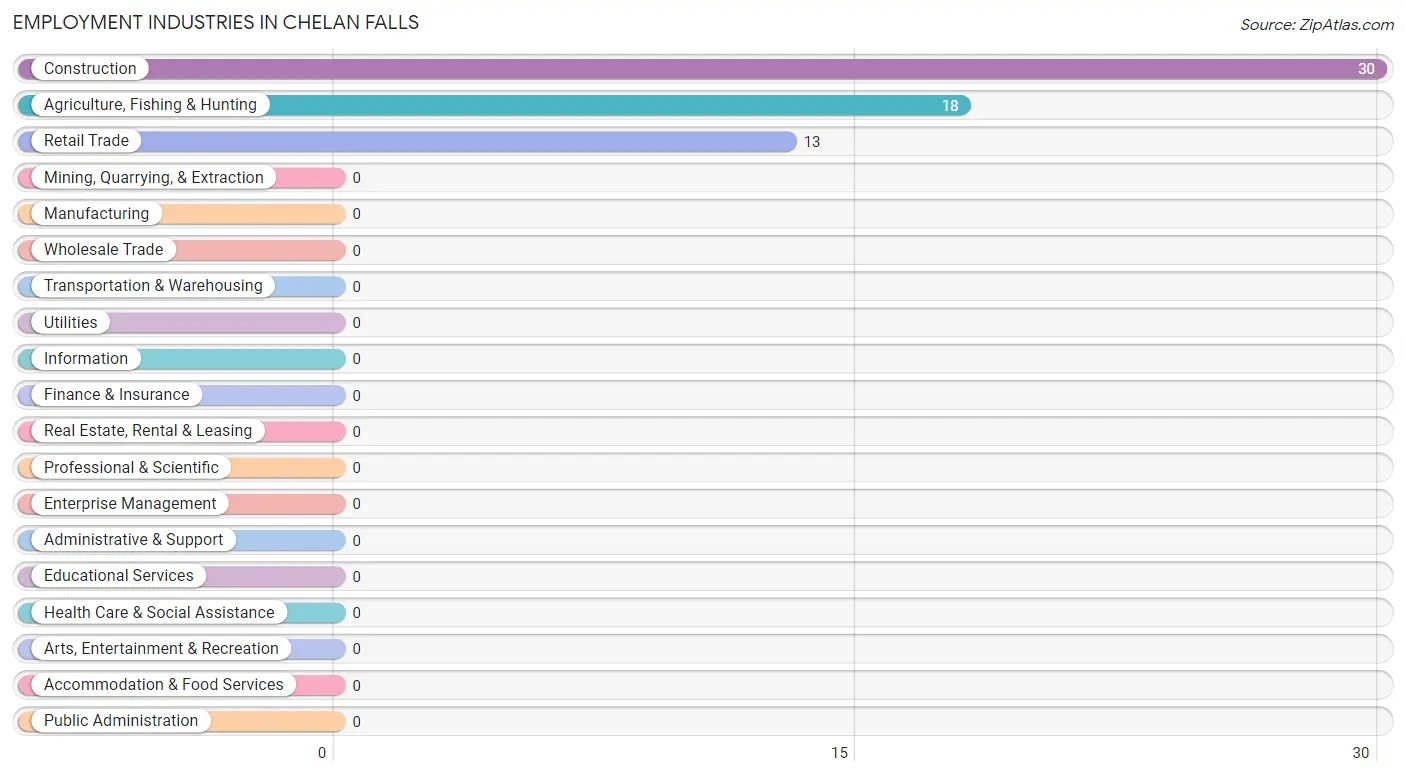
Employment Industries in Chelan Falls
The major employment industries in Chelan Falls include Construction (30 | 49.2%), Agriculture, Fishing & Hunting (18 | 29.5%), and Retail Trade (13 | 21.3%).
Employment Industries by Sex in Chelan Falls
Industry
Male
Female
Agriculture, Fishing & Hunting
18 (100.0%)
0 (0.0%)
Mining, Quarrying, & Extraction
0 (0.0%)
0 (0.0%)
Construction
30 (100.0%)
0 (0.0%)
Manufacturing
0 (0.0%)
0 (0.0%)
Wholesale Trade
0 (0.0%)
0 (0.0%)
Retail Trade
13 (100.0%)
0 (0.0%)
Transportation & Warehousing
0 (0.0%)
0 (0.0%)
Utilities
0 (0.0%)
0 (0.0%)
Information
0 (0.0%)
0 (0.0%)
Finance & Insurance
0 (0.0%)
0 (0.0%)
Real Estate, Rental & Leasing
0 (0.0%)
0 (0.0%)
Professional & Scientific
0 (0.0%)
0 (0.0%)
Enterprise Management
0 (0.0%)
0 (0.0%)
Administrative & Support
0 (0.0%)
0 (0.0%)
Educational Services
0 (0.0%)
0 (0.0%)
Health Care & Social Assistance
0 (0.0%)
0 (0.0%)
Arts, Entertainment & Recreation
0 (0.0%)
0 (0.0%)
Accommodation & Food Services
0 (0.0%)
0 (0.0%)
Public Administration
0 (0.0%)
0 (0.0%)
Total
61 (100.0%)
0 (0.0%)
Education in Chelan Falls
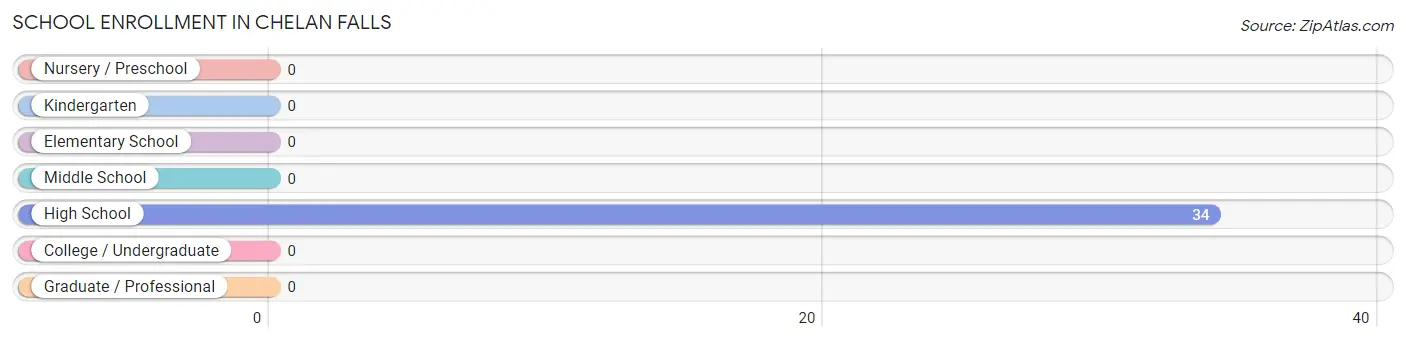
School Enrollment in Chelan Falls
School Level
# Students
% Students
Nursery / Preschool
0
0.0%
Kindergarten
0
0.0%
Elementary School
0
0.0%
Middle School
0
0.0%
High School
34
100.0%
College / Undergraduate
0
0.0%
Graduate / Professional
0
0.0%
Total
34
100.0%
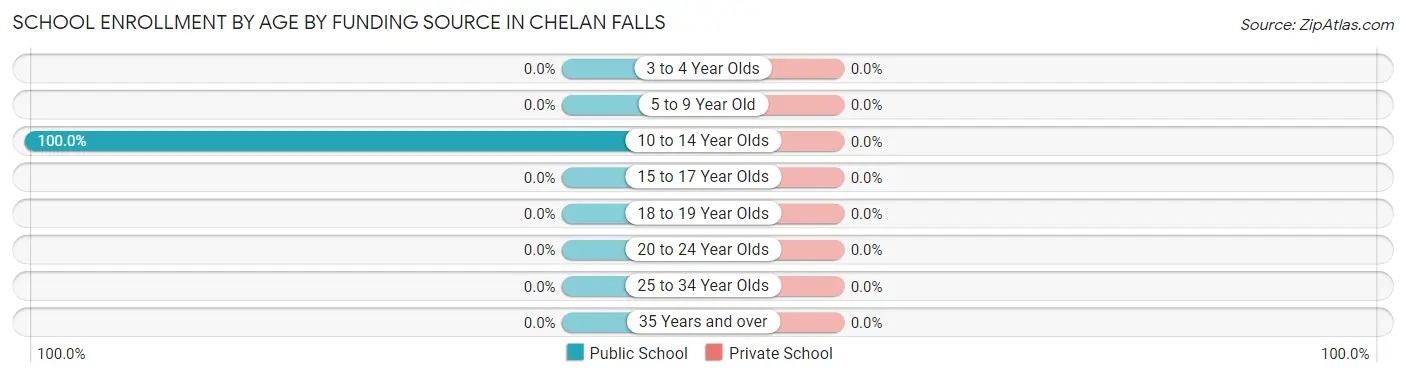
School Enrollment by Age by Funding Source in Chelan Falls
Age Bracket
Public School
Private School
3 to 4 Year Olds
0 (0.0%)
0 (0.0%)
5 to 9 Year Old
0 (0.0%)
0 (0.0%)
10 to 14 Year Olds
34 (100.0%)
0 (0.0%)
15 to 17 Year Olds
0 (0.0%)
0 (0.0%)
18 to 19 Year Olds
0 (0.0%)
0 (0.0%)
20 to 24 Year Olds
0 (0.0%)
0 (0.0%)
25 to 34 Year Olds
0 (0.0%)
0 (0.0%)
35 Years and over
0 (0.0%)
0 (0.0%)
Total
34 (100.0%)
0 (0.0%)
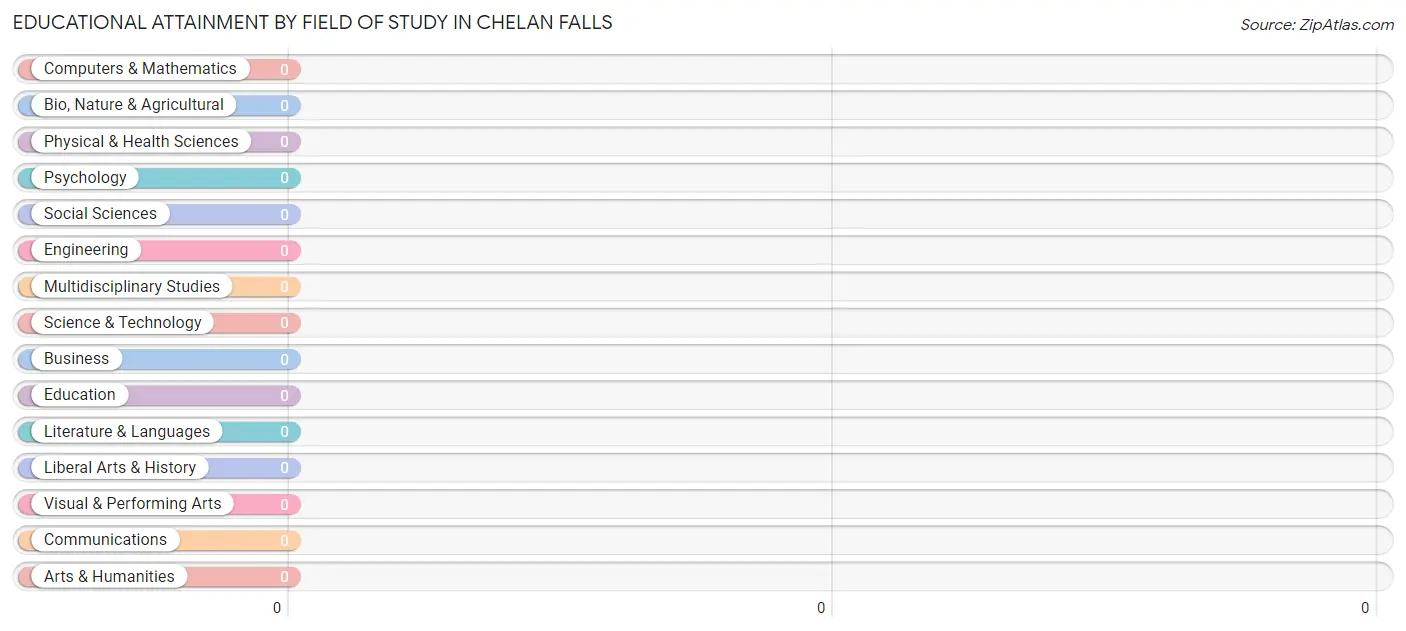
Educational Attainment by Field of Study in Chelan Falls
Field of Study
# Graduates
% Graduates
Computers & Mathematics
0
0.0%
Bio, Nature & Agricultural
0
0.0%
Physical & Health Sciences
0
0.0%
Psychology
0
0.0%
Social Sciences
0
0.0%
Engineering
0
0.0%
Multidisciplinary Studies
0
0.0%
Science & Technology
0
0.0%
Business
0
0.0%
Education
0
0.0%
Literature & Languages
0
0.0%
Liberal Arts & History
0
0.0%
Visual & Performing Arts
0
0.0%
Communications
0
0.0%
Arts & Humanities
0
0.0%
Total
0
0.0%
Transportation & Commute in Chelan Falls
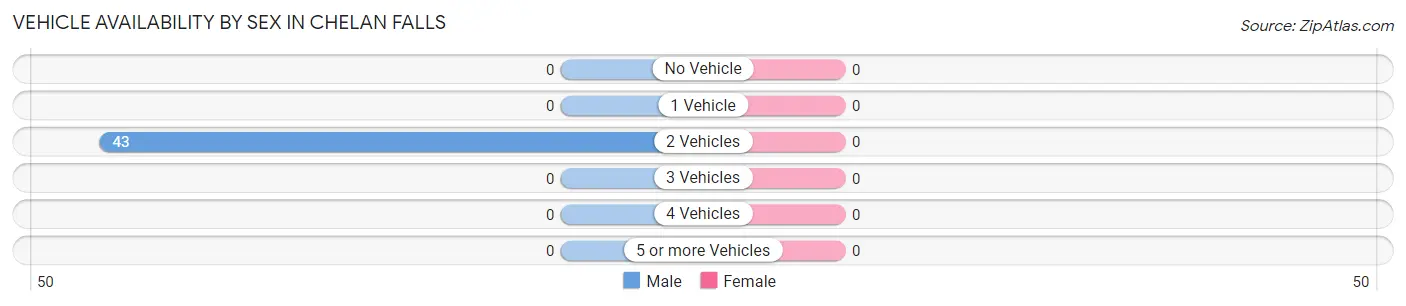
Vehicle Availability by Sex in Chelan Falls
Vehicles Available
Male
Female
No Vehicle
0 (0.0%)
0 (0.0%)
1 Vehicle
0 (0.0%)
0 (0.0%)
2 Vehicles
43 (100.0%)
0 (0.0%)
3 Vehicles
0 (0.0%)
0 (0.0%)
4 Vehicles
0 (0.0%)
0 (0.0%)
5 or more Vehicles
0 (0.0%)
0 (0.0%)
Total
43 (100.0%)
0 (0.0%)
Commute Time in Chelan Falls
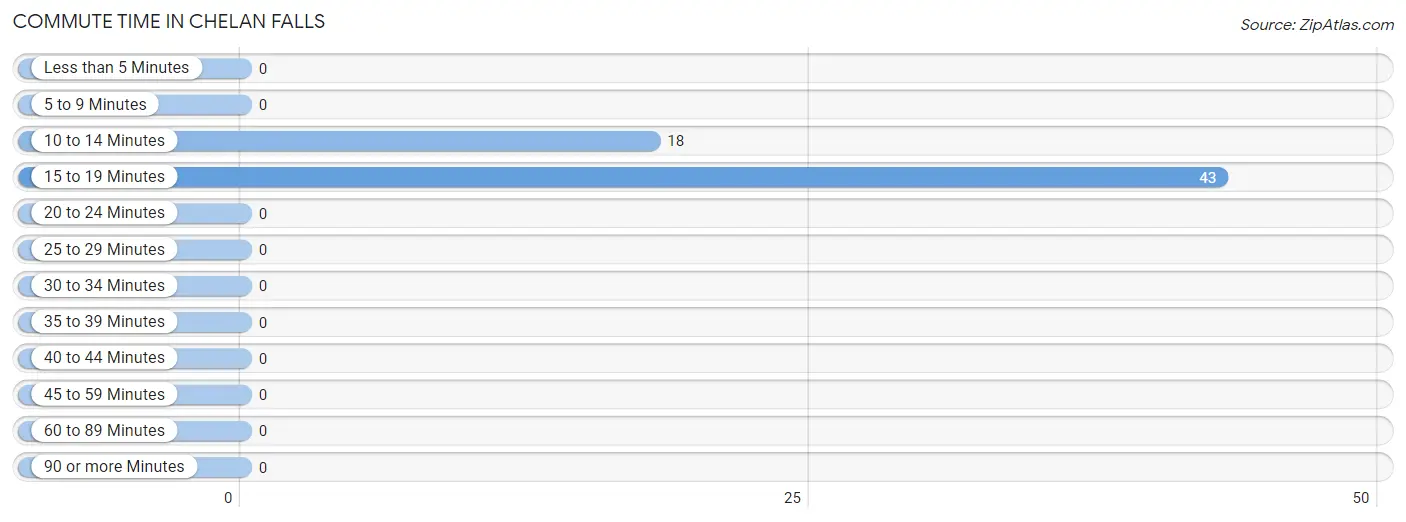
The most frequently occuring commute durations in Chelan Falls are 15 to 19 minutes (43 commuters, 70.5%), 10 to 14 minutes (18 commuters, 29.5%), and less than 5 minutes (0 commuters, 0.0%).
Commute Time
# Commuters
% Commuters
Less than 5 Minutes
0
0.0%
5 to 9 Minutes
0
0.0%
10 to 14 Minutes
18
29.5%
15 to 19 Minutes
43
70.5%
20 to 24 Minutes
0
0.0%
25 to 29 Minutes
0
0.0%
30 to 34 Minutes
0
0.0%
35 to 39 Minutes
0
0.0%
40 to 44 Minutes
0
0.0%
45 to 59 Minutes
0
0.0%
60 to 89 Minutes
0
0.0%
90 or more Minutes
0
0.0%
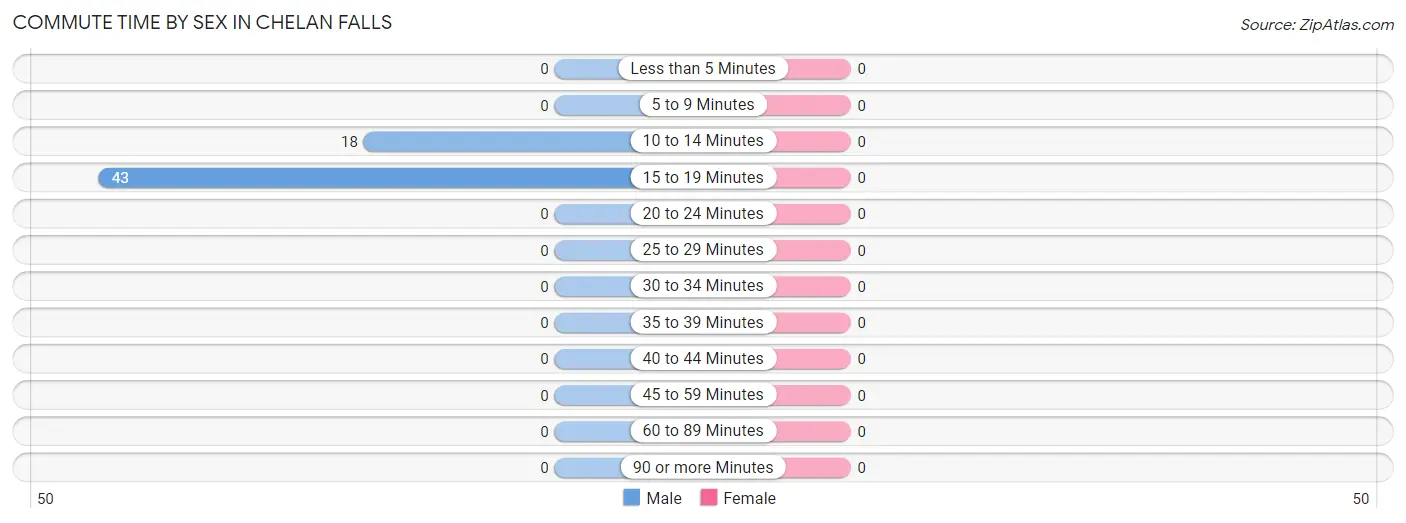
Commute Time by Sex in Chelan Falls
Commute Time
Male
Female
Less than 5 Minutes
0 (0.0%)
0 (0.0%)
5 to 9 Minutes
0 (0.0%)
0 (0.0%)
10 to 14 Minutes
18 (29.5%)
0 (0.0%)
15 to 19 Minutes
43 (70.5%)
0 (0.0%)
20 to 24 Minutes
0 (0.0%)
0 (0.0%)
25 to 29 Minutes
0 (0.0%)
0 (0.0%)
30 to 34 Minutes
0 (0.0%)
0 (0.0%)
35 to 39 Minutes
0 (0.0%)
0 (0.0%)
40 to 44 Minutes
0 (0.0%)
0 (0.0%)
45 to 59 Minutes
0 (0.0%)
0 (0.0%)
60 to 89 Minutes
0 (0.0%)
0 (0.0%)
90 or more Minutes
0 (0.0%)
0 (0.0%)
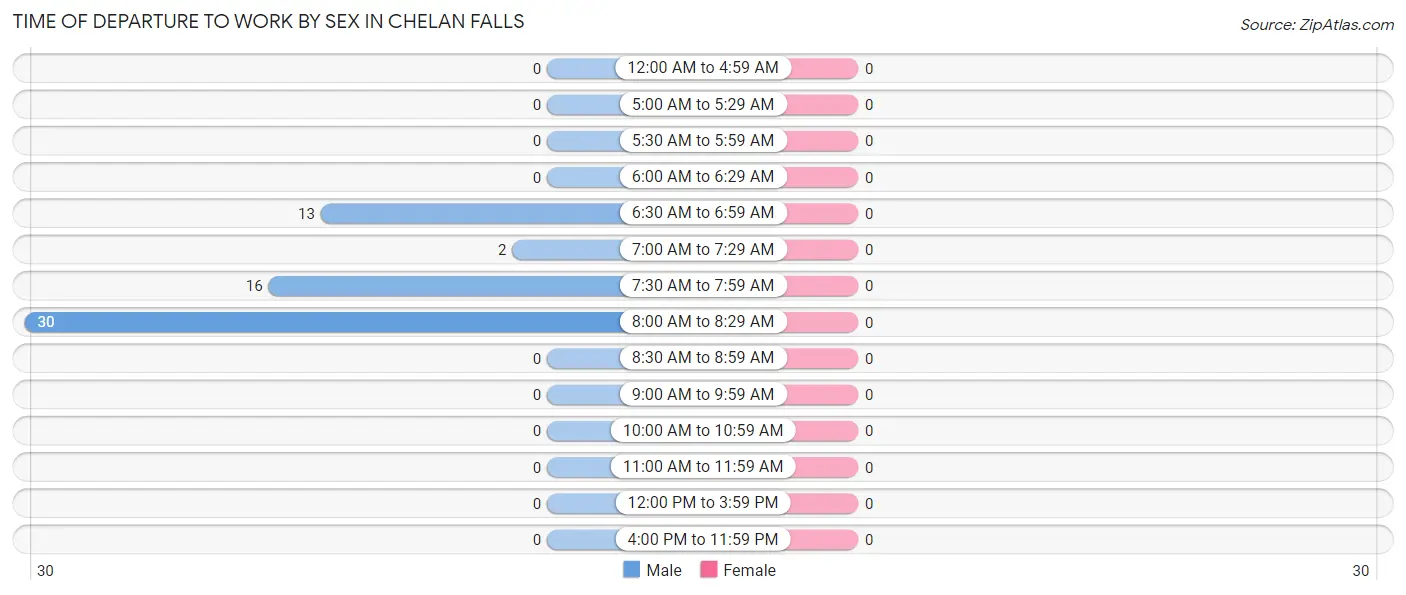
Time of Departure to Work by Sex in Chelan Falls
Time of Departure
Male
Female
12:00 AM to 4:59 AM
0 (0.0%)
0 (0.0%)
5:00 AM to 5:29 AM
0 (0.0%)
0 (0.0%)
5:30 AM to 5:59 AM
0 (0.0%)
0 (0.0%)
6:00 AM to 6:29 AM
0 (0.0%)
0 (0.0%)
6:30 AM to 6:59 AM
13 (21.3%)
0 (0.0%)
7:00 AM to 7:29 AM
2 (3.3%)
0 (0.0%)
7:30 AM to 7:59 AM
16 (26.2%)
0 (0.0%)
8:00 AM to 8:29 AM
30 (49.2%)
0 (0.0%)
8:30 AM to 8:59 AM
0 (0.0%)
0 (0.0%)
9:00 AM to 9:59 AM
0 (0.0%)
0 (0.0%)
10:00 AM to 10:59 AM
0 (0.0%)
0 (0.0%)
11:00 AM to 11:59 AM
0 (0.0%)
0 (0.0%)
12:00 PM to 3:59 PM
0 (0.0%)
0 (0.0%)
4:00 PM to 11:59 PM
0 (0.0%)
0 (0.0%)
Total
61 (100.0%)
0 (0.0%)
Housing Occupancy in Chelan Falls
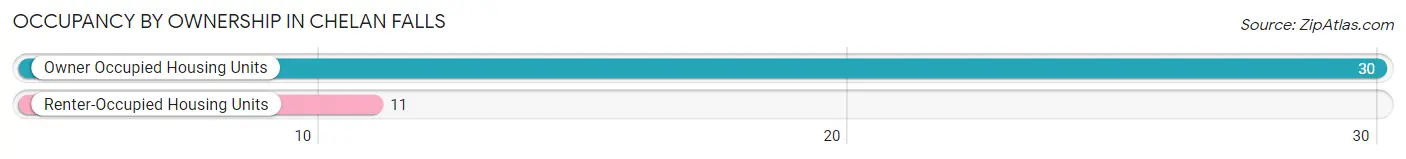
Occupancy by Ownership in Chelan Falls
Of the total 41 dwellings in Chelan Falls, owner-occupied units account for 30 (73.2%), while renter-occupied units make up 11 (26.8%).
Occupancy
# Housing Units
% Housing Units
Owner Occupied Housing Units
30
73.2%
Renter-Occupied Housing Units
11
26.8%
Total Occupied Housing Units
41
100.0%
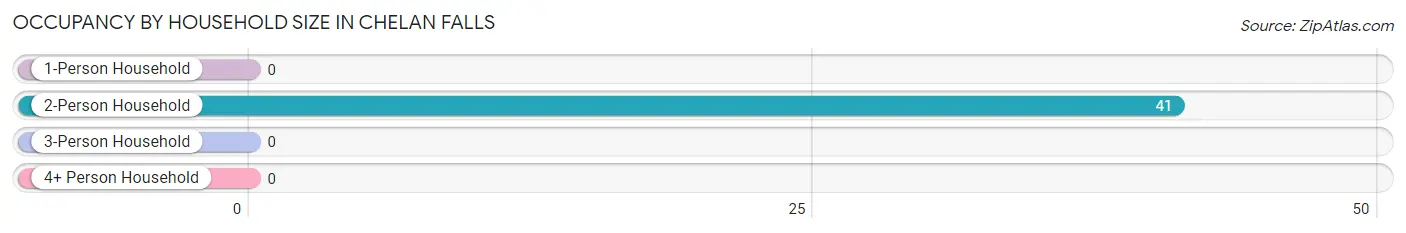
Occupancy by Household Size in Chelan Falls
Household Size
# Housing Units
% Housing Units
1-Person Household
0
0.0%
2-Person Household
41
100.0%
3-Person Household
0
0.0%
4+ Person Household
0
0.0%
Total Housing Units
41
100.0%
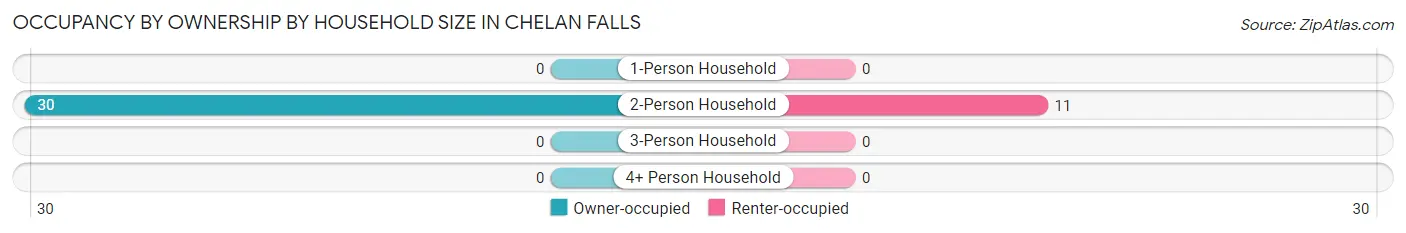
Occupancy by Ownership by Household Size in Chelan Falls
Household Size
Owner-occupied
Renter-occupied
1-Person Household
0 (0.0%)
0 (0.0%)
2-Person Household
30 (73.2%)
11 (26.8%)
3-Person Household
0 (0.0%)
0 (0.0%)
4+ Person Household
0 (0.0%)
0 (0.0%)
Total Housing Units
30 (73.2%)
11 (26.8%)
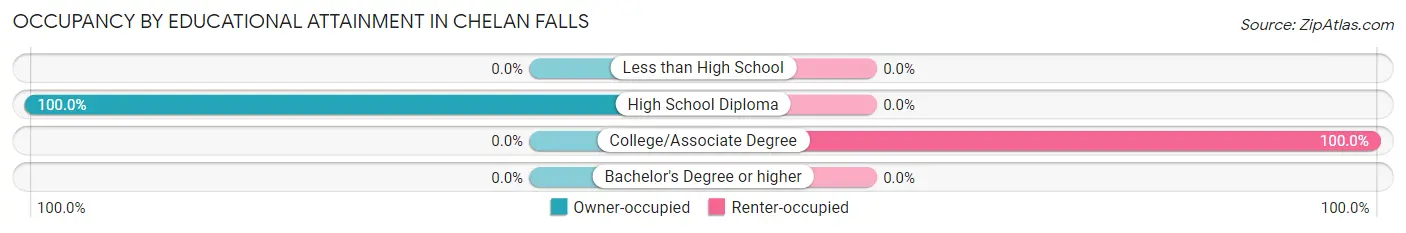
Occupancy by Educational Attainment in Chelan Falls
Household Size
Owner-occupied
Renter-occupied
Less than High School
0 (0.0%)
0 (0.0%)
High School Diploma
30 (100.0%)
0 (0.0%)
College/Associate Degree
0 (0.0%)
11 (100.0%)
Bachelor's Degree or higher
0 (0.0%)
0 (0.0%)
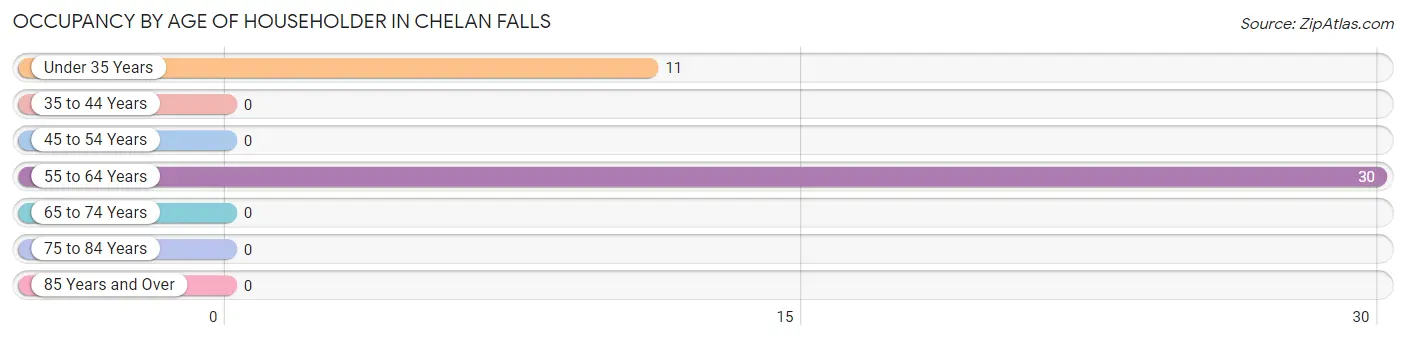
Occupancy by Age of Householder in Chelan Falls
Age Bracket
# Households
% Households
Under 35 Years
11
26.8%
35 to 44 Years
0
0.0%
45 to 54 Years
0
0.0%
55 to 64 Years
30
73.2%
65 to 74 Years
0
0.0%
75 to 84 Years
0
0.0%
85 Years and Over
0
0.0%
Total
41
100.0%
Housing Finances in Chelan Falls
Median Income by Occupancy in Chelan Falls
Occupancy Type
# Households
Median Income
Owner-Occupied
30 (73.2%)
$0
Renter-Occupied
11 (26.8%)
$0
Average
41 (100.0%)
$0
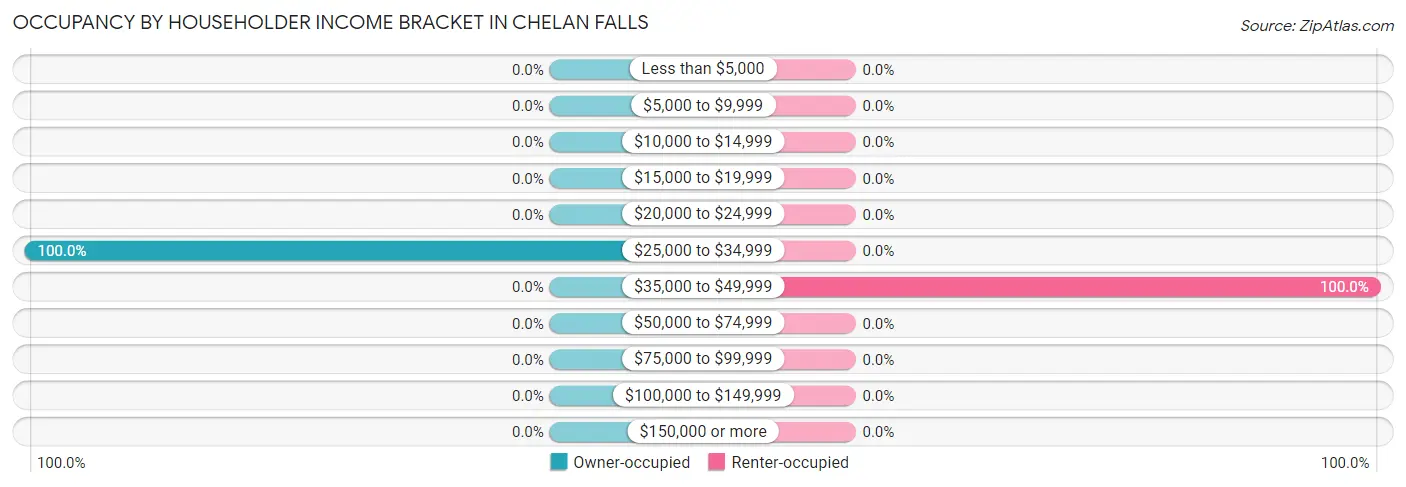
Occupancy by Householder Income Bracket in Chelan Falls
Income Bracket
Owner-occupied
Renter-occupied
Less than $5,000
0 (0.0%)
0 (0.0%)
$5,000 to $9,999
0 (0.0%)
0 (0.0%)
$10,000 to $14,999
0 (0.0%)
0 (0.0%)
$15,000 to $19,999
0 (0.0%)
0 (0.0%)
$20,000 to $24,999
0 (0.0%)
0 (0.0%)
$25,000 to $34,999
30 (100.0%)
0 (0.0%)
$35,000 to $49,999
0 (0.0%)
11 (100.0%)
$50,000 to $74,999
0 (0.0%)
0 (0.0%)
$75,000 to $99,999
0 (0.0%)
0 (0.0%)
$100,000 to $149,999
0 (0.0%)
0 (0.0%)
$150,000 or more
0 (0.0%)
0 (0.0%)
Total
30 (100.0%)
11 (100.0%)
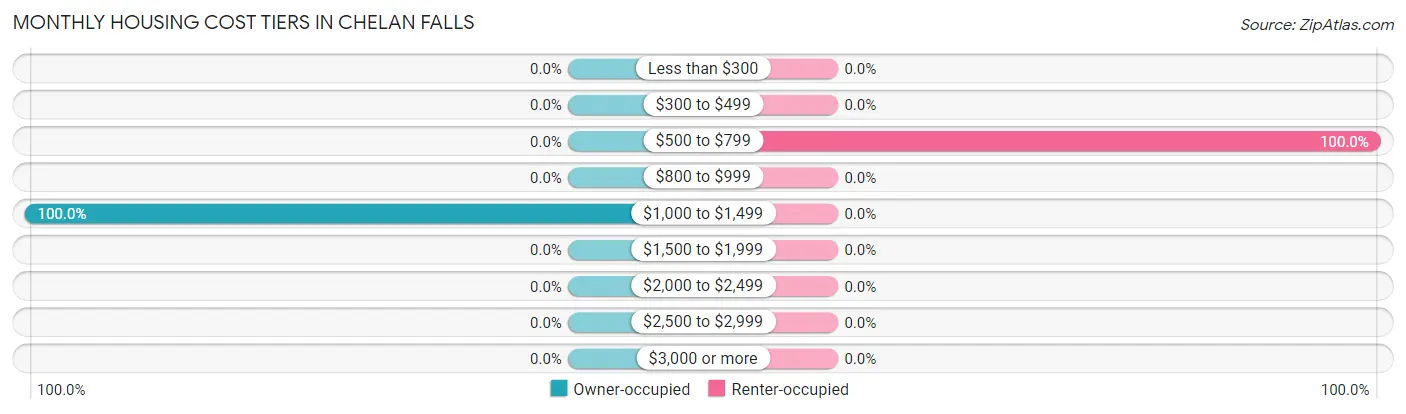
Monthly Housing Cost Tiers in Chelan Falls
Monthly Cost
Owner-occupied
Renter-occupied
Less than $300
0 (0.0%)
0 (0.0%)
$300 to $499
0 (0.0%)
0 (0.0%)
$500 to $799
0 (0.0%)
11 (100.0%)
$800 to $999
0 (0.0%)
0 (0.0%)
$1,000 to $1,499
30 (100.0%)
0 (0.0%)
$1,500 to $1,999
0 (0.0%)
0 (0.0%)
$2,000 to $2,499
0 (0.0%)
0 (0.0%)
$2,500 to $2,999
0 (0.0%)
0 (0.0%)
$3,000 or more
0 (0.0%)
0 (0.0%)
Total
30 (100.0%)
11 (100.0%)
Physical Housing Characteristics in Chelan Falls
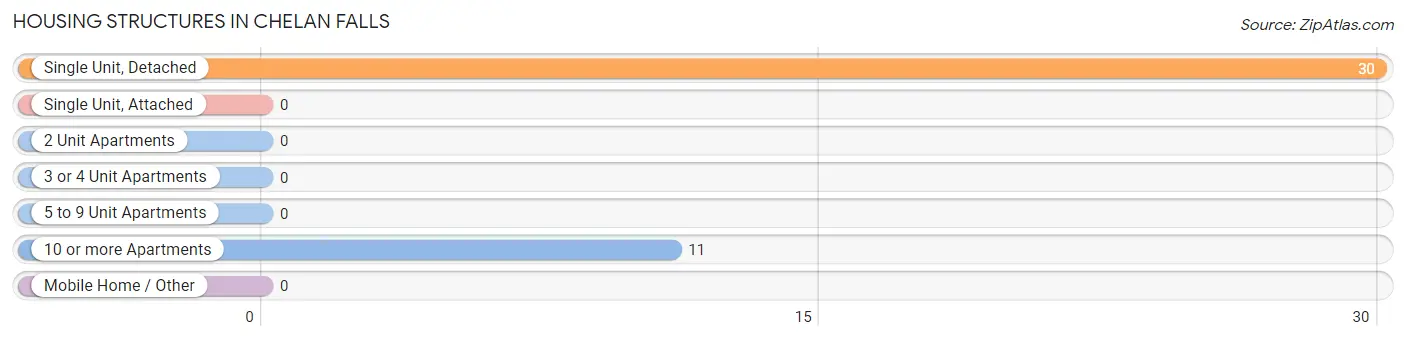
Housing Structures in Chelan Falls
Structure Type
# Housing Units
% Housing Units
Single Unit, Detached
30
73.2%
Single Unit, Attached
0
0.0%
2 Unit Apartments
0
0.0%
3 or 4 Unit Apartments
0
0.0%
5 to 9 Unit Apartments
0
0.0%
10 or more Apartments
11
26.8%
Mobile Home / Other
0
0.0%
Total
41
100.0%
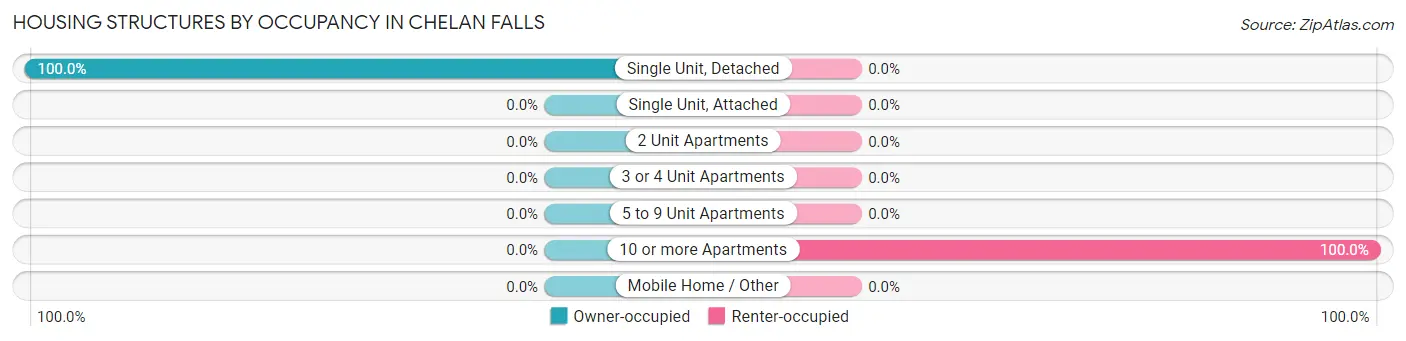
Housing Structures by Occupancy in Chelan Falls
Structure Type
Owner-occupied
Renter-occupied
Single Unit, Detached
30 (100.0%)
0 (0.0%)
Single Unit, Attached
0 (0.0%)
0 (0.0%)
2 Unit Apartments
0 (0.0%)
0 (0.0%)
3 or 4 Unit Apartments
0 (0.0%)
0 (0.0%)
5 to 9 Unit Apartments
0 (0.0%)
0 (0.0%)
10 or more Apartments
0 (0.0%)
11 (100.0%)
Mobile Home / Other
0 (0.0%)
0 (0.0%)
Total
30 (73.2%)
11 (26.8%)
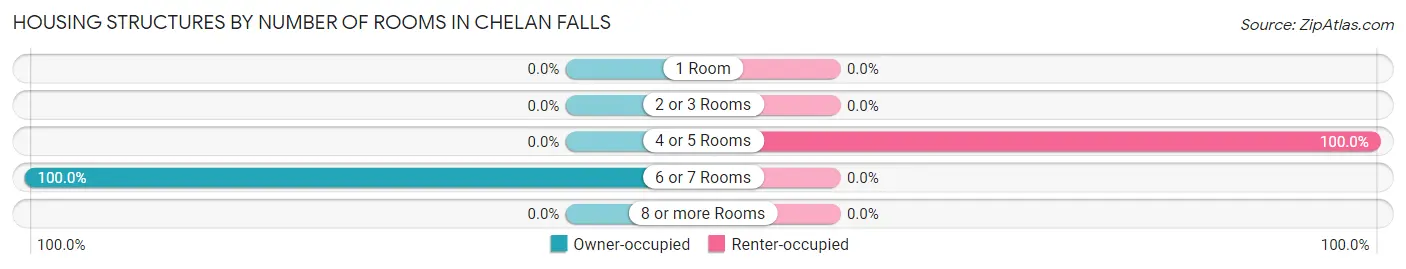
Housing Structures by Number of Rooms in Chelan Falls
Number of Rooms
Owner-occupied
Renter-occupied
1 Room
0 (0.0%)
0 (0.0%)
2 or 3 Rooms
0 (0.0%)
0 (0.0%)
4 or 5 Rooms
0 (0.0%)
11 (100.0%)
6 or 7 Rooms
30 (100.0%)
0 (0.0%)
8 or more Rooms
0 (0.0%)
0 (0.0%)
Total
30 (100.0%)
11 (100.0%)
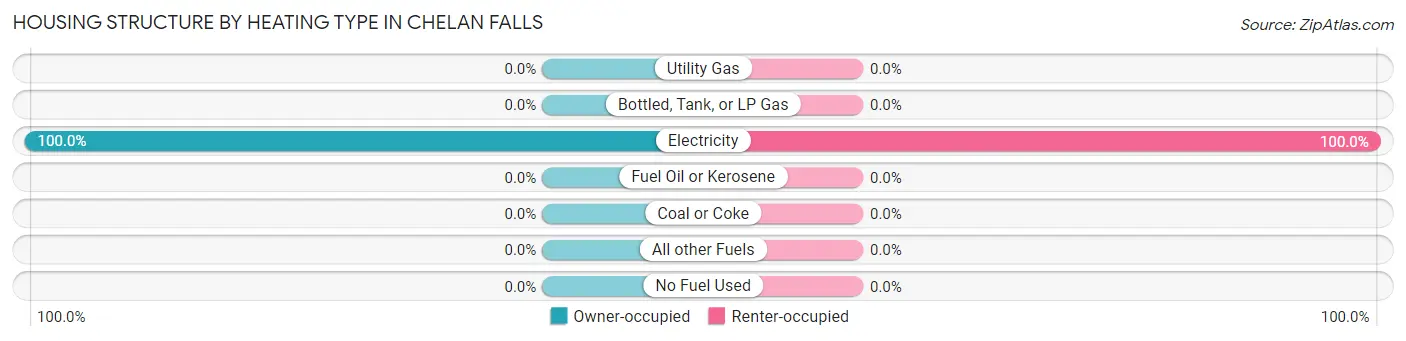
Housing Structure by Heating Type in Chelan Falls
Heating Type
Owner-occupied
Renter-occupied
Utility Gas
0 (0.0%)
0 (0.0%)
Bottled, Tank, or LP Gas
0 (0.0%)
0 (0.0%)
Electricity
30 (100.0%)
11 (100.0%)
Fuel Oil or Kerosene
0 (0.0%)
0 (0.0%)
Coal or Coke
0 (0.0%)
0 (0.0%)
All other Fuels
0 (0.0%)
0 (0.0%)
No Fuel Used
0 (0.0%)
0 (0.0%)
Total
30 (100.0%)
11 (100.0%)
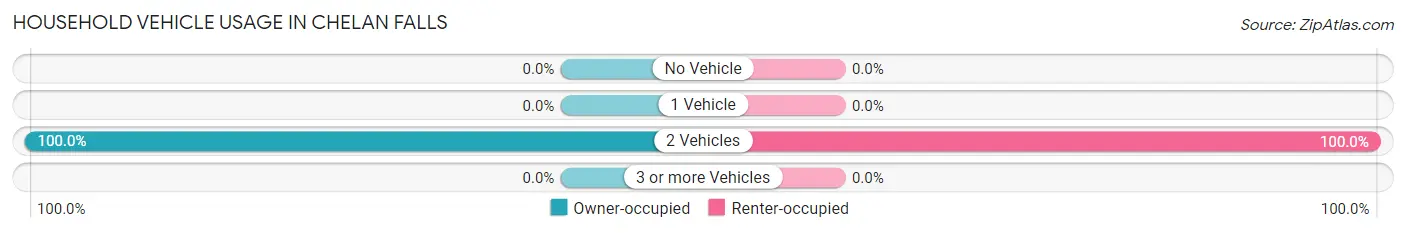
Household Vehicle Usage in Chelan Falls
Vehicles per Household
Owner-occupied
Renter-occupied
No Vehicle
0 (0.0%)
0 (0.0%)
1 Vehicle
0 (0.0%)
0 (0.0%)
2 Vehicles
30 (100.0%)
11 (100.0%)
3 or more Vehicles
0 (0.0%)
0 (0.0%)
Total
30 (100.0%)
11 (100.0%)
Real Estate & Mortgages in Chelan Falls
Real Estate and Mortgage Overview in Chelan Falls
Characteristic
Without Mortgage
With Mortgage
Housing Units
0
30
Median Property Value
-
-
Median Household Income
-
-
Monthly Housing Costs
-
-
Real Estate Taxes
-
-
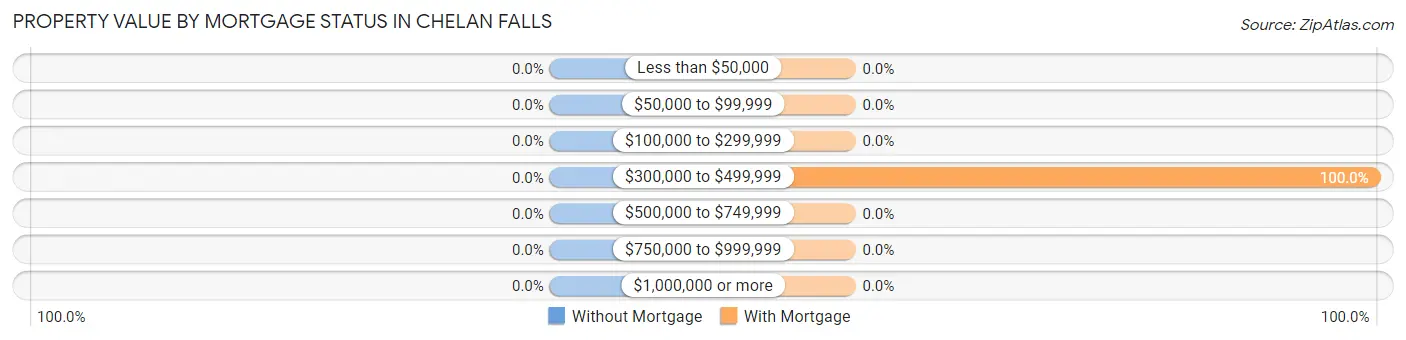
Property Value by Mortgage Status in Chelan Falls
Property Value
Without Mortgage
With Mortgage
Less than $50,000
0 (0.0%)
0 (0.0%)
$50,000 to $99,999
0 (0.0%)
0 (0.0%)
$100,000 to $299,999
0 (0.0%)
0 (0.0%)
$300,000 to $499,999
0 (0.0%)
30 (100.0%)
$500,000 to $749,999
0 (0.0%)
0 (0.0%)
$750,000 to $999,999
0 (0.0%)
0 (0.0%)
$1,000,000 or more
0 (0.0%)
0 (0.0%)
Total
0 (0.0%)
30 (100.0%)
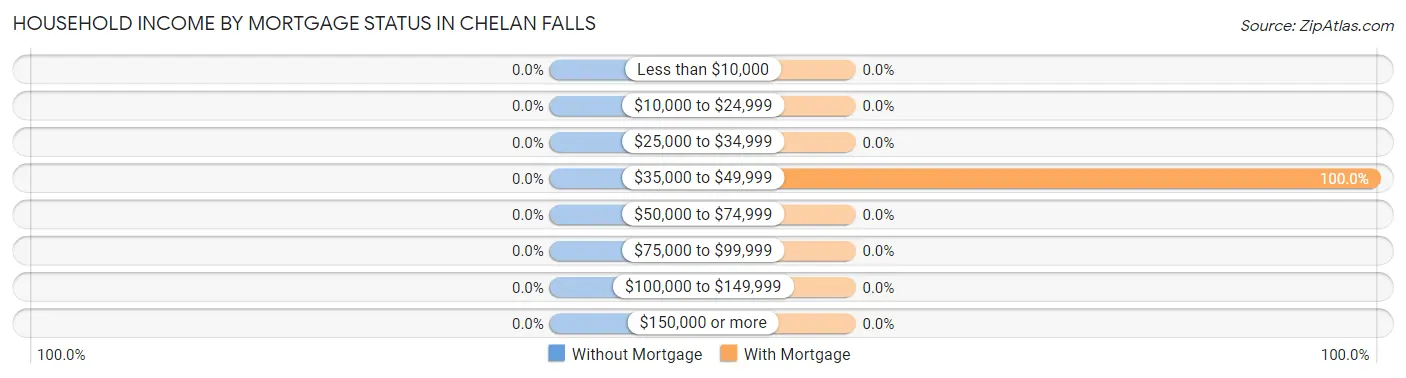
Household Income by Mortgage Status in Chelan Falls
Household Income
Without Mortgage
With Mortgage
Less than $10,000
0 (0.0%)
0 (0.0%)
$10,000 to $24,999
0 (0.0%)
0 (0.0%)
$25,000 to $34,999
0 (0.0%)
0 (0.0%)
$35,000 to $49,999
0 (0.0%)
30 (100.0%)
$50,000 to $74,999
0 (0.0%)
0 (0.0%)
$75,000 to $99,999
0 (0.0%)
0 (0.0%)
$100,000 to $149,999
0 (0.0%)
0 (0.0%)
$150,000 or more
0 (0.0%)
0 (0.0%)
Total
0 (0.0%)
30 (100.0%)
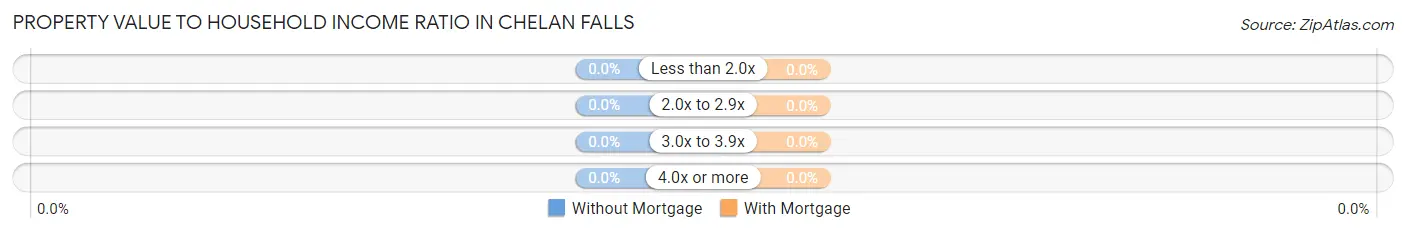
Property Value to Household Income Ratio in Chelan Falls
Value-to-Income Ratio
Without Mortgage
With Mortgage
Less than 2.0x
0 (0.0%)
0 (0.0%)
2.0x to 2.9x
0 (0.0%)
0 (0.0%)
3.0x to 3.9x
0 (0.0%)
0 (0.0%)
4.0x or more
0 (0.0%)
0 (0.0%)
Total
0 (0.0%)
30 (100.0%)
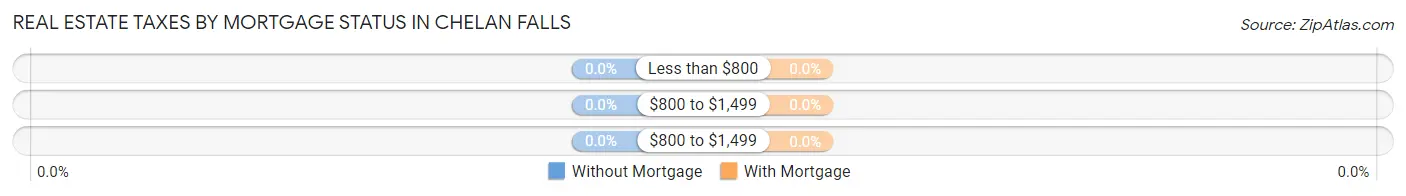
Real Estate Taxes by Mortgage Status in Chelan Falls
Property Taxes
Without Mortgage
With Mortgage
Less than $800
0 (0.0%)
0 (0.0%)
$800 to $1,499
0 (0.0%)
0 (0.0%)
$800 to $1,499
0 (0.0%)
0 (0.0%)
Total
0 (0.0%)
30 (100.0%)
Health & Disability in Chelan Falls
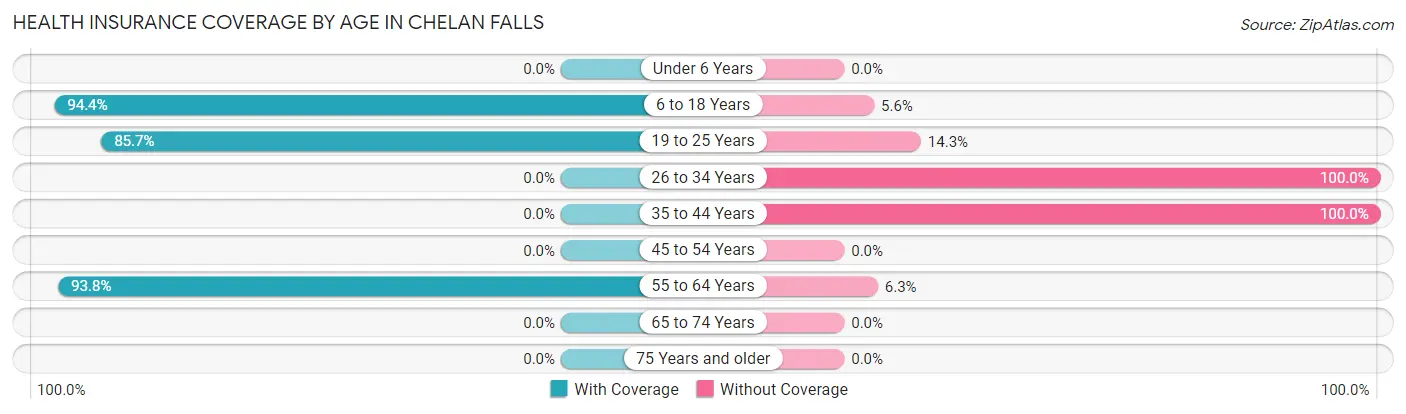
Health Insurance Coverage by Age in Chelan Falls
Age Bracket
With Coverage
Without Coverage
Under 6 Years
0 (0.0%)
0 (0.0%)
6 to 18 Years
34 (94.4%)
2 (5.6%)
19 to 25 Years
24 (85.7%)
4 (14.3%)
26 to 34 Years
0 (0.0%)
6 (100.0%)
35 to 44 Years
0 (0.0%)
4 (100.0%)
45 to 54 Years
0 (0.0%)
0 (0.0%)
55 to 64 Years
30 (93.8%)
2 (6.2%)
65 to 74 Years
0 (0.0%)
0 (0.0%)
75 Years and older
0 (0.0%)
0 (0.0%)
Total
88 (83.0%)
18 (17.0%)
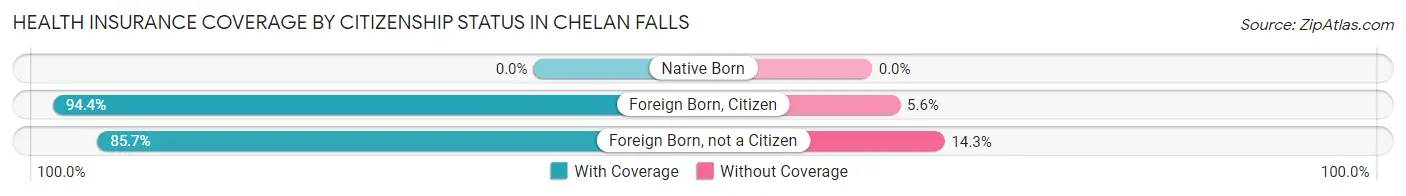
Health Insurance Coverage by Citizenship Status in Chelan Falls
Citizenship Status
With Coverage
Without Coverage
Native Born
0 (0.0%)
0 (0.0%)
Foreign Born, Citizen
34 (94.4%)
2 (5.6%)
Foreign Born, not a Citizen
24 (85.7%)
4 (14.3%)
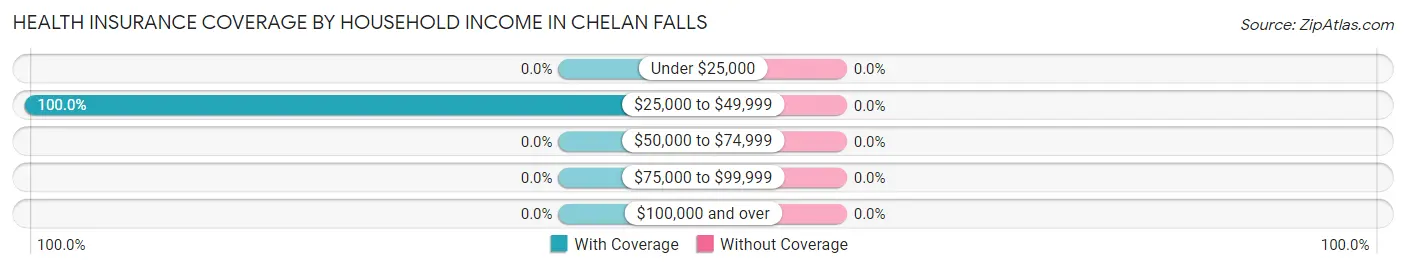
Health Insurance Coverage by Household Income in Chelan Falls
Household Income
With Coverage
Without Coverage
Under $25,000
0 (0.0%)
0 (0.0%)
$25,000 to $49,999
88 (100.0%)
0 (0.0%)
$50,000 to $74,999
0 (0.0%)
0 (0.0%)
$75,000 to $99,999
0 (0.0%)
0 (0.0%)
$100,000 and over
0 (0.0%)
0 (0.0%)
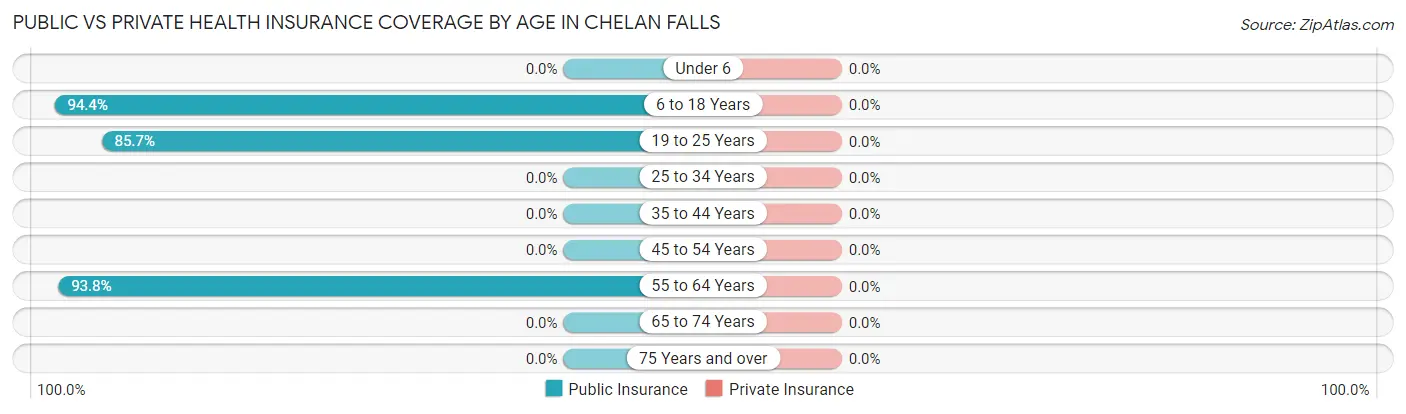
Public vs Private Health Insurance Coverage by Age in Chelan Falls
Age Bracket
Public Insurance
Private Insurance
Under 6
0 (0.0%)
0 (0.0%)
6 to 18 Years
34 (94.4%)
0 (0.0%)
19 to 25 Years
24 (85.7%)
0 (0.0%)
25 to 34 Years
0 (0.0%)
0 (0.0%)
35 to 44 Years
0 (0.0%)
0 (0.0%)
45 to 54 Years
0 (0.0%)
0 (0.0%)
55 to 64 Years
30 (93.8%)
0 (0.0%)
65 to 74 Years
0 (0.0%)
0 (0.0%)
75 Years and over
0 (0.0%)
0 (0.0%)
Total
88 (83.0%)
0 (0.0%)
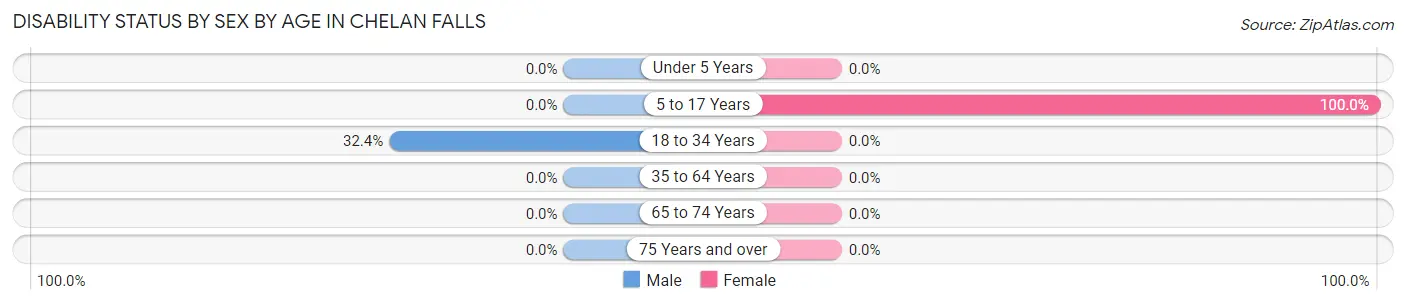
Disability Status by Sex by Age in Chelan Falls
Age Bracket
Male
Female
Under 5 Years
0 (0.0%)
0 (0.0%)
5 to 17 Years
0 (0.0%)
34 (100.0%)
18 to 34 Years
11 (32.4%)
0 (0.0%)
35 to 64 Years
0 (0.0%)
0 (0.0%)
65 to 74 Years
0 (0.0%)
0 (0.0%)
75 Years and over
0 (0.0%)
0 (0.0%)
Disability Class by Sex by Age in Chelan Falls
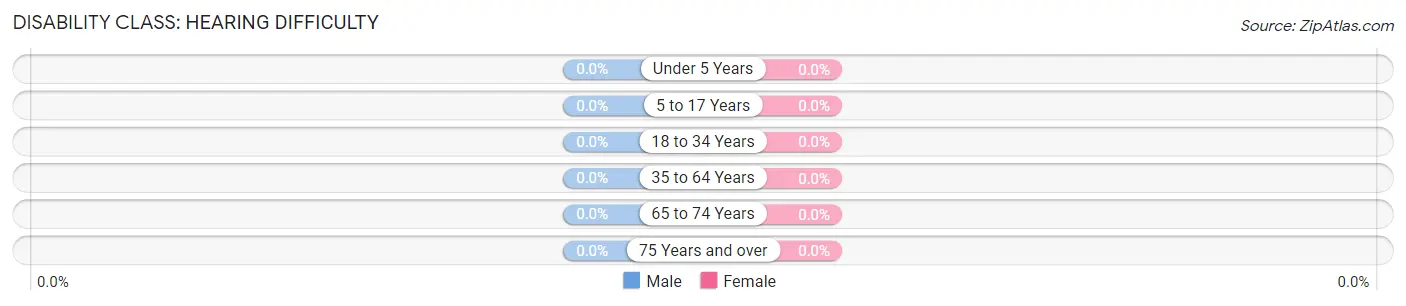
Disability Class: Hearing Difficulty
Age Bracket
Male
Female
Under 5 Years
0 (0.0%)
0 (0.0%)
5 to 17 Years
0 (0.0%)
0 (0.0%)
18 to 34 Years
0 (0.0%)
0 (0.0%)
35 to 64 Years
0 (0.0%)
0 (0.0%)
65 to 74 Years
0 (0.0%)
0 (0.0%)
75 Years and over
0 (0.0%)
0 (0.0%)
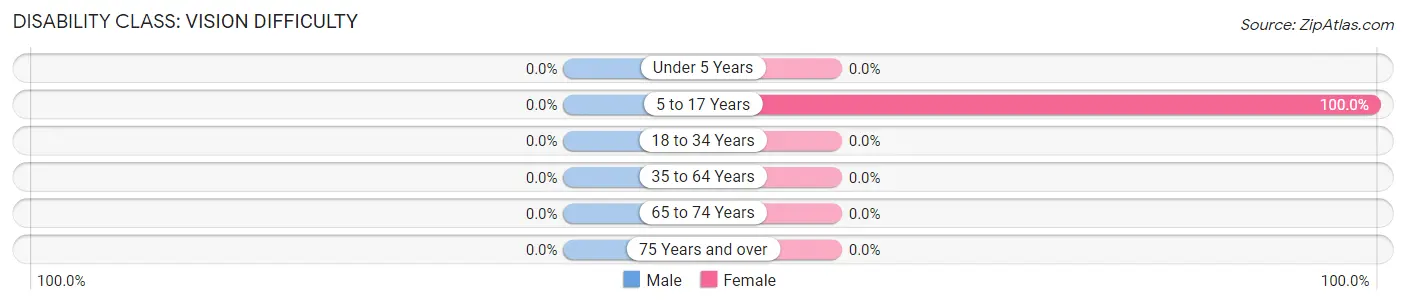
Disability Class: Vision Difficulty
Age Bracket
Male
Female
Under 5 Years
0 (0.0%)
0 (0.0%)
5 to 17 Years
0 (0.0%)
34 (100.0%)
18 to 34 Years
0 (0.0%)
0 (0.0%)
35 to 64 Years
0 (0.0%)
0 (0.0%)
65 to 74 Years
0 (0.0%)
0 (0.0%)
75 Years and over
0 (0.0%)
0 (0.0%)
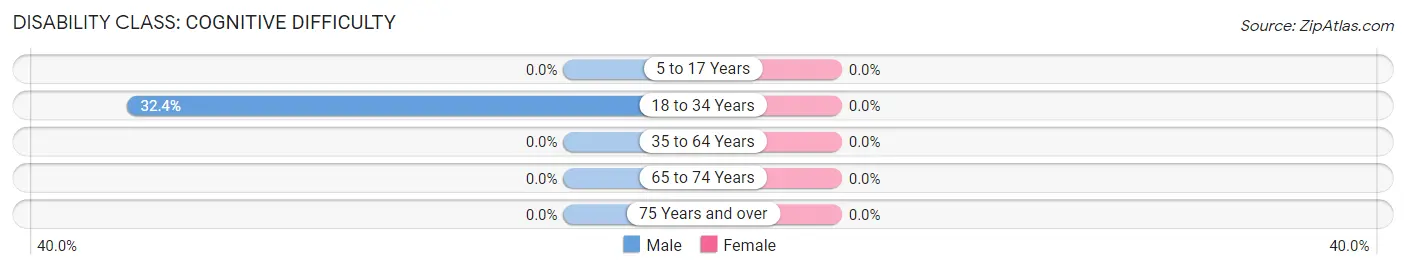
Disability Class: Cognitive Difficulty
Age Bracket
Male
Female
5 to 17 Years
0 (0.0%)
0 (0.0%)
18 to 34 Years
11 (32.4%)
0 (0.0%)
35 to 64 Years
0 (0.0%)
0 (0.0%)
65 to 74 Years
0 (0.0%)
0 (0.0%)
75 Years and over
0 (0.0%)
0 (0.0%)
Disability Class: Ambulatory Difficulty
Age Bracket
Male
Female
5 to 17 Years
0 (0.0%)
0 (0.0%)
18 to 34 Years
0 (0.0%)
0 (0.0%)
35 to 64 Years
0 (0.0%)
0 (0.0%)
65 to 74 Years
0 (0.0%)
0 (0.0%)
75 Years and over
0 (0.0%)
0 (0.0%)
Disability Class: Self-Care Difficulty
Age Bracket
Male
Female
5 to 17 Years
0 (0.0%)
0 (0.0%)
18 to 34 Years
0 (0.0%)
0 (0.0%)
35 to 64 Years
0 (0.0%)
0 (0.0%)
65 to 74 Years
0 (0.0%)
0 (0.0%)
75 Years and over
0 (0.0%)
0 (0.0%)
Technology Access in Chelan Falls
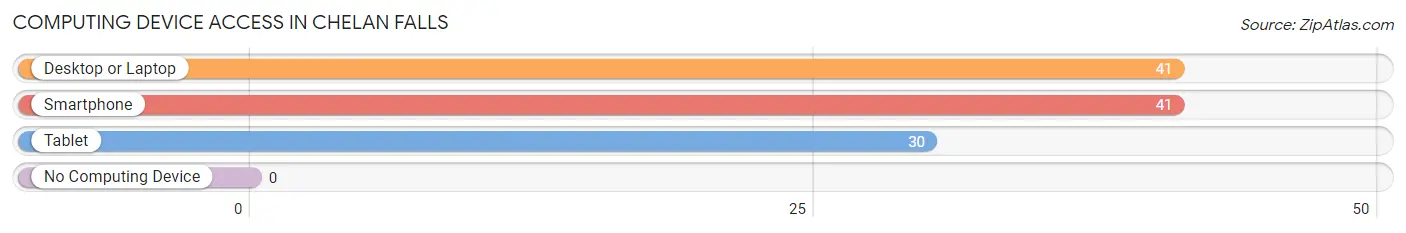
Computing Device Access in Chelan Falls
Device Type
# Households
% Households
Desktop or Laptop
41
100.0%
Smartphone
41
100.0%
Tablet
30
73.2%
No Computing Device
0
0.0%
Total
41
100.0%
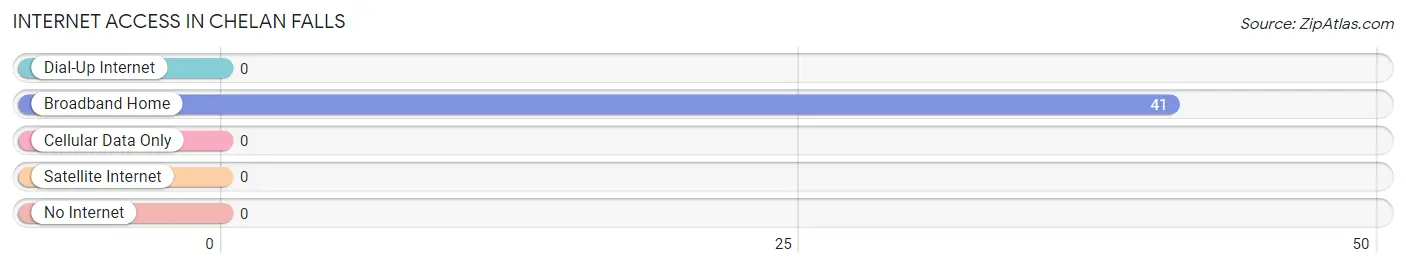
Internet Access in Chelan Falls
Internet Type
# Households
% Households
Dial-Up Internet
0
0.0%
Broadband Home
41
100.0%
Cellular Data Only
0
0.0%
Satellite Internet
0
0.0%
No Internet
0
0.0%
Total
41
100.0%
Chelan Falls Summary
Chelan Falls, Washington is a small town located in Chelan County, Washington, United States. It is situated on the eastern shore of Lake Chelan, a large glacial lake in the Cascade Mountains. The town is located at the confluence of the Wenatchee and Chelan Rivers, and is the gateway to the Lake Chelan National Recreation Area. The population of Chelan Falls was 1,093 at the 2010 census.
History
The area around Chelan Falls has been inhabited by Native Americans for thousands of years. The Wenatchi people were the first to settle in the area, and the Chelan people later joined them. The first non-native settlers arrived in the area in the late 1800s, and the town of Chelan Falls was officially established in 1891.
The town was named after the nearby Chelan Falls, which were created by the construction of the Chelan Dam in the early 1900s. The dam was built to provide hydroelectric power to the region, and the town quickly grew as a result. By the 1920s, the town had become a popular tourist destination, and it was incorporated in 1924.
Geography
Chelan Falls is located in the Cascade Mountains of Washington State, at the confluence of the Wenatchee and Chelan Rivers. The town is situated on the eastern shore of Lake Chelan, a large glacial lake. The town is surrounded by mountains, and is located at an elevation of 1,890 feet (576 m).
The climate in Chelan Falls is generally mild, with warm summers and cool winters. The average annual temperature is 48°F (9°C), and the average annual precipitation is 16.5 inches (419 mm).
Economy
The economy of Chelan Falls is largely based on tourism and recreation. The town is a popular destination for outdoor activities such as fishing, boating, and hiking. The nearby Lake Chelan National Recreation Area is a popular destination for visitors, and the town is also home to several wineries and vineyards.
The town is also home to several businesses, including restaurants, retail stores, and lodging. The town is served by the Chelan County Airport, which provides air service to Seattle and other nearby cities.
Demographics
As of the 2010 census, the population of Chelan Falls was 1,093. The racial makeup of the town was 94.3% White, 0.7% Native American, 0.6% Asian, 0.3% African American, 0.1% Pacific Islander, and 3.0% from other races. The median household income was $41,250, and the median family income was $48,750.
Conclusion
Chelan Falls, Washington is a small town located in Chelan County, Washington, United States. It is situated on the eastern shore of Lake Chelan, a large glacial lake in the Cascade Mountains. The town is located at the confluence of the Wenatchee and Chelan Rivers, and is the gateway to the Lake Chelan National Recreation Area. The population of Chelan Falls was 1,093 at the 2010 census. The economy of Chelan Falls is largely based on tourism and recreation, and the town is a popular destination for outdoor activities such as fishing, boating, and hiking. The racial makeup of the town was 94.3% White, 0.7% Native American, 0.6% Asian, 0.3% African American, 0.1% Pacific Islander, and 3.0% from other races. The median household income was $41,250, and the median family income was $48,750.
Common Questions
What is Per Capita Income in Chelan Falls?
Per Capita income in Chelan Falls is $17,602.
What is Inequality or Gini Index in Chelan Falls?
Inequality or Gini Index in Chelan Falls is 0.08.
What is the Total Population of Chelan Falls?
Total Population of Chelan Falls is 106.
What is the Total Male Population of Chelan Falls?
Total Male Population of Chelan Falls is 72.
What is the Total Female Population of Chelan Falls?
Total Female Population of Chelan Falls is 34.
What is the Ratio of Males per 100 Females in Chelan Falls?
There are 211.76 Males per 100 Females in Chelan Falls.
What is the Ratio of Females per 100 Males in Chelan Falls?
There are 47.22 Females per 100 Males in Chelan Falls.
What is the Median Population Age in Chelan Falls?
Median Population Age in Chelan Falls is 25.0 Years.
What is the Average Family Size in Chelan Falls
Average Family Size in Chelan Falls is 2.1 People.
What is the Average Household Size in Chelan Falls
Average Household Size in Chelan Falls is 2.1 People.
How Large is the Labor Force in Chelan Falls?
There are 61 People in the Labor Forcein in Chelan Falls.
What is the Percentage of People in the Labor Force in Chelan Falls?
84.7% of People are in the Labor Force in Chelan Falls.
Report Title
Report Link
HTML Copy & Paste Link
Social Media
Copy and paste the folowing code into any webpage where you would like this interactive chart to display