Connell, WA Map & Demographics
Connell Map
Connell Overview
$18,791
PER CAPITA INCOME
$80,184
AVG FAMILY INCOME
$61,000
AVG HOUSEHOLD INCOME
17.7%
WAGE / INCOME GAP [ % ]
82.3¢/ $1
WAGE / INCOME GAP [ $ ]
0.35
INEQUALITY / GINI INDEX
5,175
TOTAL POPULATION
3,417
MALE POPULATION
1,758
FEMALE POPULATION
194.37
MALES / 100 FEMALES
51.45
FEMALES / 100 MALES
39.8
MEDIAN AGE
3.5
AVG FAMILY SIZE
3.0
AVG HOUSEHOLD SIZE
1,618
LABOR FORCE [ PEOPLE ]
38.1%
PERCENT IN LABOR FORCE
11.5%
UNEMPLOYMENT RATE
Connell Zip Codes
Connell Area Codes
Income in Connell
Income Overview in Connell
Per Capita Income in Connell is $18,791, while median incomes of families and households are $80,184 and $61,000 respectively.
| Characteristic | Number | Measure |
| Per Capita Income | 5,175 | $18,791 |
| Median Family Income | 926 | $80,184 |
| Mean Family Income | 926 | $82,713 |
| Median Household Income | 1,212 | $61,000 |
| Mean Household Income | 1,212 | $75,656 |
| Income Deficit | 926 | $0 |
| Wage / Income Gap (%) | 5,175 | 17.68% |
| Wage / Income Gap ($) | 5,175 | 82.32¢ per $1 |
| Gini / Inequality Index | 5,175 | 0.35 |
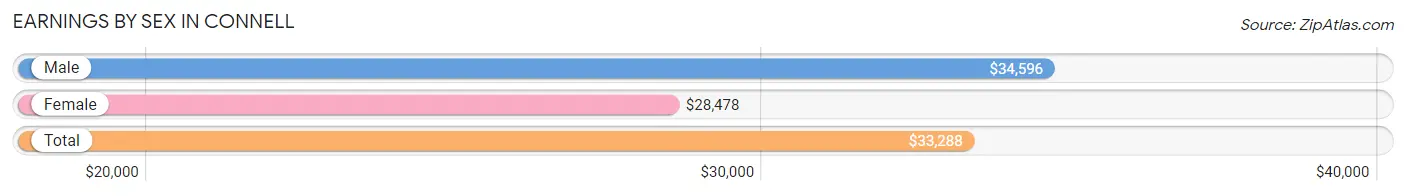
Earnings by Sex in Connell
Average Earnings in Connell are $33,288, $34,596 for men and $28,478 for women, a difference of 17.7%.
| Sex | Number | Average Earnings |
| Male | 1,243 (66.1%) | $34,596 |
| Female | 638 (33.9%) | $28,478 |
| Total | 1,881 (100.0%) | $33,288 |
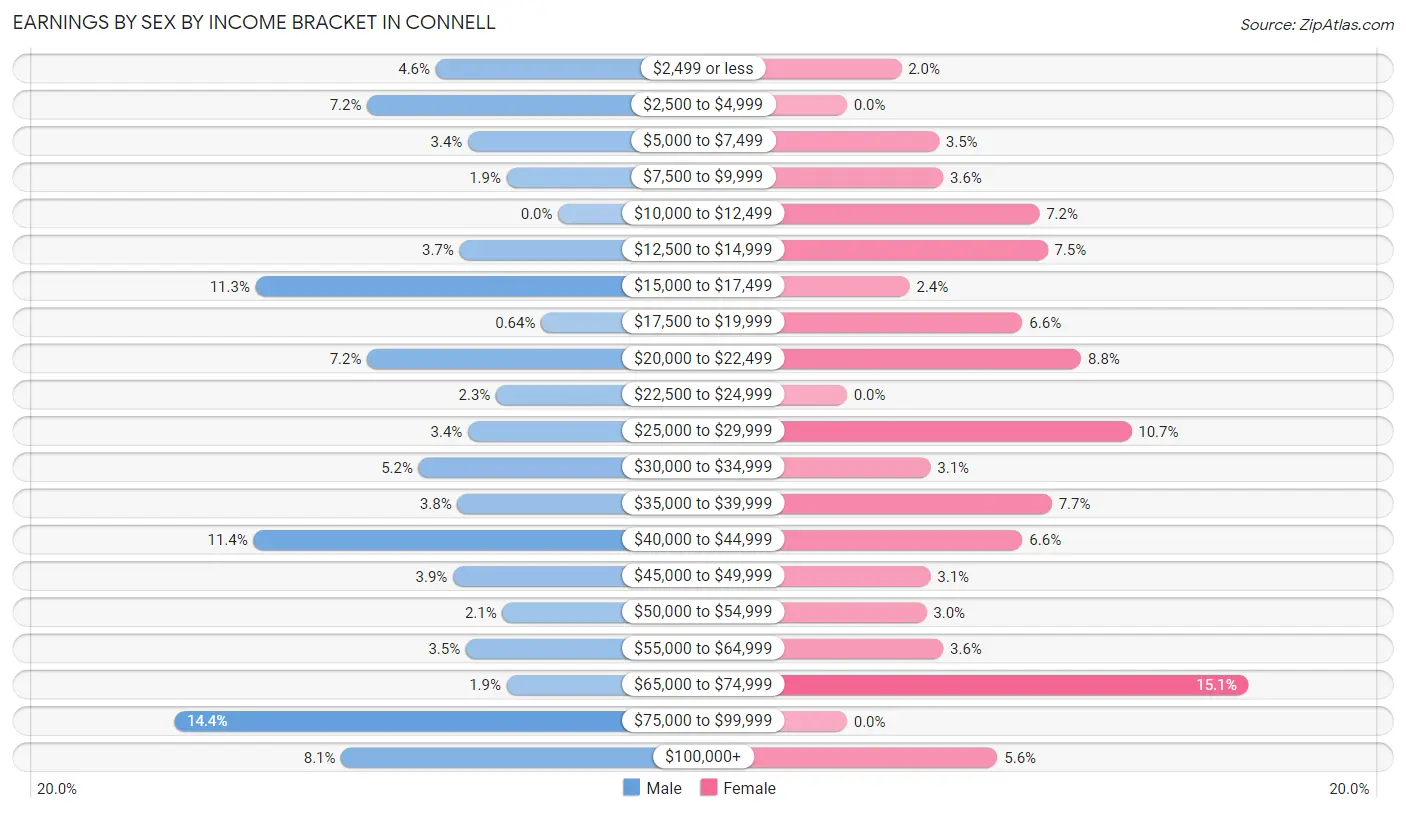
Earnings by Sex by Income Bracket in Connell
The most common earnings brackets in Connell are $75,000 to $99,999 for men (179 | 14.4%) and $65,000 to $74,999 for women (96 | 15.0%).
| Income | Male | Female |
| $2,499 or less | 57 (4.6%) | 13 (2.0%) |
| $2,500 to $4,999 | 89 (7.2%) | 0 (0.0%) |
| $5,000 to $7,499 | 42 (3.4%) | 22 (3.5%) |
| $7,500 to $9,999 | 24 (1.9%) | 23 (3.6%) |
| $10,000 to $12,499 | 0 (0.0%) | 46 (7.2%) |
| $12,500 to $14,999 | 46 (3.7%) | 48 (7.5%) |
| $15,000 to $17,499 | 141 (11.3%) | 15 (2.4%) |
| $17,500 to $19,999 | 8 (0.6%) | 42 (6.6%) |
| $20,000 to $22,499 | 89 (7.2%) | 56 (8.8%) |
| $22,500 to $24,999 | 29 (2.3%) | 0 (0.0%) |
| $25,000 to $29,999 | 42 (3.4%) | 68 (10.7%) |
| $30,000 to $34,999 | 65 (5.2%) | 20 (3.1%) |
| $35,000 to $39,999 | 47 (3.8%) | 49 (7.7%) |
| $40,000 to $44,999 | 142 (11.4%) | 42 (6.6%) |
| $45,000 to $49,999 | 49 (3.9%) | 20 (3.1%) |
| $50,000 to $54,999 | 26 (2.1%) | 19 (3.0%) |
| $55,000 to $64,999 | 43 (3.5%) | 23 (3.6%) |
| $65,000 to $74,999 | 24 (1.9%) | 96 (15.0%) |
| $75,000 to $99,999 | 179 (14.4%) | 0 (0.0%) |
| $100,000+ | 101 (8.1%) | 36 (5.6%) |
| Total | 1,243 (100.0%) | 638 (100.0%) |
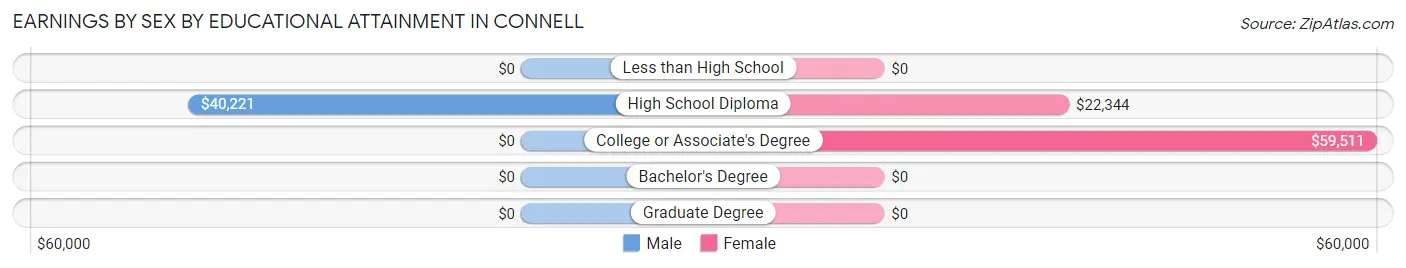
Earnings by Sex by Educational Attainment in Connell
Average earnings in Connell are $40,341 for men and $35,795 for women, a difference of 11.3%. Men with an educational attainment of high school diploma enjoy the highest average annual earnings of $40,221, while those with high school diploma education earn the least with $40,221. Women with an educational attainment of college or associate's degree earn the most with the average annual earnings of $59,511, while those with high school diploma education have the smallest earnings of $22,344.
| Educational Attainment | Male Income | Female Income |
| Less than High School | - | - |
| High School Diploma | $40,221 | $22,344 |
| College or Associate's Degree | - | - |
| Bachelor's Degree | - | - |
| Graduate Degree | - | - |
| Total | $40,341 | $35,795 |
Family Income in Connell
Family Income Brackets in Connell
According to the Connell family income data, there are 229 families falling into the $50,000 to $74,999 income range, which is the most common income bracket and makes up 24.7% of all families.
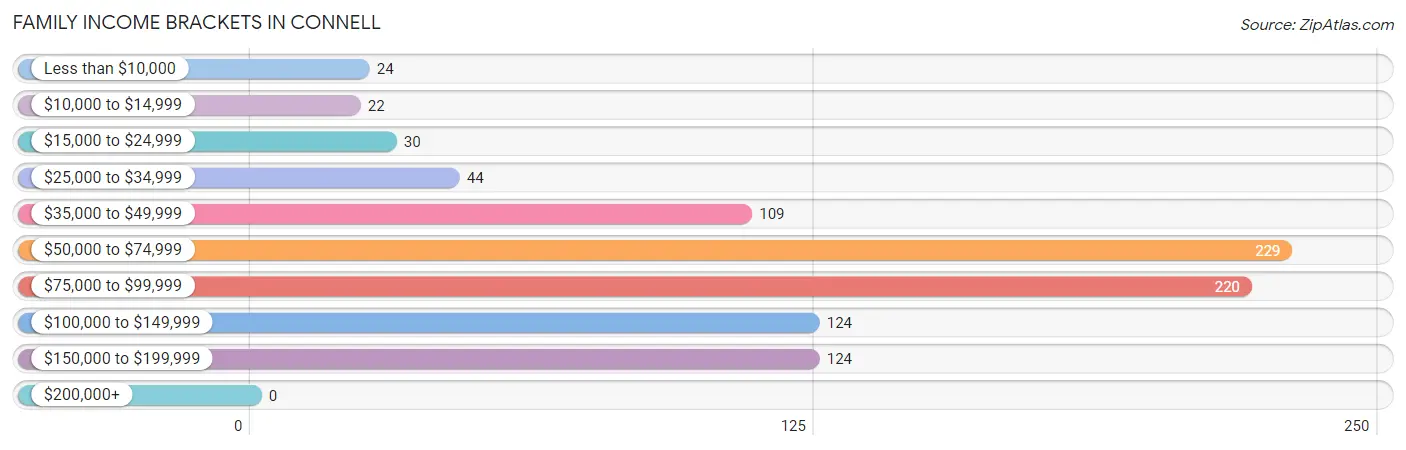
| Income Bracket | # Families | % Families |
| Less than $10,000 | 24 | 2.6% |
| $10,000 to $14,999 | 22 | 2.4% |
| $15,000 to $24,999 | 30 | 3.2% |
| $25,000 to $34,999 | 44 | 4.8% |
| $35,000 to $49,999 | 109 | 11.8% |
| $50,000 to $74,999 | 229 | 24.7% |
| $75,000 to $99,999 | 220 | 23.8% |
| $100,000 to $149,999 | 124 | 13.4% |
| $150,000 to $199,999 | 124 | 13.4% |
| $200,000+ | 0 | 0.0% |
Family Income by Famaliy Size in Connell
3-person families (181 | 19.6%) account for the highest median family income in Connell with $81,250 per family, while 2-person families (399 | 43.1%) have the highest median income of $40,102 per family member.
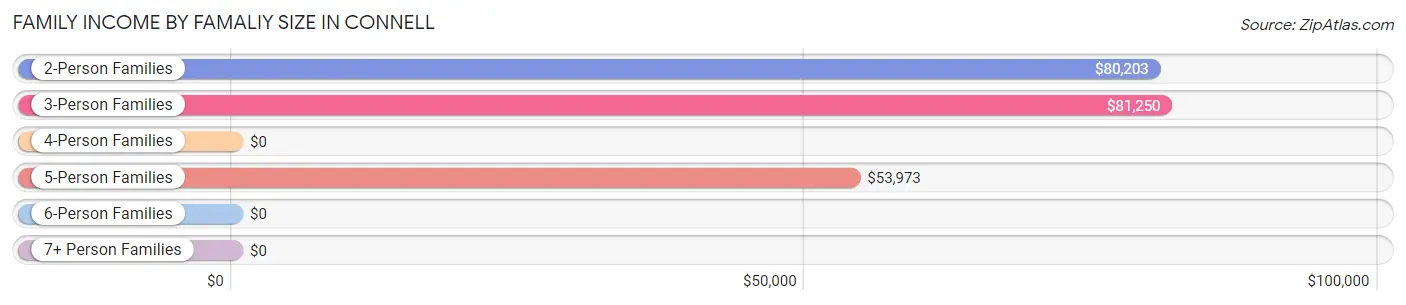
| Income Bracket | # Families | Median Income |
| 2-Person Families | 399 (43.1%) | $80,203 |
| 3-Person Families | 181 (19.6%) | $81,250 |
| 4-Person Families | 143 (15.4%) | $0 |
| 5-Person Families | 75 (8.1%) | $53,973 |
| 6-Person Families | 29 (3.1%) | $0 |
| 7+ Person Families | 99 (10.7%) | $0 |
| Total | 926 (100.0%) | $80,184 |
Family Income by Number of Earners in Connell
The median family income in Connell is $80,184, with families comprising 3+ earners (163) having the highest median family income of $129,448, while families with no earners (149) have the lowest median family income of $48,958, accounting for 17.6% and 16.1% of families, respectively.
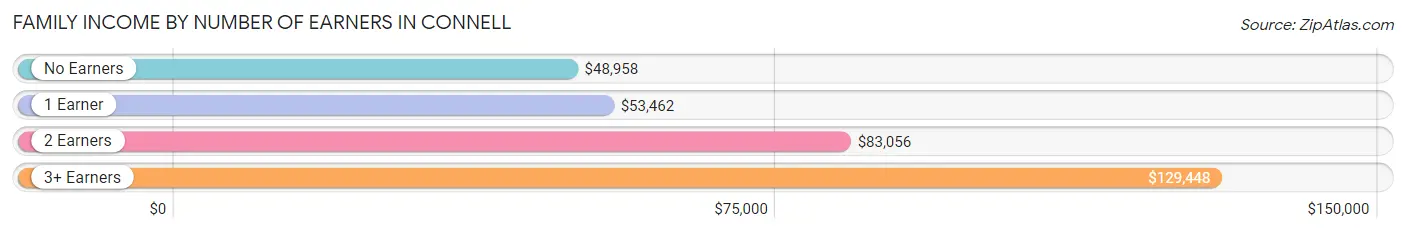
| Number of Earners | # Families | Median Income |
| No Earners | 149 (16.1%) | $48,958 |
| 1 Earner | 204 (22.0%) | $53,462 |
| 2 Earners | 410 (44.3%) | $83,056 |
| 3+ Earners | 163 (17.6%) | $129,448 |
| Total | 926 (100.0%) | $80,184 |
Household Income in Connell
Household Income Brackets in Connell
With 268 households falling in the category, the $75,000 to $99,999 income range is the most frequent in Connell, accounting for 22.1% of all households.
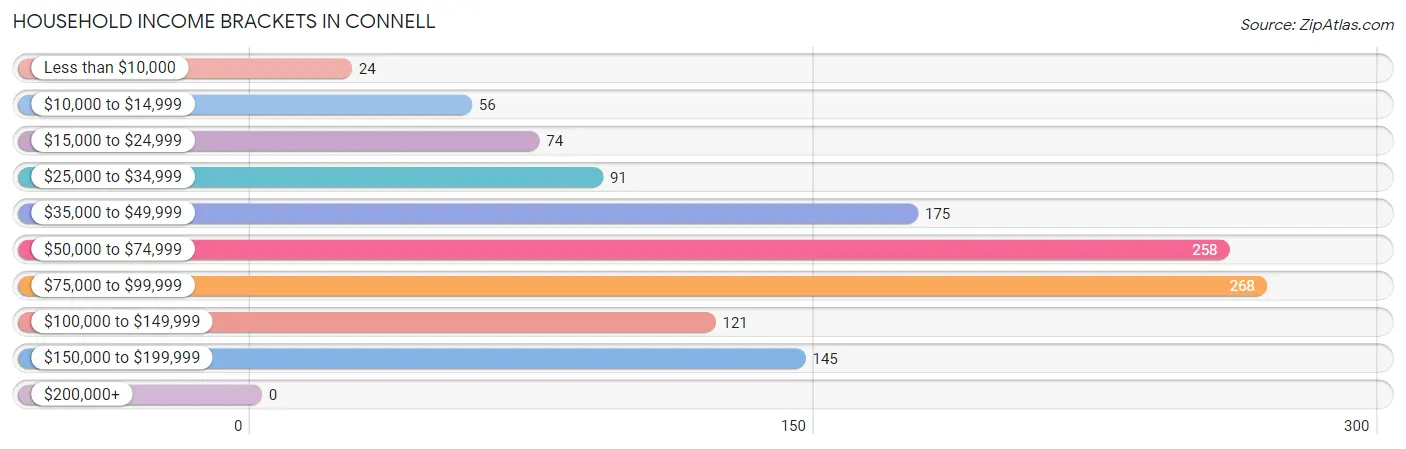
| Income Bracket | # Households | % Households |
| Less than $10,000 | 24 | 2.0% |
| $10,000 to $14,999 | 56 | 4.6% |
| $15,000 to $24,999 | 74 | 6.1% |
| $25,000 to $34,999 | 91 | 7.5% |
| $35,000 to $49,999 | 175 | 14.4% |
| $50,000 to $74,999 | 258 | 21.3% |
| $75,000 to $99,999 | 268 | 22.1% |
| $100,000 to $149,999 | 121 | 10.0% |
| $150,000 to $199,999 | 145 | 12.0% |
| $200,000+ | 0 | 0.0% |
Household Income by Householder Age in Connell
The median household income in Connell is $61,000, with the highest median household income of $81,630 found in the 25 to 44 years age bracket for the primary householder. A total of 358 households (29.5%) fall into this category. Meanwhile, the 15 to 24 years age bracket for the primary householder has the lowest median household income of $0, with 33 households (2.7%) in this group.
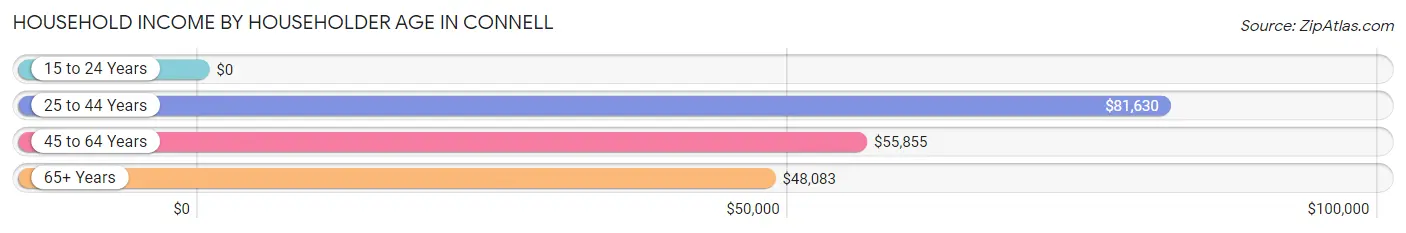
| Income Bracket | # Households | Median Income |
| 15 to 24 Years | 33 (2.7%) | $0 |
| 25 to 44 Years | 358 (29.5%) | $81,630 |
| 45 to 64 Years | 509 (42.0%) | $55,855 |
| 65+ Years | 312 (25.7%) | $48,083 |
| Total | 1,212 (100.0%) | $61,000 |
Poverty in Connell
Income Below Poverty by Sex and Age in Connell
With 10.9% poverty level for males and 17.3% for females among the residents of Connell, under 5 year old males and under 5 year old females are the most vulnerable to poverty, with 29 males (38.2%) and 79 females (50.0%) in their respective age groups living below the poverty level.
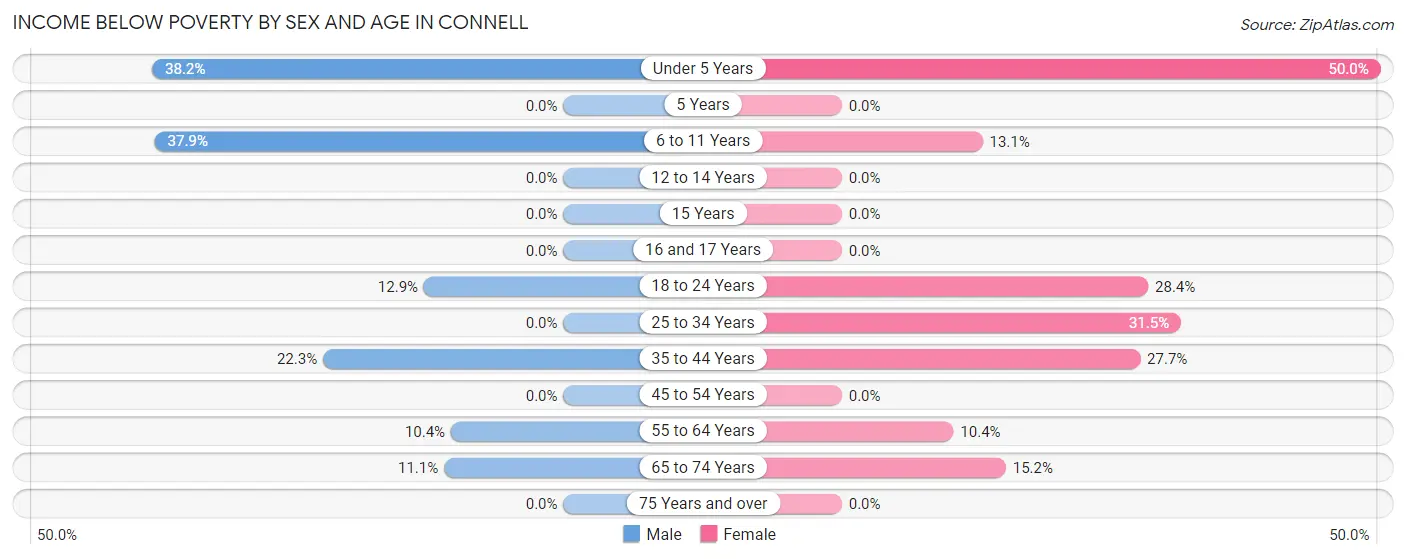
| Age Bracket | Male | Female |
| Under 5 Years | 29 (38.2%) | 79 (50.0%) |
| 5 Years | 0 (0.0%) | 0 (0.0%) |
| 6 to 11 Years | 33 (37.9%) | 29 (13.1%) |
| 12 to 14 Years | 0 (0.0%) | 0 (0.0%) |
| 15 Years | 0 (0.0%) | 0 (0.0%) |
| 16 and 17 Years | 0 (0.0%) | 0 (0.0%) |
| 18 to 24 Years | 33 (12.9%) | 29 (28.4%) |
| 25 to 34 Years | 0 (0.0%) | 34 (31.5%) |
| 35 to 44 Years | 56 (22.3%) | 90 (27.7%) |
| 45 to 54 Years | 0 (0.0%) | 0 (0.0%) |
| 55 to 64 Years | 22 (10.4%) | 23 (10.4%) |
| 65 to 74 Years | 29 (11.1%) | 21 (15.2%) |
| 75 Years and over | 0 (0.0%) | 0 (0.0%) |
| Total | 202 (10.9%) | 305 (17.3%) |
Income Above Poverty by Sex and Age in Connell
According to the poverty statistics in Connell, males aged 5 years and females aged 5 years are the age groups that are most secure financially, with 100.0% of males and 100.0% of females in these age groups living above the poverty line.
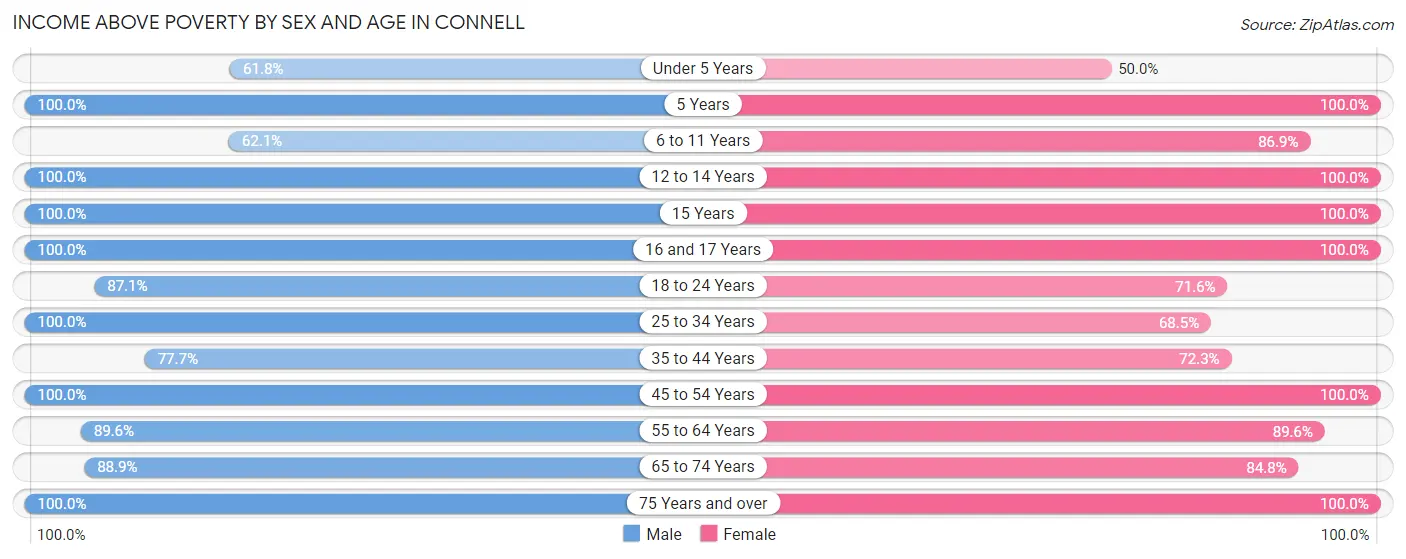
| Age Bracket | Male | Female |
| Under 5 Years | 47 (61.8%) | 79 (50.0%) |
| 5 Years | 32 (100.0%) | 66 (100.0%) |
| 6 to 11 Years | 54 (62.1%) | 193 (86.9%) |
| 12 to 14 Years | 160 (100.0%) | 58 (100.0%) |
| 15 Years | 26 (100.0%) | 40 (100.0%) |
| 16 and 17 Years | 83 (100.0%) | 45 (100.0%) |
| 18 to 24 Years | 222 (87.1%) | 73 (71.6%) |
| 25 to 34 Years | 82 (100.0%) | 74 (68.5%) |
| 35 to 44 Years | 195 (77.7%) | 235 (72.3%) |
| 45 to 54 Years | 280 (100.0%) | 188 (100.0%) |
| 55 to 64 Years | 189 (89.6%) | 199 (89.6%) |
| 65 to 74 Years | 233 (88.9%) | 117 (84.8%) |
| 75 Years and over | 51 (100.0%) | 86 (100.0%) |
| Total | 1,654 (89.1%) | 1,453 (82.7%) |
Income Below Poverty Among Married-Couple Families in Connell
The poverty statistics for married-couple families in Connell show that 3.8% or 29 of the total 772 families live below the poverty line. Families with 1 or 2 children have the highest poverty rate of 12.3%, comprising of 29 families. On the other hand, families with no children have the lowest poverty rate of 0.0%, which includes 0 families.
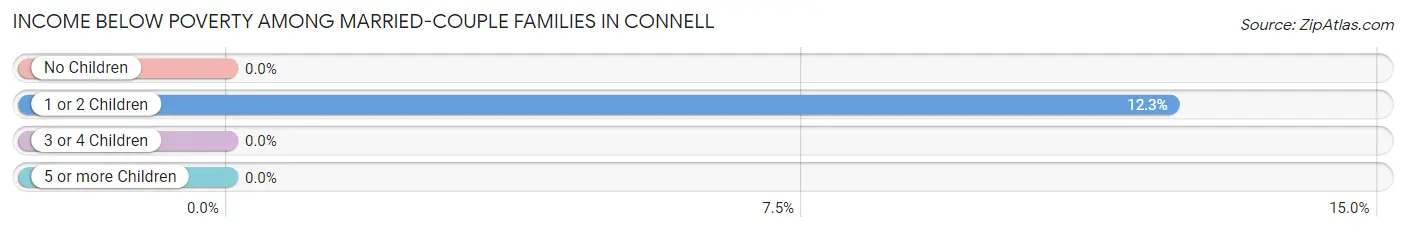
| Children | Above Poverty | Below Poverty |
| No Children | 411 (100.0%) | 0 (0.0%) |
| 1 or 2 Children | 207 (87.7%) | 29 (12.3%) |
| 3 or 4 Children | 26 (100.0%) | 0 (0.0%) |
| 5 or more Children | 99 (100.0%) | 0 (0.0%) |
| Total | 743 (96.2%) | 29 (3.8%) |
Income Below Poverty Among Single-Parent Households in Connell
According to the poverty data in Connell, 52.4% or 22 single-father households and 48.2% or 54 single-mother households are living below the poverty line. Among single-father households, those with no children have the highest poverty rate, with 22 households (52.4%) experiencing poverty. Likewise, among single-mother households, those with 3 or 4 children have the highest poverty rate, with 30 households (100.0%) falling below the poverty line.
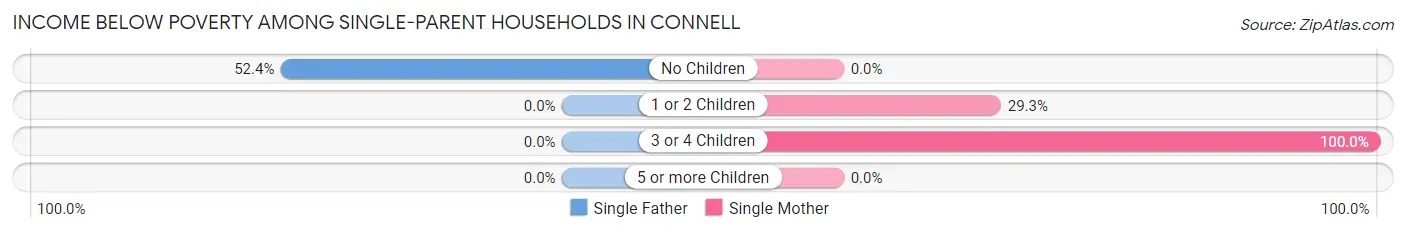
| Children | Single Father | Single Mother |
| No Children | 22 (52.4%) | 0 (0.0%) |
| 1 or 2 Children | 0 (0.0%) | 24 (29.3%) |
| 3 or 4 Children | 0 (0.0%) | 30 (100.0%) |
| 5 or more Children | 0 (0.0%) | 0 (0.0%) |
| Total | 22 (52.4%) | 54 (48.2%) |
Income Below Poverty Among Married-Couple vs Single-Parent Households in Connell
The poverty data for Connell shows that 29 of the married-couple family households (3.8%) and 76 of the single-parent households (49.3%) are living below the poverty level. Within the married-couple family households, those with 1 or 2 children have the highest poverty rate, with 29 households (12.3%) falling below the poverty line. Among the single-parent households, those with 3 or 4 children have the highest poverty rate, with 30 household (100.0%) living below poverty.
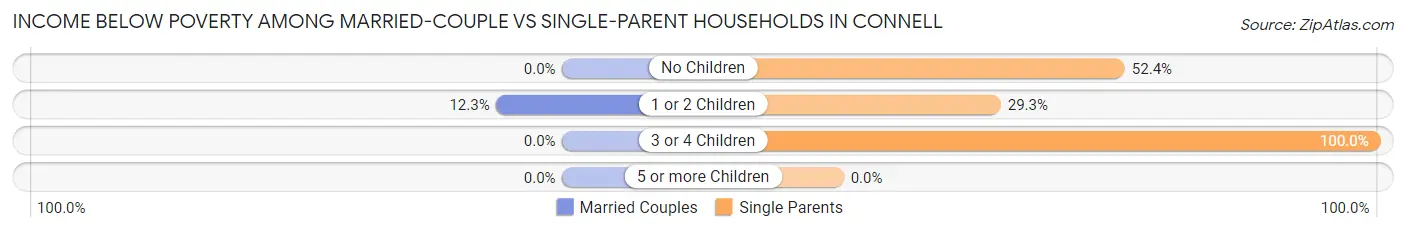
| Children | Married-Couple Families | Single-Parent Households |
| No Children | 0 (0.0%) | 22 (52.4%) |
| 1 or 2 Children | 29 (12.3%) | 24 (29.3%) |
| 3 or 4 Children | 0 (0.0%) | 30 (100.0%) |
| 5 or more Children | 0 (0.0%) | 0 (0.0%) |
| Total | 29 (3.8%) | 76 (49.3%) |
Race in Connell
The most populous races in Connell are White / Caucasian (3,353 | 64.8%), Hispanic or Latino (2,216 | 42.8%), and Some other Race (940 | 18.2%).
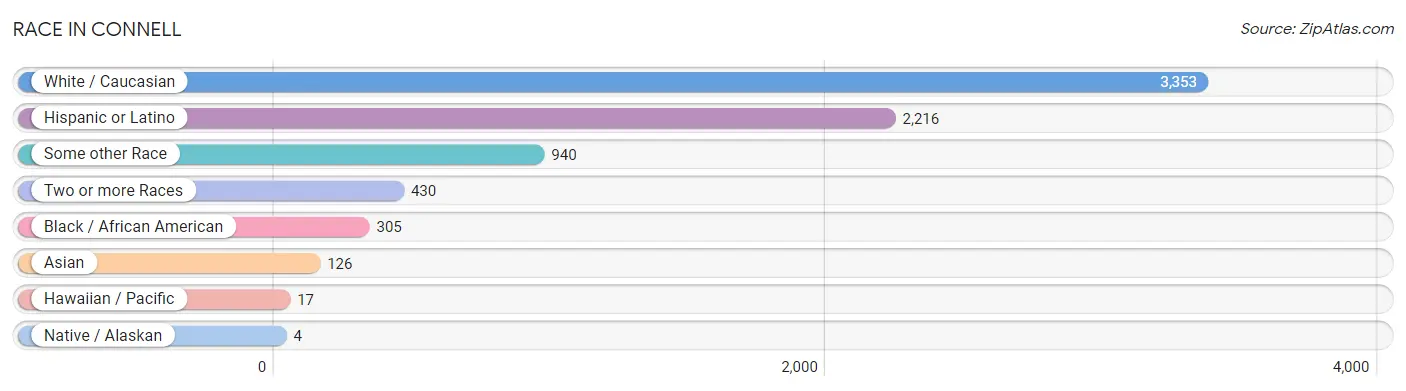
| Race | # Population | % Population |
| Asian | 126 | 2.4% |
| Black / African American | 305 | 5.9% |
| Hawaiian / Pacific | 17 | 0.3% |
| Hispanic or Latino | 2,216 | 42.8% |
| Native / Alaskan | 4 | 0.1% |
| White / Caucasian | 3,353 | 64.8% |
| Two or more Races | 430 | 8.3% |
| Some other Race | 940 | 18.2% |
| Total | 5,175 | 100.0% |
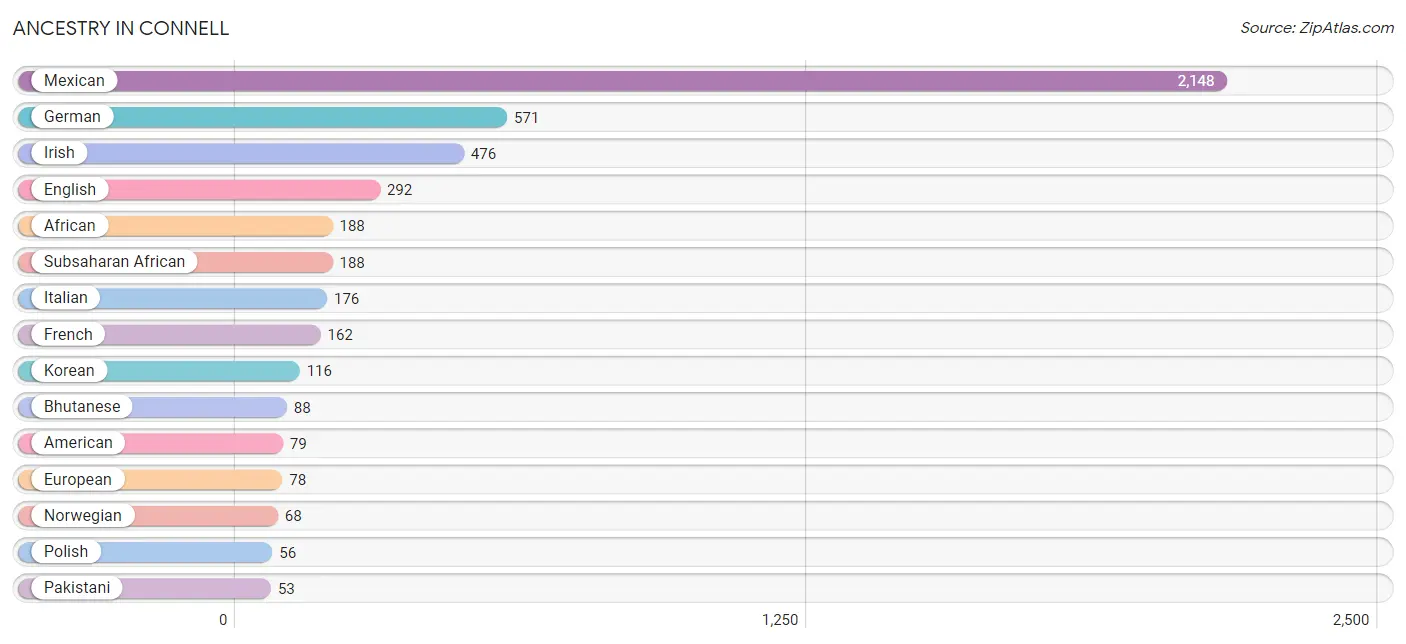
Ancestry in Connell
The most populous ancestries reported in Connell are Mexican (2,148 | 41.5%), German (571 | 11.0%), Irish (476 | 9.2%), English (292 | 5.6%), and African (188 | 3.6%), together accounting for 71.0% of all Connell residents.
| Ancestry | # Population | % Population |
| African | 188 | 3.6% |
| American | 79 | 1.5% |
| Australian | 32 | 0.6% |
| Bhutanese | 88 | 1.7% |
| Burmese | 51 | 1.0% |
| Celtic | 27 | 0.5% |
| Central American | 29 | 0.6% |
| Cherokee | 51 | 1.0% |
| Cuban | 7 | 0.1% |
| Danish | 3 | 0.1% |
| Dutch | 10 | 0.2% |
| English | 292 | 5.6% |
| European | 78 | 1.5% |
| Finnish | 5 | 0.1% |
| French | 162 | 3.1% |
| German | 571 | 11.0% |
| Guamanian / Chamorro | 7 | 0.1% |
| Guatemalan | 26 | 0.5% |
| Indian (Asian) | 8 | 0.2% |
| Inupiat | 2 | 0.0% |
| Irish | 476 | 9.2% |
| Italian | 176 | 3.4% |
| Korean | 116 | 2.2% |
| Malaysian | 4 | 0.1% |
| Mexican | 2,148 | 41.5% |
| Norwegian | 68 | 1.3% |
| Pakistani | 53 | 1.0% |
| Polish | 56 | 1.1% |
| Portuguese | 3 | 0.1% |
| Puerto Rican | 17 | 0.3% |
| Russian | 3 | 0.1% |
| Salvadoran | 3 | 0.1% |
| Samoan | 10 | 0.2% |
| Scotch-Irish | 25 | 0.5% |
| Scottish | 41 | 0.8% |
| Spanish | 6 | 0.1% |
| Sri Lankan | 24 | 0.5% |
| Subsaharan African | 188 | 3.6% |
| Swedish | 24 | 0.5% |
| Tlingit-Haida | 4 | 0.1% |
| Ukrainian | 3 | 0.1% |
| Welsh | 38 | 0.7% | View All 42 Rows |
Immigrants in Connell
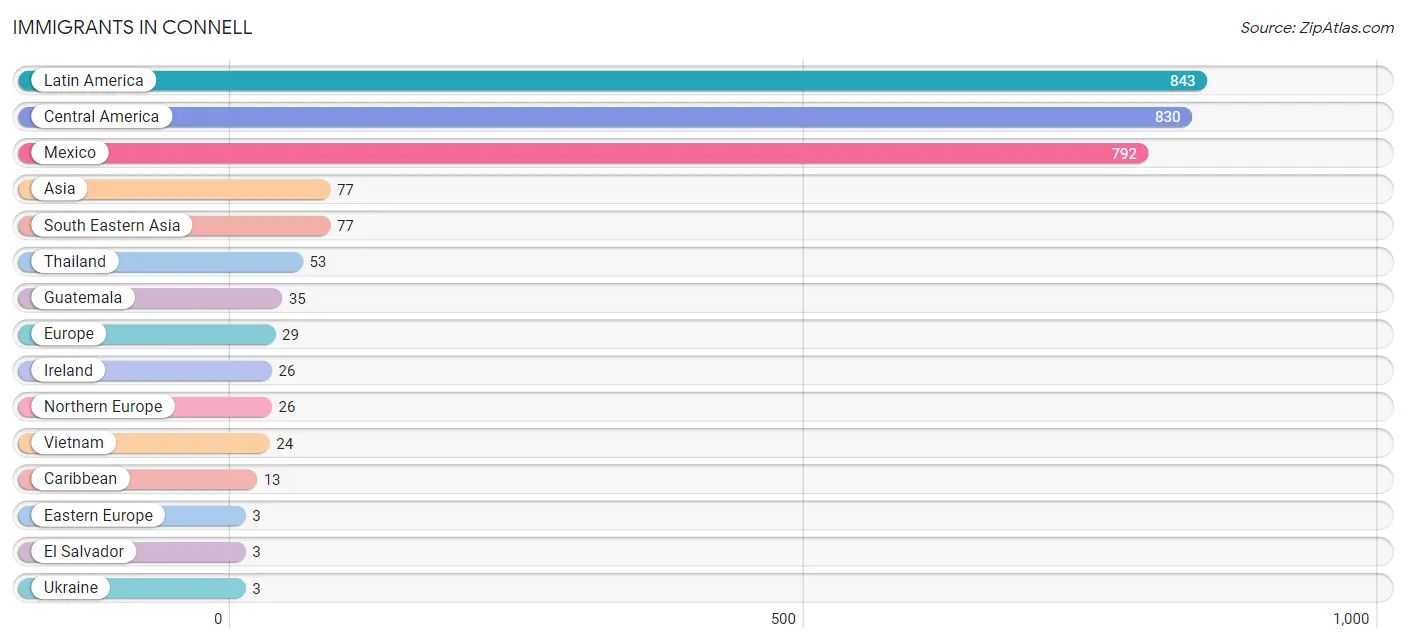
The most numerous immigrant groups reported in Connell came from Latin America (843 | 16.3%), Central America (830 | 16.0%), Mexico (792 | 15.3%), Asia (77 | 1.5%), and South Eastern Asia (77 | 1.5%), together accounting for 50.6% of all Connell residents.
| Immigration Origin | # Population | % Population |
| Asia | 77 | 1.5% |
| Caribbean | 13 | 0.3% |
| Central America | 830 | 16.0% |
| Eastern Europe | 3 | 0.1% |
| El Salvador | 3 | 0.1% |
| Europe | 29 | 0.6% |
| Guatemala | 35 | 0.7% |
| Ireland | 26 | 0.5% |
| Latin America | 843 | 16.3% |
| Mexico | 792 | 15.3% |
| Northern Europe | 26 | 0.5% |
| South Eastern Asia | 77 | 1.5% |
| Thailand | 53 | 1.0% |
| Ukraine | 3 | 0.1% |
| Vietnam | 24 | 0.5% | View All 15 Rows |
Sex and Age in Connell
Sex and Age in Connell
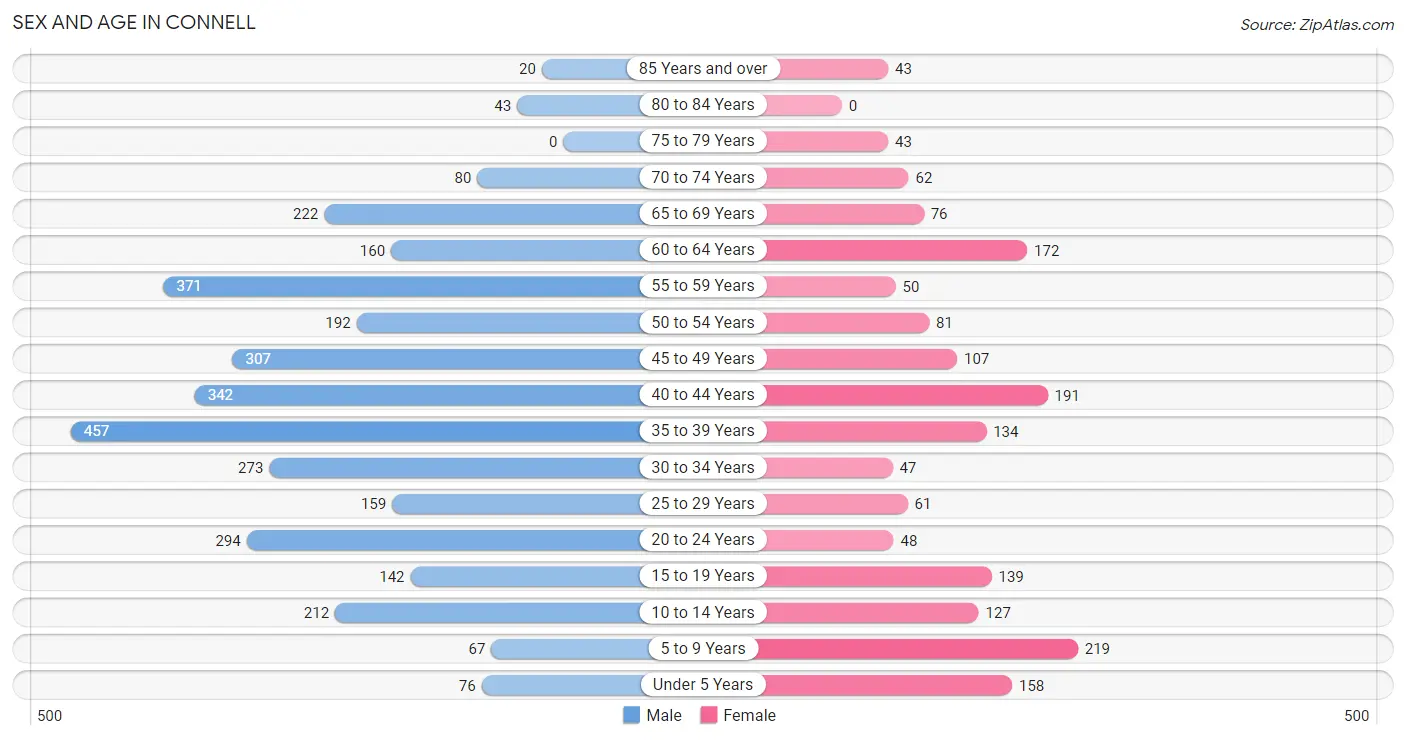
The most populous age groups in Connell are 35 to 39 Years (457 | 13.4%) for men and 5 to 9 Years (219 | 12.5%) for women.
| Age Bracket | Male | Female |
| Under 5 Years | 76 (2.2%) | 158 (9.0%) |
| 5 to 9 Years | 67 (2.0%) | 219 (12.5%) |
| 10 to 14 Years | 212 (6.2%) | 127 (7.2%) |
| 15 to 19 Years | 142 (4.2%) | 139 (7.9%) |
| 20 to 24 Years | 294 (8.6%) | 48 (2.7%) |
| 25 to 29 Years | 159 (4.6%) | 61 (3.5%) |
| 30 to 34 Years | 273 (8.0%) | 47 (2.7%) |
| 35 to 39 Years | 457 (13.4%) | 134 (7.6%) |
| 40 to 44 Years | 342 (10.0%) | 191 (10.9%) |
| 45 to 49 Years | 307 (9.0%) | 107 (6.1%) |
| 50 to 54 Years | 192 (5.6%) | 81 (4.6%) |
| 55 to 59 Years | 371 (10.9%) | 50 (2.8%) |
| 60 to 64 Years | 160 (4.7%) | 172 (9.8%) |
| 65 to 69 Years | 222 (6.5%) | 76 (4.3%) |
| 70 to 74 Years | 80 (2.3%) | 62 (3.5%) |
| 75 to 79 Years | 0 (0.0%) | 43 (2.5%) |
| 80 to 84 Years | 43 (1.3%) | 0 (0.0%) |
| 85 Years and over | 20 (0.6%) | 43 (2.5%) |
| Total | 3,417 (100.0%) | 1,758 (100.0%) |
Families and Households in Connell
Median Family Size in Connell
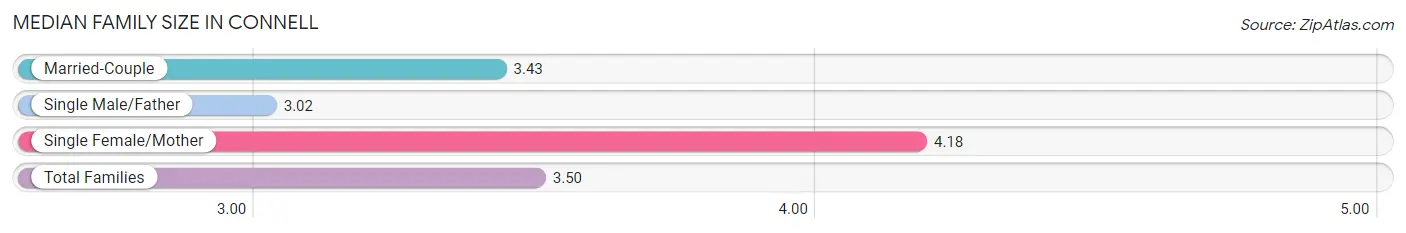
The median family size in Connell is 3.50 persons per family, with single female/mother families (112 | 12.1%) accounting for the largest median family size of 4.18 persons per family. On the other hand, single male/father families (42 | 4.5%) represent the smallest median family size with 3.02 persons per family.
| Family Type | # Families | Family Size |
| Married-Couple | 772 (83.4%) | 3.43 |
| Single Male/Father | 42 (4.5%) | 3.02 |
| Single Female/Mother | 112 (12.1%) | 4.18 |
| Total Families | 926 (100.0%) | 3.50 |
Median Household Size in Connell
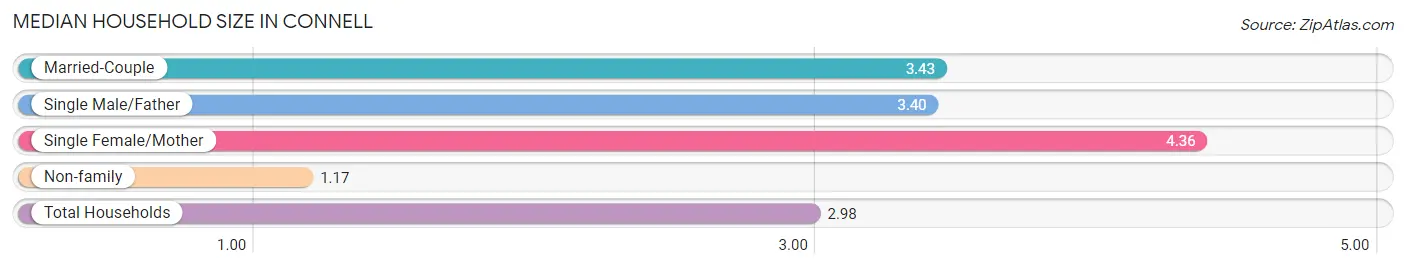
The median household size in Connell is 2.98 persons per household, with single female/mother households (112 | 9.2%) accounting for the largest median household size of 4.36 persons per household. non-family households (286 | 23.6%) represent the smallest median household size with 1.17 persons per household.
| Household Type | # Households | Household Size |
| Married-Couple | 772 (63.7%) | 3.43 |
| Single Male/Father | 42 (3.5%) | 3.40 |
| Single Female/Mother | 112 (9.2%) | 4.36 |
| Non-family | 286 (23.6%) | 1.17 |
| Total Households | 1,212 (100.0%) | 2.98 |
Household Size by Marriage Status in Connell
Out of a total of 1,212 households in Connell, 926 (76.4%) are family households, while 286 (23.6%) are nonfamily households. The most numerous type of family households are 2-person households, comprising 399, and the most common type of nonfamily households are 1-person households, comprising 254.
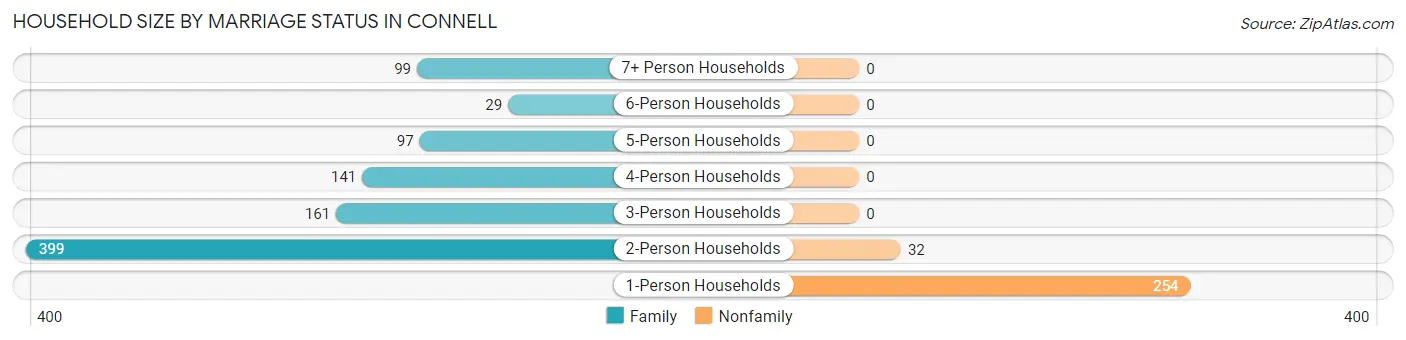
| Household Size | Family Households | Nonfamily Households |
| 1-Person Households | - | 254 (21.0%) |
| 2-Person Households | 399 (32.9%) | 32 (2.6%) |
| 3-Person Households | 161 (13.3%) | 0 (0.0%) |
| 4-Person Households | 141 (11.6%) | 0 (0.0%) |
| 5-Person Households | 97 (8.0%) | 0 (0.0%) |
| 6-Person Households | 29 (2.4%) | 0 (0.0%) |
| 7+ Person Households | 99 (8.2%) | 0 (0.0%) |
| Total | 926 (76.4%) | 286 (23.6%) |
Female Fertility in Connell
Fertility by Age in Connell
| Age Bracket | Women with Births | Births / 1,000 Women |
| 15 to 19 years | 0 (0.0%) | 0.0 |
| 20 to 34 years | 0 (0.0%) | 0.0 |
| 35 to 50 years | 0 (0.0%) | 0.0 |
| Total | 0 (0.0%) | 0.0 |
Fertility by Age by Marriage Status in Connell
| Age Bracket | Married | Unmarried |
| 15 to 19 years | 0 (0.0%) | 0 (0.0%) |
| 20 to 34 years | 0 (0.0%) | 0 (0.0%) |
| 35 to 50 years | 0 (0.0%) | 0 (0.0%) |
| Total | 0 (0.0%) | 0 (0.0%) |
Fertility by Education in Connell
| Educational Attainment | Women with Births | Births / 1,000 Women |
| Less than High School | 0 (0.0%) | 0.0 |
| High School Diploma | 0 (0.0%) | 0.0 |
| College or Associate's Degree | 0 (0.0%) | 0.0 |
| Bachelor's Degree | 0 (0.0%) | 0.0 |
| Graduate Degree | 0 (0.0%) | 0.0 |
| Total | 0 (0.0%) | 0.0 |
Fertility by Education by Marriage Status in Connell
| Educational Attainment | Married | Unmarried |
| Less than High School | 0 (0.0%) | 0 (0.0%) |
| High School Diploma | 0 (0.0%) | 0 (0.0%) |
| College or Associate's Degree | 0 (0.0%) | 0 (0.0%) |
| Bachelor's Degree | 0 (0.0%) | 0 (0.0%) |
| Graduate Degree | 0 (0.0%) | 0 (0.0%) |
| Total | 0 (0.0%) | 0 (0.0%) |
Employment Characteristics in Connell
Employment by Class of Employer in Connell
Among the 1,417 employed individuals in Connell, private company employees (919 | 64.9%), state government employees (280 | 19.8%), and local government employees (153 | 10.8%) make up the most common classes of employment.
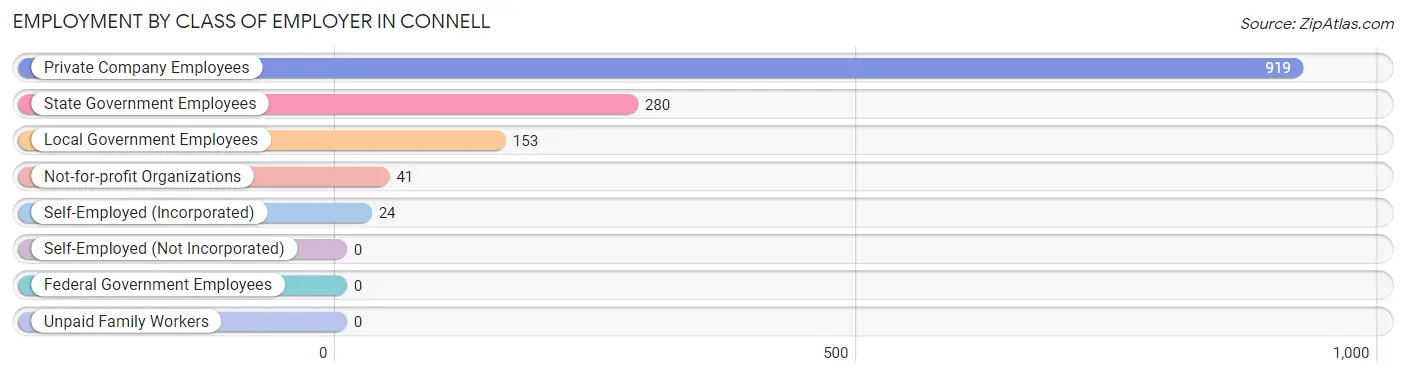
| Employer Class | # Employees | % Employees |
| Private Company Employees | 919 | 64.9% |
| Self-Employed (Incorporated) | 24 | 1.7% |
| Self-Employed (Not Incorporated) | 0 | 0.0% |
| Not-for-profit Organizations | 41 | 2.9% |
| Local Government Employees | 153 | 10.8% |
| State Government Employees | 280 | 19.8% |
| Federal Government Employees | 0 | 0.0% |
| Unpaid Family Workers | 0 | 0.0% |
| Total | 1,417 | 100.0% |
Employment Status by Age in Connell
According to the labor force statistics for Connell, out of the total population over 16 years of age (4,248), 38.1% or 1,618 individuals are in the labor force, with 11.5% or 186 of them unemployed. The age group with the highest labor force participation rate is 20 to 24 years, with 80.1% or 274 individuals in the labor force. Within the labor force, the 25 to 29 years age range has the highest percentage of unemployed individuals, with 39.1% or 34 of them being unemployed.
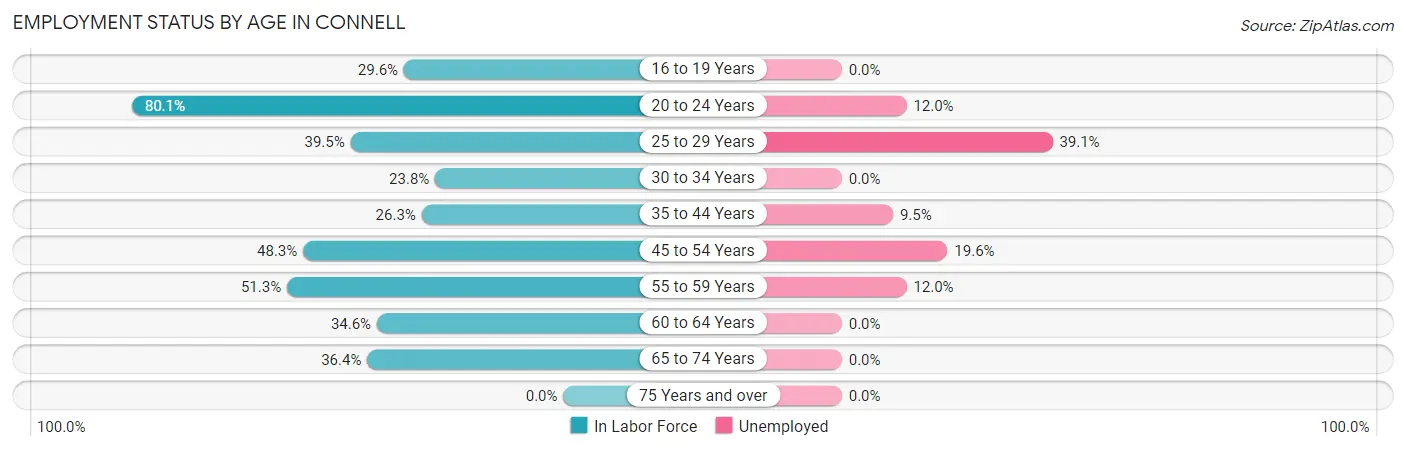
| Age Bracket | In Labor Force | Unemployed |
| 16 to 19 Years | 63 (29.6%) | 0 (0.0%) |
| 20 to 24 Years | 274 (80.1%) | 33 (12.0%) |
| 25 to 29 Years | 87 (39.5%) | 34 (39.1%) |
| 30 to 34 Years | 76 (23.8%) | 0 (0.0%) |
| 35 to 44 Years | 296 (26.3%) | 28 (9.5%) |
| 45 to 54 Years | 332 (48.3%) | 65 (19.6%) |
| 55 to 59 Years | 216 (51.3%) | 26 (12.0%) |
| 60 to 64 Years | 115 (34.6%) | 0 (0.0%) |
| 65 to 74 Years | 160 (36.4%) | 0 (0.0%) |
| 75 Years and over | 0 (0.0%) | 0 (0.0%) |
| Total | 1,618 (38.1%) | 186 (11.5%) |
Employment Status by Educational Attainment in Connell
According to labor force statistics for Connell, 36.1% of individuals (1,121) out of the total population between 25 and 64 years of age (3,104) are in the labor force, with 13.6% or 152 of them being unemployed. The group with the highest labor force participation rate are those with the educational attainment of less than high school, with 40.2% or 403 individuals in the labor force. Within the labor force, individuals with less than high school education have the highest percentage of unemployment, with 32.8% or 132 of them being unemployed.
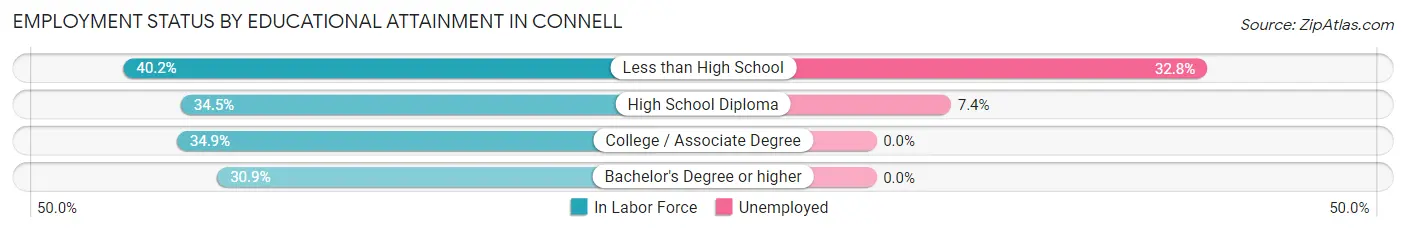
| Educational Attainment | In Labor Force | Unemployed |
| Less than High School | 403 (40.2%) | 329 (32.8%) |
| High School Diploma | 282 (34.5%) | 61 (7.4%) |
| College / Associate Degree | 349 (34.9%) | 0 (0.0%) |
| Bachelor's Degree or higher | 88 (30.9%) | 0 (0.0%) |
| Total | 1,121 (36.1%) | 422 (13.6%) |
Employment Occupations by Sex in Connell
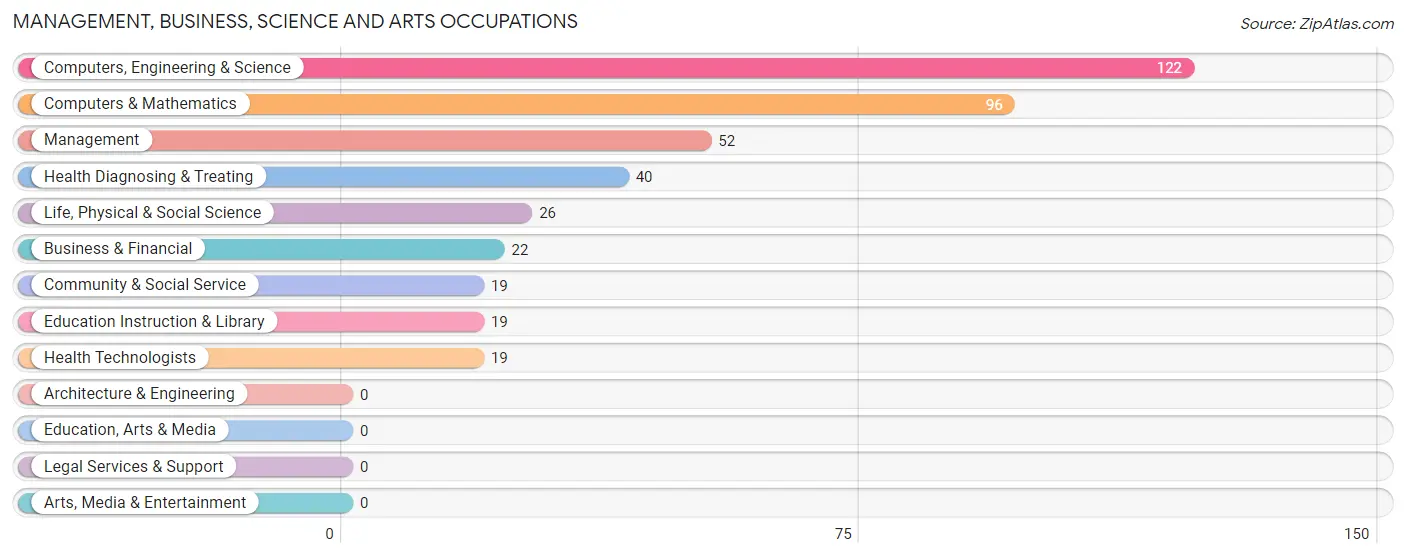
Management, Business, Science and Arts Occupations
The most common Management, Business, Science and Arts occupations in Connell are Computers, Engineering & Science (122 | 8.5%), Computers & Mathematics (96 | 6.7%), Management (52 | 3.6%), Health Diagnosing & Treating (40 | 2.8%), and Life, Physical & Social Science (26 | 1.8%).
Management, Business, Science and Arts Occupations by Sex
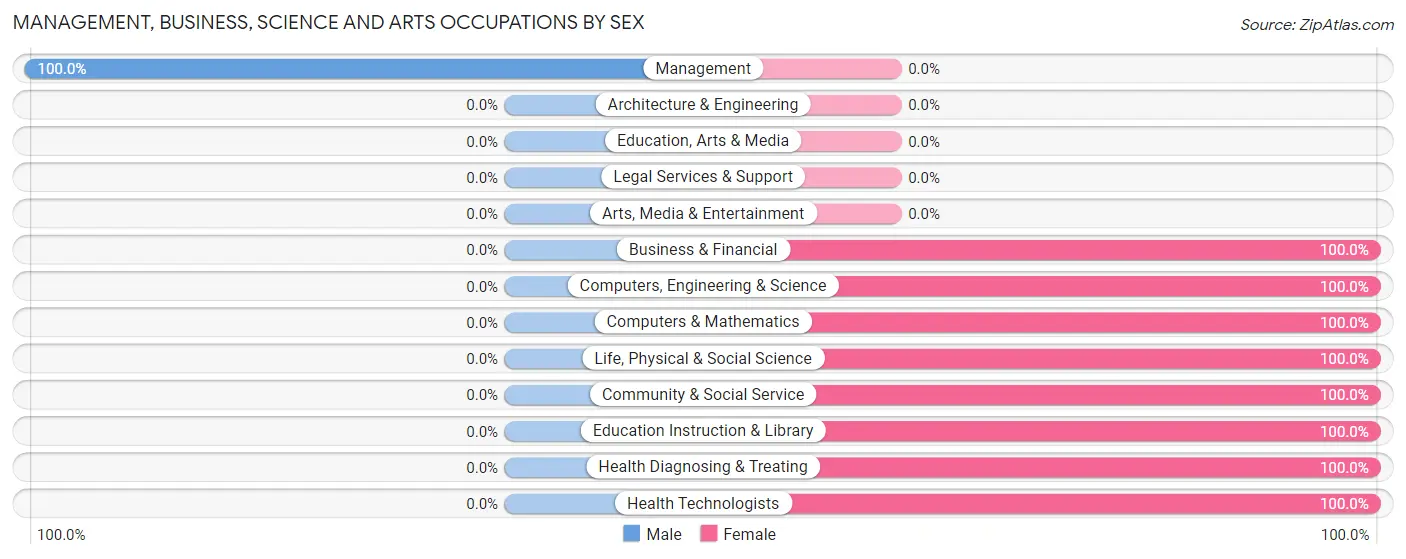
| Occupation | Male | Female |
| Management | 52 (100.0%) | 0 (0.0%) |
| Business & Financial | 0 (0.0%) | 22 (100.0%) |
| Computers, Engineering & Science | 0 (0.0%) | 122 (100.0%) |
| Computers & Mathematics | 0 (0.0%) | 96 (100.0%) |
| Architecture & Engineering | 0 (0.0%) | 0 (0.0%) |
| Life, Physical & Social Science | 0 (0.0%) | 26 (100.0%) |
| Community & Social Service | 0 (0.0%) | 19 (100.0%) |
| Education, Arts & Media | 0 (0.0%) | 0 (0.0%) |
| Legal Services & Support | 0 (0.0%) | 0 (0.0%) |
| Education Instruction & Library | 0 (0.0%) | 19 (100.0%) |
| Arts, Media & Entertainment | 0 (0.0%) | 0 (0.0%) |
| Health Diagnosing & Treating | 0 (0.0%) | 40 (100.0%) |
| Health Technologists | 0 (0.0%) | 19 (100.0%) |
| Total (Category) | 52 (20.4%) | 203 (79.6%) |
| Total (Overall) | 841 (58.7%) | 592 (41.3%) |
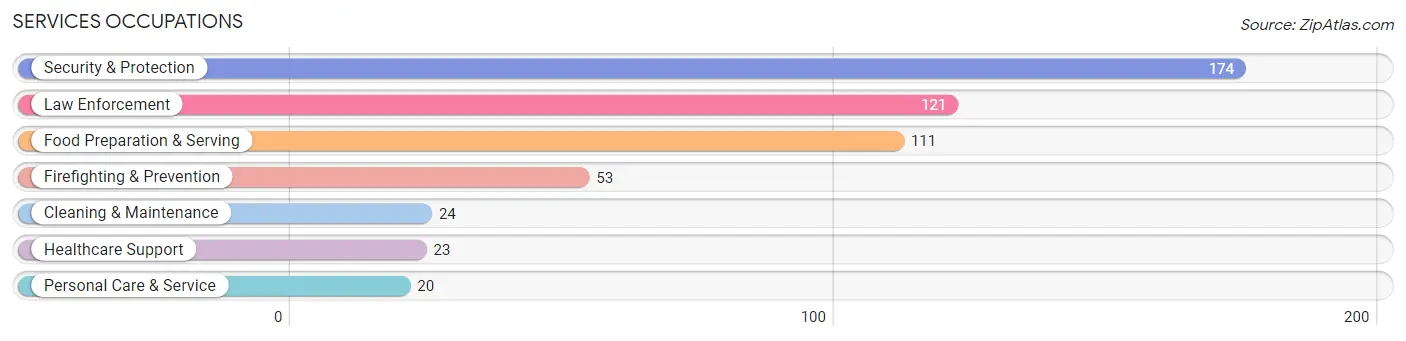
Services Occupations
The most common Services occupations in Connell are Security & Protection (174 | 12.1%), Law Enforcement (121 | 8.4%), Food Preparation & Serving (111 | 7.7%), Firefighting & Prevention (53 | 3.7%), and Cleaning & Maintenance (24 | 1.7%).
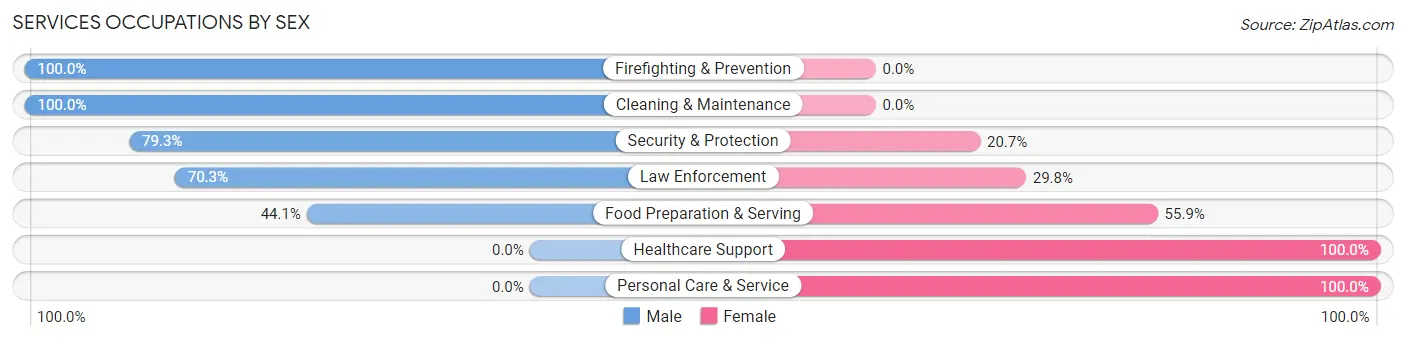
Services Occupations by Sex
Within the Services occupations in Connell, the most male-oriented occupations are Firefighting & Prevention (100.0%), Cleaning & Maintenance (100.0%), and Security & Protection (79.3%), while the most female-oriented occupations are Healthcare Support (100.0%), Personal Care & Service (100.0%), and Food Preparation & Serving (55.9%).
| Occupation | Male | Female |
| Healthcare Support | 0 (0.0%) | 23 (100.0%) |
| Security & Protection | 138 (79.3%) | 36 (20.7%) |
| Firefighting & Prevention | 53 (100.0%) | 0 (0.0%) |
| Law Enforcement | 85 (70.3%) | 36 (29.7%) |
| Food Preparation & Serving | 49 (44.1%) | 62 (55.9%) |
| Cleaning & Maintenance | 24 (100.0%) | 0 (0.0%) |
| Personal Care & Service | 0 (0.0%) | 20 (100.0%) |
| Total (Category) | 211 (59.9%) | 141 (40.1%) |
| Total (Overall) | 841 (58.7%) | 592 (41.3%) |
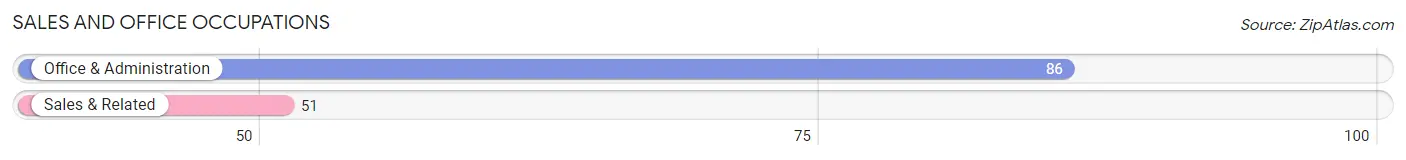
Sales and Office Occupations
The most common Sales and Office occupations in Connell are Office & Administration (86 | 6.0%), and Sales & Related (51 | 3.6%).
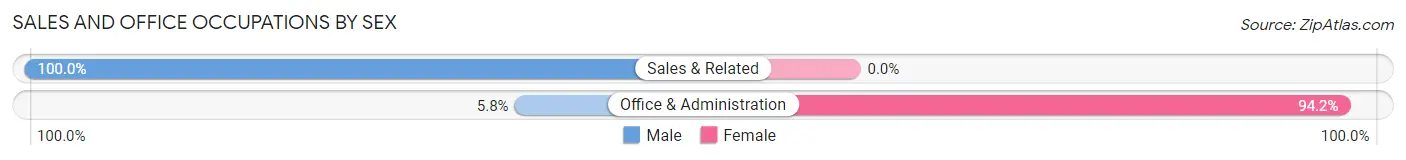
Sales and Office Occupations by Sex
| Occupation | Male | Female |
| Sales & Related | 51 (100.0%) | 0 (0.0%) |
| Office & Administration | 5 (5.8%) | 81 (94.2%) |
| Total (Category) | 56 (40.9%) | 81 (59.1%) |
| Total (Overall) | 841 (58.7%) | 592 (41.3%) |
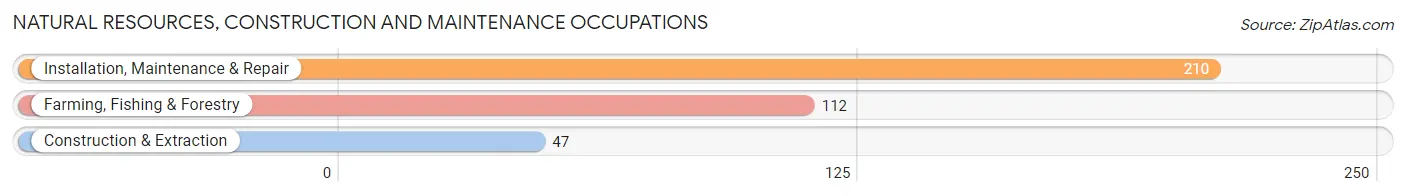
Natural Resources, Construction and Maintenance Occupations
The most common Natural Resources, Construction and Maintenance occupations in Connell are Installation, Maintenance & Repair (210 | 14.6%), Farming, Fishing & Forestry (112 | 7.8%), and Construction & Extraction (47 | 3.3%).
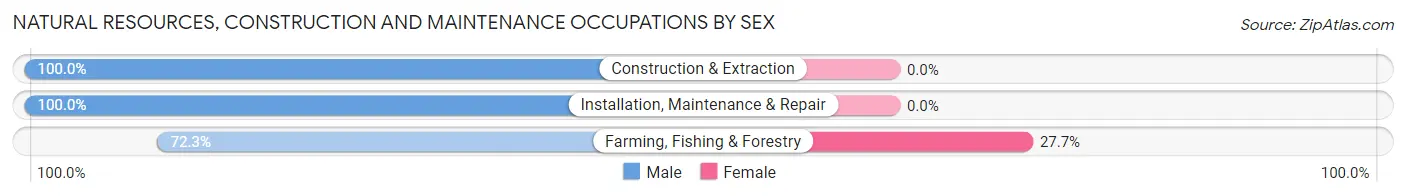
Natural Resources, Construction and Maintenance Occupations by Sex
| Occupation | Male | Female |
| Farming, Fishing & Forestry | 81 (72.3%) | 31 (27.7%) |
| Construction & Extraction | 47 (100.0%) | 0 (0.0%) |
| Installation, Maintenance & Repair | 210 (100.0%) | 0 (0.0%) |
| Total (Category) | 338 (91.6%) | 31 (8.4%) |
| Total (Overall) | 841 (58.7%) | 592 (41.3%) |
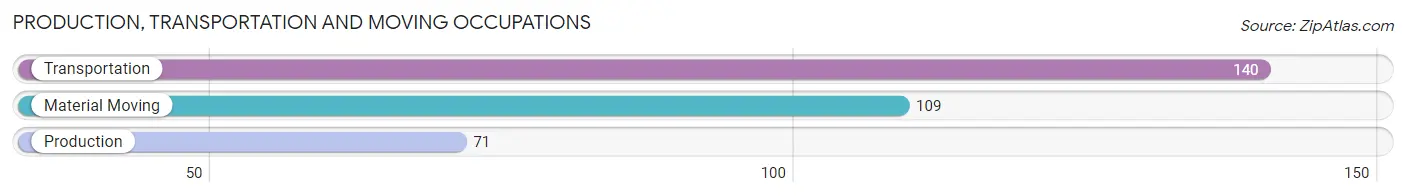
Production, Transportation and Moving Occupations
The most common Production, Transportation and Moving occupations in Connell are Transportation (140 | 9.8%), Material Moving (109 | 7.6%), and Production (71 | 5.0%).
Production, Transportation and Moving Occupations by Sex
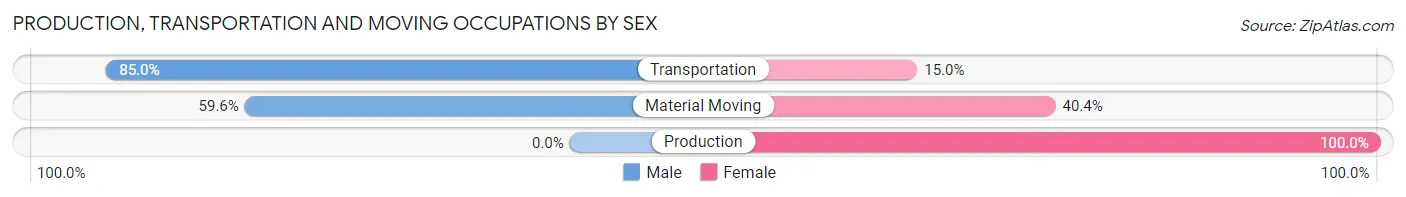
| Occupation | Male | Female |
| Production | 0 (0.0%) | 71 (100.0%) |
| Transportation | 119 (85.0%) | 21 (15.0%) |
| Material Moving | 65 (59.6%) | 44 (40.4%) |
| Total (Category) | 184 (57.5%) | 136 (42.5%) |
| Total (Overall) | 841 (58.7%) | 592 (41.3%) |
Employment Industries by Sex in Connell
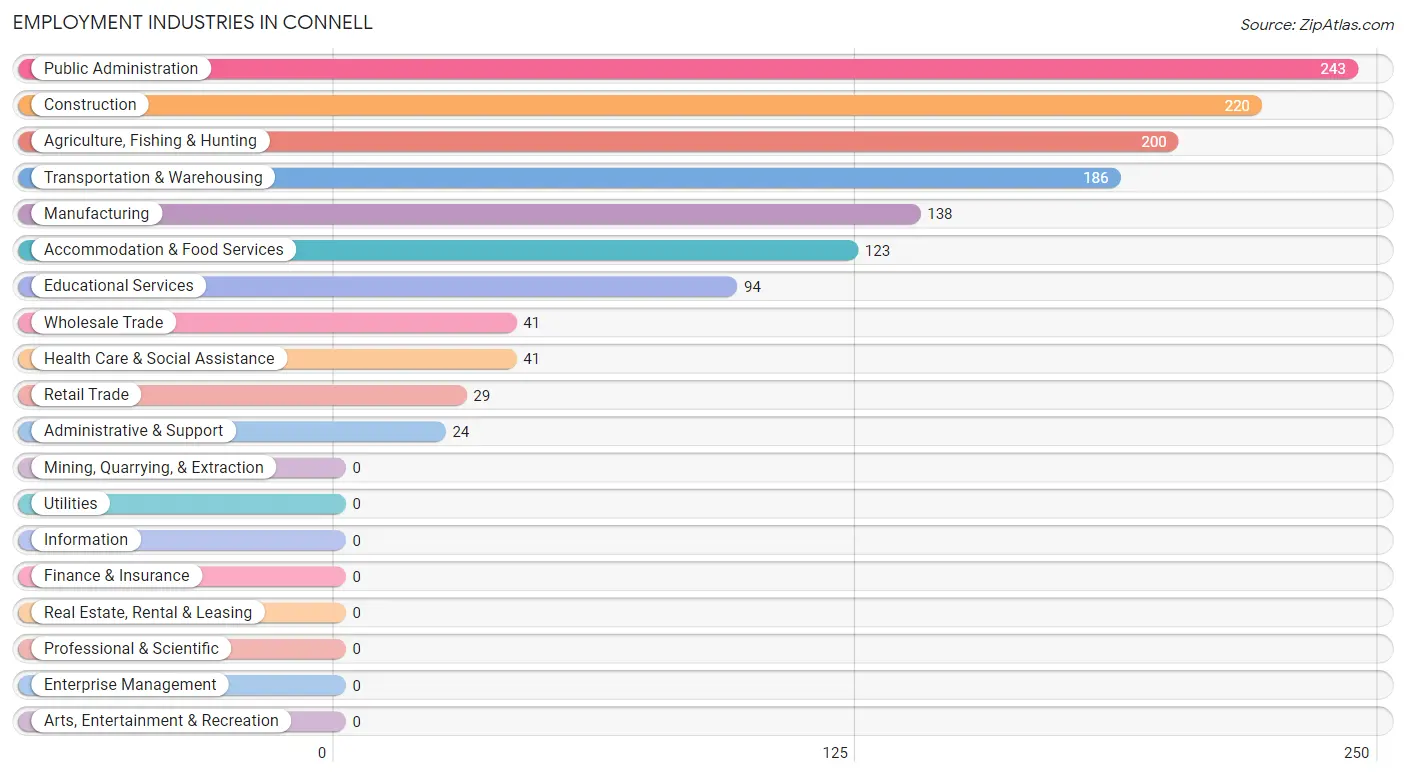
Employment Industries in Connell
The major employment industries in Connell include Public Administration (243 | 17.0%), Construction (220 | 15.3%), Agriculture, Fishing & Hunting (200 | 14.0%), Transportation & Warehousing (186 | 13.0%), and Manufacturing (138 | 9.6%).
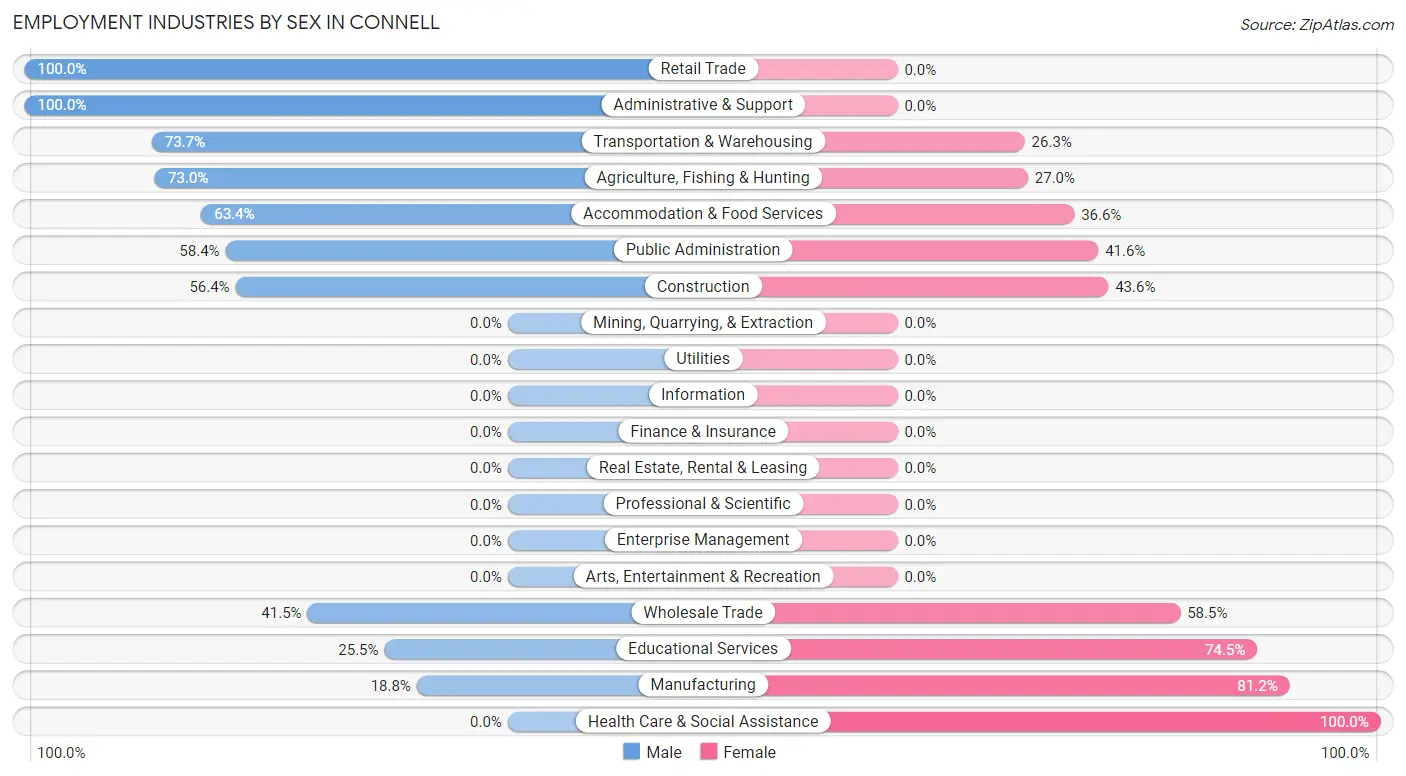
Employment Industries by Sex in Connell
The Connell industries that see more men than women are Retail Trade (100.0%), Administrative & Support (100.0%), and Transportation & Warehousing (73.7%), whereas the industries that tend to have a higher number of women are Health Care & Social Assistance (100.0%), Manufacturing (81.2%), and Educational Services (74.5%).
| Industry | Male | Female |
| Agriculture, Fishing & Hunting | 146 (73.0%) | 54 (27.0%) |
| Mining, Quarrying, & Extraction | 0 (0.0%) | 0 (0.0%) |
| Construction | 124 (56.4%) | 96 (43.6%) |
| Manufacturing | 26 (18.8%) | 112 (81.2%) |
| Wholesale Trade | 17 (41.5%) | 24 (58.5%) |
| Retail Trade | 29 (100.0%) | 0 (0.0%) |
| Transportation & Warehousing | 137 (73.7%) | 49 (26.3%) |
| Utilities | 0 (0.0%) | 0 (0.0%) |
| Information | 0 (0.0%) | 0 (0.0%) |
| Finance & Insurance | 0 (0.0%) | 0 (0.0%) |
| Real Estate, Rental & Leasing | 0 (0.0%) | 0 (0.0%) |
| Professional & Scientific | 0 (0.0%) | 0 (0.0%) |
| Enterprise Management | 0 (0.0%) | 0 (0.0%) |
| Administrative & Support | 24 (100.0%) | 0 (0.0%) |
| Educational Services | 24 (25.5%) | 70 (74.5%) |
| Health Care & Social Assistance | 0 (0.0%) | 41 (100.0%) |
| Arts, Entertainment & Recreation | 0 (0.0%) | 0 (0.0%) |
| Accommodation & Food Services | 78 (63.4%) | 45 (36.6%) |
| Public Administration | 142 (58.4%) | 101 (41.6%) |
| Total | 841 (58.7%) | 592 (41.3%) |
Education in Connell
School Enrollment in Connell
The most common levels of schooling among the 1,315 students in Connell are college / undergraduate (356 | 27.1%), high school (296 | 22.5%), and middle school (238 | 18.1%).
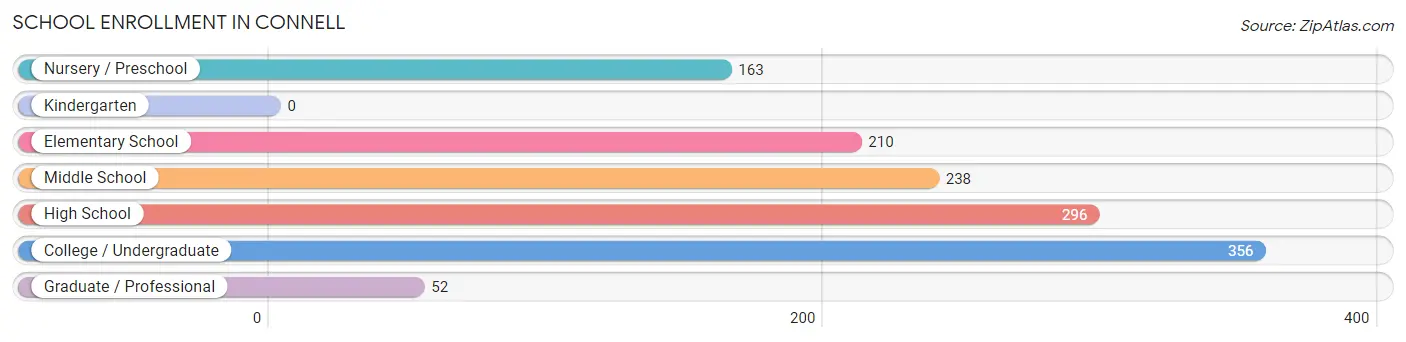
| School Level | # Students | % Students |
| Nursery / Preschool | 163 | 12.4% |
| Kindergarten | 0 | 0.0% |
| Elementary School | 210 | 16.0% |
| Middle School | 238 | 18.1% |
| High School | 296 | 22.5% |
| College / Undergraduate | 356 | 27.1% |
| Graduate / Professional | 52 | 4.0% |
| Total | 1,315 | 100.0% |
School Enrollment by Age by Funding Source in Connell
Out of a total of 1,315 students who are enrolled in schools in Connell, 109 (8.3%) attend a private institution, while the remaining 1,206 (91.7%) are enrolled in public schools. The age group of 3 to 4 year olds has the highest likelihood of being enrolled in private schools, with 76 (58.5% in the age bracket) enrolled. Conversely, the age group of 10 to 14 year olds has the lowest likelihood of being enrolled in a private school, with 275 (100.0% in the age bracket) attending a public institution.
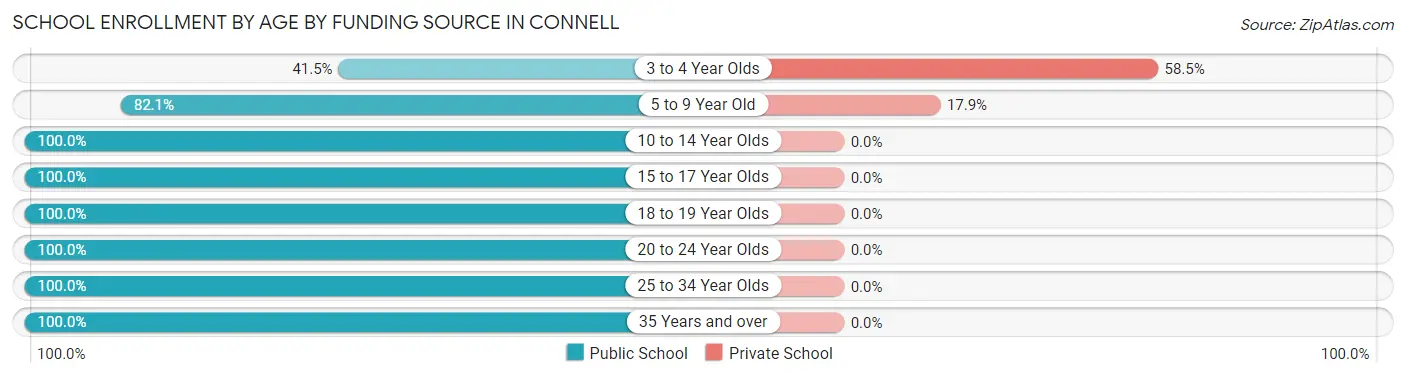
| Age Bracket | Public School | Private School |
| 3 to 4 Year Olds | 54 (41.5%) | 76 (58.5%) |
| 5 to 9 Year Old | 151 (82.1%) | 33 (17.9%) |
| 10 to 14 Year Olds | 275 (100.0%) | 0 (0.0%) |
| 15 to 17 Year Olds | 197 (100.0%) | 0 (0.0%) |
| 18 to 19 Year Olds | 30 (100.0%) | 0 (0.0%) |
| 20 to 24 Year Olds | 78 (100.0%) | 0 (0.0%) |
| 25 to 34 Year Olds | 64 (100.0%) | 0 (0.0%) |
| 35 Years and over | 357 (100.0%) | 0 (0.0%) |
| Total | 1,206 (91.7%) | 109 (8.3%) |
Educational Attainment by Field of Study in Connell
Business (74 | 20.3%), physical & health sciences (61 | 16.8%), education (51 | 14.0%), social sciences (41 | 11.3%), and engineering (30 | 8.2%) are the most common fields of study among 364 individuals in Connell who have obtained a bachelor's degree or higher.
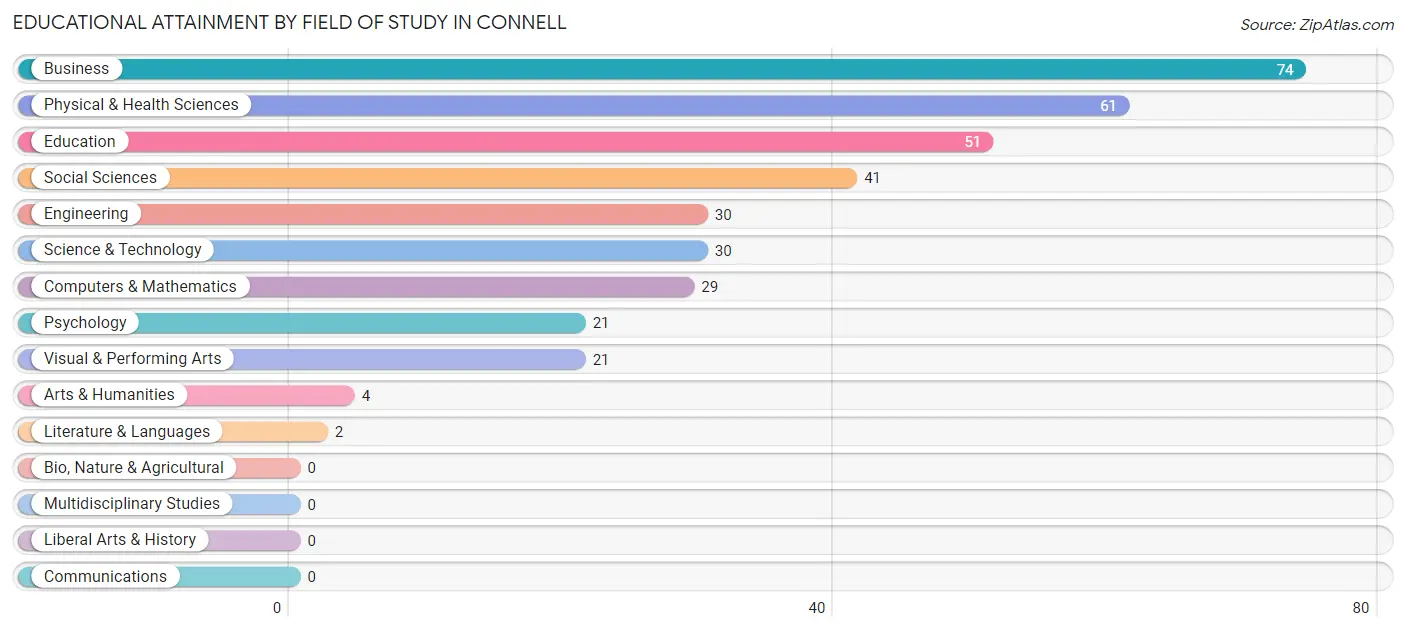
| Field of Study | # Graduates | % Graduates |
| Computers & Mathematics | 29 | 8.0% |
| Bio, Nature & Agricultural | 0 | 0.0% |
| Physical & Health Sciences | 61 | 16.8% |
| Psychology | 21 | 5.8% |
| Social Sciences | 41 | 11.3% |
| Engineering | 30 | 8.2% |
| Multidisciplinary Studies | 0 | 0.0% |
| Science & Technology | 30 | 8.2% |
| Business | 74 | 20.3% |
| Education | 51 | 14.0% |
| Literature & Languages | 2 | 0.5% |
| Liberal Arts & History | 0 | 0.0% |
| Visual & Performing Arts | 21 | 5.8% |
| Communications | 0 | 0.0% |
| Arts & Humanities | 4 | 1.1% |
| Total | 364 | 100.0% |
Transportation & Commute in Connell
Vehicle Availability by Sex in Connell
The most prevalent vehicle ownership categories in Connell are males with 3 vehicles (325, accounting for 38.6%) and females with 3 vehicles (219, making up 56.4%).
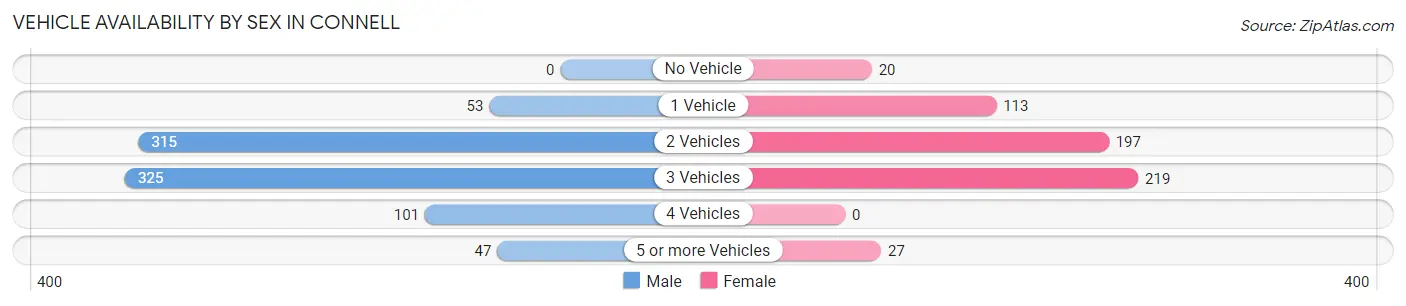
| Vehicles Available | Male | Female |
| No Vehicle | 0 (0.0%) | 20 (3.5%) |
| 1 Vehicle | 53 (6.3%) | 113 (19.6%) |
| 2 Vehicles | 315 (37.5%) | 197 (34.2%) |
| 3 Vehicles | 325 (38.6%) | 219 (38.0%) |
| 4 Vehicles | 101 (12.0%) | 0 (0.0%) |
| 5 or more Vehicles | 47 (5.6%) | 27 (4.7%) |
| Total | 841 (100.0%) | 576 (100.0%) |
Commute Time in Connell
The most frequently occuring commute durations in Connell are 15 to 19 minutes (294 commuters, 22.6%), less than 5 minutes (261 commuters, 20.0%), and 5 to 9 minutes (228 commuters, 17.5%).
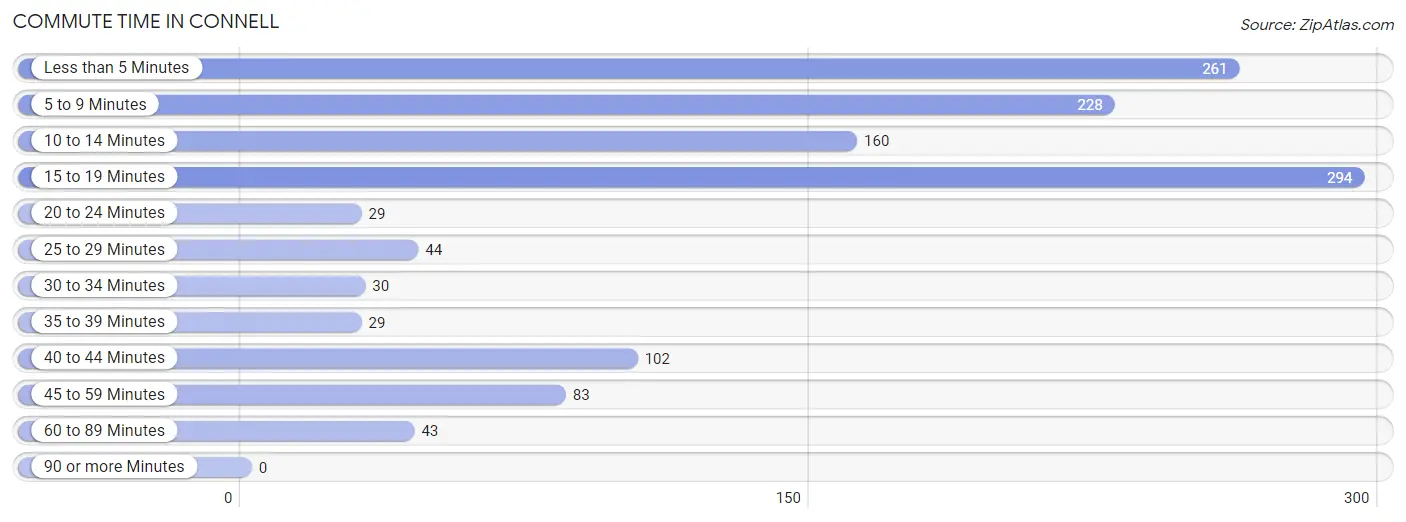
| Commute Time | # Commuters | % Commuters |
| Less than 5 Minutes | 261 | 20.0% |
| 5 to 9 Minutes | 228 | 17.5% |
| 10 to 14 Minutes | 160 | 12.3% |
| 15 to 19 Minutes | 294 | 22.6% |
| 20 to 24 Minutes | 29 | 2.2% |
| 25 to 29 Minutes | 44 | 3.4% |
| 30 to 34 Minutes | 30 | 2.3% |
| 35 to 39 Minutes | 29 | 2.2% |
| 40 to 44 Minutes | 102 | 7.8% |
| 45 to 59 Minutes | 83 | 6.4% |
| 60 to 89 Minutes | 43 | 3.3% |
| 90 or more Minutes | 0 | 0.0% |
Commute Time by Sex in Connell
The most common commute times in Connell are 15 to 19 minutes (244 commuters, 30.8%) for males and 10 to 14 minutes (136 commuters, 26.6%) for females.
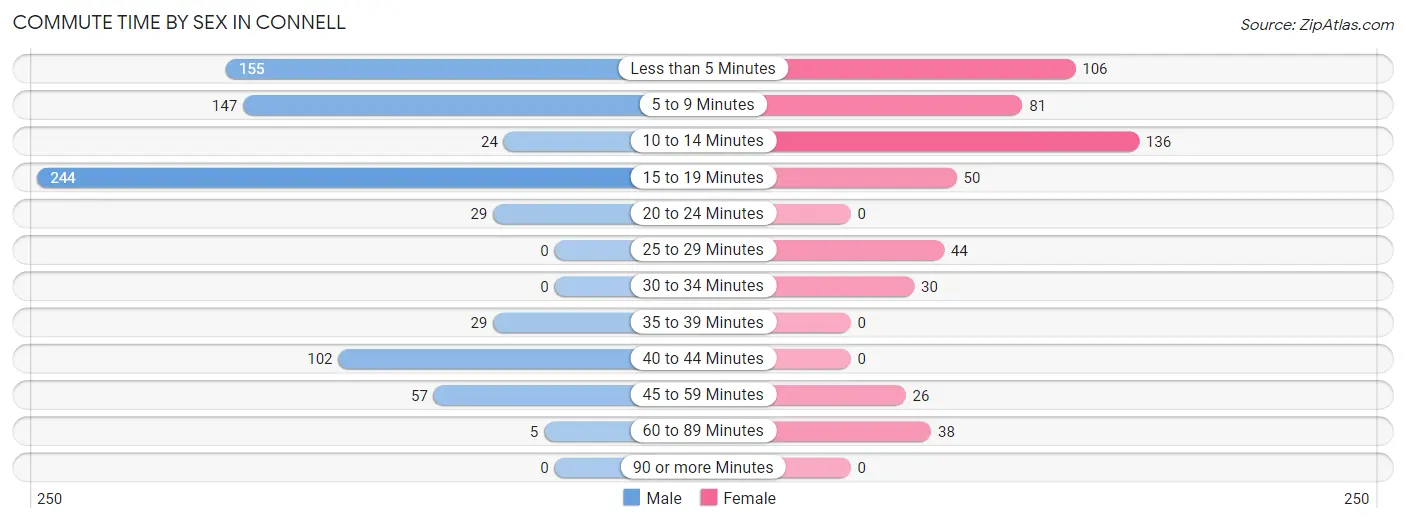
| Commute Time | Male | Female |
| Less than 5 Minutes | 155 (19.6%) | 106 (20.7%) |
| 5 to 9 Minutes | 147 (18.6%) | 81 (15.9%) |
| 10 to 14 Minutes | 24 (3.0%) | 136 (26.6%) |
| 15 to 19 Minutes | 244 (30.8%) | 50 (9.8%) |
| 20 to 24 Minutes | 29 (3.7%) | 0 (0.0%) |
| 25 to 29 Minutes | 0 (0.0%) | 44 (8.6%) |
| 30 to 34 Minutes | 0 (0.0%) | 30 (5.9%) |
| 35 to 39 Minutes | 29 (3.7%) | 0 (0.0%) |
| 40 to 44 Minutes | 102 (12.9%) | 0 (0.0%) |
| 45 to 59 Minutes | 57 (7.2%) | 26 (5.1%) |
| 60 to 89 Minutes | 5 (0.6%) | 38 (7.4%) |
| 90 or more Minutes | 0 (0.0%) | 0 (0.0%) |
Time of Departure to Work by Sex in Connell
The most frequent times of departure to work in Connell are 7:00 AM to 7:29 AM (287, 36.2%) for males and 7:30 AM to 7:59 AM (185, 36.2%) for females.
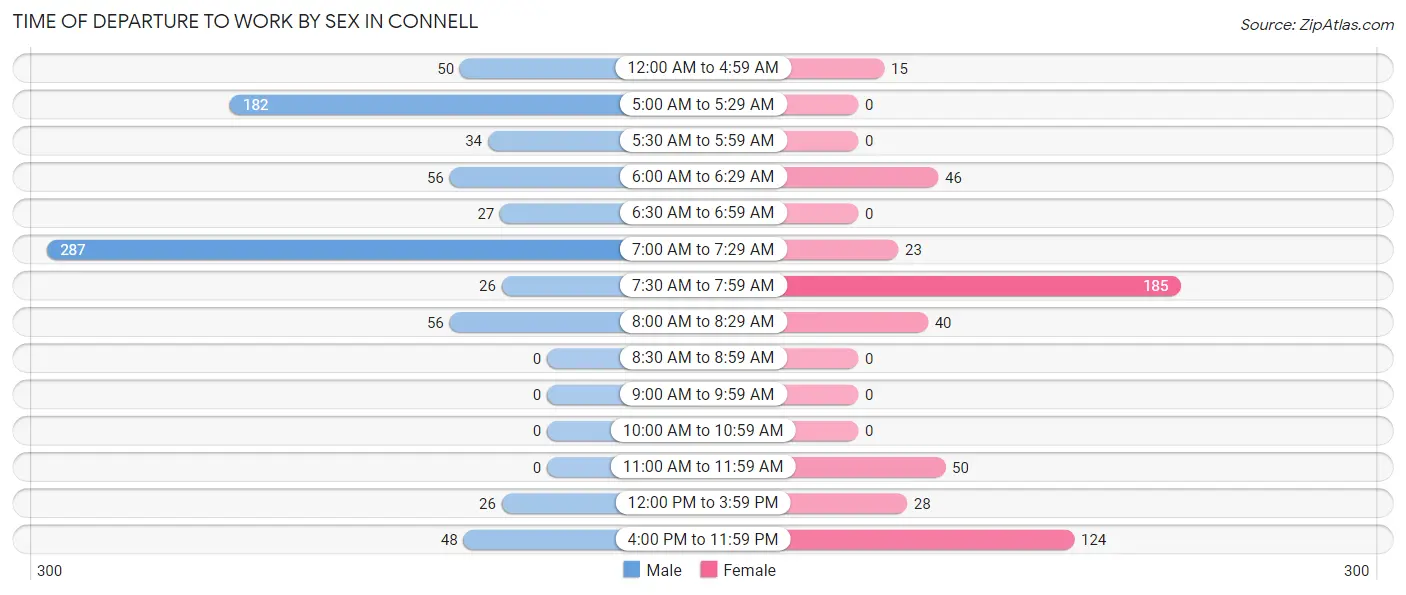
| Time of Departure | Male | Female |
| 12:00 AM to 4:59 AM | 50 (6.3%) | 15 (2.9%) |
| 5:00 AM to 5:29 AM | 182 (23.0%) | 0 (0.0%) |
| 5:30 AM to 5:59 AM | 34 (4.3%) | 0 (0.0%) |
| 6:00 AM to 6:29 AM | 56 (7.1%) | 46 (9.0%) |
| 6:30 AM to 6:59 AM | 27 (3.4%) | 0 (0.0%) |
| 7:00 AM to 7:29 AM | 287 (36.2%) | 23 (4.5%) |
| 7:30 AM to 7:59 AM | 26 (3.3%) | 185 (36.2%) |
| 8:00 AM to 8:29 AM | 56 (7.1%) | 40 (7.8%) |
| 8:30 AM to 8:59 AM | 0 (0.0%) | 0 (0.0%) |
| 9:00 AM to 9:59 AM | 0 (0.0%) | 0 (0.0%) |
| 10:00 AM to 10:59 AM | 0 (0.0%) | 0 (0.0%) |
| 11:00 AM to 11:59 AM | 0 (0.0%) | 50 (9.8%) |
| 12:00 PM to 3:59 PM | 26 (3.3%) | 28 (5.5%) |
| 4:00 PM to 11:59 PM | 48 (6.1%) | 124 (24.3%) |
| Total | 792 (100.0%) | 511 (100.0%) |
Housing Occupancy in Connell
Occupancy by Ownership in Connell
Of the total 1,212 dwellings in Connell, owner-occupied units account for 852 (70.3%), while renter-occupied units make up 360 (29.7%).
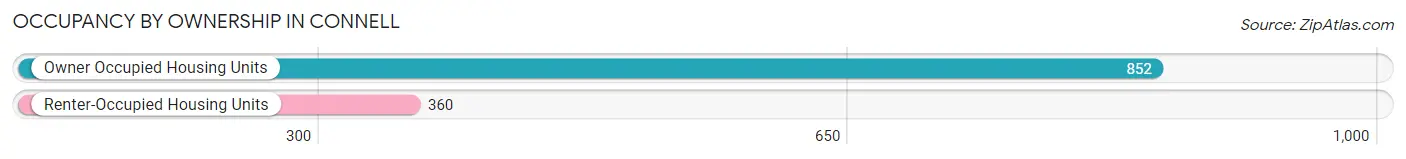
| Occupancy | # Housing Units | % Housing Units |
| Owner Occupied Housing Units | 852 | 70.3% |
| Renter-Occupied Housing Units | 360 | 29.7% |
| Total Occupied Housing Units | 1,212 | 100.0% |
Occupancy by Household Size in Connell
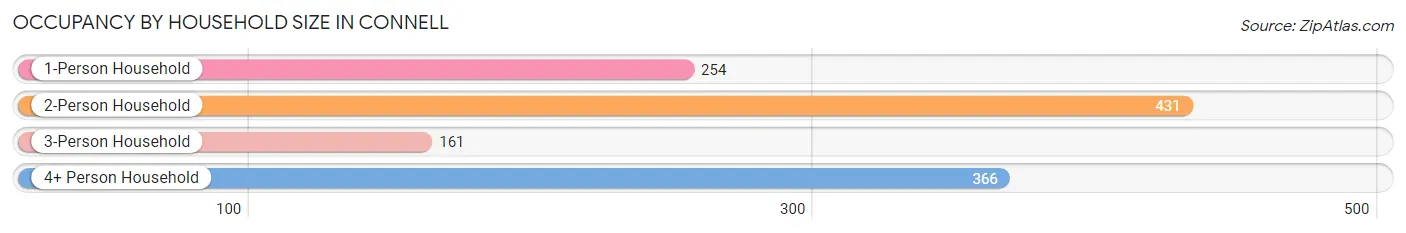
| Household Size | # Housing Units | % Housing Units |
| 1-Person Household | 254 | 21.0% |
| 2-Person Household | 431 | 35.6% |
| 3-Person Household | 161 | 13.3% |
| 4+ Person Household | 366 | 30.2% |
| Total Housing Units | 1,212 | 100.0% |
Occupancy by Ownership by Household Size in Connell
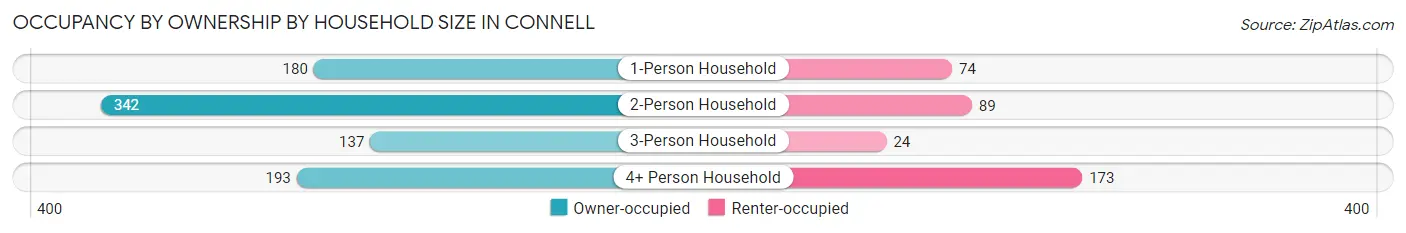
| Household Size | Owner-occupied | Renter-occupied |
| 1-Person Household | 180 (70.9%) | 74 (29.1%) |
| 2-Person Household | 342 (79.3%) | 89 (20.6%) |
| 3-Person Household | 137 (85.1%) | 24 (14.9%) |
| 4+ Person Household | 193 (52.7%) | 173 (47.3%) |
| Total Housing Units | 852 (70.3%) | 360 (29.7%) |
Occupancy by Educational Attainment in Connell
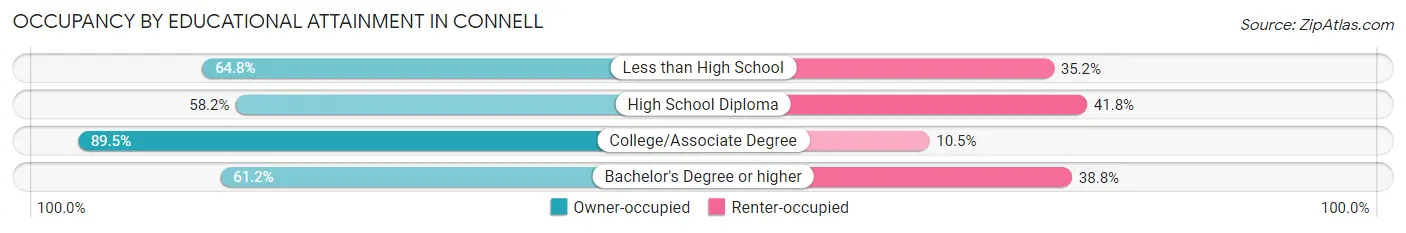
| Household Size | Owner-occupied | Renter-occupied |
| Less than High School | 206 (64.8%) | 112 (35.2%) |
| High School Diploma | 216 (58.2%) | 155 (41.8%) |
| College/Associate Degree | 348 (89.5%) | 41 (10.5%) |
| Bachelor's Degree or higher | 82 (61.2%) | 52 (38.8%) |
Occupancy by Age of Householder in Connell
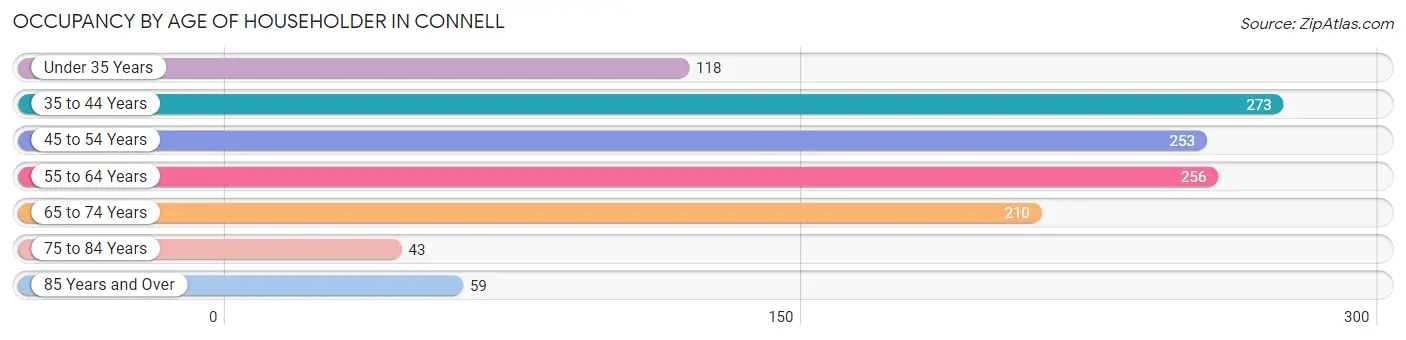
| Age Bracket | # Households | % Households |
| Under 35 Years | 118 | 9.7% |
| 35 to 44 Years | 273 | 22.5% |
| 45 to 54 Years | 253 | 20.9% |
| 55 to 64 Years | 256 | 21.1% |
| 65 to 74 Years | 210 | 17.3% |
| 75 to 84 Years | 43 | 3.5% |
| 85 Years and Over | 59 | 4.9% |
| Total | 1,212 | 100.0% |
Housing Finances in Connell
Median Income by Occupancy in Connell
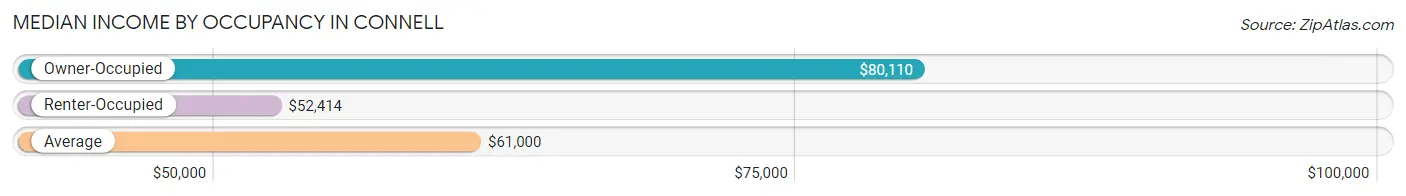
| Occupancy Type | # Households | Median Income |
| Owner-Occupied | 852 (70.3%) | $80,110 |
| Renter-Occupied | 360 (29.7%) | $52,414 |
| Average | 1,212 (100.0%) | $61,000 |
Occupancy by Householder Income Bracket in Connell
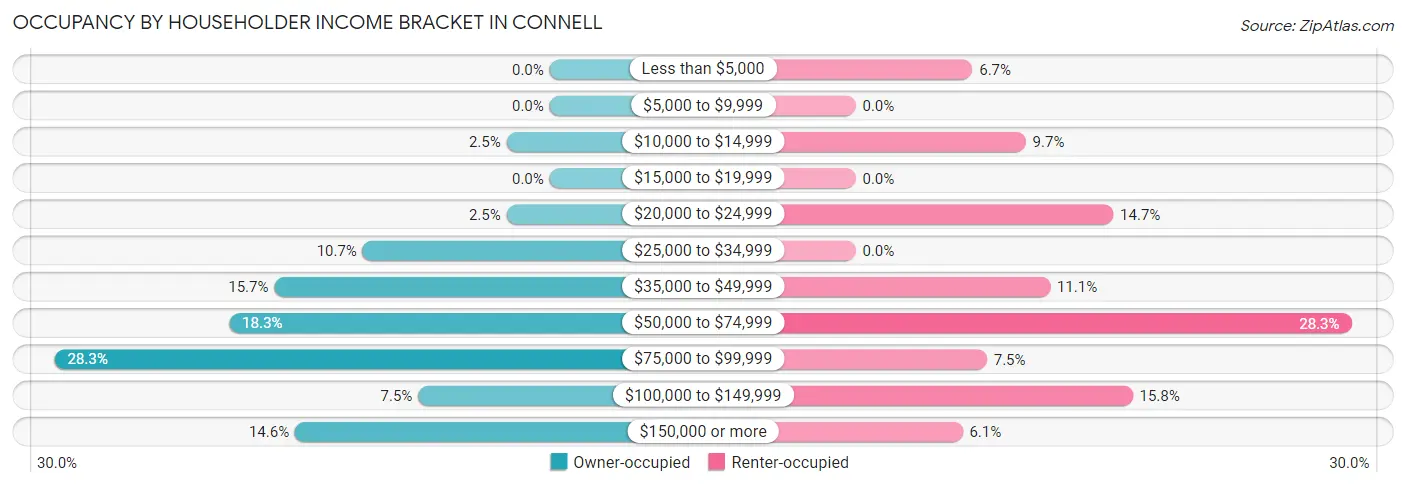
| Income Bracket | Owner-occupied | Renter-occupied |
| Less than $5,000 | 0 (0.0%) | 24 (6.7%) |
| $5,000 to $9,999 | 0 (0.0%) | 0 (0.0%) |
| $10,000 to $14,999 | 21 (2.5%) | 35 (9.7%) |
| $15,000 to $19,999 | 0 (0.0%) | 0 (0.0%) |
| $20,000 to $24,999 | 21 (2.5%) | 53 (14.7%) |
| $25,000 to $34,999 | 91 (10.7%) | 0 (0.0%) |
| $35,000 to $49,999 | 134 (15.7%) | 40 (11.1%) |
| $50,000 to $74,999 | 156 (18.3%) | 102 (28.3%) |
| $75,000 to $99,999 | 241 (28.3%) | 27 (7.5%) |
| $100,000 to $149,999 | 64 (7.5%) | 57 (15.8%) |
| $150,000 or more | 124 (14.5%) | 22 (6.1%) |
| Total | 852 (100.0%) | 360 (100.0%) |
Monthly Housing Cost Tiers in Connell
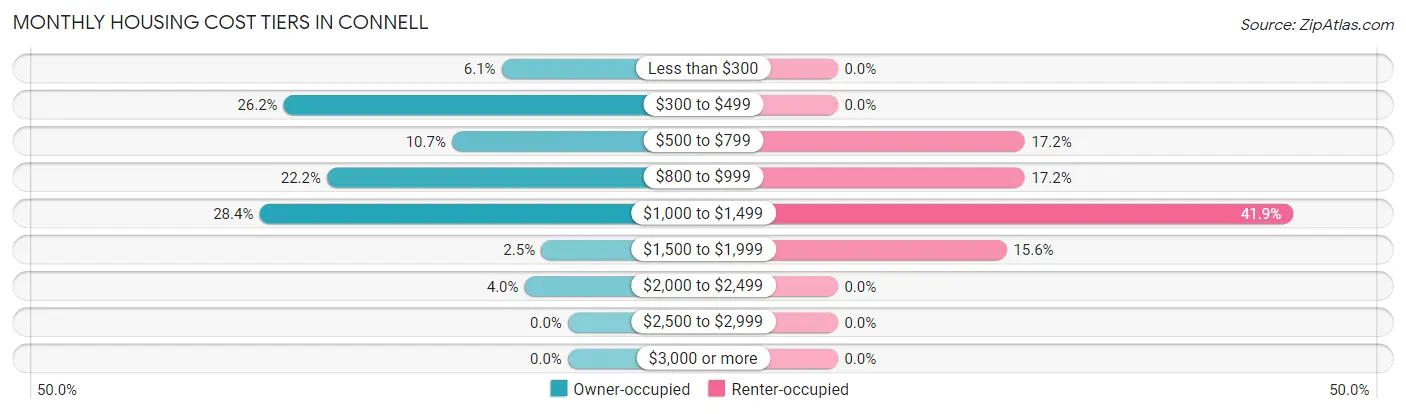
| Monthly Cost | Owner-occupied | Renter-occupied |
| Less than $300 | 52 (6.1%) | 0 (0.0%) |
| $300 to $499 | 223 (26.2%) | 0 (0.0%) |
| $500 to $799 | 91 (10.7%) | 62 (17.2%) |
| $800 to $999 | 189 (22.2%) | 62 (17.2%) |
| $1,000 to $1,499 | 242 (28.4%) | 151 (41.9%) |
| $1,500 to $1,999 | 21 (2.5%) | 56 (15.6%) |
| $2,000 to $2,499 | 34 (4.0%) | 0 (0.0%) |
| $2,500 to $2,999 | 0 (0.0%) | 0 (0.0%) |
| $3,000 or more | 0 (0.0%) | 0 (0.0%) |
| Total | 852 (100.0%) | 360 (100.0%) |
Physical Housing Characteristics in Connell
Housing Structures in Connell
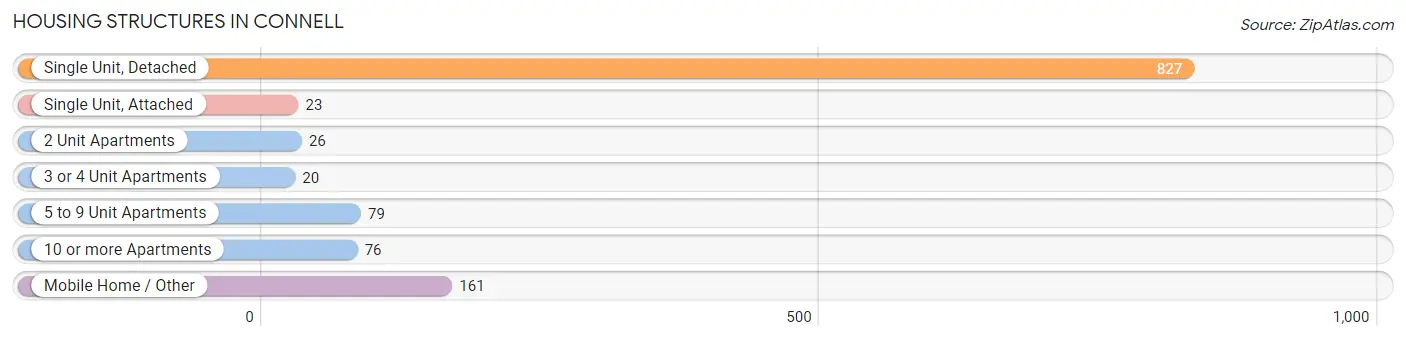
| Structure Type | # Housing Units | % Housing Units |
| Single Unit, Detached | 827 | 68.2% |
| Single Unit, Attached | 23 | 1.9% |
| 2 Unit Apartments | 26 | 2.1% |
| 3 or 4 Unit Apartments | 20 | 1.7% |
| 5 to 9 Unit Apartments | 79 | 6.5% |
| 10 or more Apartments | 76 | 6.3% |
| Mobile Home / Other | 161 | 13.3% |
| Total | 1,212 | 100.0% |
Housing Structures by Occupancy in Connell
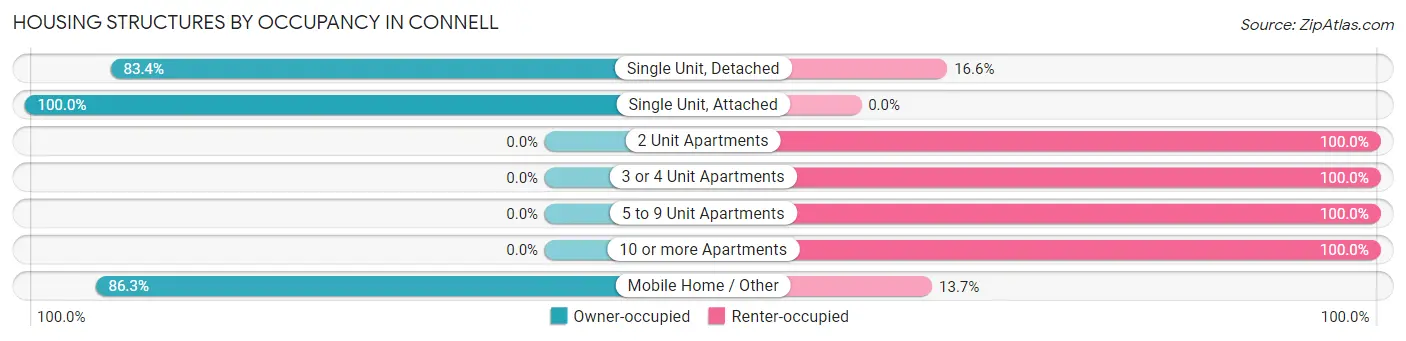
| Structure Type | Owner-occupied | Renter-occupied |
| Single Unit, Detached | 690 (83.4%) | 137 (16.6%) |
| Single Unit, Attached | 23 (100.0%) | 0 (0.0%) |
| 2 Unit Apartments | 0 (0.0%) | 26 (100.0%) |
| 3 or 4 Unit Apartments | 0 (0.0%) | 20 (100.0%) |
| 5 to 9 Unit Apartments | 0 (0.0%) | 79 (100.0%) |
| 10 or more Apartments | 0 (0.0%) | 76 (100.0%) |
| Mobile Home / Other | 139 (86.3%) | 22 (13.7%) |
| Total | 852 (70.3%) | 360 (29.7%) |
Housing Structures by Number of Rooms in Connell
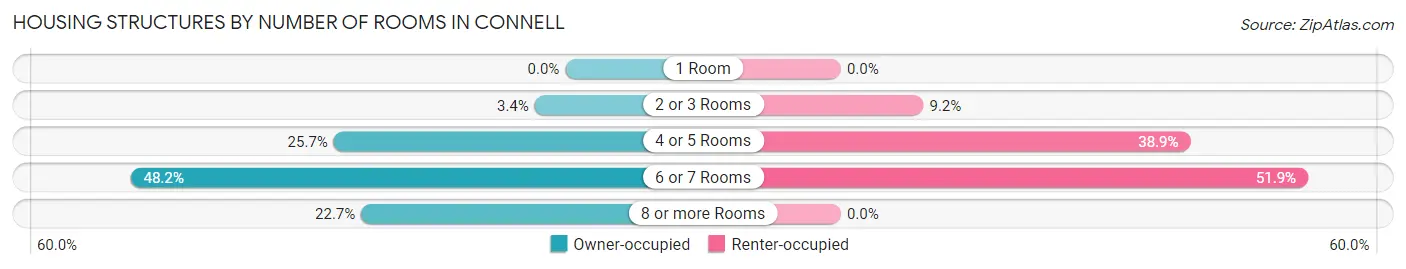
| Number of Rooms | Owner-occupied | Renter-occupied |
| 1 Room | 0 (0.0%) | 0 (0.0%) |
| 2 or 3 Rooms | 29 (3.4%) | 33 (9.2%) |
| 4 or 5 Rooms | 219 (25.7%) | 140 (38.9%) |
| 6 or 7 Rooms | 411 (48.2%) | 187 (51.9%) |
| 8 or more Rooms | 193 (22.7%) | 0 (0.0%) |
| Total | 852 (100.0%) | 360 (100.0%) |
Housing Structure by Heating Type in Connell
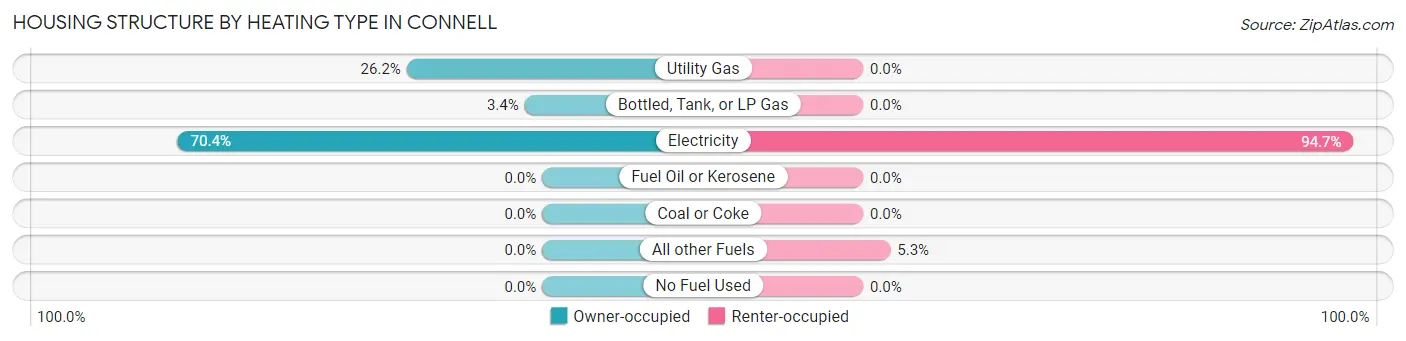
| Heating Type | Owner-occupied | Renter-occupied |
| Utility Gas | 223 (26.2%) | 0 (0.0%) |
| Bottled, Tank, or LP Gas | 29 (3.4%) | 0 (0.0%) |
| Electricity | 600 (70.4%) | 341 (94.7%) |
| Fuel Oil or Kerosene | 0 (0.0%) | 0 (0.0%) |
| Coal or Coke | 0 (0.0%) | 0 (0.0%) |
| All other Fuels | 0 (0.0%) | 19 (5.3%) |
| No Fuel Used | 0 (0.0%) | 0 (0.0%) |
| Total | 852 (100.0%) | 360 (100.0%) |
Household Vehicle Usage in Connell
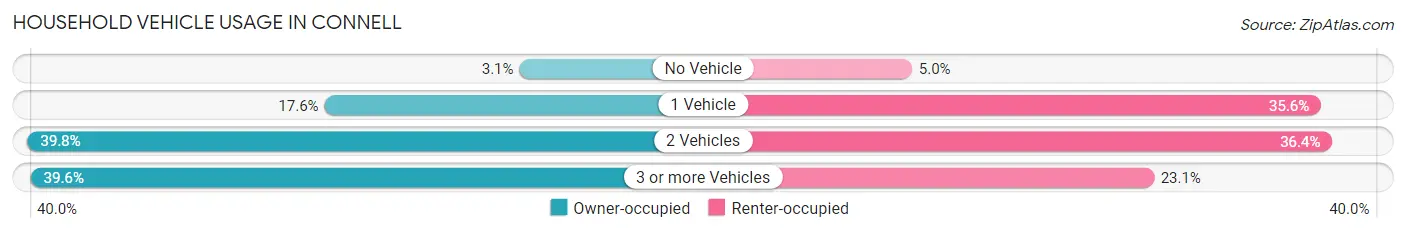
| Vehicles per Household | Owner-occupied | Renter-occupied |
| No Vehicle | 26 (3.0%) | 18 (5.0%) |
| 1 Vehicle | 150 (17.6%) | 128 (35.6%) |
| 2 Vehicles | 339 (39.8%) | 131 (36.4%) |
| 3 or more Vehicles | 337 (39.6%) | 83 (23.1%) |
| Total | 852 (100.0%) | 360 (100.0%) |
Real Estate & Mortgages in Connell
Real Estate and Mortgage Overview in Connell
| Characteristic | Without Mortgage | With Mortgage |
| Housing Units | 479 | 373 |
| Median Property Value | $293,800 | $173,100 |
| Median Household Income | $61,450 | $34 |
| Monthly Housing Costs | $490 | $0 |
| Real Estate Taxes | $1,471 | $52 |
Property Value by Mortgage Status in Connell
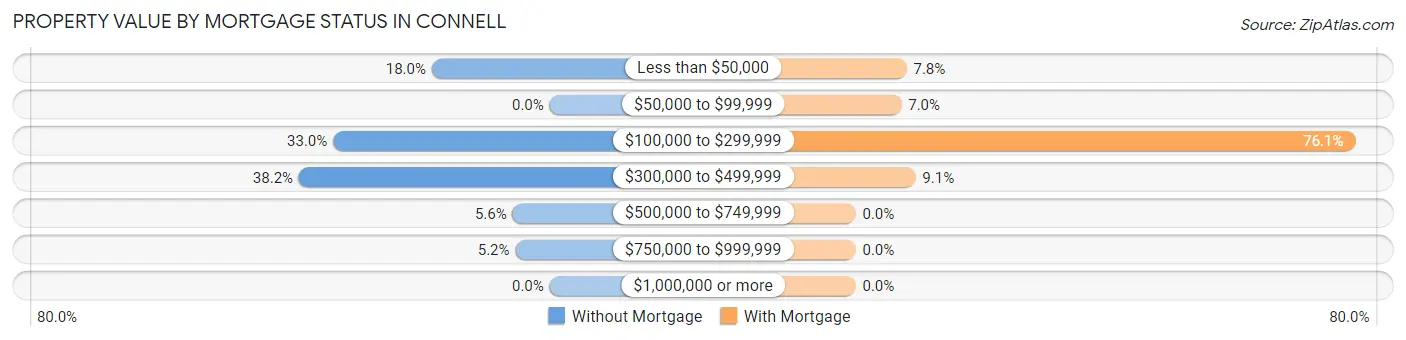
| Property Value | Without Mortgage | With Mortgage |
| Less than $50,000 | 86 (17.9%) | 29 (7.8%) |
| $50,000 to $99,999 | 0 (0.0%) | 26 (7.0%) |
| $100,000 to $299,999 | 158 (33.0%) | 284 (76.1%) |
| $300,000 to $499,999 | 183 (38.2%) | 34 (9.1%) |
| $500,000 to $749,999 | 27 (5.6%) | 0 (0.0%) |
| $750,000 to $999,999 | 25 (5.2%) | 0 (0.0%) |
| $1,000,000 or more | 0 (0.0%) | 0 (0.0%) |
| Total | 479 (100.0%) | 373 (100.0%) |
Household Income by Mortgage Status in Connell
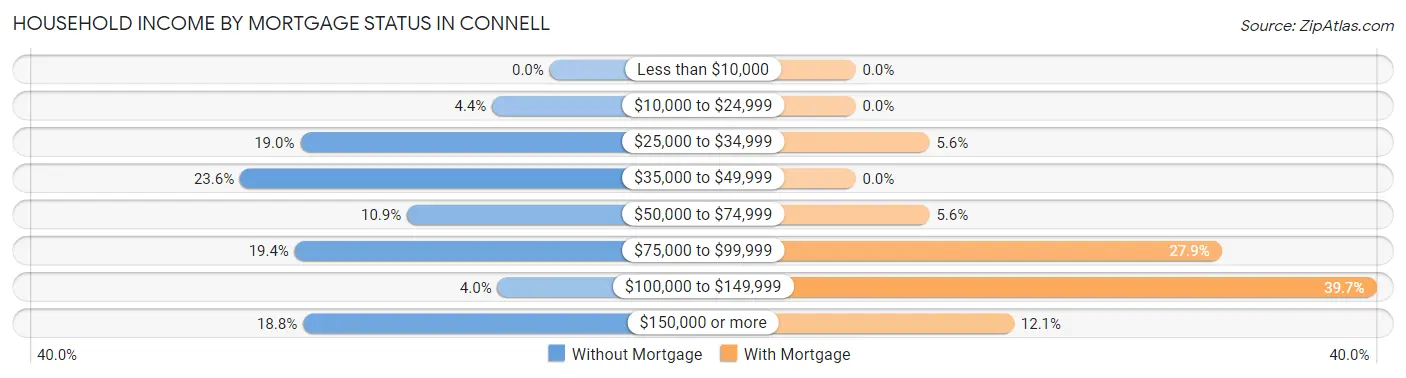
| Household Income | Without Mortgage | With Mortgage |
| Less than $10,000 | 0 (0.0%) | 0 (0.0%) |
| $10,000 to $24,999 | 21 (4.4%) | 0 (0.0%) |
| $25,000 to $34,999 | 91 (19.0%) | 21 (5.6%) |
| $35,000 to $49,999 | 113 (23.6%) | 0 (0.0%) |
| $50,000 to $74,999 | 52 (10.9%) | 21 (5.6%) |
| $75,000 to $99,999 | 93 (19.4%) | 104 (27.9%) |
| $100,000 to $149,999 | 19 (4.0%) | 148 (39.7%) |
| $150,000 or more | 90 (18.8%) | 45 (12.1%) |
| Total | 479 (100.0%) | 373 (100.0%) |
Property Value to Household Income Ratio in Connell
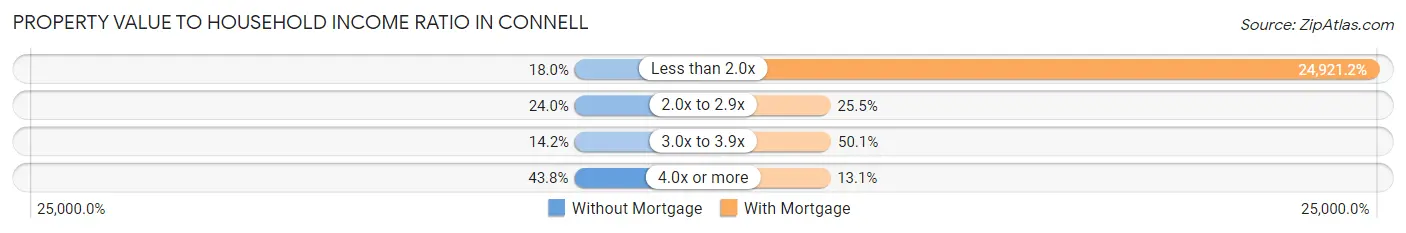
| Value-to-Income Ratio | Without Mortgage | With Mortgage |
| Less than 2.0x | 86 (17.9%) | 92,956 (24,921.2%) |
| 2.0x to 2.9x | 115 (24.0%) | 95 (25.5%) |
| 3.0x to 3.9x | 68 (14.2%) | 187 (50.1%) |
| 4.0x or more | 210 (43.8%) | 49 (13.1%) |
| Total | 479 (100.0%) | 373 (100.0%) |
Real Estate Taxes by Mortgage Status in Connell
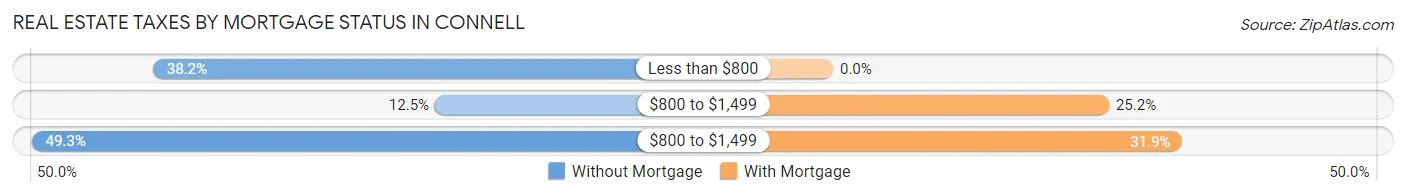
| Property Taxes | Without Mortgage | With Mortgage |
| Less than $800 | 183 (38.2%) | 0 (0.0%) |
| $800 to $1,499 | 60 (12.5%) | 94 (25.2%) |
| $800 to $1,499 | 236 (49.3%) | 119 (31.9%) |
| Total | 479 (100.0%) | 373 (100.0%) |
Health & Disability in Connell
Health Insurance Coverage by Age in Connell
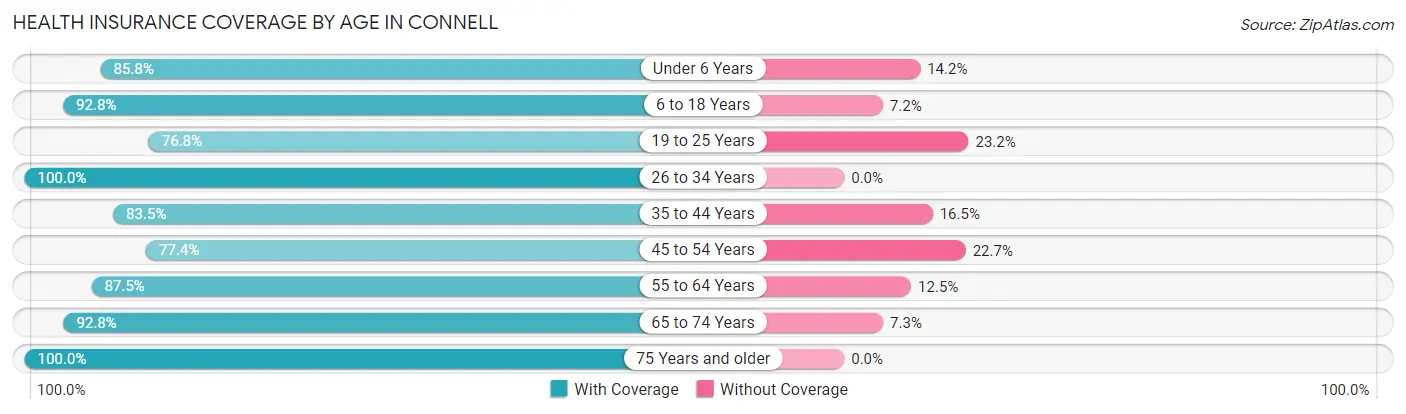
| Age Bracket | With Coverage | Without Coverage |
| Under 6 Years | 285 (85.8%) | 47 (14.2%) |
| 6 to 18 Years | 696 (92.8%) | 54 (7.2%) |
| 19 to 25 Years | 252 (76.8%) | 76 (23.2%) |
| 26 to 34 Years | 190 (100.0%) | 0 (0.0%) |
| 35 to 44 Years | 481 (83.5%) | 95 (16.5%) |
| 45 to 54 Years | 362 (77.3%) | 106 (22.7%) |
| 55 to 64 Years | 379 (87.5%) | 54 (12.5%) |
| 65 to 74 Years | 371 (92.7%) | 29 (7.2%) |
| 75 Years and older | 137 (100.0%) | 0 (0.0%) |
| Total | 3,153 (87.2%) | 461 (12.8%) |
Health Insurance Coverage by Citizenship Status in Connell
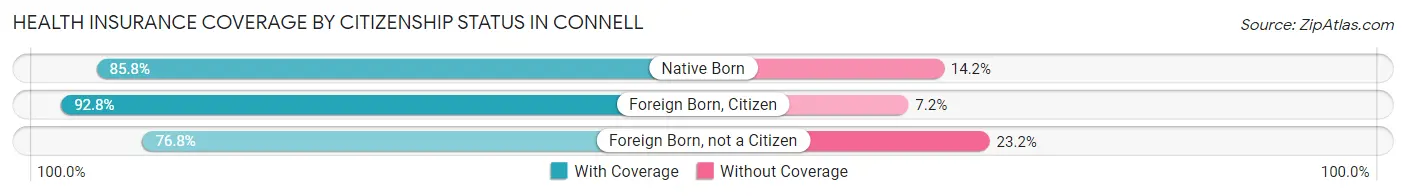
| Citizenship Status | With Coverage | Without Coverage |
| Native Born | 285 (85.8%) | 47 (14.2%) |
| Foreign Born, Citizen | 696 (92.8%) | 54 (7.2%) |
| Foreign Born, not a Citizen | 252 (76.8%) | 76 (23.2%) |
Health Insurance Coverage by Household Income in Connell
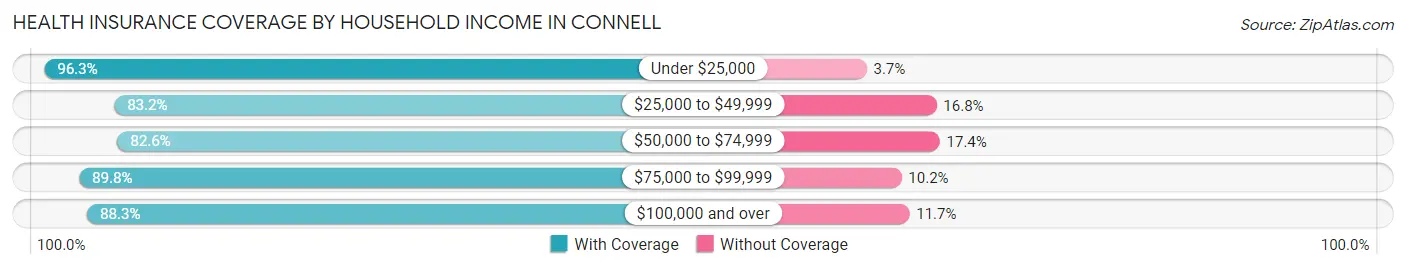
| Household Income | With Coverage | Without Coverage |
| Under $25,000 | 338 (96.3%) | 13 (3.7%) |
| $25,000 to $49,999 | 560 (83.2%) | 113 (16.8%) |
| $50,000 to $74,999 | 608 (82.6%) | 128 (17.4%) |
| $75,000 to $99,999 | 614 (89.8%) | 70 (10.2%) |
| $100,000 and over | 1,033 (88.3%) | 137 (11.7%) |
Public vs Private Health Insurance Coverage by Age in Connell
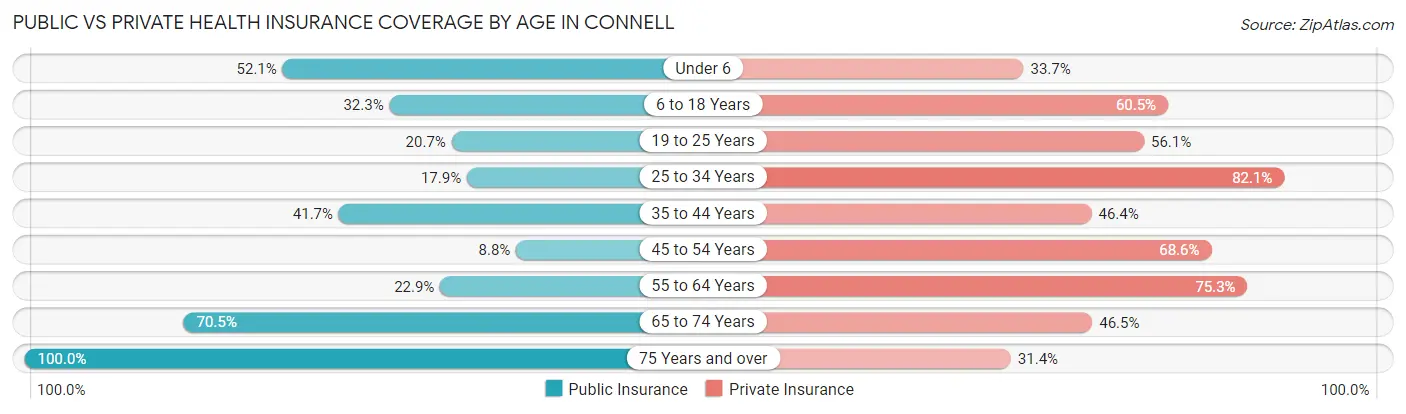
| Age Bracket | Public Insurance | Private Insurance |
| Under 6 | 173 (52.1%) | 112 (33.7%) |
| 6 to 18 Years | 242 (32.3%) | 454 (60.5%) |
| 19 to 25 Years | 68 (20.7%) | 184 (56.1%) |
| 25 to 34 Years | 34 (17.9%) | 156 (82.1%) |
| 35 to 44 Years | 240 (41.7%) | 267 (46.4%) |
| 45 to 54 Years | 41 (8.8%) | 321 (68.6%) |
| 55 to 64 Years | 99 (22.9%) | 326 (75.3%) |
| 65 to 74 Years | 282 (70.5%) | 186 (46.5%) |
| 75 Years and over | 137 (100.0%) | 43 (31.4%) |
| Total | 1,316 (36.4%) | 2,049 (56.7%) |
Disability Status by Sex by Age in Connell
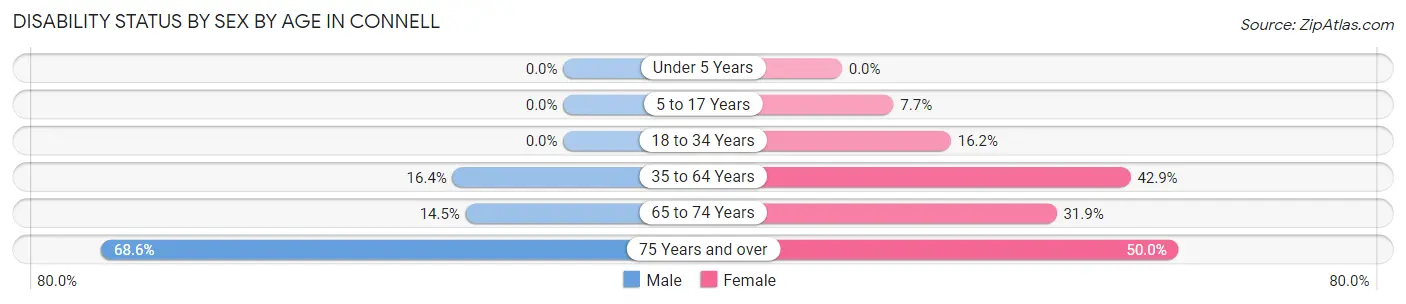
| Age Bracket | Male | Female |
| Under 5 Years | 0 (0.0%) | 0 (0.0%) |
| 5 to 17 Years | 0 (0.0%) | 33 (7.7%) |
| 18 to 34 Years | 0 (0.0%) | 34 (16.2%) |
| 35 to 64 Years | 122 (16.4%) | 315 (42.9%) |
| 65 to 74 Years | 38 (14.5%) | 44 (31.9%) |
| 75 Years and over | 35 (68.6%) | 43 (50.0%) |
Disability Class by Sex by Age in Connell
Disability Class: Hearing Difficulty
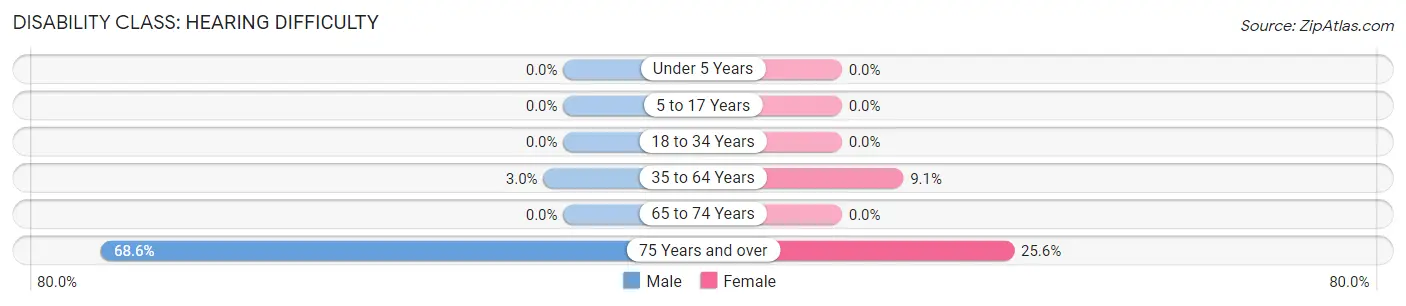
| Age Bracket | Male | Female |
| Under 5 Years | 0 (0.0%) | 0 (0.0%) |
| 5 to 17 Years | 0 (0.0%) | 0 (0.0%) |
| 18 to 34 Years | 0 (0.0%) | 0 (0.0%) |
| 35 to 64 Years | 22 (3.0%) | 67 (9.1%) |
| 65 to 74 Years | 0 (0.0%) | 0 (0.0%) |
| 75 Years and over | 35 (68.6%) | 22 (25.6%) |
Disability Class: Vision Difficulty
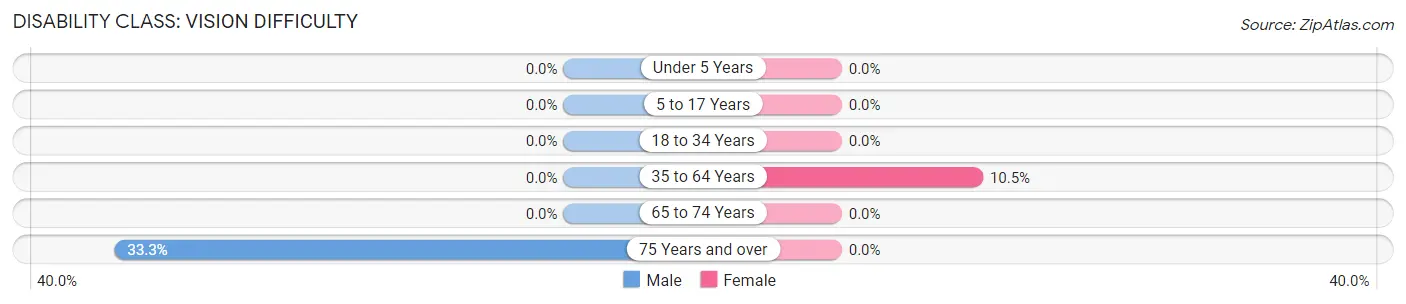
| Age Bracket | Male | Female |
| Under 5 Years | 0 (0.0%) | 0 (0.0%) |
| 5 to 17 Years | 0 (0.0%) | 0 (0.0%) |
| 18 to 34 Years | 0 (0.0%) | 0 (0.0%) |
| 35 to 64 Years | 0 (0.0%) | 77 (10.5%) |
| 65 to 74 Years | 0 (0.0%) | 0 (0.0%) |
| 75 Years and over | 17 (33.3%) | 0 (0.0%) |
Disability Class: Cognitive Difficulty
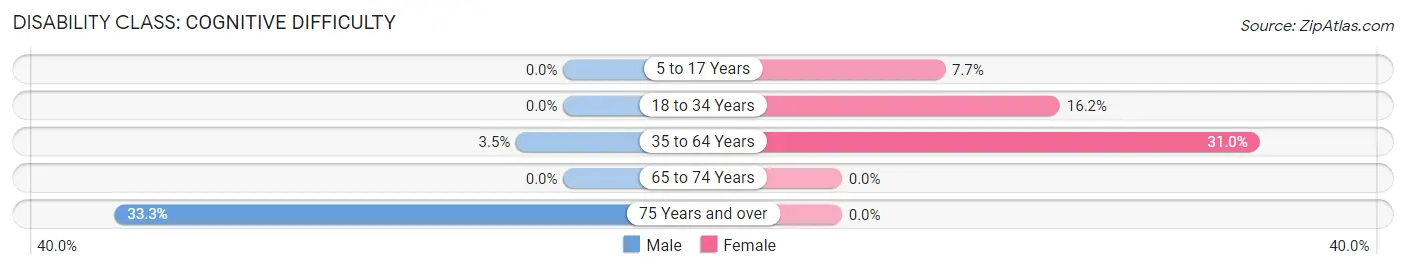
| Age Bracket | Male | Female |
| 5 to 17 Years | 0 (0.0%) | 33 (7.7%) |
| 18 to 34 Years | 0 (0.0%) | 34 (16.2%) |
| 35 to 64 Years | 26 (3.5%) | 228 (31.0%) |
| 65 to 74 Years | 0 (0.0%) | 0 (0.0%) |
| 75 Years and over | 17 (33.3%) | 0 (0.0%) |
Disability Class: Ambulatory Difficulty
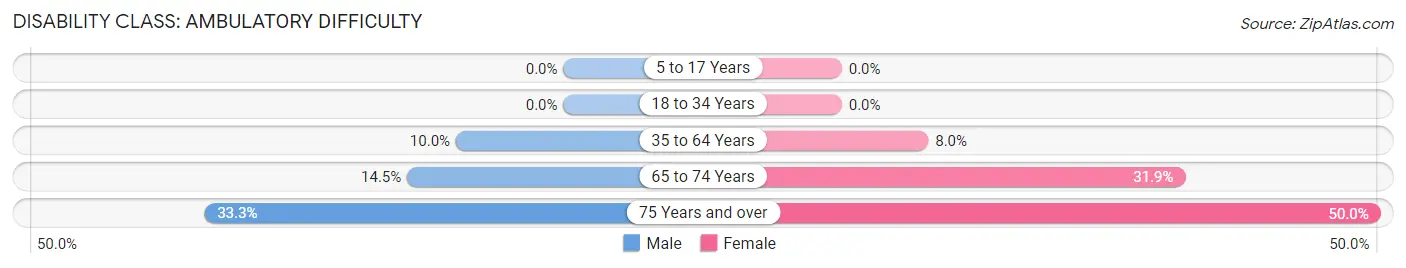
| Age Bracket | Male | Female |
| 5 to 17 Years | 0 (0.0%) | 0 (0.0%) |
| 18 to 34 Years | 0 (0.0%) | 0 (0.0%) |
| 35 to 64 Years | 74 (10.0%) | 59 (8.0%) |
| 65 to 74 Years | 38 (14.5%) | 44 (31.9%) |
| 75 Years and over | 17 (33.3%) | 43 (50.0%) |
Disability Class: Self-Care Difficulty
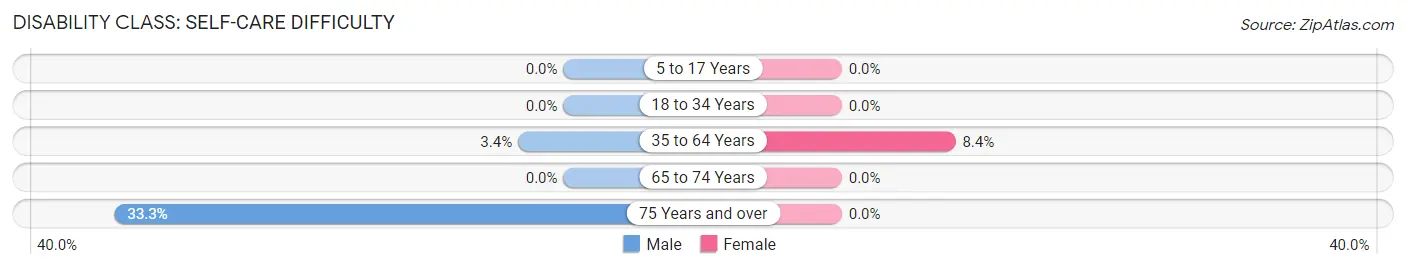
| Age Bracket | Male | Female |
| 5 to 17 Years | 0 (0.0%) | 0 (0.0%) |
| 18 to 34 Years | 0 (0.0%) | 0 (0.0%) |
| 35 to 64 Years | 25 (3.4%) | 62 (8.4%) |
| 65 to 74 Years | 0 (0.0%) | 0 (0.0%) |
| 75 Years and over | 17 (33.3%) | 0 (0.0%) |
Technology Access in Connell
Computing Device Access in Connell
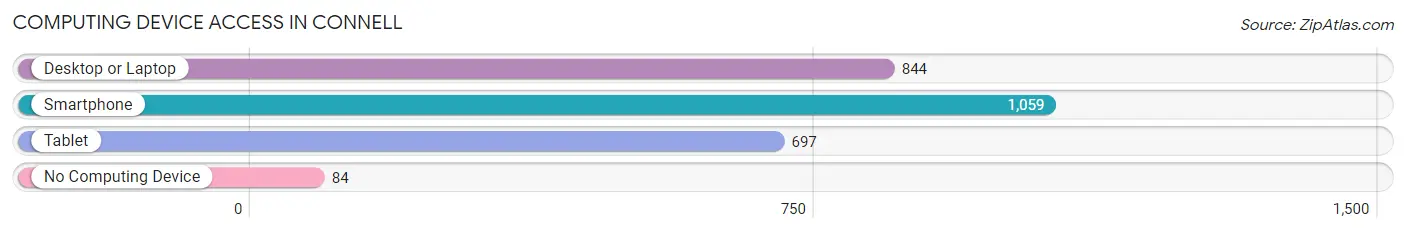
| Device Type | # Households | % Households |
| Desktop or Laptop | 844 | 69.6% |
| Smartphone | 1,059 | 87.4% |
| Tablet | 697 | 57.5% |
| No Computing Device | 84 | 6.9% |
| Total | 1,212 | 100.0% |
Internet Access in Connell
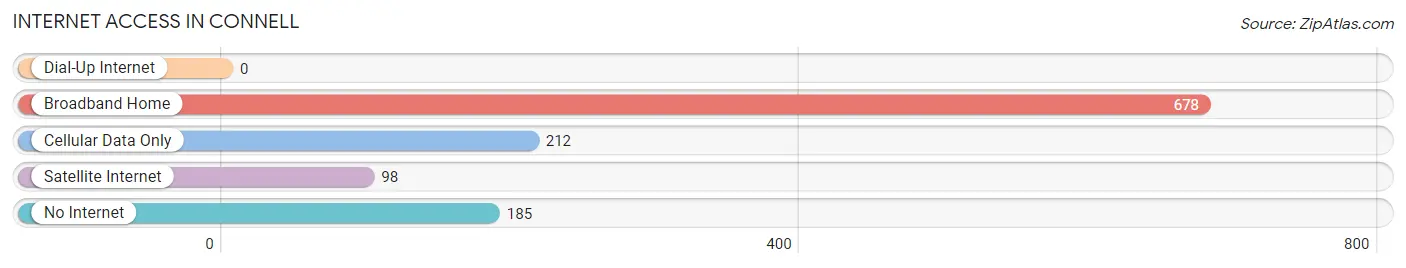
| Internet Type | # Households | % Households |
| Dial-Up Internet | 0 | 0.0% |
| Broadband Home | 678 | 55.9% |
| Cellular Data Only | 212 | 17.5% |
| Satellite Internet | 98 | 8.1% |
| No Internet | 185 | 15.3% |
| Total | 1,212 | 100.0% |
Connell Summary
O'Connell is a small town located in the south-west of Western Australia, approximately 200 kilometres south of Perth. It is situated in the Shire of Donnybrook-Balingup, and is surrounded by rolling hills, forests and farmland. The town has a population of approximately 500 people, and is a popular tourist destination due to its proximity to the Margaret River wine region.
History
O'Connell was first settled in the late 1800s by Irish immigrants, who named the town after their homeland. The town was initially a farming community, with the main crops being wheat and sheep. In the early 1900s, the town began to grow as a tourist destination, with the opening of a hotel and a number of guesthouses.
In the 1950s, the town began to experience a decline in population as people moved away to larger cities. However, in the late 1970s, the town experienced a resurgence in popularity as a tourist destination, and the population began to grow again.
Geography
O'Connell is located in the south-west of Western Australia, approximately 200 kilometres south of Perth. The town is situated in the Shire of Donnybrook-Balingup, and is surrounded by rolling hills, forests and farmland. The town is located on the banks of the Donnelly River, and is close to the Margaret River wine region.
The climate in O'Connell is generally mild, with warm summers and cool winters. The average temperature in summer is around 25°C, and in winter it is around 10°C.
Economy
The economy of O'Connell is largely based on tourism, with the town being a popular destination for visitors to the Margaret River wine region. The town also has a number of small businesses, including cafes, restaurants, shops and accommodation providers.
The town also has a number of agricultural businesses, with the main crops being wheat and sheep. The town also has a number of wineries, which produce a range of wines for both local and international markets.
Demographics
The population of O'Connell is approximately 500 people, with the majority of the population being of European descent. The town also has a small Indigenous population, as well as a number of people from other cultural backgrounds.
The median age of the population is 44 years, and the median household income is $50,000. The town has a high rate of home ownership, with approximately 80% of the population owning their own home.
Conclusion
O'Connell is a small town located in the south-west of Western Australia, approximately 200 kilometres south of Perth. The town has a population of approximately 500 people, and is a popular tourist destination due to its proximity to the Margaret River wine region. The economy of O'Connell is largely based on tourism, with the town also having a number of small businesses and agricultural businesses. The population of O'Connell is mostly of European descent, with a small Indigenous population and a number of people from other cultural backgrounds.
Common Questions
What is Per Capita Income in Connell?
Per Capita income in Connell is $18,791.
What is the Median Family Income in Connell?
Median Family Income in Connell is $80,184.
What is the Median Household income in Connell?
Median Household Income in Connell is $61,000.
What is Income or Wage Gap in Connell?
Income or Wage Gap in Connell is 17.7%.
Women in Connell earn 82.3 cents for every dollar earned by a man.
What is Inequality or Gini Index in Connell?
Inequality or Gini Index in Connell is 0.35.
What is the Total Population of Connell?
Total Population of Connell is 5,175.
What is the Total Male Population of Connell?
Total Male Population of Connell is 3,417.
What is the Total Female Population of Connell?
Total Female Population of Connell is 1,758.
What is the Ratio of Males per 100 Females in Connell?
There are 194.37 Males per 100 Females in Connell.
What is the Ratio of Females per 100 Males in Connell?
There are 51.45 Females per 100 Males in Connell.
What is the Median Population Age in Connell?
Median Population Age in Connell is 39.8 Years.
What is the Average Family Size in Connell
Average Family Size in Connell is 3.5 People.
What is the Average Household Size in Connell
Average Household Size in Connell is 3.0 People.
How Large is the Labor Force in Connell?
There are 1,618 People in the Labor Forcein in Connell.
What is the Percentage of People in the Labor Force in Connell?
38.1% of People are in the Labor Force in Connell.
What is the Unemployment Rate in Connell?
Unemployment Rate in Connell is 11.5%.