Grand Coulee, WA Map & Demographics
Grand Coulee Map
Grand Coulee Overview
$32,462
PER CAPITA INCOME
$86,042
AVG FAMILY INCOME
$47,361
AVG HOUSEHOLD INCOME
64.2%
WAGE / INCOME GAP [ % ]
35.8¢/ $1
WAGE / INCOME GAP [ $ ]
0.54
INEQUALITY / GINI INDEX
1,034
TOTAL POPULATION
537
MALE POPULATION
497
FEMALE POPULATION
108.05
MALES / 100 FEMALES
92.55
FEMALES / 100 MALES
53.8
MEDIAN AGE
2.4
AVG FAMILY SIZE
1.8
AVG HOUSEHOLD SIZE
417
LABOR FORCE [ PEOPLE ]
43.9%
PERCENT IN LABOR FORCE
12.7%
UNEMPLOYMENT RATE
Grand Coulee Zip Codes
Income in Grand Coulee
Income Overview in Grand Coulee
Per Capita Income in Grand Coulee is $32,462, while median incomes of families and households are $86,042 and $47,361 respectively.
| Characteristic | Number | Measure |
| Per Capita Income | 1,034 | $32,462 |
| Median Family Income | 272 | $86,042 |
| Mean Family Income | 272 | $98,406 |
| Median Household Income | 549 | $47,361 |
| Mean Household Income | 549 | $67,193 |
| Income Deficit | 272 | $0 |
| Wage / Income Gap (%) | 1,034 | 64.17% |
| Wage / Income Gap ($) | 1,034 | 35.83¢ per $1 |
| Gini / Inequality Index | 1,034 | 0.54 |
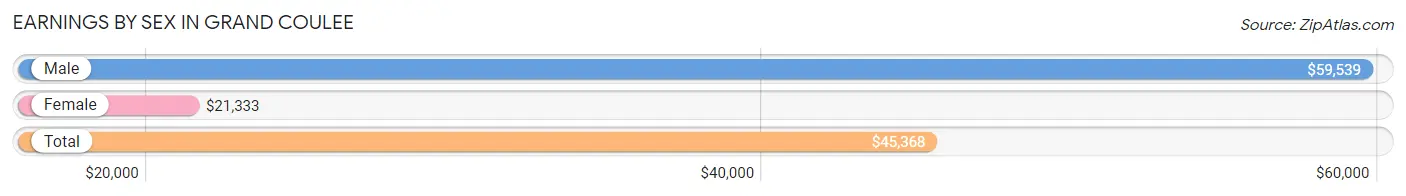
Earnings by Sex in Grand Coulee
Average Earnings in Grand Coulee are $45,368, $59,539 for men and $21,333 for women, a difference of 64.2%.
| Sex | Number | Average Earnings |
| Male | 255 (61.5%) | $59,539 |
| Female | 160 (38.6%) | $21,333 |
| Total | 415 (100.0%) | $45,368 |
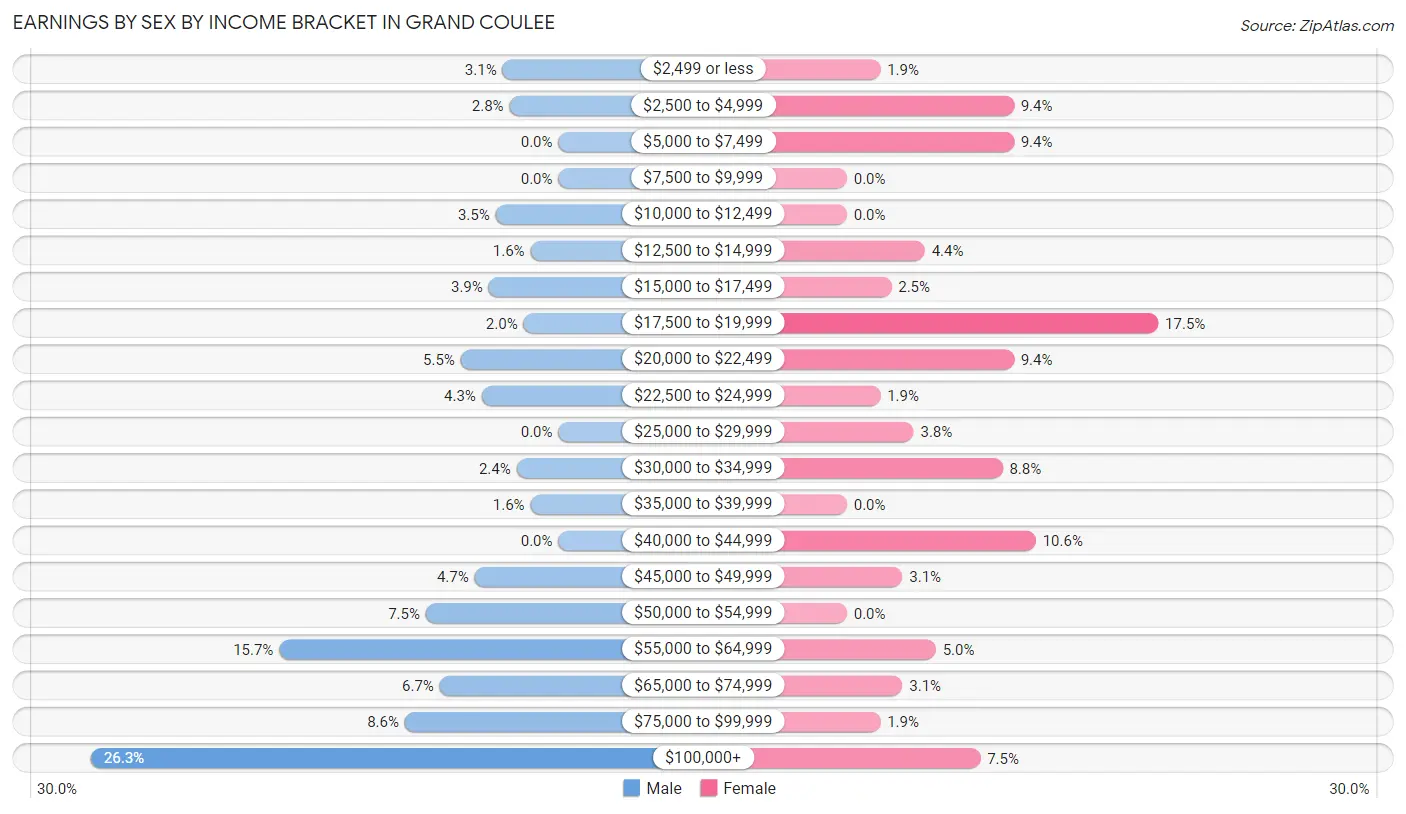
Earnings by Sex by Income Bracket in Grand Coulee
The most common earnings brackets in Grand Coulee are $100,000+ for men (67 | 26.3%) and $17,500 to $19,999 for women (28 | 17.5%).
| Income | Male | Female |
| $2,499 or less | 8 (3.1%) | 3 (1.9%) |
| $2,500 to $4,999 | 7 (2.8%) | 15 (9.4%) |
| $5,000 to $7,499 | 0 (0.0%) | 15 (9.4%) |
| $7,500 to $9,999 | 0 (0.0%) | 0 (0.0%) |
| $10,000 to $12,499 | 9 (3.5%) | 0 (0.0%) |
| $12,500 to $14,999 | 4 (1.6%) | 7 (4.4%) |
| $15,000 to $17,499 | 10 (3.9%) | 4 (2.5%) |
| $17,500 to $19,999 | 5 (2.0%) | 28 (17.5%) |
| $20,000 to $22,499 | 14 (5.5%) | 15 (9.4%) |
| $22,500 to $24,999 | 11 (4.3%) | 3 (1.9%) |
| $25,000 to $29,999 | 0 (0.0%) | 6 (3.7%) |
| $30,000 to $34,999 | 6 (2.4%) | 14 (8.7%) |
| $35,000 to $39,999 | 4 (1.6%) | 0 (0.0%) |
| $40,000 to $44,999 | 0 (0.0%) | 17 (10.6%) |
| $45,000 to $49,999 | 12 (4.7%) | 5 (3.1%) |
| $50,000 to $54,999 | 19 (7.4%) | 0 (0.0%) |
| $55,000 to $64,999 | 40 (15.7%) | 8 (5.0%) |
| $65,000 to $74,999 | 17 (6.7%) | 5 (3.1%) |
| $75,000 to $99,999 | 22 (8.6%) | 3 (1.9%) |
| $100,000+ | 67 (26.3%) | 12 (7.5%) |
| Total | 255 (100.0%) | 160 (100.0%) |
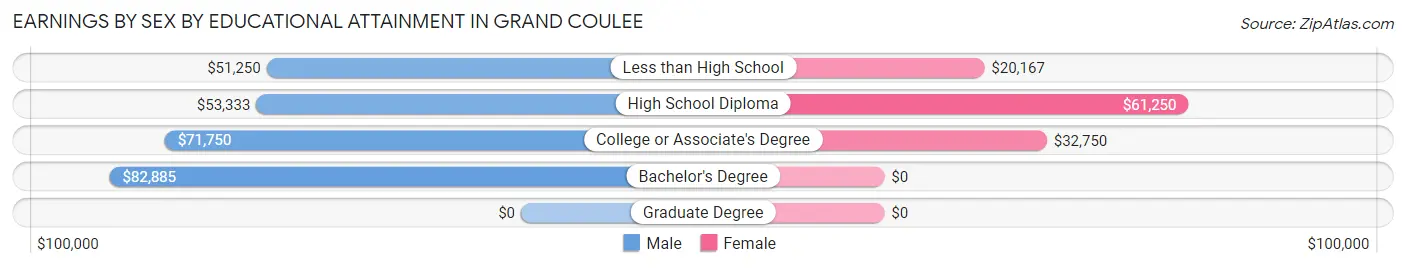
Earnings by Sex by Educational Attainment in Grand Coulee
Average earnings in Grand Coulee are $63,438 for men and $22,000 for women, a difference of 65.3%. Men with an educational attainment of bachelor's degree enjoy the highest average annual earnings of $82,885, while those with less than high school education earn the least with $51,250. Women with an educational attainment of high school diploma earn the most with the average annual earnings of $61,250, while those with less than high school education have the smallest earnings of $20,167.
| Educational Attainment | Male Income | Female Income |
| Less than High School | $51,250 | $20,167 |
| High School Diploma | $53,333 | $61,250 |
| College or Associate's Degree | $71,750 | $32,750 |
| Bachelor's Degree | $82,885 | $0 |
| Graduate Degree | - | - |
| Total | $63,438 | $22,000 |
Family Income in Grand Coulee
Family Income Brackets in Grand Coulee
According to the Grand Coulee family income data, there are 54 families falling into the $100,000 to $149,999 income range, which is the most common income bracket and makes up 19.9% of all families. Conversely, the $25,000 to $34,999 income bracket is the least frequent group with only 8 families (2.9%) belonging to this category.
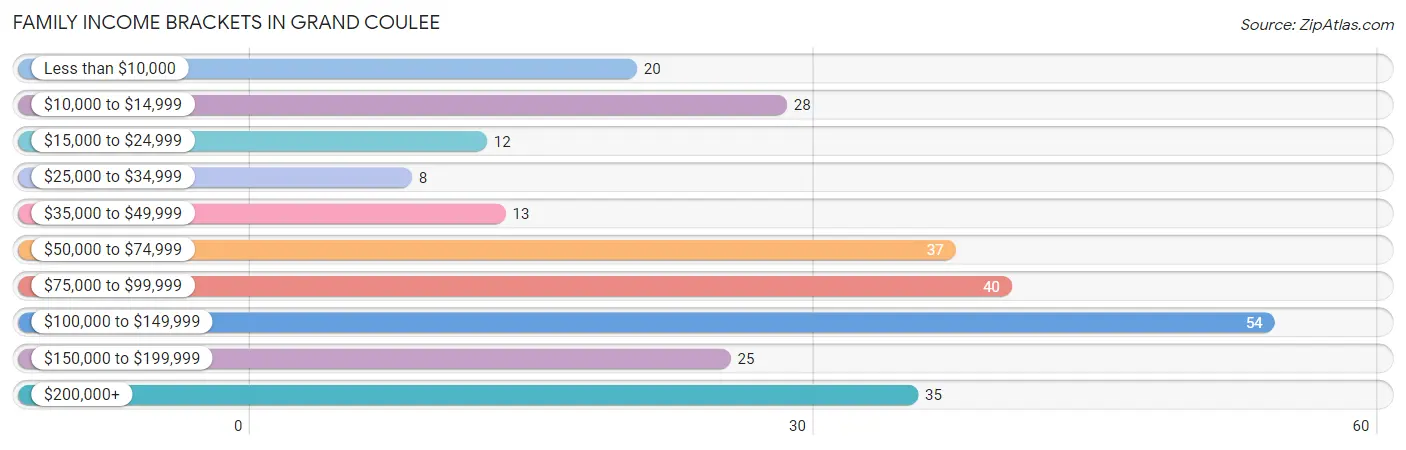
| Income Bracket | # Families | % Families |
| Less than $10,000 | 20 | 7.4% |
| $10,000 to $14,999 | 28 | 10.3% |
| $15,000 to $24,999 | 12 | 4.4% |
| $25,000 to $34,999 | 8 | 2.9% |
| $35,000 to $49,999 | 13 | 4.8% |
| $50,000 to $74,999 | 37 | 13.6% |
| $75,000 to $99,999 | 40 | 14.7% |
| $100,000 to $149,999 | 54 | 19.9% |
| $150,000 to $199,999 | 25 | 9.2% |
| $200,000+ | 35 | 12.9% |
Family Income by Famaliy Size in Grand Coulee
2-person families (160 | 58.8%) account for the highest median family income in Grand Coulee with $86,250 per family, while 2-person families (160 | 58.8%) have the highest median income of $43,125 per family member.
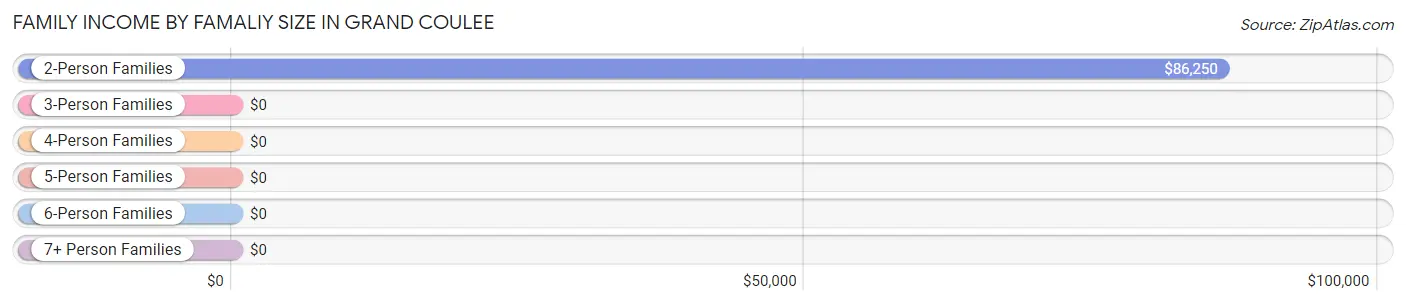
| Income Bracket | # Families | Median Income |
| 2-Person Families | 160 (58.8%) | $86,250 |
| 3-Person Families | 62 (22.8%) | $0 |
| 4-Person Families | 33 (12.1%) | $0 |
| 5-Person Families | 9 (3.3%) | $0 |
| 6-Person Families | 8 (2.9%) | $0 |
| 7+ Person Families | 0 (0.0%) | $0 |
| Total | 272 (100.0%) | $86,042 |
Family Income by Number of Earners in Grand Coulee
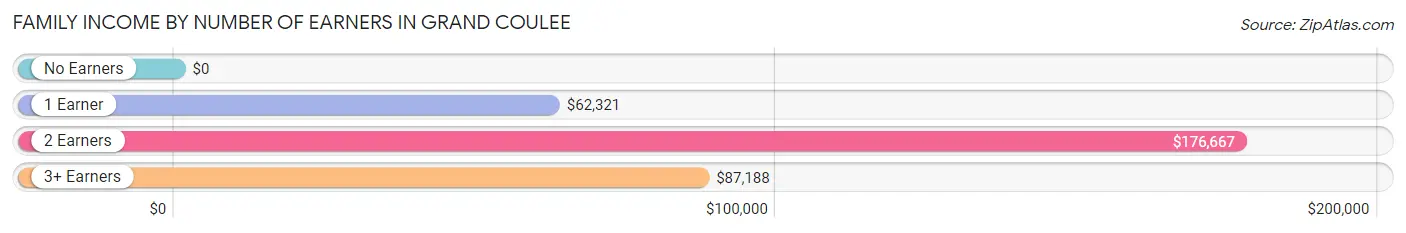
| Number of Earners | # Families | Median Income |
| No Earners | 65 (23.9%) | $0 |
| 1 Earner | 106 (39.0%) | $62,321 |
| 2 Earners | 90 (33.1%) | $176,667 |
| 3+ Earners | 11 (4.0%) | $87,188 |
| Total | 272 (100.0%) | $86,042 |
Household Income in Grand Coulee
Household Income Brackets in Grand Coulee
With 102 households falling in the category, the less than $10,000 income range is the most frequent in Grand Coulee, accounting for 18.6% of all households. In contrast, only 12 households (2.2%) fall into the $25,000 to $34,999 income bracket, making it the least populous group.
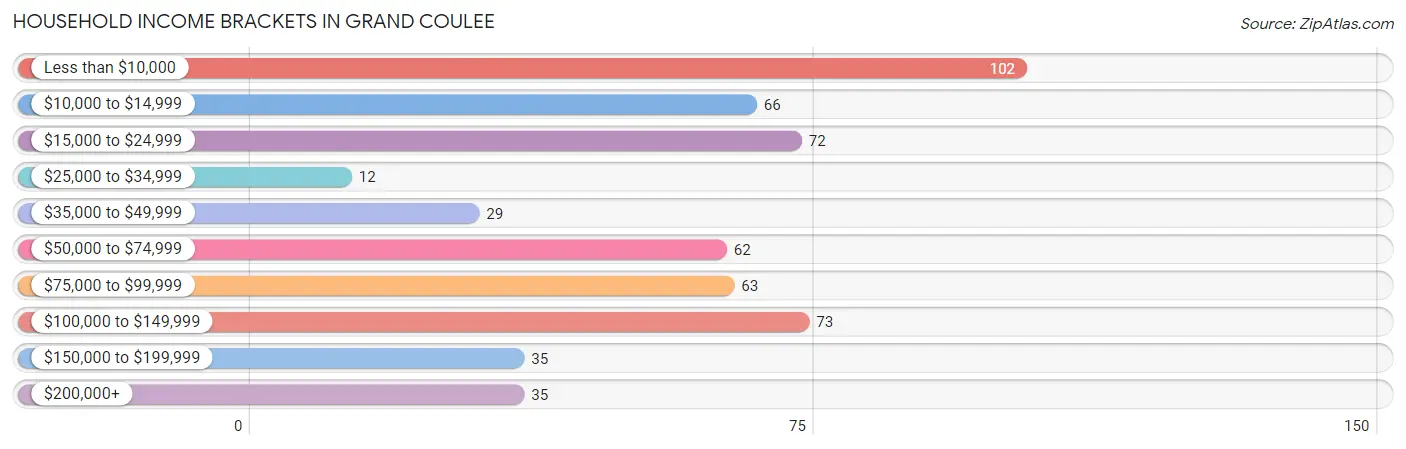
| Income Bracket | # Households | % Households |
| Less than $10,000 | 102 | 18.6% |
| $10,000 to $14,999 | 66 | 12.0% |
| $15,000 to $24,999 | 72 | 13.1% |
| $25,000 to $34,999 | 12 | 2.2% |
| $35,000 to $49,999 | 29 | 5.3% |
| $50,000 to $74,999 | 62 | 11.3% |
| $75,000 to $99,999 | 63 | 11.5% |
| $100,000 to $149,999 | 73 | 13.3% |
| $150,000 to $199,999 | 35 | 6.4% |
| $200,000+ | 35 | 6.4% |
Household Income by Householder Age in Grand Coulee
The median household income in Grand Coulee is $47,361, with the highest median household income of $80,833 found in the 45 to 64 years age bracket for the primary householder. A total of 190 households (34.6%) fall into this category. Meanwhile, the 15 to 24 years age bracket for the primary householder has the lowest median household income of $0, with 3 households (0.5%) in this group.
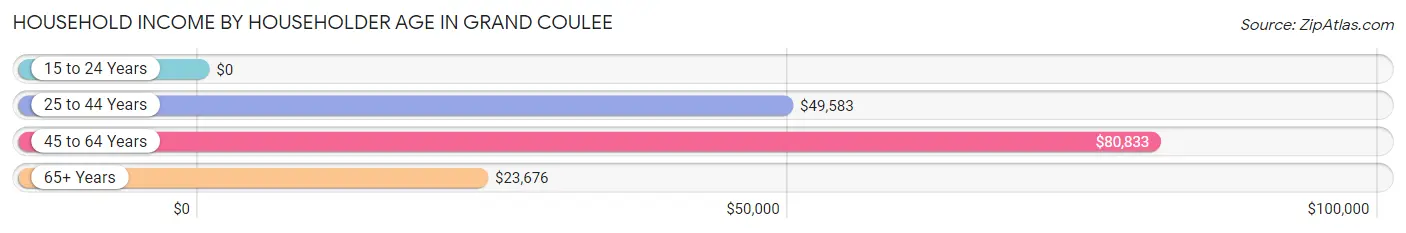
| Income Bracket | # Households | Median Income |
| 15 to 24 Years | 3 (0.5%) | $0 |
| 25 to 44 Years | 158 (28.8%) | $49,583 |
| 45 to 64 Years | 190 (34.6%) | $80,833 |
| 65+ Years | 198 (36.1%) | $23,676 |
| Total | 549 (100.0%) | $47,361 |
Poverty in Grand Coulee
Income Below Poverty by Sex and Age in Grand Coulee
With 28.3% poverty level for males and 36.6% for females among the residents of Grand Coulee, 6 to 11 year old males and 12 to 14 year old females are the most vulnerable to poverty, with 30 males (83.3%) and 16 females (84.2%) in their respective age groups living below the poverty level.
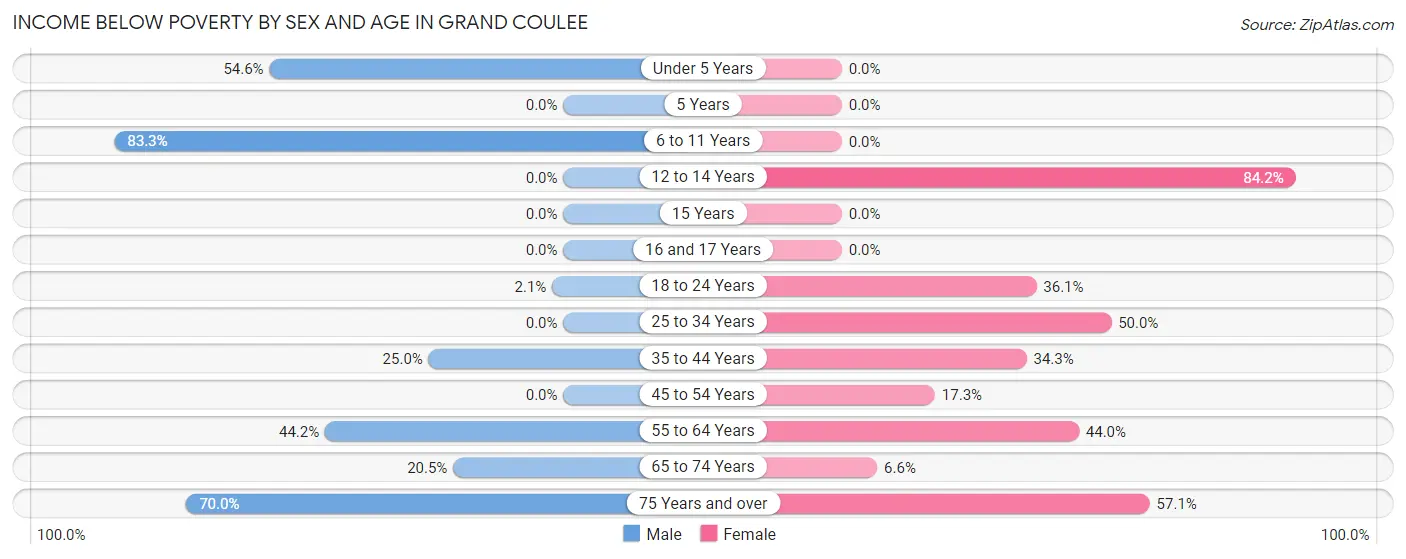
| Age Bracket | Male | Female |
| Under 5 Years | 6 (54.5%) | 0 (0.0%) |
| 5 Years | 0 (0.0%) | 0 (0.0%) |
| 6 to 11 Years | 30 (83.3%) | 0 (0.0%) |
| 12 to 14 Years | 0 (0.0%) | 16 (84.2%) |
| 15 Years | 0 (0.0%) | 0 (0.0%) |
| 16 and 17 Years | 0 (0.0%) | 0 (0.0%) |
| 18 to 24 Years | 1 (2.1%) | 13 (36.1%) |
| 25 to 34 Years | 0 (0.0%) | 35 (50.0%) |
| 35 to 44 Years | 17 (25.0%) | 12 (34.3%) |
| 45 to 54 Years | 0 (0.0%) | 14 (17.3%) |
| 55 to 64 Years | 46 (44.2%) | 44 (44.0%) |
| 65 to 74 Years | 18 (20.4%) | 4 (6.6%) |
| 75 Years and over | 28 (70.0%) | 44 (57.1%) |
| Total | 146 (28.3%) | 182 (36.6%) |
Income Above Poverty by Sex and Age in Grand Coulee
According to the poverty statistics in Grand Coulee, males aged 5 years and females aged 15 years are the age groups that are most secure financially, with 100.0% of males and 100.0% of females in these age groups living above the poverty line.
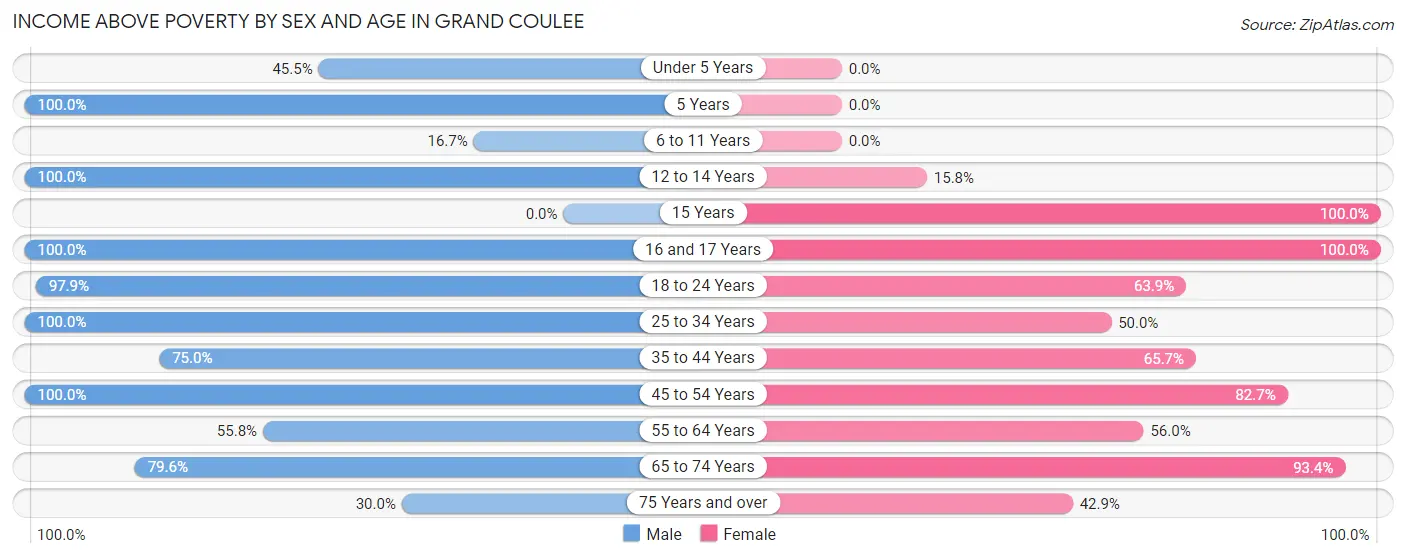
| Age Bracket | Male | Female |
| Under 5 Years | 5 (45.5%) | 0 (0.0%) |
| 5 Years | 7 (100.0%) | 0 (0.0%) |
| 6 to 11 Years | 6 (16.7%) | 0 (0.0%) |
| 12 to 14 Years | 7 (100.0%) | 3 (15.8%) |
| 15 Years | 0 (0.0%) | 4 (100.0%) |
| 16 and 17 Years | 13 (100.0%) | 14 (100.0%) |
| 18 to 24 Years | 47 (97.9%) | 23 (63.9%) |
| 25 to 34 Years | 55 (100.0%) | 35 (50.0%) |
| 35 to 44 Years | 51 (75.0%) | 23 (65.7%) |
| 45 to 54 Years | 39 (100.0%) | 67 (82.7%) |
| 55 to 64 Years | 58 (55.8%) | 56 (56.0%) |
| 65 to 74 Years | 70 (79.5%) | 57 (93.4%) |
| 75 Years and over | 12 (30.0%) | 33 (42.9%) |
| Total | 370 (71.7%) | 315 (63.4%) |
Income Below Poverty Among Married-Couple Families in Grand Coulee
The poverty statistics for married-couple families in Grand Coulee show that 7.2% or 13 of the total 180 families live below the poverty line. Families with no children have the highest poverty rate of 10.4%, comprising of 13 families. On the other hand, families with 1 or 2 children have the lowest poverty rate of 0.0%, which includes 0 families.
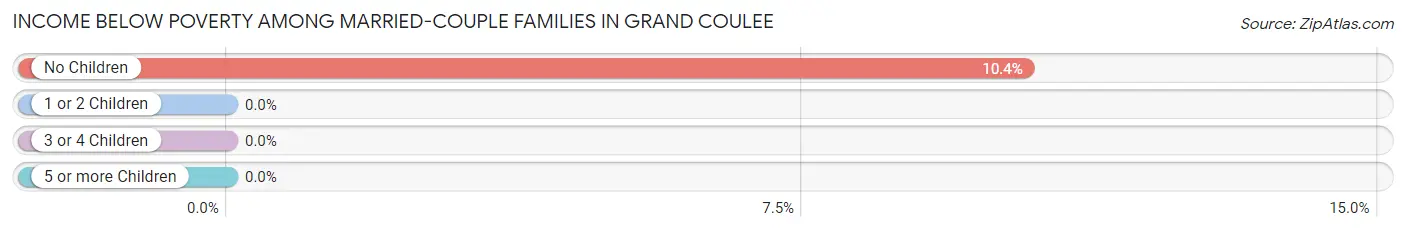
| Children | Above Poverty | Below Poverty |
| No Children | 112 (89.6%) | 13 (10.4%) |
| 1 or 2 Children | 55 (100.0%) | 0 (0.0%) |
| 3 or 4 Children | 0 (0.0%) | 0 (0.0%) |
| 5 or more Children | 0 (0.0%) | 0 (0.0%) |
| Total | 167 (92.8%) | 13 (7.2%) |
Income Below Poverty Among Single-Parent Households in Grand Coulee
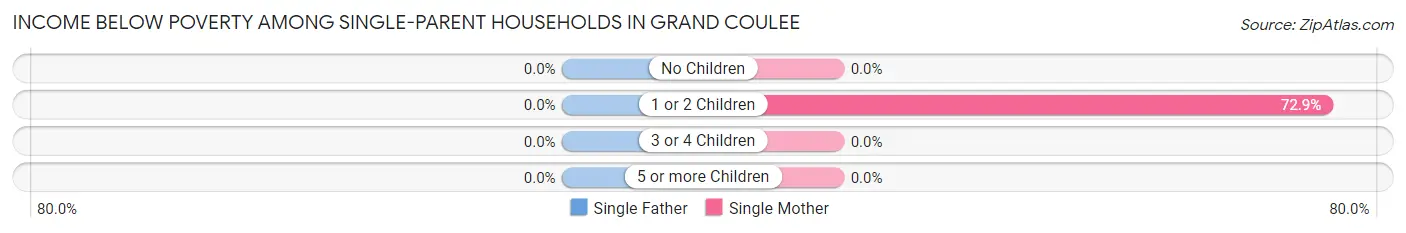
| Children | Single Father | Single Mother |
| No Children | 0 (0.0%) | 0 (0.0%) |
| 1 or 2 Children | 0 (0.0%) | 35 (72.9%) |
| 3 or 4 Children | 0 (0.0%) | 0 (0.0%) |
| 5 or more Children | 0 (0.0%) | 0 (0.0%) |
| Total | 0 (0.0%) | 35 (40.2%) |
Income Below Poverty Among Married-Couple vs Single-Parent Households in Grand Coulee
The poverty data for Grand Coulee shows that 13 of the married-couple family households (7.2%) and 35 of the single-parent households (38.0%) are living below the poverty level. Within the married-couple family households, those with no children have the highest poverty rate, with 13 households (10.4%) falling below the poverty line. Among the single-parent households, those with 1 or 2 children have the highest poverty rate, with 35 household (72.9%) living below poverty.
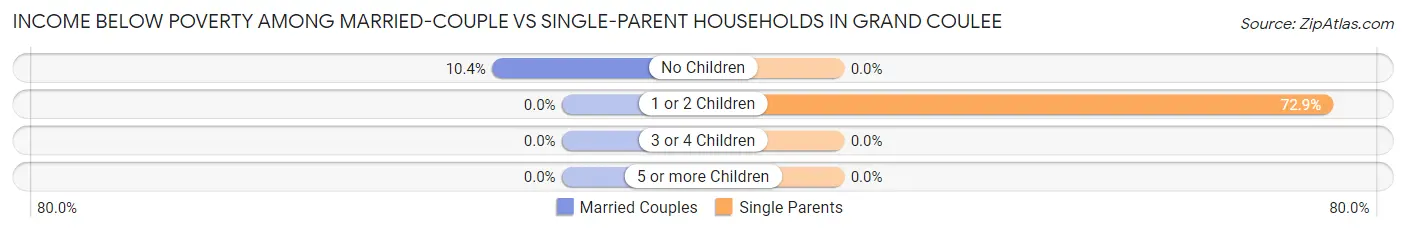
| Children | Married-Couple Families | Single-Parent Households |
| No Children | 13 (10.4%) | 0 (0.0%) |
| 1 or 2 Children | 0 (0.0%) | 35 (72.9%) |
| 3 or 4 Children | 0 (0.0%) | 0 (0.0%) |
| 5 or more Children | 0 (0.0%) | 0 (0.0%) |
| Total | 13 (7.2%) | 35 (38.0%) |
Race in Grand Coulee
The most populous races in Grand Coulee are White / Caucasian (859 | 83.1%), Two or more Races (99 | 9.6%), and Hispanic or Latino (97 | 9.4%).
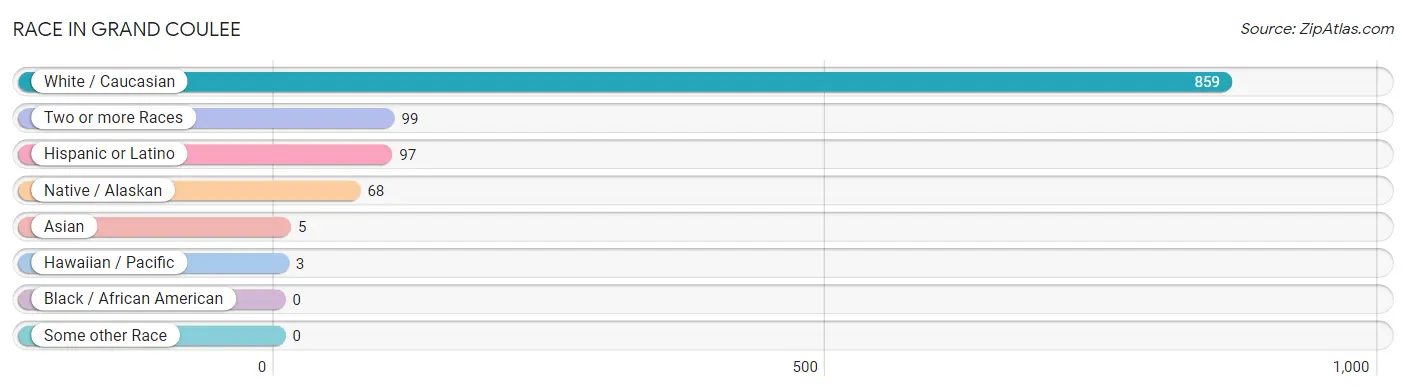
| Race | # Population | % Population |
| Asian | 5 | 0.5% |
| Black / African American | 0 | 0.0% |
| Hawaiian / Pacific | 3 | 0.3% |
| Hispanic or Latino | 97 | 9.4% |
| Native / Alaskan | 68 | 6.6% |
| White / Caucasian | 859 | 83.1% |
| Two or more Races | 99 | 9.6% |
| Some other Race | 0 | 0.0% |
| Total | 1,034 | 100.0% |
Ancestry in Grand Coulee
The most populous ancestries reported in Grand Coulee are American (280 | 27.1%), German (157 | 15.2%), Colville (105 | 10.2%), Irish (104 | 10.1%), and Mexican (73 | 7.1%), together accounting for 69.5% of all Grand Coulee residents.
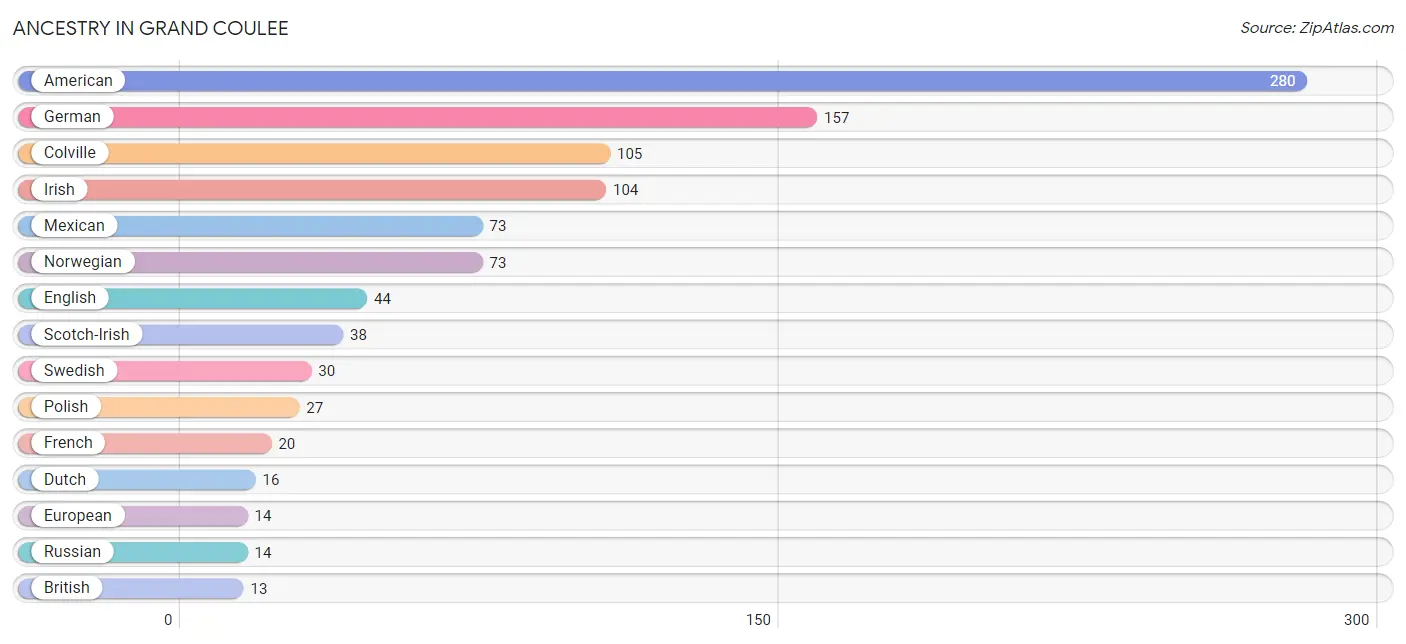
| Ancestry | # Population | % Population |
| American | 280 | 27.1% |
| Austrian | 4 | 0.4% |
| Bhutanese | 5 | 0.5% |
| Blackfeet | 4 | 0.4% |
| British | 13 | 1.3% |
| Colville | 105 | 10.2% |
| Czech | 7 | 0.7% |
| Danish | 10 | 1.0% |
| Dutch | 16 | 1.5% |
| Eastern European | 9 | 0.9% |
| English | 44 | 4.3% |
| European | 14 | 1.3% |
| Finnish | 3 | 0.3% |
| French | 20 | 1.9% |
| German | 157 | 15.2% |
| Guamanian / Chamorro | 5 | 0.5% |
| Irish | 104 | 10.1% |
| Italian | 7 | 0.7% |
| Mexican | 73 | 7.1% |
| Native Hawaiian | 5 | 0.5% |
| Northern European | 9 | 0.9% |
| Norwegian | 73 | 7.1% |
| Polish | 27 | 2.6% |
| Portuguese | 12 | 1.2% |
| Puerto Rican | 4 | 0.4% |
| Romanian | 1 | 0.1% |
| Russian | 14 | 1.3% |
| Scandinavian | 3 | 0.3% |
| Scotch-Irish | 38 | 3.7% |
| Scottish | 4 | 0.4% |
| Slovak | 10 | 1.0% |
| Spanish | 13 | 1.3% |
| Swedish | 30 | 2.9% | View All 33 Rows |
Immigrants in Grand Coulee
The most numerous immigrant groups reported in Grand Coulee came from Central America (7 | 0.7%), Latin America (7 | 0.7%), Mexico (7 | 0.7%), Asia (5 | 0.5%), and South Eastern Asia (5 | 0.5%), together accounting for 3.0% of all Grand Coulee residents.
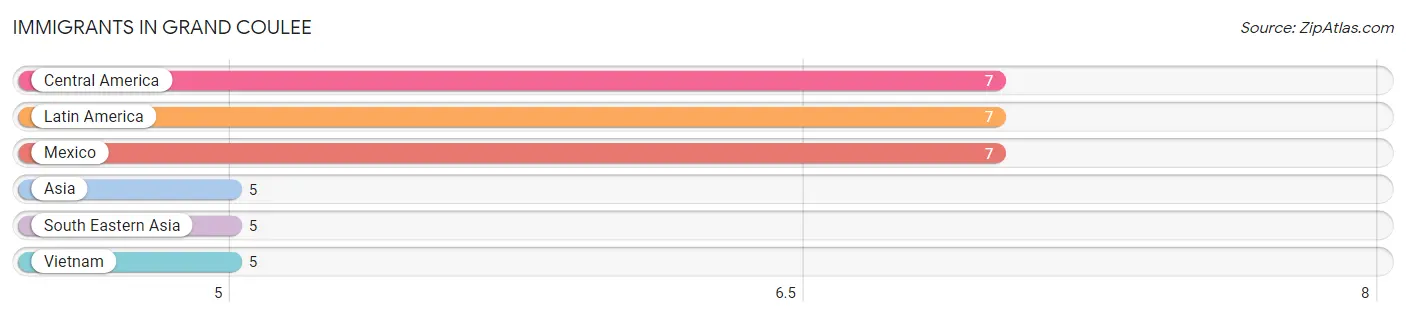
| Immigration Origin | # Population | % Population |
| Asia | 5 | 0.5% |
| Central America | 7 | 0.7% |
| Latin America | 7 | 0.7% |
| Mexico | 7 | 0.7% |
| South Eastern Asia | 5 | 0.5% |
| Vietnam | 5 | 0.5% | View All 6 Rows |
Sex and Age in Grand Coulee
Sex and Age in Grand Coulee
The most populous age groups in Grand Coulee are 55 to 59 Years (81 | 15.1%) for men and 55 to 59 Years (68 | 13.7%) for women.
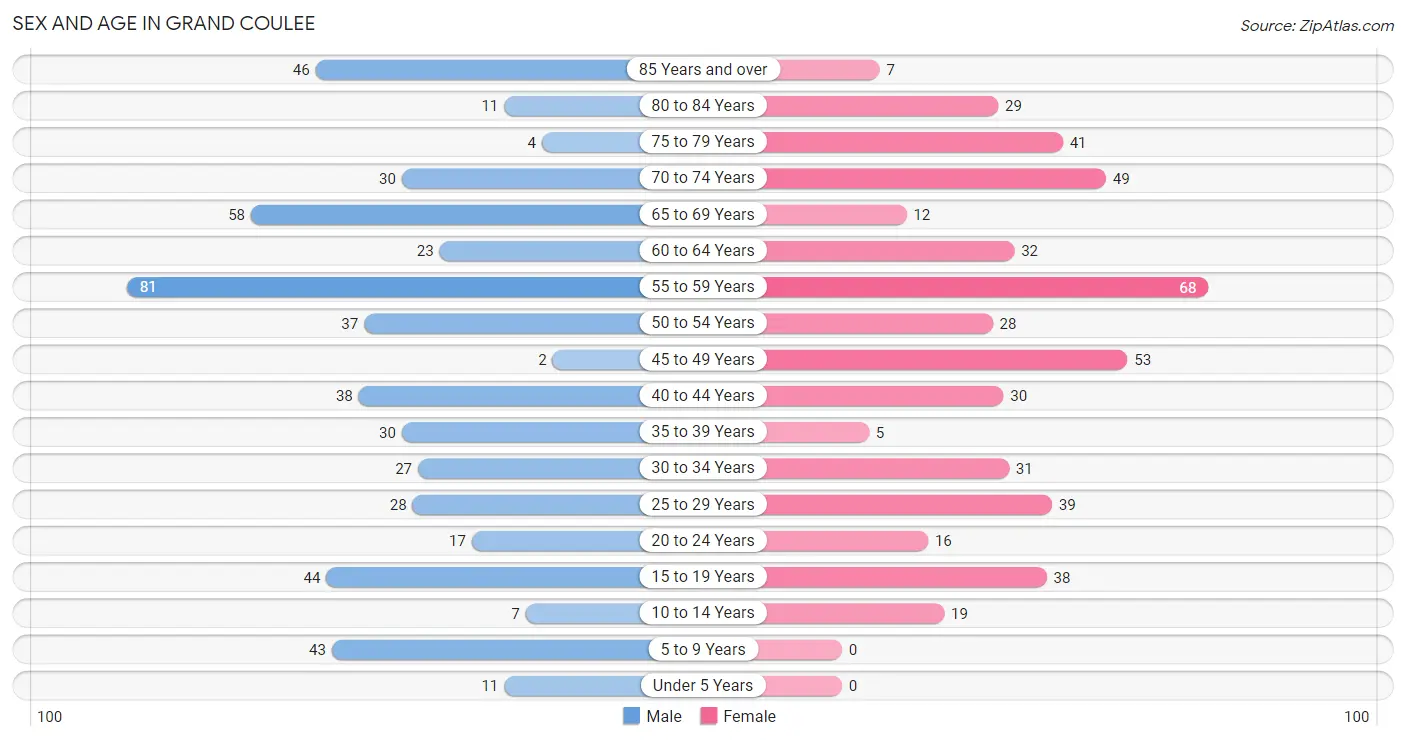
| Age Bracket | Male | Female |
| Under 5 Years | 11 (2.1%) | 0 (0.0%) |
| 5 to 9 Years | 43 (8.0%) | 0 (0.0%) |
| 10 to 14 Years | 7 (1.3%) | 19 (3.8%) |
| 15 to 19 Years | 44 (8.2%) | 38 (7.6%) |
| 20 to 24 Years | 17 (3.2%) | 16 (3.2%) |
| 25 to 29 Years | 28 (5.2%) | 39 (7.9%) |
| 30 to 34 Years | 27 (5.0%) | 31 (6.2%) |
| 35 to 39 Years | 30 (5.6%) | 5 (1.0%) |
| 40 to 44 Years | 38 (7.1%) | 30 (6.0%) |
| 45 to 49 Years | 2 (0.4%) | 53 (10.7%) |
| 50 to 54 Years | 37 (6.9%) | 28 (5.6%) |
| 55 to 59 Years | 81 (15.1%) | 68 (13.7%) |
| 60 to 64 Years | 23 (4.3%) | 32 (6.4%) |
| 65 to 69 Years | 58 (10.8%) | 12 (2.4%) |
| 70 to 74 Years | 30 (5.6%) | 49 (9.9%) |
| 75 to 79 Years | 4 (0.7%) | 41 (8.3%) |
| 80 to 84 Years | 11 (2.1%) | 29 (5.8%) |
| 85 Years and over | 46 (8.6%) | 7 (1.4%) |
| Total | 537 (100.0%) | 497 (100.0%) |
Families and Households in Grand Coulee
Median Family Size in Grand Coulee
The median family size in Grand Coulee is 2.41 persons per family, with single female/mother families (87 | 32.0%) accounting for the largest median family size of 2.6 persons per family. On the other hand, married-couple families (180 | 66.2%) represent the smallest median family size with 2.32 persons per family.
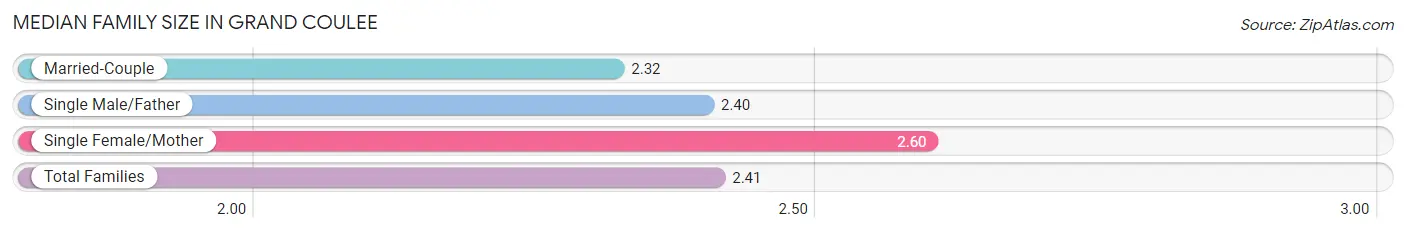
| Family Type | # Families | Family Size |
| Married-Couple | 180 (66.2%) | 2.32 |
| Single Male/Father | 5 (1.8%) | 2.40 |
| Single Female/Mother | 87 (32.0%) | 2.60 |
| Total Families | 272 (100.0%) | 2.41 |
Median Household Size in Grand Coulee
The median household size in Grand Coulee is 1.84 persons per household, with single female/mother households (87 | 15.9%) accounting for the largest median household size of 2.92 persons per household. non-family households (277 | 50.5%) represent the smallest median household size with 1.17 persons per household.
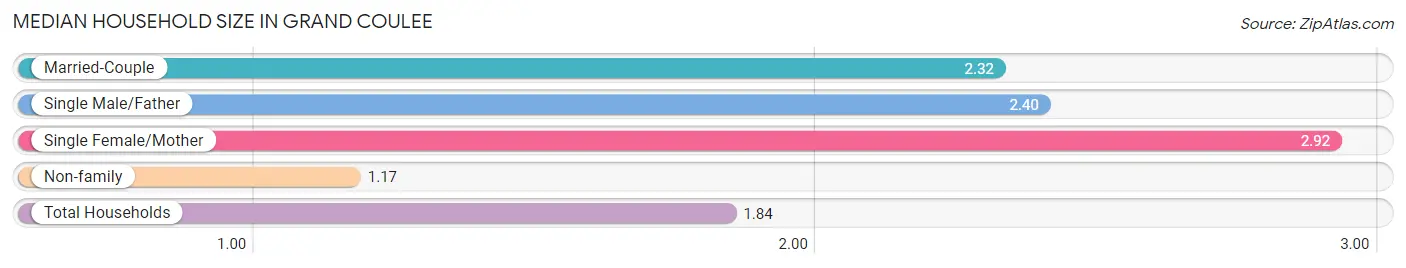
| Household Type | # Households | Household Size |
| Married-Couple | 180 (32.8%) | 2.32 |
| Single Male/Father | 5 (0.9%) | 2.40 |
| Single Female/Mother | 87 (15.9%) | 2.92 |
| Non-family | 277 (50.5%) | 1.17 |
| Total Households | 549 (100.0%) | 1.84 |
Household Size by Marriage Status in Grand Coulee
Out of a total of 549 households in Grand Coulee, 272 (49.5%) are family households, while 277 (50.5%) are nonfamily households. The most numerous type of family households are 2-person households, comprising 141, and the most common type of nonfamily households are 1-person households, comprising 239.
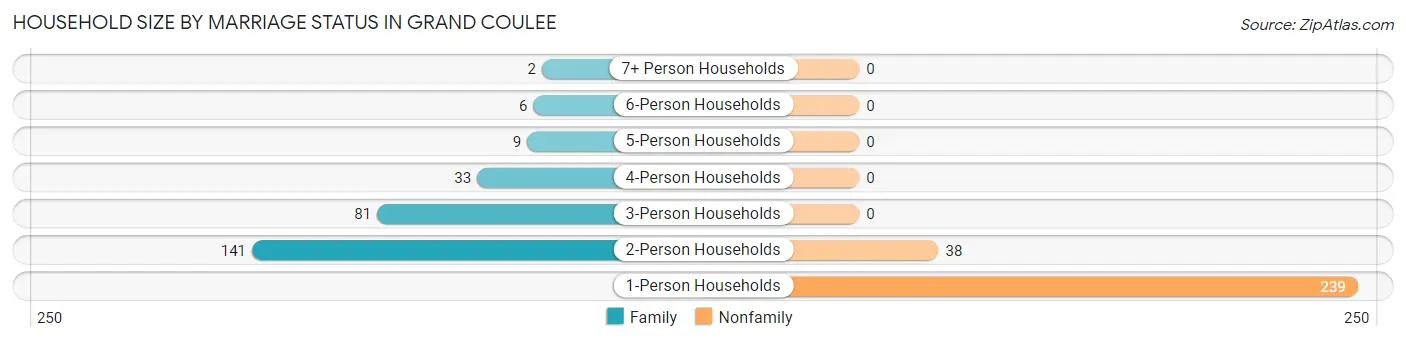
| Household Size | Family Households | Nonfamily Households |
| 1-Person Households | - | 239 (43.5%) |
| 2-Person Households | 141 (25.7%) | 38 (6.9%) |
| 3-Person Households | 81 (14.7%) | 0 (0.0%) |
| 4-Person Households | 33 (6.0%) | 0 (0.0%) |
| 5-Person Households | 9 (1.6%) | 0 (0.0%) |
| 6-Person Households | 6 (1.1%) | 0 (0.0%) |
| 7+ Person Households | 2 (0.4%) | 0 (0.0%) |
| Total | 272 (49.5%) | 277 (50.5%) |
Female Fertility in Grand Coulee
Fertility by Age in Grand Coulee
Average fertility rate in Grand Coulee is 63.0 births per 1,000 women. Women in the age bracket of 20 to 34 years have the highest fertility rate with 151.0 births per 1,000 women. Women in the age bracket of 20 to 34 years acount for 92.9% of all women with births.
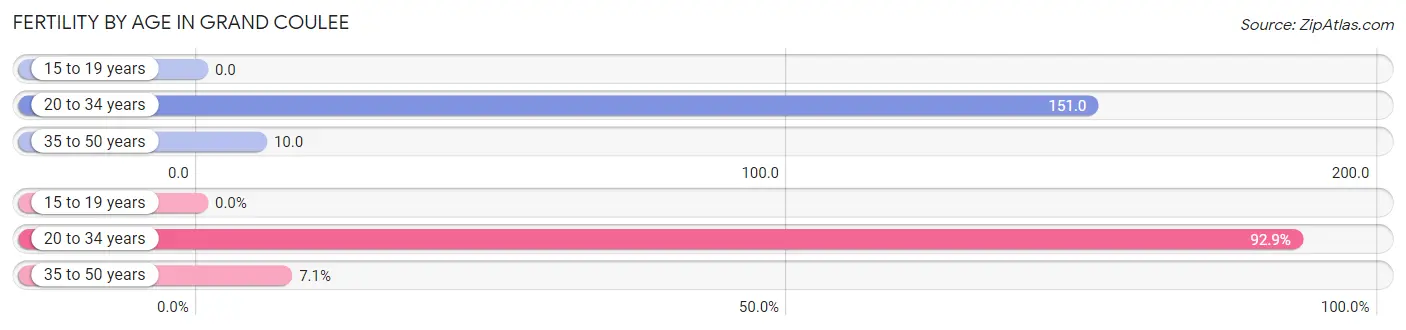
| Age Bracket | Women with Births | Births / 1,000 Women |
| 15 to 19 years | 0 (0.0%) | 0.0 |
| 20 to 34 years | 13 (92.9%) | 151.0 |
| 35 to 50 years | 1 (7.1%) | 10.0 |
| Total | 14 (100.0%) | 63.0 |
Fertility by Age by Marriage Status in Grand Coulee
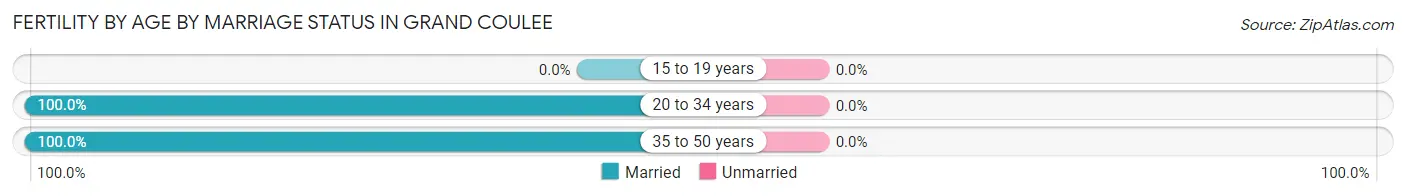
| Age Bracket | Married | Unmarried |
| 15 to 19 years | 0 (0.0%) | 0 (0.0%) |
| 20 to 34 years | 13 (100.0%) | 0 (0.0%) |
| 35 to 50 years | 1 (100.0%) | 0 (0.0%) |
| Total | 14 (100.0%) | 0 (0.0%) |
Fertility by Education in Grand Coulee
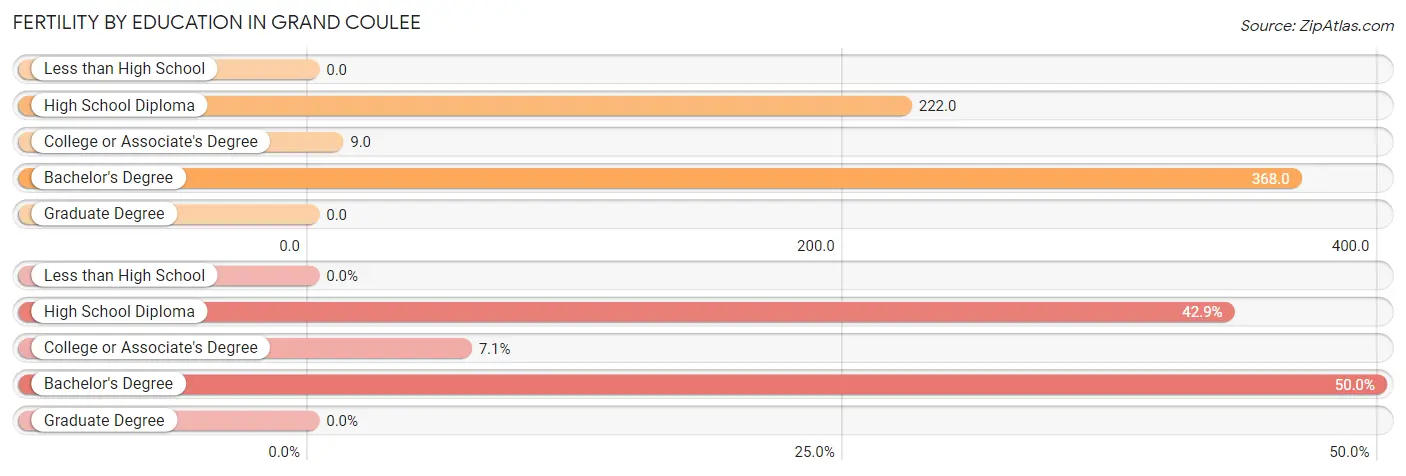
| Educational Attainment | Women with Births | Births / 1,000 Women |
| Less than High School | 0 (0.0%) | 0.0 |
| High School Diploma | 6 (42.9%) | 222.0 |
| College or Associate's Degree | 1 (7.1%) | 9.0 |
| Bachelor's Degree | 7 (50.0%) | 368.0 |
| Graduate Degree | 0 (0.0%) | 0.0 |
| Total | 14 (100.0%) | 63.0 |
Fertility by Education by Marriage Status in Grand Coulee
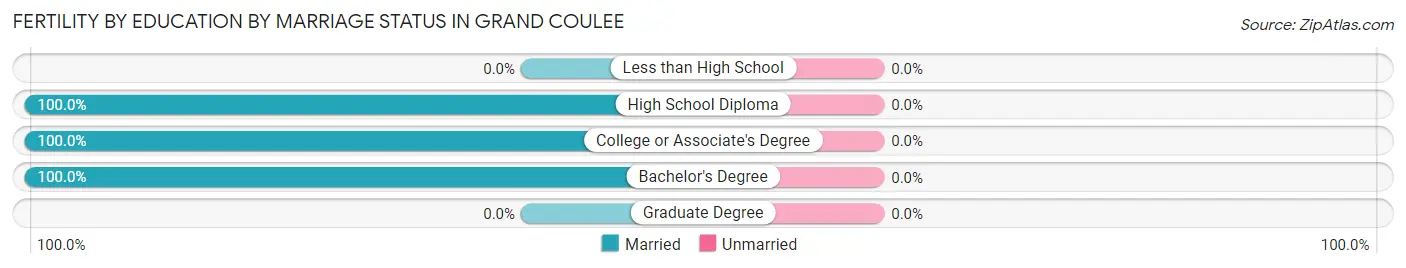
| Educational Attainment | Married | Unmarried |
| Less than High School | 0 (0.0%) | 0 (0.0%) |
| High School Diploma | 6 (100.0%) | 0 (0.0%) |
| College or Associate's Degree | 1 (100.0%) | 0 (0.0%) |
| Bachelor's Degree | 7 (100.0%) | 0 (0.0%) |
| Graduate Degree | 0 (0.0%) | 0 (0.0%) |
| Total | 14 (100.0%) | 0 (0.0%) |
Employment Characteristics in Grand Coulee
Employment by Class of Employer in Grand Coulee
Among the 364 employed individuals in Grand Coulee, private company employees (148 | 40.7%), federal government employees (93 | 25.6%), and state government employees (60 | 16.5%) make up the most common classes of employment.
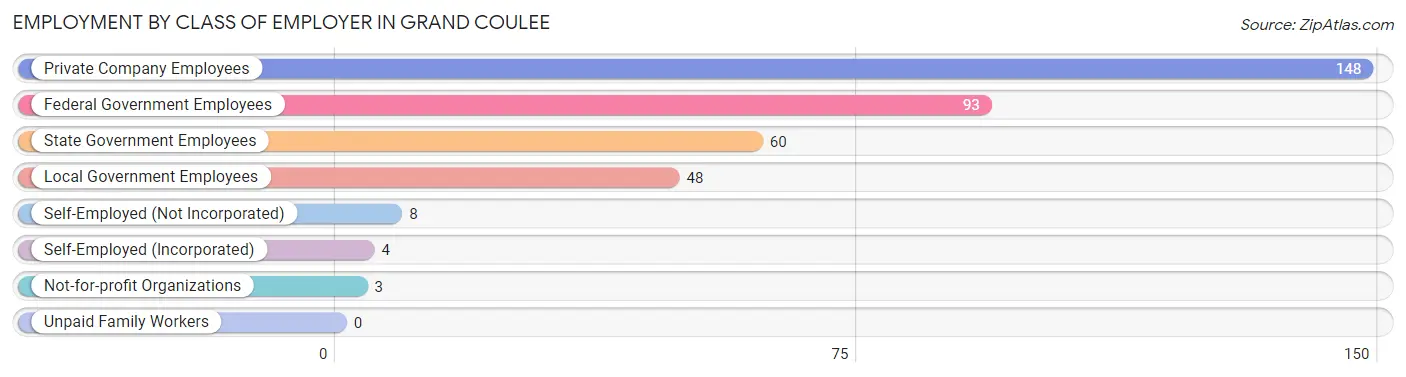
| Employer Class | # Employees | % Employees |
| Private Company Employees | 148 | 40.7% |
| Self-Employed (Incorporated) | 4 | 1.1% |
| Self-Employed (Not Incorporated) | 8 | 2.2% |
| Not-for-profit Organizations | 3 | 0.8% |
| Local Government Employees | 48 | 13.2% |
| State Government Employees | 60 | 16.5% |
| Federal Government Employees | 93 | 25.6% |
| Unpaid Family Workers | 0 | 0.0% |
| Total | 364 | 100.0% |
Employment Status by Age in Grand Coulee
According to the labor force statistics for Grand Coulee, out of the total population over 16 years of age (950), 43.9% or 417 individuals are in the labor force, with 12.7% or 53 of them unemployed. The age group with the highest labor force participation rate is 25 to 29 years, with 80.6% or 54 individuals in the labor force. Within the labor force, the 16 to 19 years age range has the highest percentage of unemployed individuals, with 57.9% or 22 of them being unemployed.
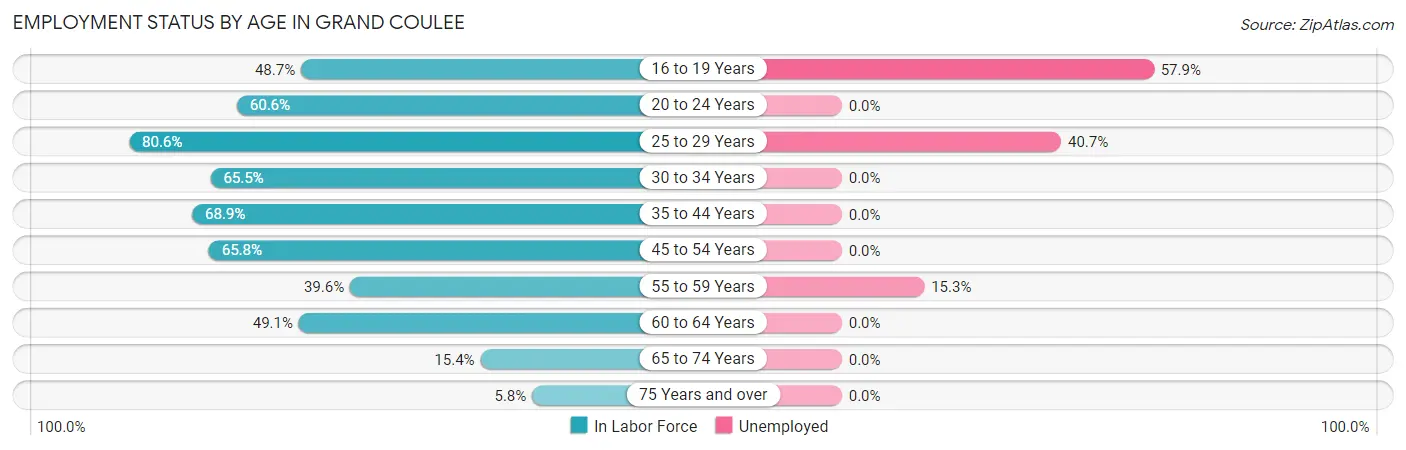
| Age Bracket | In Labor Force | Unemployed |
| 16 to 19 Years | 38 (48.7%) | 22 (57.9%) |
| 20 to 24 Years | 20 (60.6%) | 0 (0.0%) |
| 25 to 29 Years | 54 (80.6%) | 22 (40.7%) |
| 30 to 34 Years | 38 (65.5%) | 0 (0.0%) |
| 35 to 44 Years | 71 (68.9%) | 0 (0.0%) |
| 45 to 54 Years | 79 (65.8%) | 0 (0.0%) |
| 55 to 59 Years | 59 (39.6%) | 9 (15.3%) |
| 60 to 64 Years | 27 (49.1%) | 0 (0.0%) |
| 65 to 74 Years | 23 (15.4%) | 0 (0.0%) |
| 75 Years and over | 8 (5.8%) | 0 (0.0%) |
| Total | 417 (43.9%) | 53 (12.7%) |
Employment Status by Educational Attainment in Grand Coulee
According to labor force statistics for Grand Coulee, 59.4% of individuals (328) out of the total population between 25 and 64 years of age (552) are in the labor force, with 9.5% or 31 of them being unemployed. The group with the highest labor force participation rate are those with the educational attainment of bachelor's degree or higher, with 73.3% or 66 individuals in the labor force. Within the labor force, individuals with less than high school education have the highest percentage of unemployment, with 31.3% or 15 of them being unemployed.
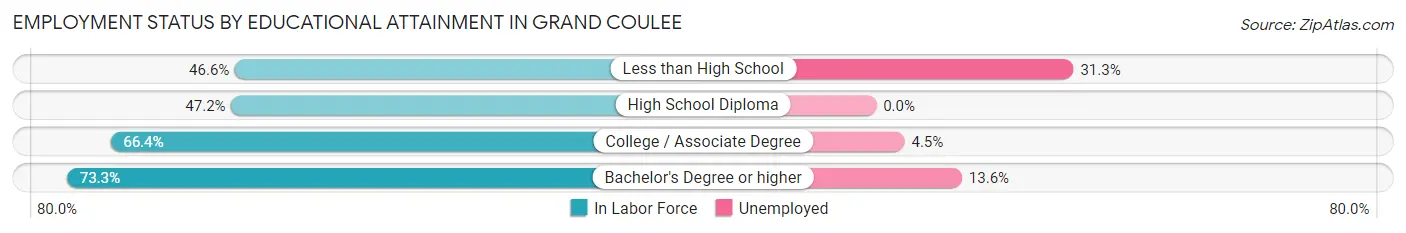
| Educational Attainment | In Labor Force | Unemployed |
| Less than High School | 48 (46.6%) | 32 (31.3%) |
| High School Diploma | 60 (47.2%) | 0 (0.0%) |
| College / Associate Degree | 154 (66.4%) | 10 (4.5%) |
| Bachelor's Degree or higher | 66 (73.3%) | 12 (13.6%) |
| Total | 328 (59.4%) | 52 (9.5%) |
Employment Occupations by Sex in Grand Coulee
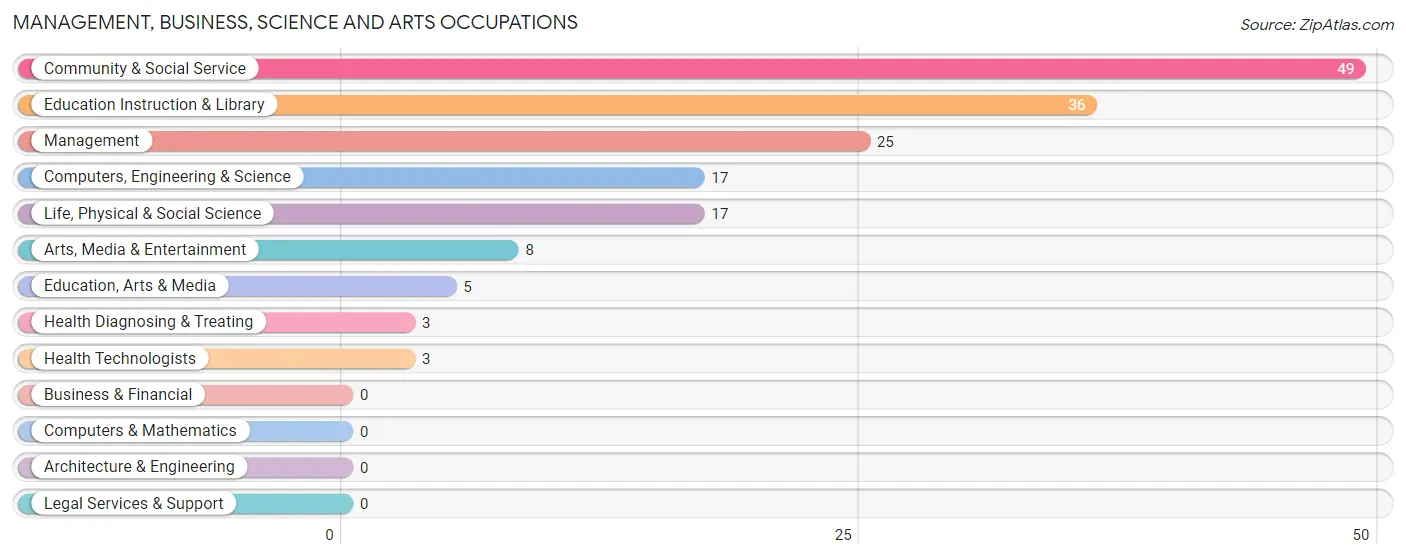
Management, Business, Science and Arts Occupations
The most common Management, Business, Science and Arts occupations in Grand Coulee are Community & Social Service (49 | 13.5%), Education Instruction & Library (36 | 9.9%), Management (25 | 6.9%), Computers, Engineering & Science (17 | 4.7%), and Life, Physical & Social Science (17 | 4.7%).
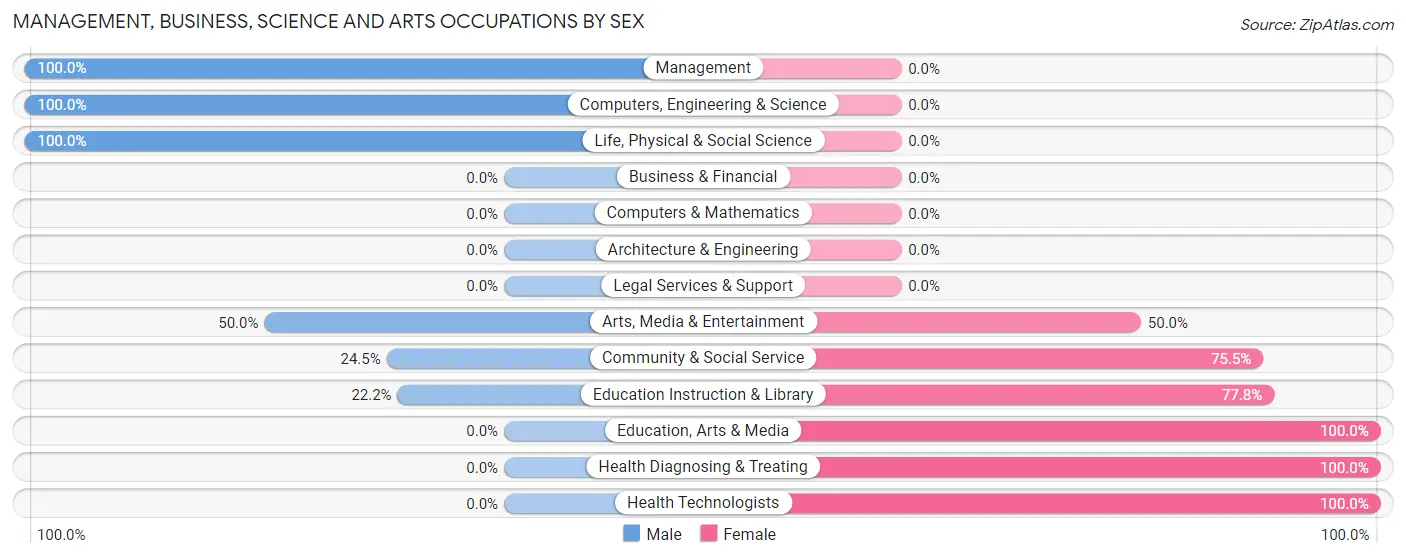
Management, Business, Science and Arts Occupations by Sex
Within the Management, Business, Science and Arts occupations in Grand Coulee, the most male-oriented occupations are Management (100.0%), Computers, Engineering & Science (100.0%), and Life, Physical & Social Science (100.0%), while the most female-oriented occupations are Education, Arts & Media (100.0%), Health Diagnosing & Treating (100.0%), and Health Technologists (100.0%).
| Occupation | Male | Female |
| Management | 25 (100.0%) | 0 (0.0%) |
| Business & Financial | 0 (0.0%) | 0 (0.0%) |
| Computers, Engineering & Science | 17 (100.0%) | 0 (0.0%) |
| Computers & Mathematics | 0 (0.0%) | 0 (0.0%) |
| Architecture & Engineering | 0 (0.0%) | 0 (0.0%) |
| Life, Physical & Social Science | 17 (100.0%) | 0 (0.0%) |
| Community & Social Service | 12 (24.5%) | 37 (75.5%) |
| Education, Arts & Media | 0 (0.0%) | 5 (100.0%) |
| Legal Services & Support | 0 (0.0%) | 0 (0.0%) |
| Education Instruction & Library | 8 (22.2%) | 28 (77.8%) |
| Arts, Media & Entertainment | 4 (50.0%) | 4 (50.0%) |
| Health Diagnosing & Treating | 0 (0.0%) | 3 (100.0%) |
| Health Technologists | 0 (0.0%) | 3 (100.0%) |
| Total (Category) | 54 (57.5%) | 40 (42.5%) |
| Total (Overall) | 244 (67.0%) | 120 (33.0%) |
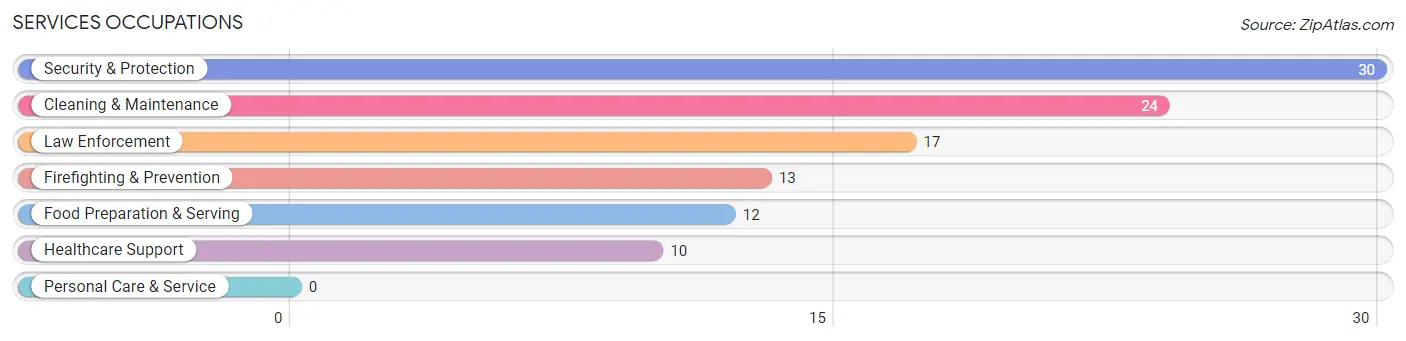
Services Occupations
The most common Services occupations in Grand Coulee are Security & Protection (30 | 8.2%), Cleaning & Maintenance (24 | 6.6%), Law Enforcement (17 | 4.7%), Firefighting & Prevention (13 | 3.6%), and Food Preparation & Serving (12 | 3.3%).
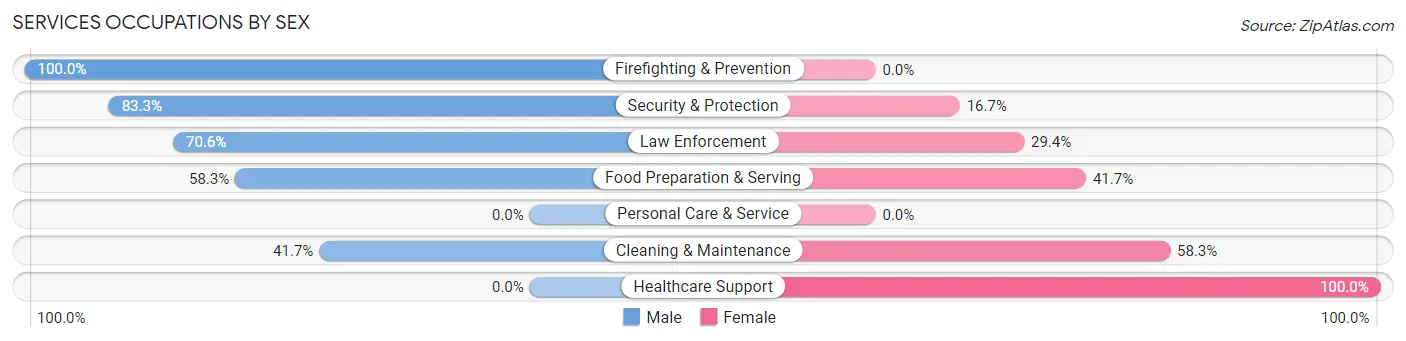
Services Occupations by Sex
Within the Services occupations in Grand Coulee, the most male-oriented occupations are Firefighting & Prevention (100.0%), Security & Protection (83.3%), and Law Enforcement (70.6%), while the most female-oriented occupations are Healthcare Support (100.0%), Cleaning & Maintenance (58.3%), and Food Preparation & Serving (41.7%).
| Occupation | Male | Female |
| Healthcare Support | 0 (0.0%) | 10 (100.0%) |
| Security & Protection | 25 (83.3%) | 5 (16.7%) |
| Firefighting & Prevention | 13 (100.0%) | 0 (0.0%) |
| Law Enforcement | 12 (70.6%) | 5 (29.4%) |
| Food Preparation & Serving | 7 (58.3%) | 5 (41.7%) |
| Cleaning & Maintenance | 10 (41.7%) | 14 (58.3%) |
| Personal Care & Service | 0 (0.0%) | 0 (0.0%) |
| Total (Category) | 42 (55.3%) | 34 (44.7%) |
| Total (Overall) | 244 (67.0%) | 120 (33.0%) |
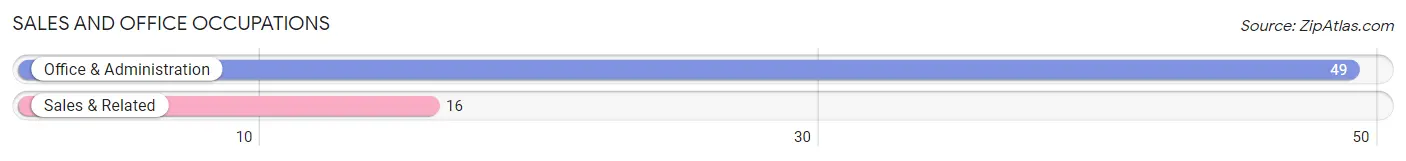
Sales and Office Occupations
The most common Sales and Office occupations in Grand Coulee are Office & Administration (49 | 13.5%), and Sales & Related (16 | 4.4%).
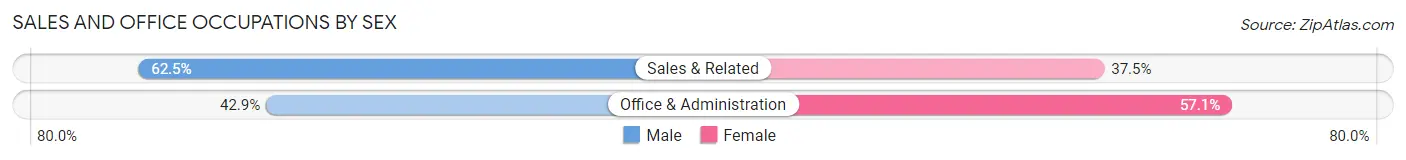
Sales and Office Occupations by Sex
| Occupation | Male | Female |
| Sales & Related | 10 (62.5%) | 6 (37.5%) |
| Office & Administration | 21 (42.9%) | 28 (57.1%) |
| Total (Category) | 31 (47.7%) | 34 (52.3%) |
| Total (Overall) | 244 (67.0%) | 120 (33.0%) |
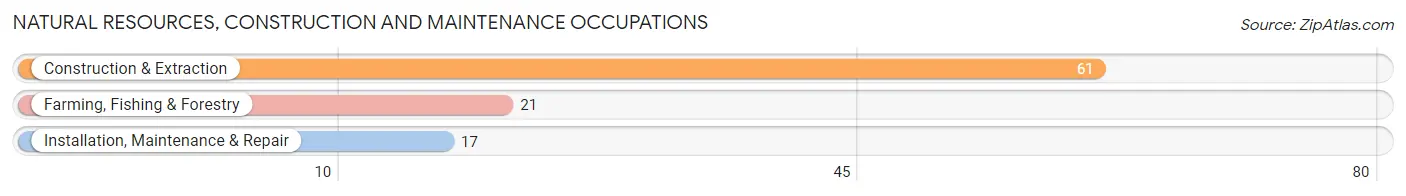
Natural Resources, Construction and Maintenance Occupations
The most common Natural Resources, Construction and Maintenance occupations in Grand Coulee are Construction & Extraction (61 | 16.8%), Farming, Fishing & Forestry (21 | 5.8%), and Installation, Maintenance & Repair (17 | 4.7%).
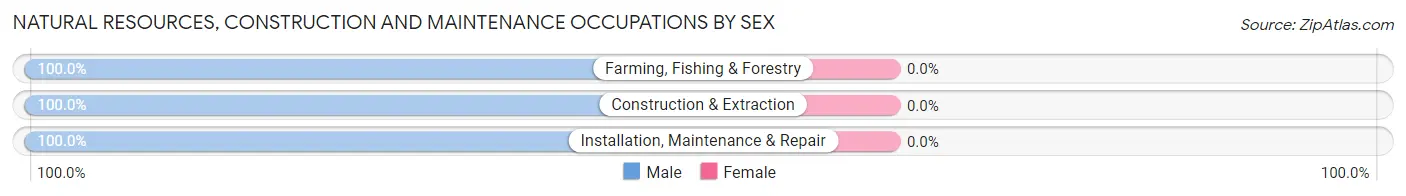
Natural Resources, Construction and Maintenance Occupations by Sex
| Occupation | Male | Female |
| Farming, Fishing & Forestry | 21 (100.0%) | 0 (0.0%) |
| Construction & Extraction | 61 (100.0%) | 0 (0.0%) |
| Installation, Maintenance & Repair | 17 (100.0%) | 0 (0.0%) |
| Total (Category) | 99 (100.0%) | 0 (0.0%) |
| Total (Overall) | 244 (67.0%) | 120 (33.0%) |
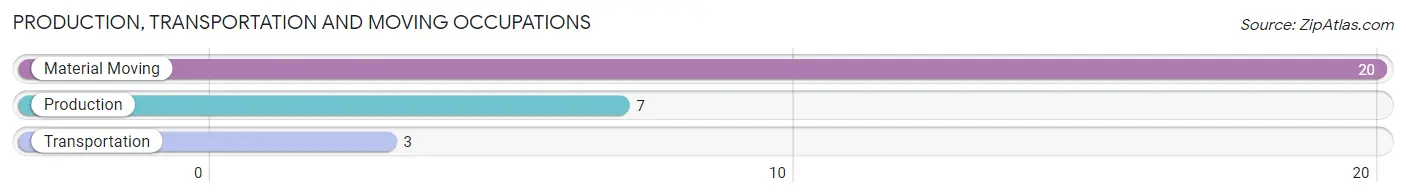
Production, Transportation and Moving Occupations
The most common Production, Transportation and Moving occupations in Grand Coulee are Material Moving (20 | 5.5%), Production (7 | 1.9%), and Transportation (3 | 0.8%).
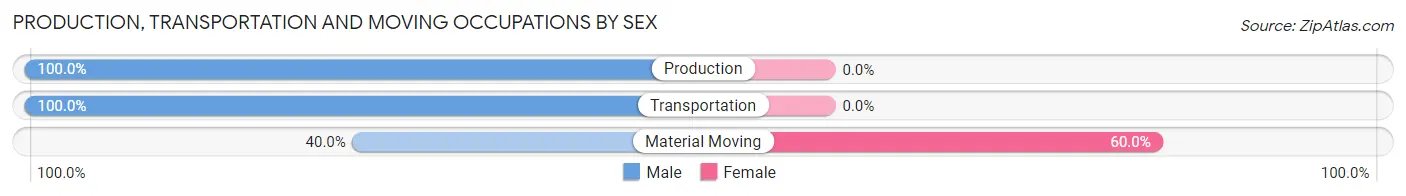
Production, Transportation and Moving Occupations by Sex
| Occupation | Male | Female |
| Production | 7 (100.0%) | 0 (0.0%) |
| Transportation | 3 (100.0%) | 0 (0.0%) |
| Material Moving | 8 (40.0%) | 12 (60.0%) |
| Total (Category) | 18 (60.0%) | 12 (40.0%) |
| Total (Overall) | 244 (67.0%) | 120 (33.0%) |
Employment Industries by Sex in Grand Coulee
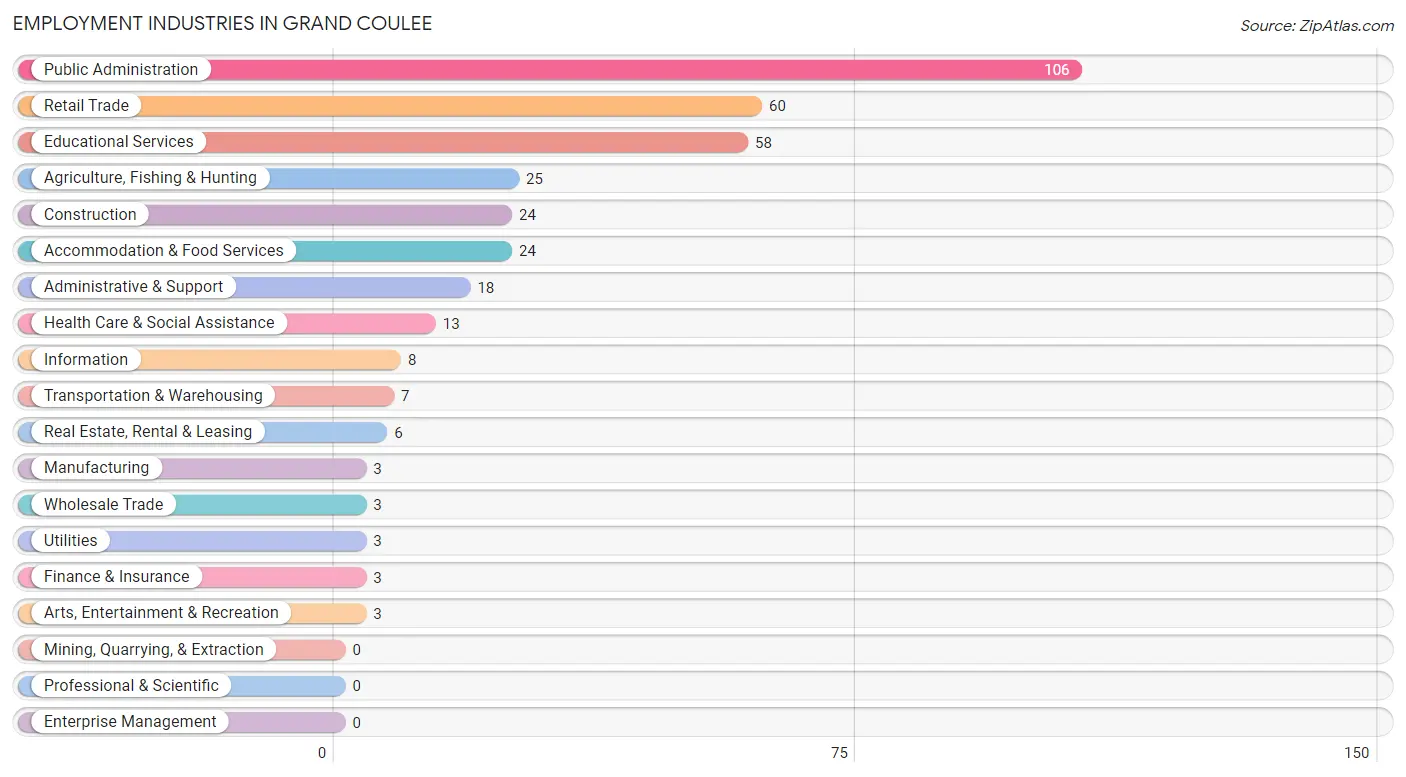
Employment Industries in Grand Coulee
The major employment industries in Grand Coulee include Public Administration (106 | 29.1%), Retail Trade (60 | 16.5%), Educational Services (58 | 15.9%), Agriculture, Fishing & Hunting (25 | 6.9%), and Construction (24 | 6.6%).
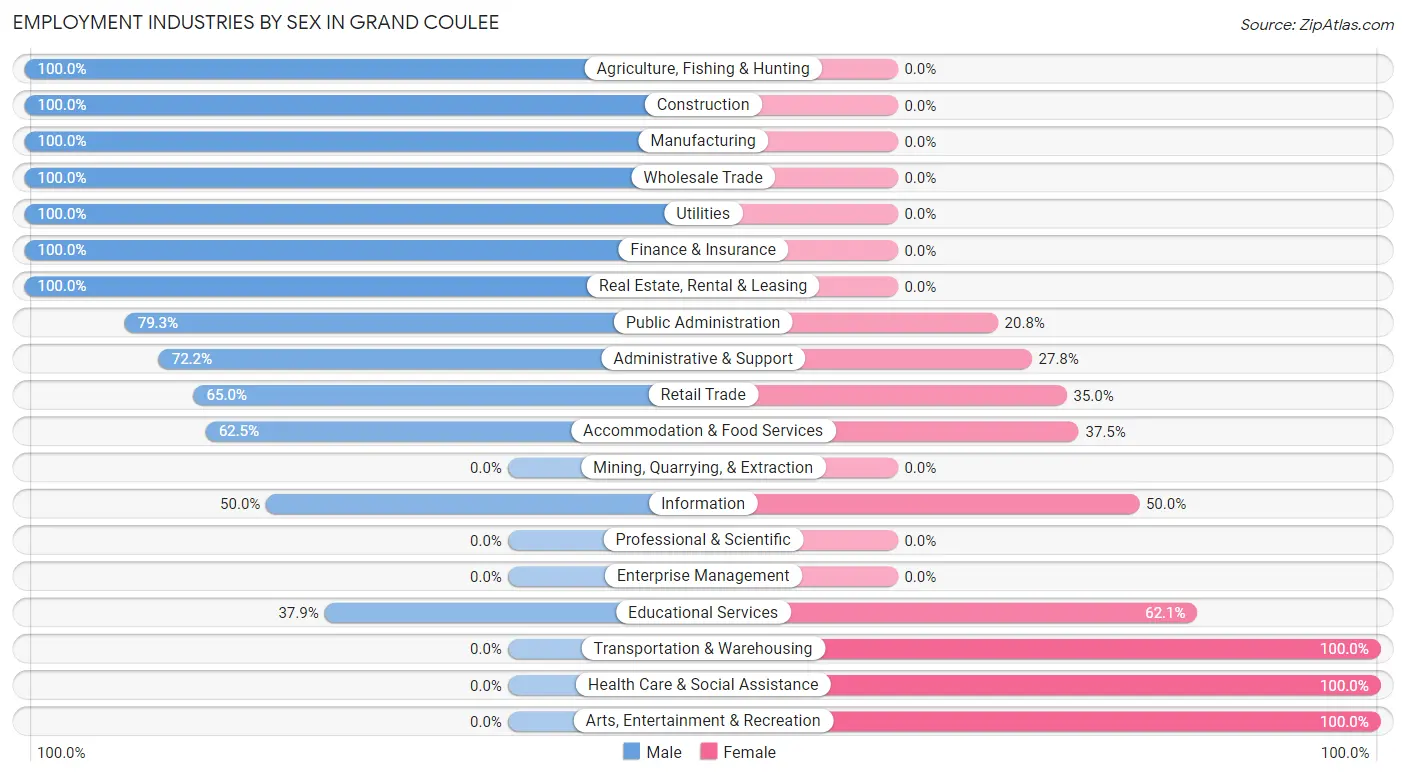
Employment Industries by Sex in Grand Coulee
The Grand Coulee industries that see more men than women are Agriculture, Fishing & Hunting (100.0%), Construction (100.0%), and Manufacturing (100.0%), whereas the industries that tend to have a higher number of women are Transportation & Warehousing (100.0%), Health Care & Social Assistance (100.0%), and Arts, Entertainment & Recreation (100.0%).
| Industry | Male | Female |
| Agriculture, Fishing & Hunting | 25 (100.0%) | 0 (0.0%) |
| Mining, Quarrying, & Extraction | 0 (0.0%) | 0 (0.0%) |
| Construction | 24 (100.0%) | 0 (0.0%) |
| Manufacturing | 3 (100.0%) | 0 (0.0%) |
| Wholesale Trade | 3 (100.0%) | 0 (0.0%) |
| Retail Trade | 39 (65.0%) | 21 (35.0%) |
| Transportation & Warehousing | 0 (0.0%) | 7 (100.0%) |
| Utilities | 3 (100.0%) | 0 (0.0%) |
| Information | 4 (50.0%) | 4 (50.0%) |
| Finance & Insurance | 3 (100.0%) | 0 (0.0%) |
| Real Estate, Rental & Leasing | 6 (100.0%) | 0 (0.0%) |
| Professional & Scientific | 0 (0.0%) | 0 (0.0%) |
| Enterprise Management | 0 (0.0%) | 0 (0.0%) |
| Administrative & Support | 13 (72.2%) | 5 (27.8%) |
| Educational Services | 22 (37.9%) | 36 (62.1%) |
| Health Care & Social Assistance | 0 (0.0%) | 13 (100.0%) |
| Arts, Entertainment & Recreation | 0 (0.0%) | 3 (100.0%) |
| Accommodation & Food Services | 15 (62.5%) | 9 (37.5%) |
| Public Administration | 84 (79.2%) | 22 (20.7%) |
| Total | 244 (67.0%) | 120 (33.0%) |
Education in Grand Coulee
School Enrollment in Grand Coulee
The most common levels of schooling among the 113 students in Grand Coulee are elementary school (34 | 30.1%), high school (31 | 27.4%), and middle school (26 | 23.0%).
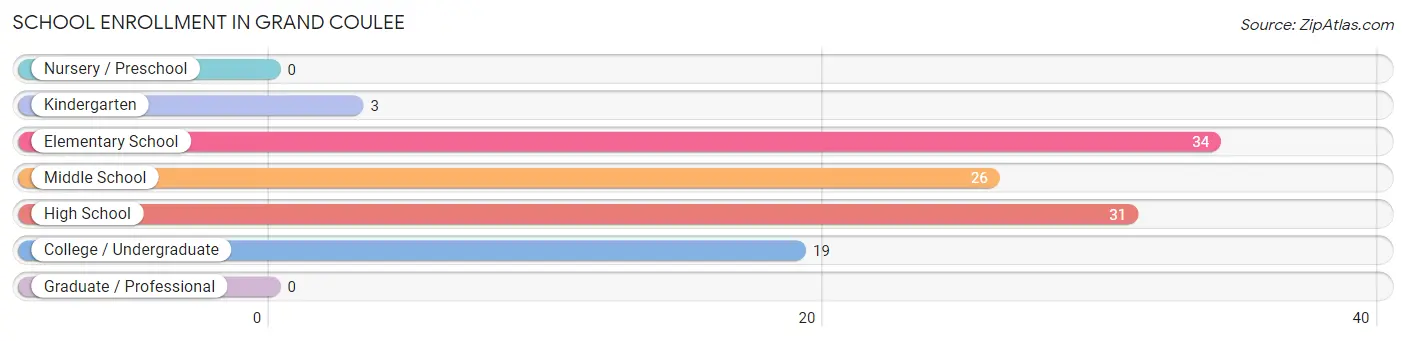
| School Level | # Students | % Students |
| Nursery / Preschool | 0 | 0.0% |
| Kindergarten | 3 | 2.6% |
| Elementary School | 34 | 30.1% |
| Middle School | 26 | 23.0% |
| High School | 31 | 27.4% |
| College / Undergraduate | 19 | 16.8% |
| Graduate / Professional | 0 | 0.0% |
| Total | 113 | 100.0% |
School Enrollment by Age by Funding Source in Grand Coulee
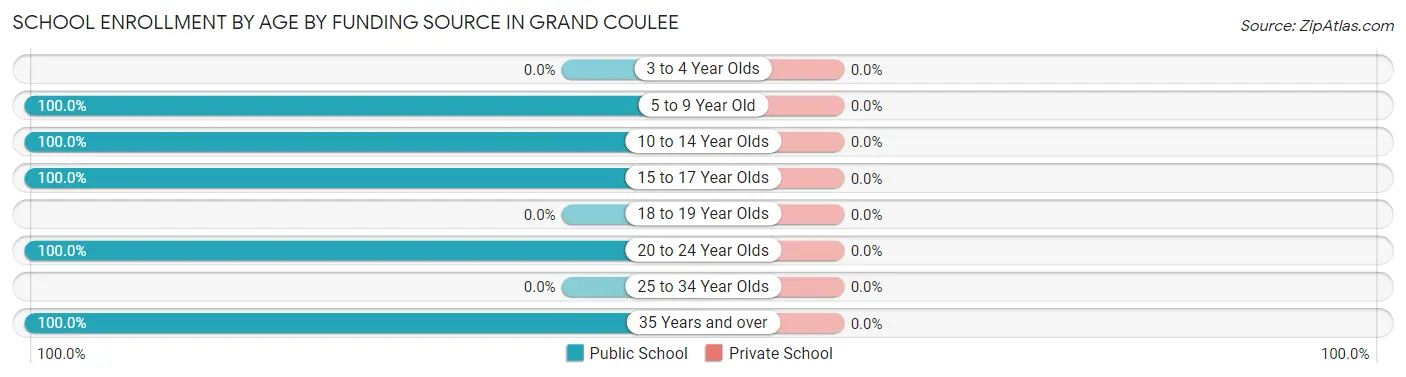
| Age Bracket | Public School | Private School |
| 3 to 4 Year Olds | 0 (0.0%) | 0 (0.0%) |
| 5 to 9 Year Old | 37 (100.0%) | 0 (0.0%) |
| 10 to 14 Year Olds | 26 (100.0%) | 0 (0.0%) |
| 15 to 17 Year Olds | 31 (100.0%) | 0 (0.0%) |
| 18 to 19 Year Olds | 0 (0.0%) | 0 (0.0%) |
| 20 to 24 Year Olds | 14 (100.0%) | 0 (0.0%) |
| 25 to 34 Year Olds | 0 (0.0%) | 0 (0.0%) |
| 35 Years and over | 5 (100.0%) | 0 (0.0%) |
| Total | 113 (100.0%) | 0 (0.0%) |
Educational Attainment by Field of Study in Grand Coulee
Bio, nature & agricultural (29 | 22.1%), education (23 | 17.6%), arts & humanities (21 | 16.0%), liberal arts & history (14 | 10.7%), and computers & mathematics (13 | 9.9%) are the most common fields of study among 131 individuals in Grand Coulee who have obtained a bachelor's degree or higher.
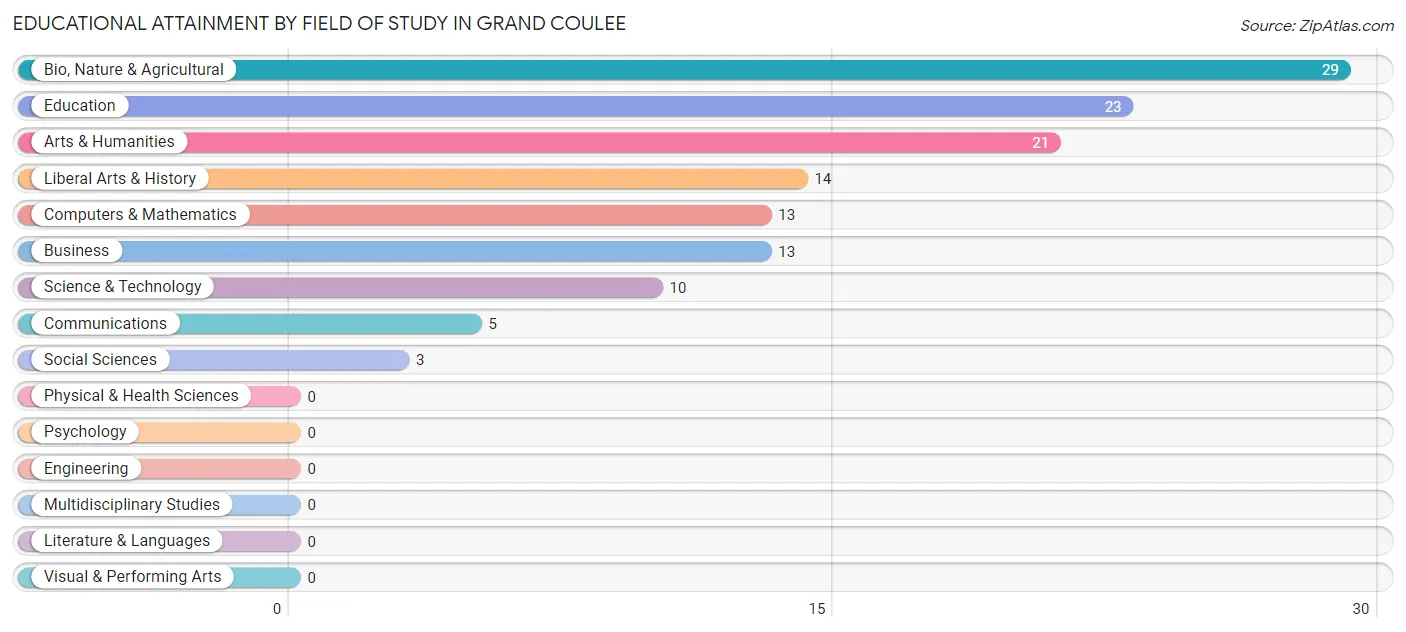
| Field of Study | # Graduates | % Graduates |
| Computers & Mathematics | 13 | 9.9% |
| Bio, Nature & Agricultural | 29 | 22.1% |
| Physical & Health Sciences | 0 | 0.0% |
| Psychology | 0 | 0.0% |
| Social Sciences | 3 | 2.3% |
| Engineering | 0 | 0.0% |
| Multidisciplinary Studies | 0 | 0.0% |
| Science & Technology | 10 | 7.6% |
| Business | 13 | 9.9% |
| Education | 23 | 17.6% |
| Literature & Languages | 0 | 0.0% |
| Liberal Arts & History | 14 | 10.7% |
| Visual & Performing Arts | 0 | 0.0% |
| Communications | 5 | 3.8% |
| Arts & Humanities | 21 | 16.0% |
| Total | 131 | 100.0% |
Transportation & Commute in Grand Coulee
Vehicle Availability by Sex in Grand Coulee
The most prevalent vehicle ownership categories in Grand Coulee are males with 2 vehicles (124, accounting for 51.2%) and females with 2 vehicles (57, making up 103.3%).
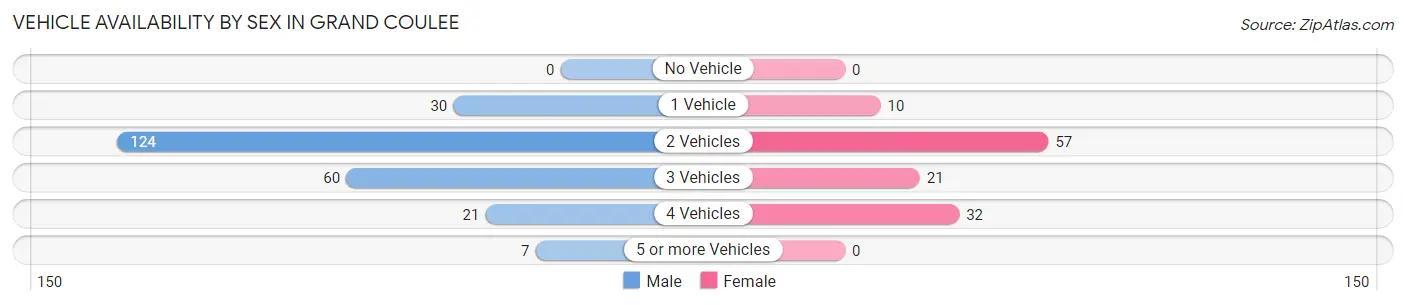
| Vehicles Available | Male | Female |
| No Vehicle | 0 (0.0%) | 0 (0.0%) |
| 1 Vehicle | 30 (12.4%) | 10 (8.3%) |
| 2 Vehicles | 124 (51.2%) | 57 (47.5%) |
| 3 Vehicles | 60 (24.8%) | 21 (17.5%) |
| 4 Vehicles | 21 (8.7%) | 32 (26.7%) |
| 5 or more Vehicles | 7 (2.9%) | 0 (0.0%) |
| Total | 242 (100.0%) | 120 (100.0%) |
Commute Time in Grand Coulee
The most frequently occuring commute durations in Grand Coulee are 5 to 9 minutes (144 commuters, 39.6%), less than 5 minutes (63 commuters, 17.3%), and 10 to 14 minutes (47 commuters, 12.9%).
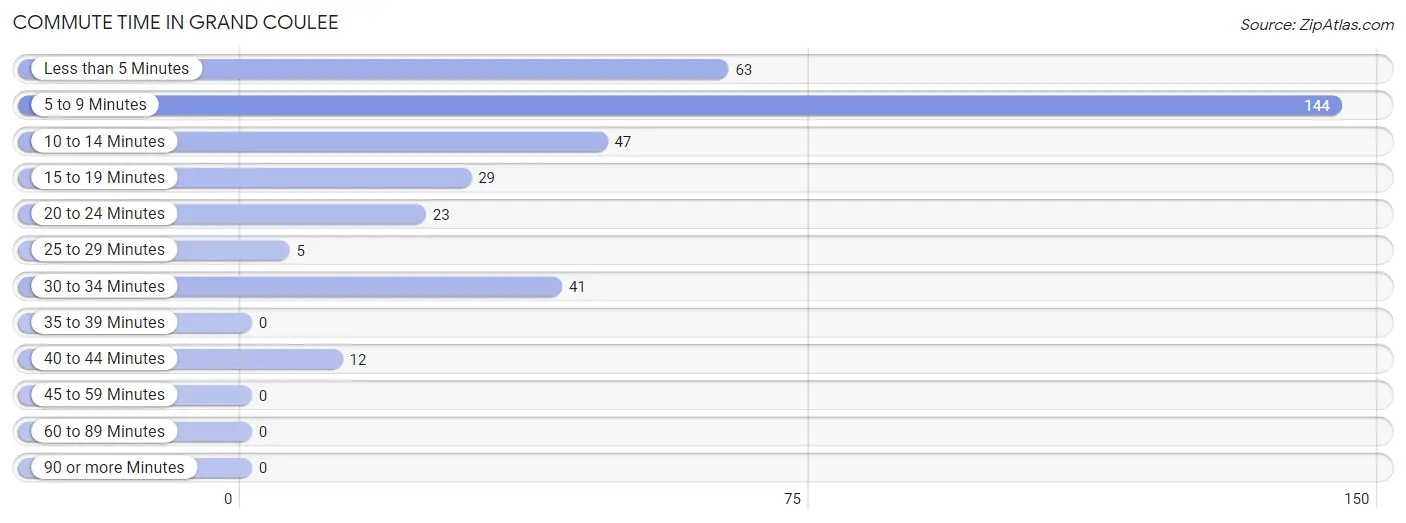
| Commute Time | # Commuters | % Commuters |
| Less than 5 Minutes | 63 | 17.3% |
| 5 to 9 Minutes | 144 | 39.6% |
| 10 to 14 Minutes | 47 | 12.9% |
| 15 to 19 Minutes | 29 | 8.0% |
| 20 to 24 Minutes | 23 | 6.3% |
| 25 to 29 Minutes | 5 | 1.4% |
| 30 to 34 Minutes | 41 | 11.3% |
| 35 to 39 Minutes | 0 | 0.0% |
| 40 to 44 Minutes | 12 | 3.3% |
| 45 to 59 Minutes | 0 | 0.0% |
| 60 to 89 Minutes | 0 | 0.0% |
| 90 or more Minutes | 0 | 0.0% |
Commute Time by Sex in Grand Coulee
The most common commute times in Grand Coulee are 5 to 9 minutes (92 commuters, 37.7%) for males and 5 to 9 minutes (52 commuters, 43.3%) for females.
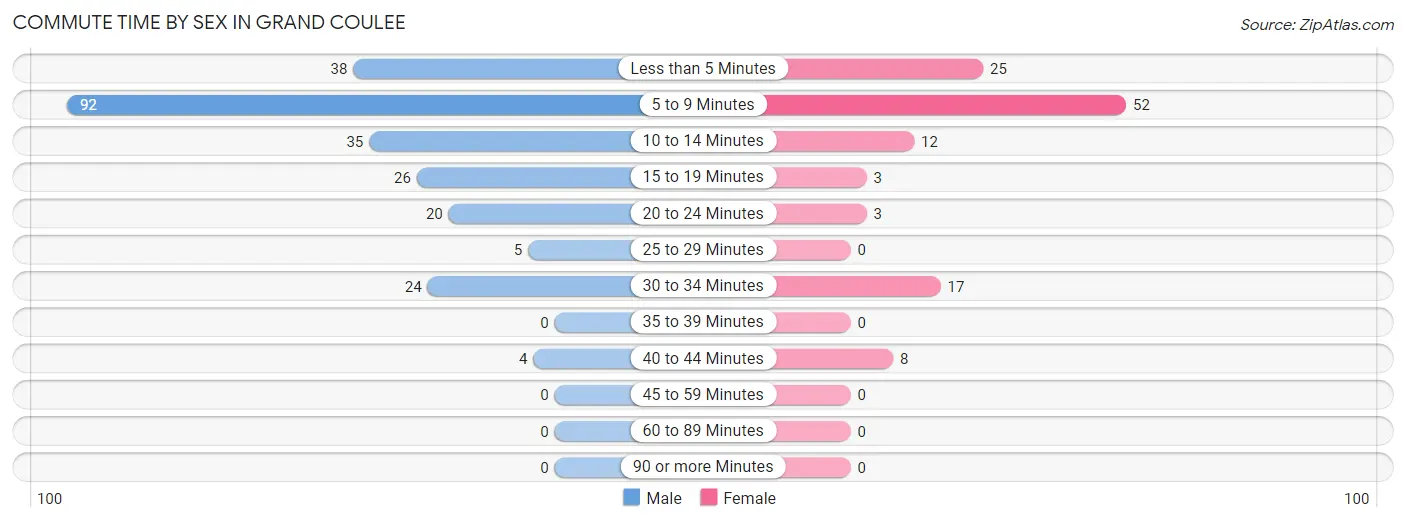
| Commute Time | Male | Female |
| Less than 5 Minutes | 38 (15.6%) | 25 (20.8%) |
| 5 to 9 Minutes | 92 (37.7%) | 52 (43.3%) |
| 10 to 14 Minutes | 35 (14.3%) | 12 (10.0%) |
| 15 to 19 Minutes | 26 (10.7%) | 3 (2.5%) |
| 20 to 24 Minutes | 20 (8.2%) | 3 (2.5%) |
| 25 to 29 Minutes | 5 (2.1%) | 0 (0.0%) |
| 30 to 34 Minutes | 24 (9.8%) | 17 (14.2%) |
| 35 to 39 Minutes | 0 (0.0%) | 0 (0.0%) |
| 40 to 44 Minutes | 4 (1.6%) | 8 (6.7%) |
| 45 to 59 Minutes | 0 (0.0%) | 0 (0.0%) |
| 60 to 89 Minutes | 0 (0.0%) | 0 (0.0%) |
| 90 or more Minutes | 0 (0.0%) | 0 (0.0%) |
Time of Departure to Work by Sex in Grand Coulee
The most frequent times of departure to work in Grand Coulee are 6:00 AM to 6:29 AM (75, 30.7%) for males and 7:30 AM to 7:59 AM (49, 40.8%) for females.
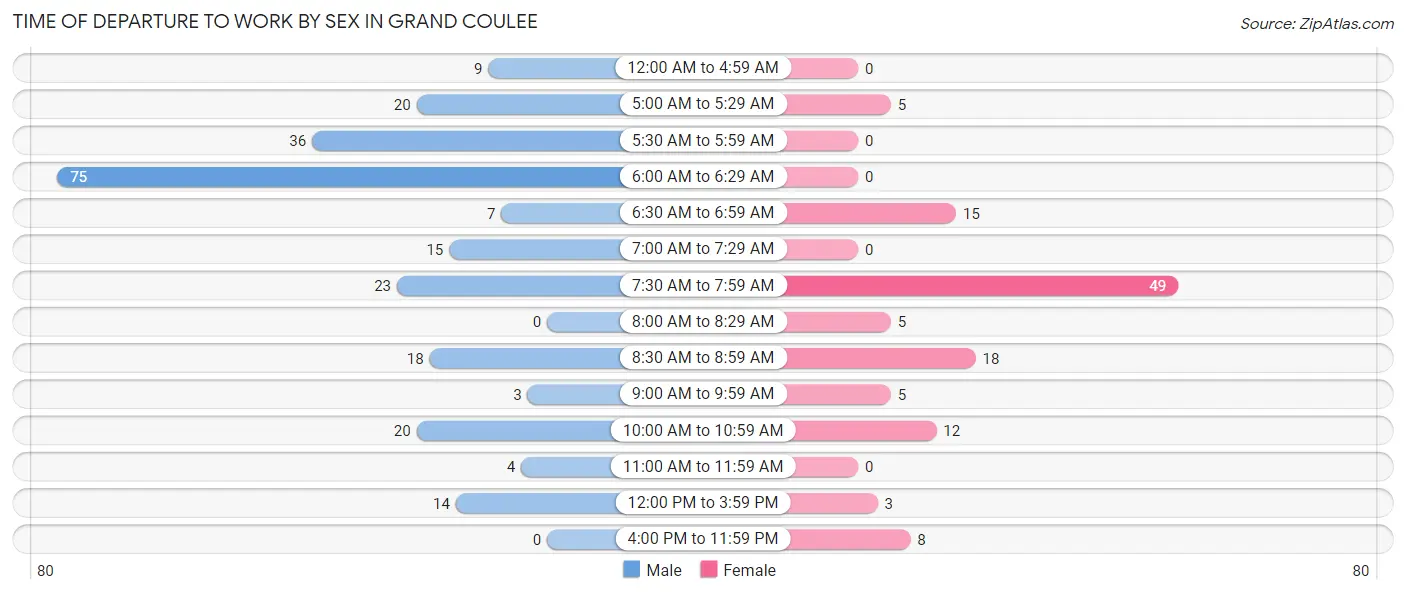
| Time of Departure | Male | Female |
| 12:00 AM to 4:59 AM | 9 (3.7%) | 0 (0.0%) |
| 5:00 AM to 5:29 AM | 20 (8.2%) | 5 (4.2%) |
| 5:30 AM to 5:59 AM | 36 (14.7%) | 0 (0.0%) |
| 6:00 AM to 6:29 AM | 75 (30.7%) | 0 (0.0%) |
| 6:30 AM to 6:59 AM | 7 (2.9%) | 15 (12.5%) |
| 7:00 AM to 7:29 AM | 15 (6.1%) | 0 (0.0%) |
| 7:30 AM to 7:59 AM | 23 (9.4%) | 49 (40.8%) |
| 8:00 AM to 8:29 AM | 0 (0.0%) | 5 (4.2%) |
| 8:30 AM to 8:59 AM | 18 (7.4%) | 18 (15.0%) |
| 9:00 AM to 9:59 AM | 3 (1.2%) | 5 (4.2%) |
| 10:00 AM to 10:59 AM | 20 (8.2%) | 12 (10.0%) |
| 11:00 AM to 11:59 AM | 4 (1.6%) | 0 (0.0%) |
| 12:00 PM to 3:59 PM | 14 (5.7%) | 3 (2.5%) |
| 4:00 PM to 11:59 PM | 0 (0.0%) | 8 (6.7%) |
| Total | 244 (100.0%) | 120 (100.0%) |
Housing Occupancy in Grand Coulee
Occupancy by Ownership in Grand Coulee
Of the total 549 dwellings in Grand Coulee, owner-occupied units account for 339 (61.8%), while renter-occupied units make up 210 (38.3%).
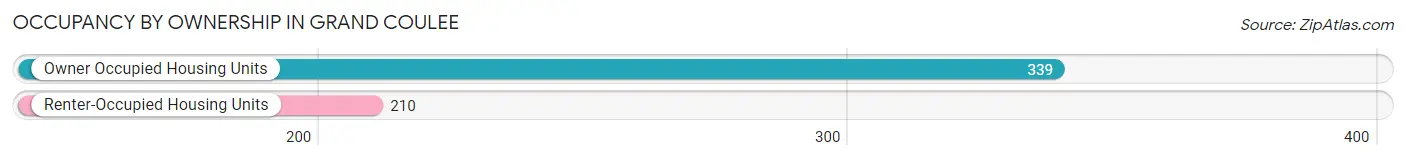
| Occupancy | # Housing Units | % Housing Units |
| Owner Occupied Housing Units | 339 | 61.8% |
| Renter-Occupied Housing Units | 210 | 38.3% |
| Total Occupied Housing Units | 549 | 100.0% |
Occupancy by Household Size in Grand Coulee
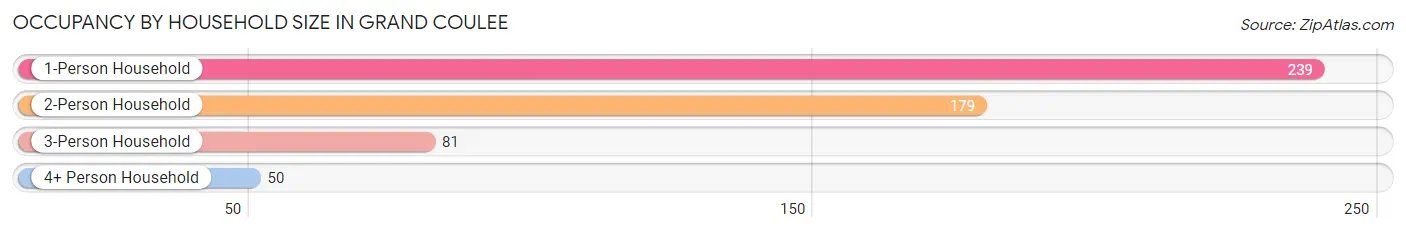
| Household Size | # Housing Units | % Housing Units |
| 1-Person Household | 239 | 43.5% |
| 2-Person Household | 179 | 32.6% |
| 3-Person Household | 81 | 14.7% |
| 4+ Person Household | 50 | 9.1% |
| Total Housing Units | 549 | 100.0% |
Occupancy by Ownership by Household Size in Grand Coulee
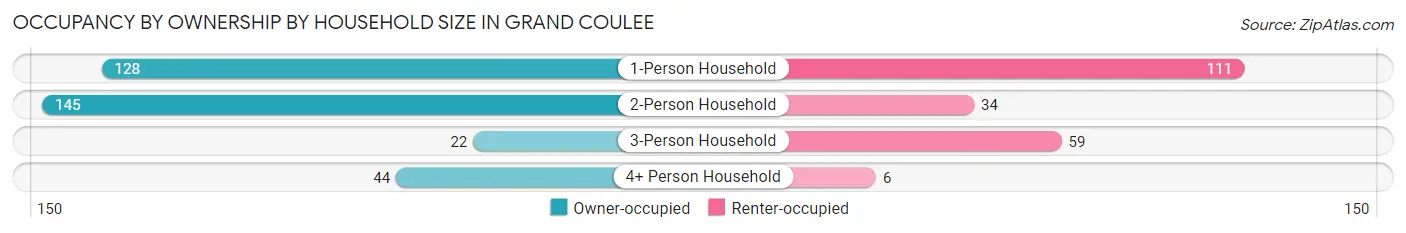
| Household Size | Owner-occupied | Renter-occupied |
| 1-Person Household | 128 (53.6%) | 111 (46.4%) |
| 2-Person Household | 145 (81.0%) | 34 (19.0%) |
| 3-Person Household | 22 (27.2%) | 59 (72.8%) |
| 4+ Person Household | 44 (88.0%) | 6 (12.0%) |
| Total Housing Units | 339 (61.8%) | 210 (38.3%) |
Occupancy by Educational Attainment in Grand Coulee
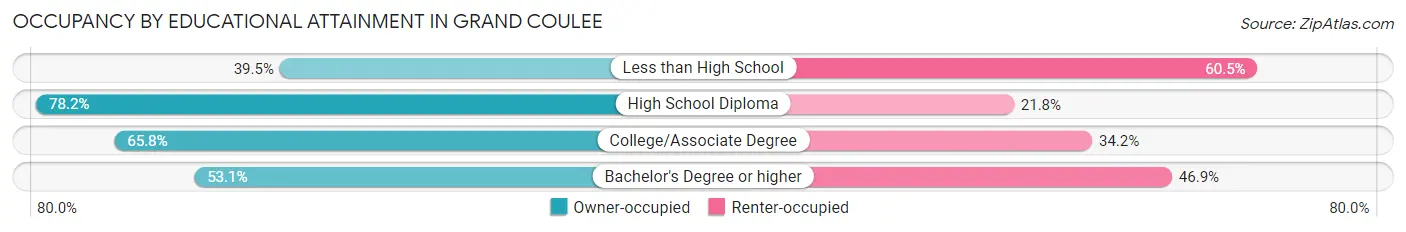
| Household Size | Owner-occupied | Renter-occupied |
| Less than High School | 34 (39.5%) | 52 (60.5%) |
| High School Diploma | 68 (78.2%) | 19 (21.8%) |
| College/Associate Degree | 194 (65.8%) | 101 (34.2%) |
| Bachelor's Degree or higher | 43 (53.1%) | 38 (46.9%) |
Occupancy by Age of Householder in Grand Coulee
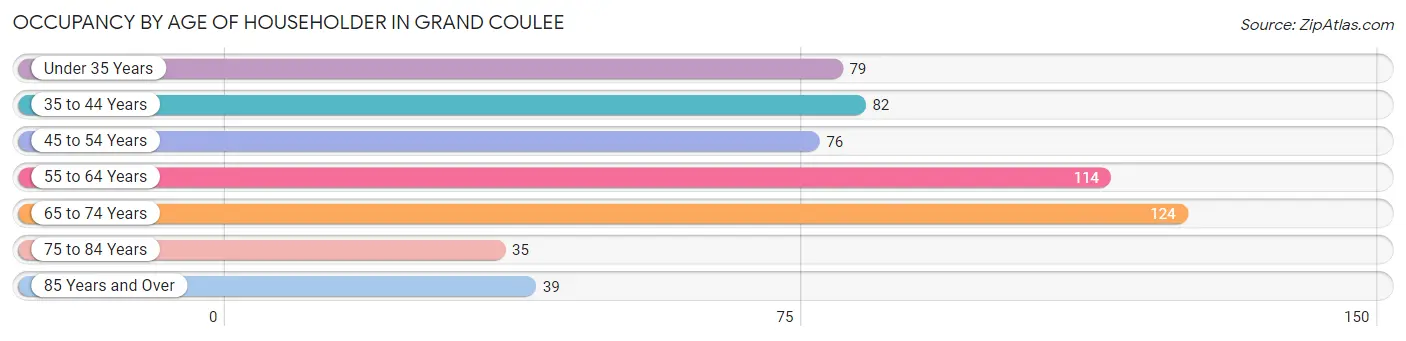
| Age Bracket | # Households | % Households |
| Under 35 Years | 79 | 14.4% |
| 35 to 44 Years | 82 | 14.9% |
| 45 to 54 Years | 76 | 13.8% |
| 55 to 64 Years | 114 | 20.8% |
| 65 to 74 Years | 124 | 22.6% |
| 75 to 84 Years | 35 | 6.4% |
| 85 Years and Over | 39 | 7.1% |
| Total | 549 | 100.0% |
Housing Finances in Grand Coulee
Median Income by Occupancy in Grand Coulee
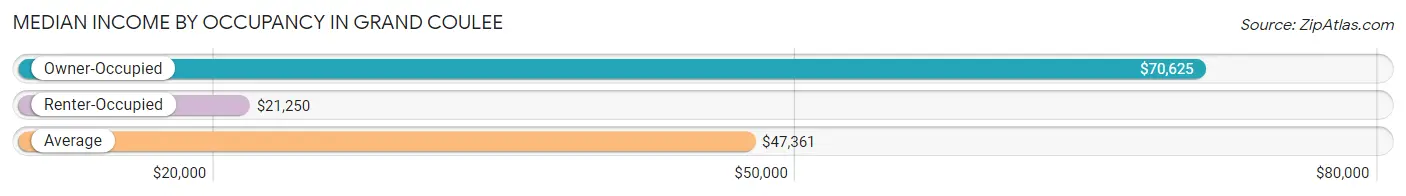
| Occupancy Type | # Households | Median Income |
| Owner-Occupied | 339 (61.8%) | $70,625 |
| Renter-Occupied | 210 (38.3%) | $21,250 |
| Average | 549 (100.0%) | $47,361 |
Occupancy by Householder Income Bracket in Grand Coulee
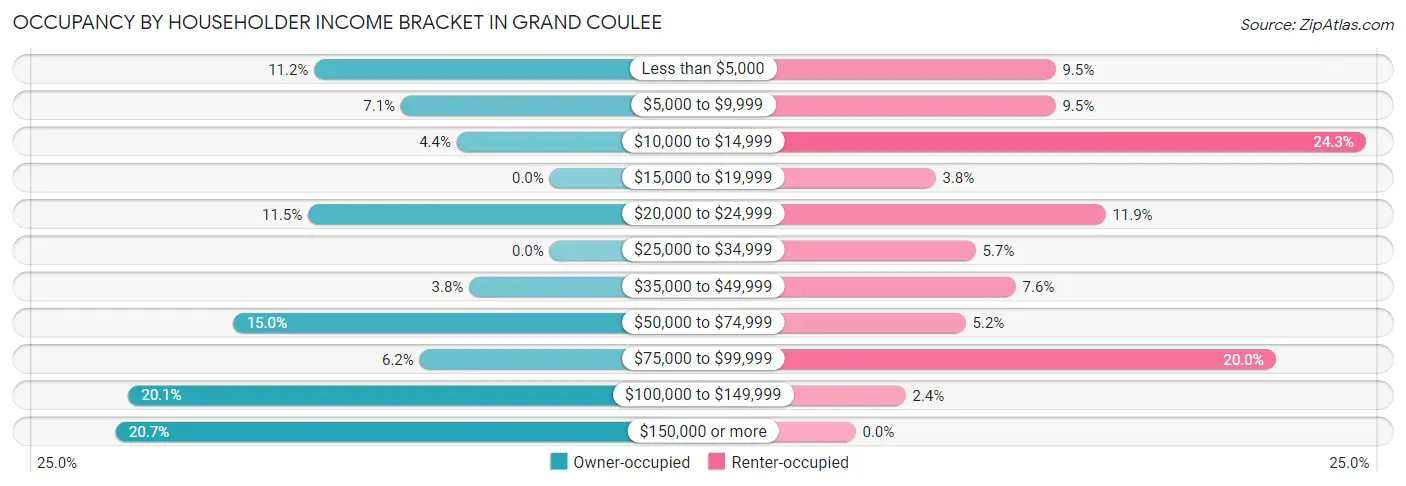
| Income Bracket | Owner-occupied | Renter-occupied |
| Less than $5,000 | 38 (11.2%) | 20 (9.5%) |
| $5,000 to $9,999 | 24 (7.1%) | 20 (9.5%) |
| $10,000 to $14,999 | 15 (4.4%) | 51 (24.3%) |
| $15,000 to $19,999 | 0 (0.0%) | 8 (3.8%) |
| $20,000 to $24,999 | 39 (11.5%) | 25 (11.9%) |
| $25,000 to $34,999 | 0 (0.0%) | 12 (5.7%) |
| $35,000 to $49,999 | 13 (3.8%) | 16 (7.6%) |
| $50,000 to $74,999 | 51 (15.0%) | 11 (5.2%) |
| $75,000 to $99,999 | 21 (6.2%) | 42 (20.0%) |
| $100,000 to $149,999 | 68 (20.1%) | 5 (2.4%) |
| $150,000 or more | 70 (20.6%) | 0 (0.0%) |
| Total | 339 (100.0%) | 210 (100.0%) |
Monthly Housing Cost Tiers in Grand Coulee
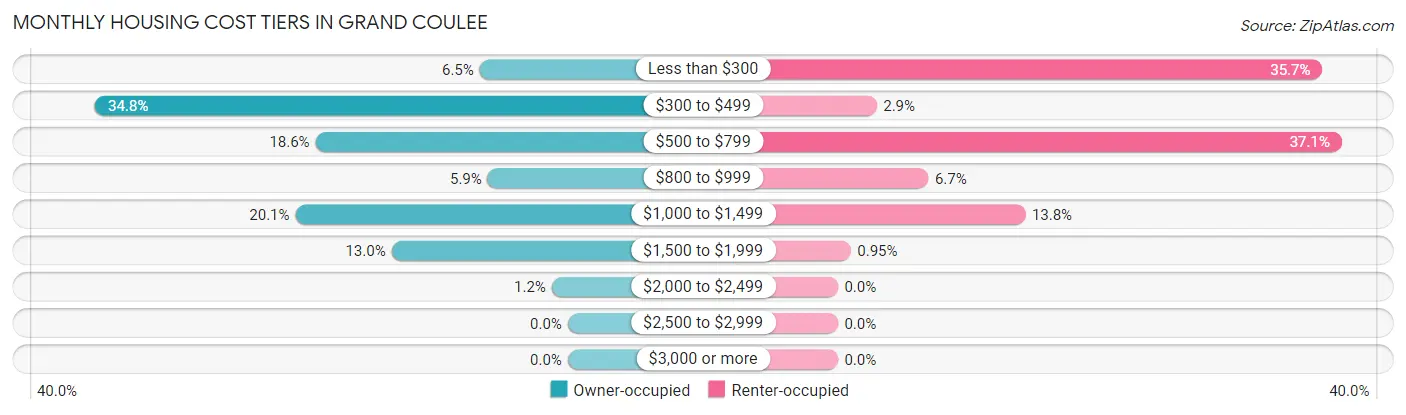
| Monthly Cost | Owner-occupied | Renter-occupied |
| Less than $300 | 22 (6.5%) | 75 (35.7%) |
| $300 to $499 | 118 (34.8%) | 6 (2.9%) |
| $500 to $799 | 63 (18.6%) | 78 (37.1%) |
| $800 to $999 | 20 (5.9%) | 14 (6.7%) |
| $1,000 to $1,499 | 68 (20.1%) | 29 (13.8%) |
| $1,500 to $1,999 | 44 (13.0%) | 2 (0.9%) |
| $2,000 to $2,499 | 4 (1.2%) | 0 (0.0%) |
| $2,500 to $2,999 | 0 (0.0%) | 0 (0.0%) |
| $3,000 or more | 0 (0.0%) | 0 (0.0%) |
| Total | 339 (100.0%) | 210 (100.0%) |
Physical Housing Characteristics in Grand Coulee
Housing Structures in Grand Coulee
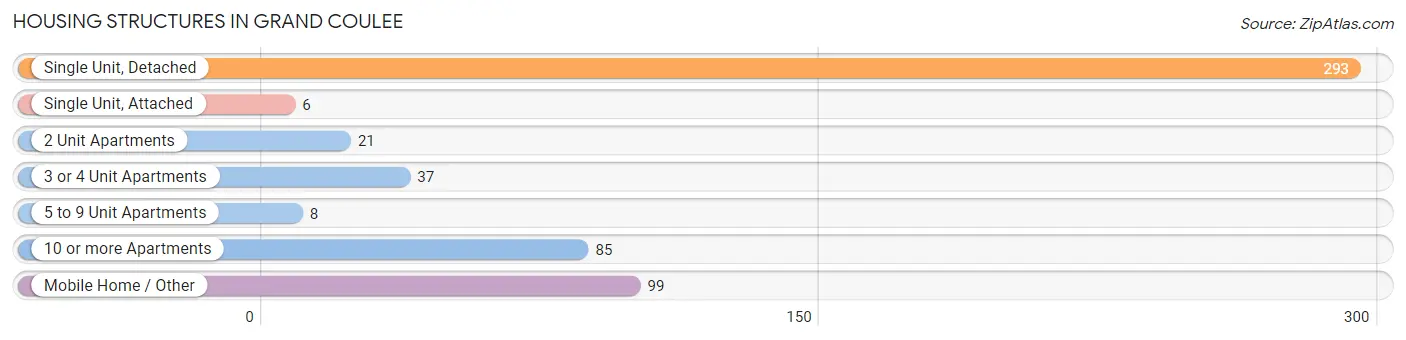
| Structure Type | # Housing Units | % Housing Units |
| Single Unit, Detached | 293 | 53.4% |
| Single Unit, Attached | 6 | 1.1% |
| 2 Unit Apartments | 21 | 3.8% |
| 3 or 4 Unit Apartments | 37 | 6.7% |
| 5 to 9 Unit Apartments | 8 | 1.5% |
| 10 or more Apartments | 85 | 15.5% |
| Mobile Home / Other | 99 | 18.0% |
| Total | 549 | 100.0% |
Housing Structures by Occupancy in Grand Coulee
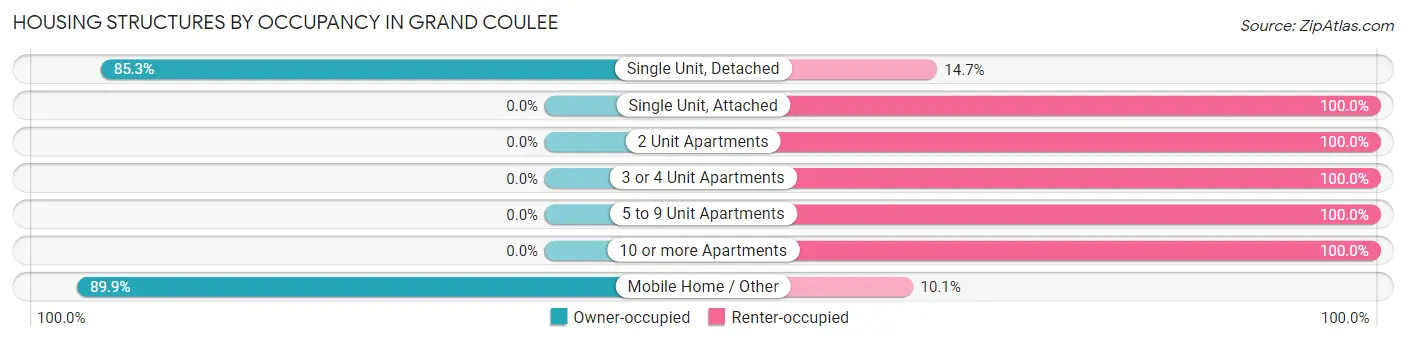
| Structure Type | Owner-occupied | Renter-occupied |
| Single Unit, Detached | 250 (85.3%) | 43 (14.7%) |
| Single Unit, Attached | 0 (0.0%) | 6 (100.0%) |
| 2 Unit Apartments | 0 (0.0%) | 21 (100.0%) |
| 3 or 4 Unit Apartments | 0 (0.0%) | 37 (100.0%) |
| 5 to 9 Unit Apartments | 0 (0.0%) | 8 (100.0%) |
| 10 or more Apartments | 0 (0.0%) | 85 (100.0%) |
| Mobile Home / Other | 89 (89.9%) | 10 (10.1%) |
| Total | 339 (61.8%) | 210 (38.3%) |
Housing Structures by Number of Rooms in Grand Coulee
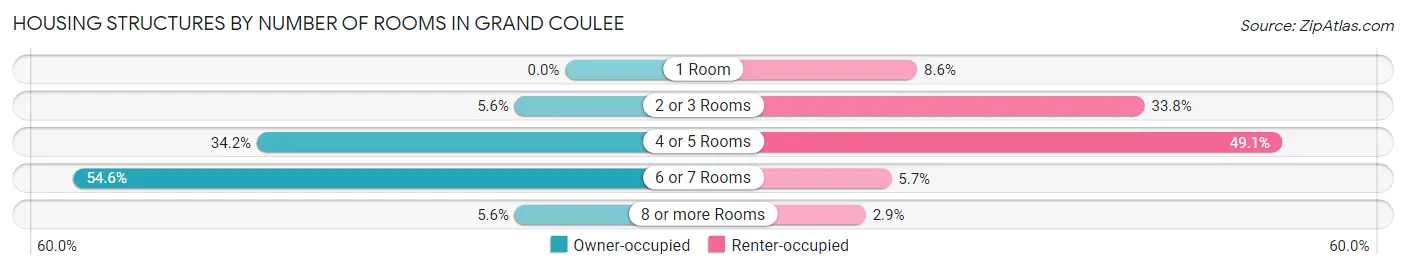
| Number of Rooms | Owner-occupied | Renter-occupied |
| 1 Room | 0 (0.0%) | 18 (8.6%) |
| 2 or 3 Rooms | 19 (5.6%) | 71 (33.8%) |
| 4 or 5 Rooms | 116 (34.2%) | 103 (49.0%) |
| 6 or 7 Rooms | 185 (54.6%) | 12 (5.7%) |
| 8 or more Rooms | 19 (5.6%) | 6 (2.9%) |
| Total | 339 (100.0%) | 210 (100.0%) |
Housing Structure by Heating Type in Grand Coulee
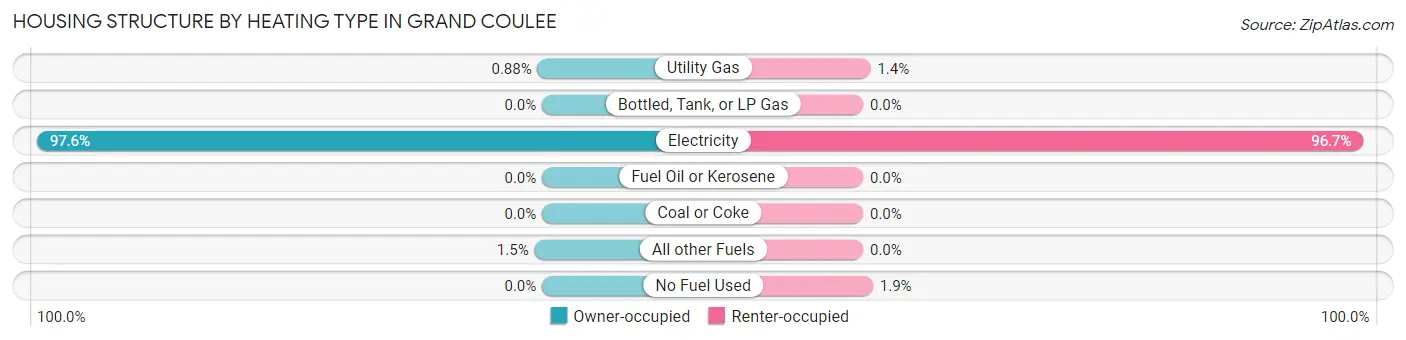
| Heating Type | Owner-occupied | Renter-occupied |
| Utility Gas | 3 (0.9%) | 3 (1.4%) |
| Bottled, Tank, or LP Gas | 0 (0.0%) | 0 (0.0%) |
| Electricity | 331 (97.6%) | 203 (96.7%) |
| Fuel Oil or Kerosene | 0 (0.0%) | 0 (0.0%) |
| Coal or Coke | 0 (0.0%) | 0 (0.0%) |
| All other Fuels | 5 (1.5%) | 0 (0.0%) |
| No Fuel Used | 0 (0.0%) | 4 (1.9%) |
| Total | 339 (100.0%) | 210 (100.0%) |
Household Vehicle Usage in Grand Coulee
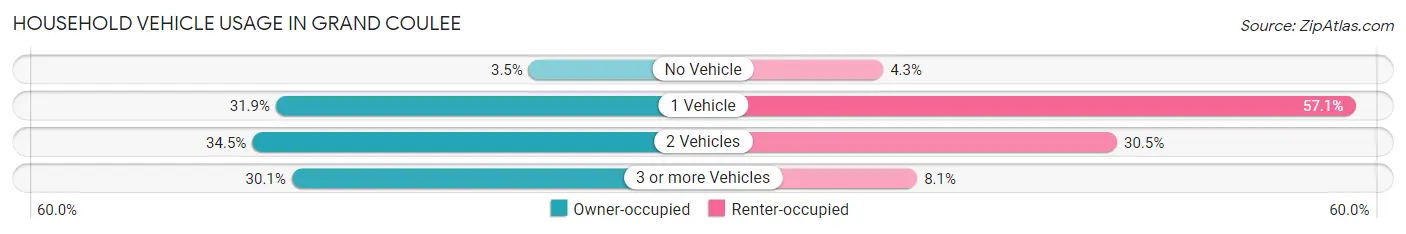
| Vehicles per Household | Owner-occupied | Renter-occupied |
| No Vehicle | 12 (3.5%) | 9 (4.3%) |
| 1 Vehicle | 108 (31.9%) | 120 (57.1%) |
| 2 Vehicles | 117 (34.5%) | 64 (30.5%) |
| 3 or more Vehicles | 102 (30.1%) | 17 (8.1%) |
| Total | 339 (100.0%) | 210 (100.0%) |
Real Estate & Mortgages in Grand Coulee
Real Estate and Mortgage Overview in Grand Coulee
| Characteristic | Without Mortgage | With Mortgage |
| Housing Units | 186 | 153 |
| Median Property Value | $142,300 | $225,500 |
| Median Household Income | - | - |
| Monthly Housing Costs | $398 | $0 |
| Real Estate Taxes | $1,391 | $5 |
Property Value by Mortgage Status in Grand Coulee
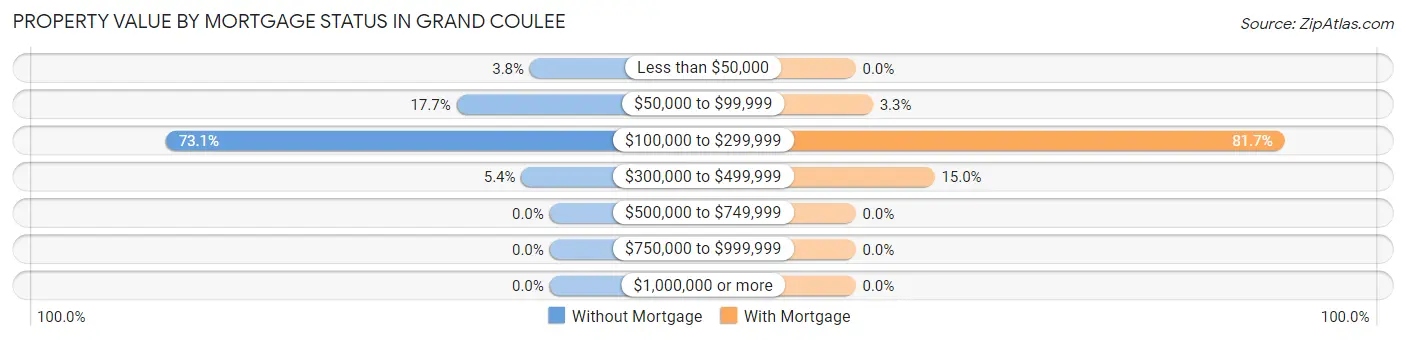
| Property Value | Without Mortgage | With Mortgage |
| Less than $50,000 | 7 (3.8%) | 0 (0.0%) |
| $50,000 to $99,999 | 33 (17.7%) | 5 (3.3%) |
| $100,000 to $299,999 | 136 (73.1%) | 125 (81.7%) |
| $300,000 to $499,999 | 10 (5.4%) | 23 (15.0%) |
| $500,000 to $749,999 | 0 (0.0%) | 0 (0.0%) |
| $750,000 to $999,999 | 0 (0.0%) | 0 (0.0%) |
| $1,000,000 or more | 0 (0.0%) | 0 (0.0%) |
| Total | 186 (100.0%) | 153 (100.0%) |
Household Income by Mortgage Status in Grand Coulee
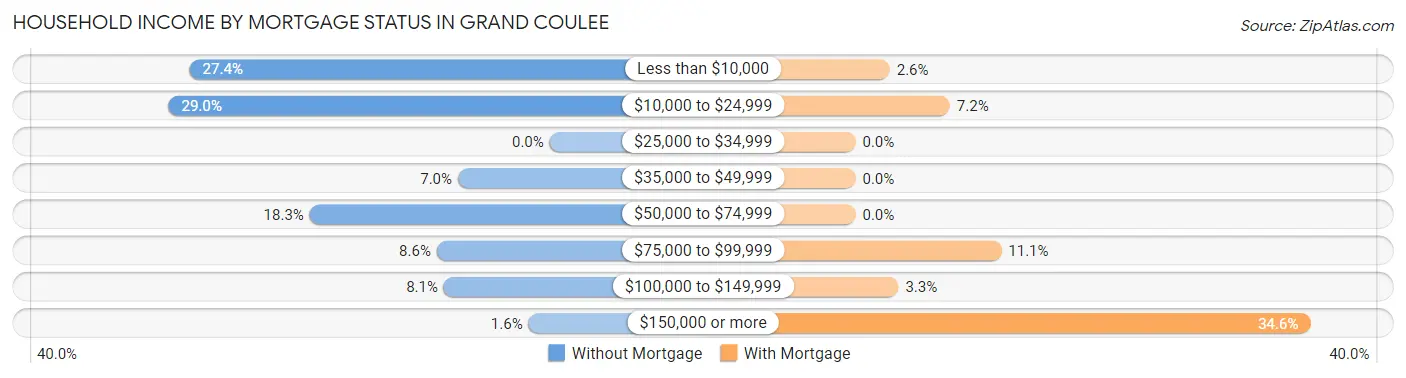
| Household Income | Without Mortgage | With Mortgage |
| Less than $10,000 | 51 (27.4%) | 4 (2.6%) |
| $10,000 to $24,999 | 54 (29.0%) | 11 (7.2%) |
| $25,000 to $34,999 | 0 (0.0%) | 0 (0.0%) |
| $35,000 to $49,999 | 13 (7.0%) | 0 (0.0%) |
| $50,000 to $74,999 | 34 (18.3%) | 0 (0.0%) |
| $75,000 to $99,999 | 16 (8.6%) | 17 (11.1%) |
| $100,000 to $149,999 | 15 (8.1%) | 5 (3.3%) |
| $150,000 or more | 3 (1.6%) | 53 (34.6%) |
| Total | 186 (100.0%) | 153 (100.0%) |
Property Value to Household Income Ratio in Grand Coulee
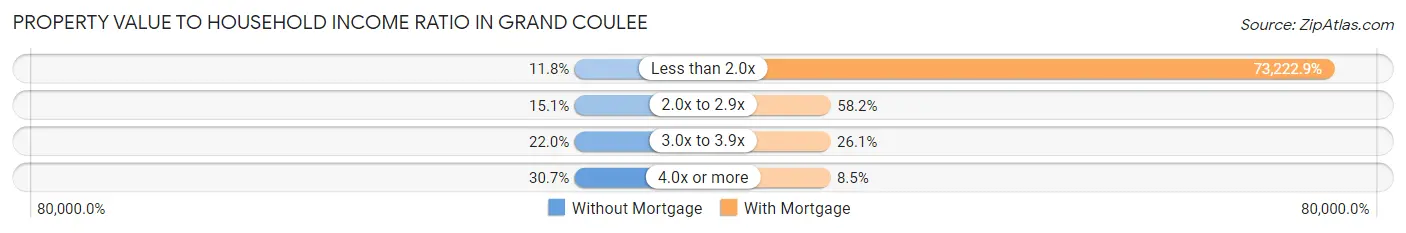
| Value-to-Income Ratio | Without Mortgage | With Mortgage |
| Less than 2.0x | 22 (11.8%) | 112,031 (73,222.9%) |
| 2.0x to 2.9x | 28 (15.0%) | 89 (58.2%) |
| 3.0x to 3.9x | 41 (22.0%) | 40 (26.1%) |
| 4.0x or more | 57 (30.6%) | 13 (8.5%) |
| Total | 186 (100.0%) | 153 (100.0%) |
Real Estate Taxes by Mortgage Status in Grand Coulee
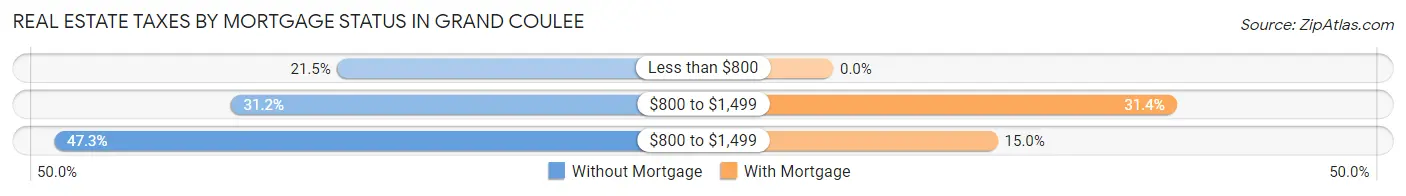
| Property Taxes | Without Mortgage | With Mortgage |
| Less than $800 | 40 (21.5%) | 0 (0.0%) |
| $800 to $1,499 | 58 (31.2%) | 48 (31.4%) |
| $800 to $1,499 | 88 (47.3%) | 23 (15.0%) |
| Total | 186 (100.0%) | 153 (100.0%) |
Health & Disability in Grand Coulee
Health Insurance Coverage by Age in Grand Coulee
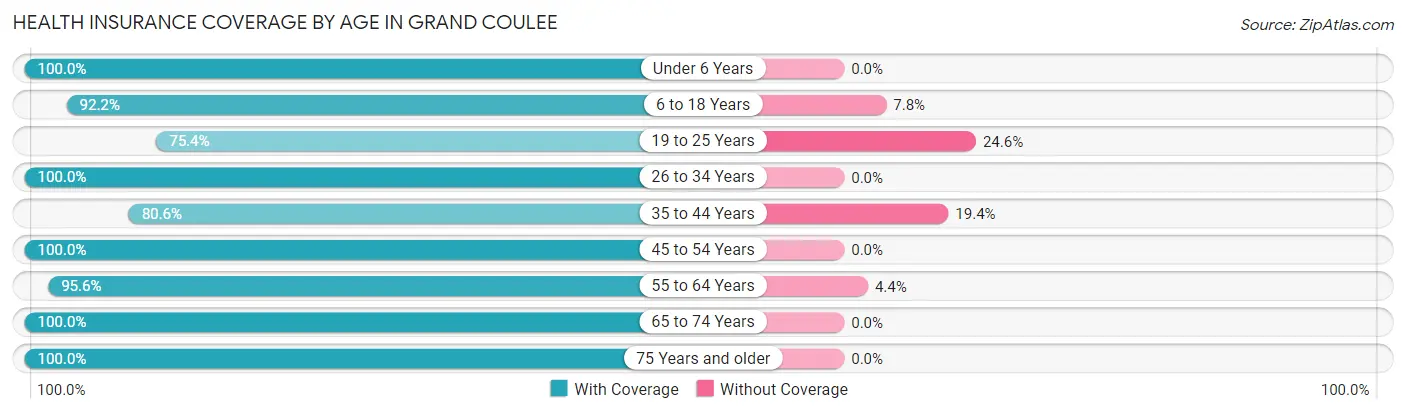
| Age Bracket | With Coverage | Without Coverage |
| Under 6 Years | 18 (100.0%) | 0 (0.0%) |
| 6 to 18 Years | 94 (92.2%) | 8 (7.8%) |
| 19 to 25 Years | 86 (75.4%) | 28 (24.6%) |
| 26 to 34 Years | 86 (100.0%) | 0 (0.0%) |
| 35 to 44 Years | 83 (80.6%) | 20 (19.4%) |
| 45 to 54 Years | 120 (100.0%) | 0 (0.0%) |
| 55 to 64 Years | 195 (95.6%) | 9 (4.4%) |
| 65 to 74 Years | 149 (100.0%) | 0 (0.0%) |
| 75 Years and older | 117 (100.0%) | 0 (0.0%) |
| Total | 948 (93.6%) | 65 (6.4%) |
Health Insurance Coverage by Citizenship Status in Grand Coulee
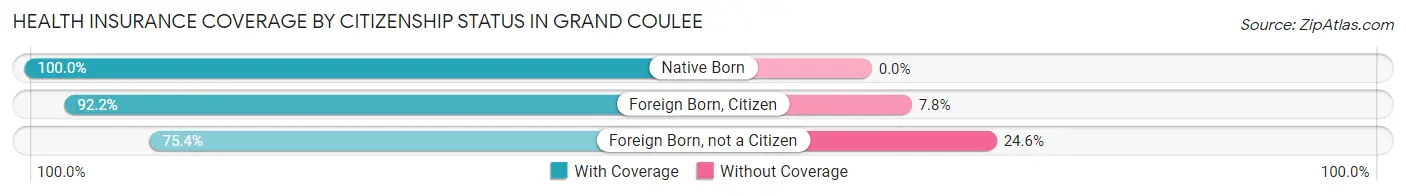
| Citizenship Status | With Coverage | Without Coverage |
| Native Born | 18 (100.0%) | 0 (0.0%) |
| Foreign Born, Citizen | 94 (92.2%) | 8 (7.8%) |
| Foreign Born, not a Citizen | 86 (75.4%) | 28 (24.6%) |
Health Insurance Coverage by Household Income in Grand Coulee
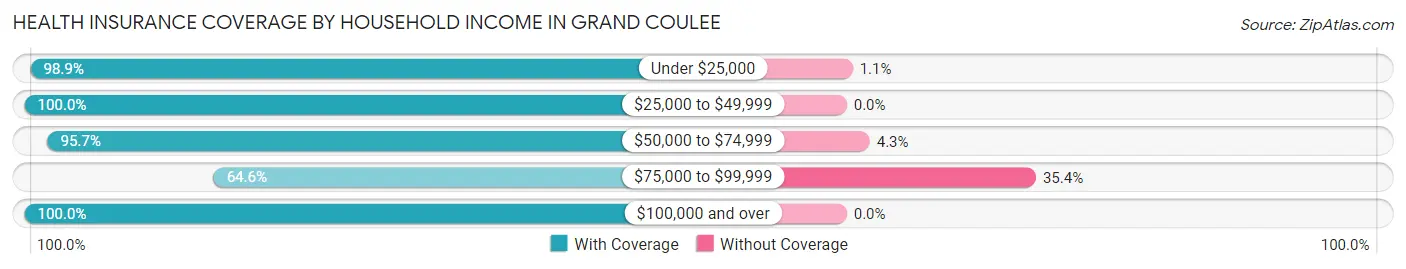
| Household Income | With Coverage | Without Coverage |
| Under $25,000 | 357 (98.9%) | 4 (1.1%) |
| $25,000 to $49,999 | 72 (100.0%) | 0 (0.0%) |
| $50,000 to $74,999 | 111 (95.7%) | 5 (4.3%) |
| $75,000 to $99,999 | 102 (64.6%) | 56 (35.4%) |
| $100,000 and over | 301 (100.0%) | 0 (0.0%) |
Public vs Private Health Insurance Coverage by Age in Grand Coulee
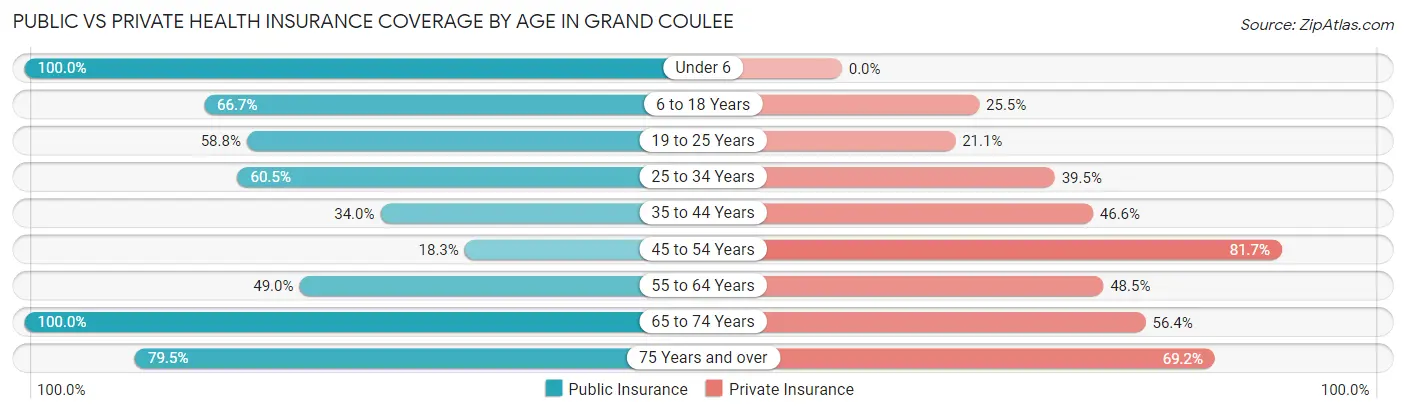
| Age Bracket | Public Insurance | Private Insurance |
| Under 6 | 18 (100.0%) | 0 (0.0%) |
| 6 to 18 Years | 68 (66.7%) | 26 (25.5%) |
| 19 to 25 Years | 67 (58.8%) | 24 (21.0%) |
| 25 to 34 Years | 52 (60.5%) | 34 (39.5%) |
| 35 to 44 Years | 35 (34.0%) | 48 (46.6%) |
| 45 to 54 Years | 22 (18.3%) | 98 (81.7%) |
| 55 to 64 Years | 100 (49.0%) | 99 (48.5%) |
| 65 to 74 Years | 149 (100.0%) | 84 (56.4%) |
| 75 Years and over | 93 (79.5%) | 81 (69.2%) |
| Total | 604 (59.6%) | 494 (48.8%) |
Disability Status by Sex by Age in Grand Coulee
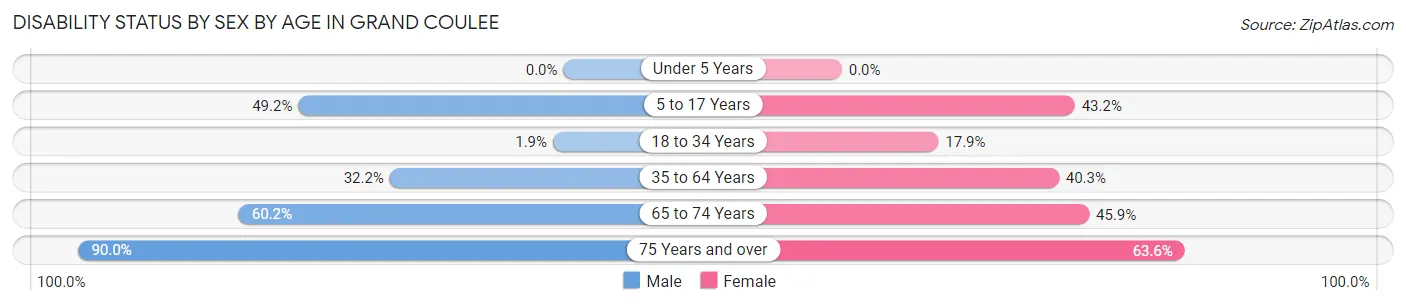
| Age Bracket | Male | Female |
| Under 5 Years | 0 (0.0%) | 0 (0.0%) |
| 5 to 17 Years | 31 (49.2%) | 16 (43.2%) |
| 18 to 34 Years | 2 (1.9%) | 19 (17.9%) |
| 35 to 64 Years | 68 (32.2%) | 87 (40.3%) |
| 65 to 74 Years | 53 (60.2%) | 28 (45.9%) |
| 75 Years and over | 36 (90.0%) | 49 (63.6%) |
Disability Class by Sex by Age in Grand Coulee
Disability Class: Hearing Difficulty
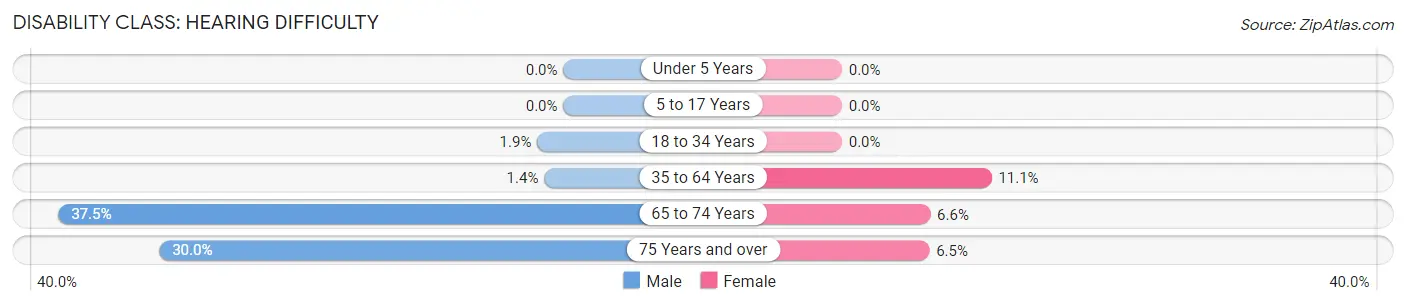
| Age Bracket | Male | Female |
| Under 5 Years | 0 (0.0%) | 0 (0.0%) |
| 5 to 17 Years | 0 (0.0%) | 0 (0.0%) |
| 18 to 34 Years | 2 (1.9%) | 0 (0.0%) |
| 35 to 64 Years | 3 (1.4%) | 24 (11.1%) |
| 65 to 74 Years | 33 (37.5%) | 4 (6.6%) |
| 75 Years and over | 12 (30.0%) | 5 (6.5%) |
Disability Class: Vision Difficulty
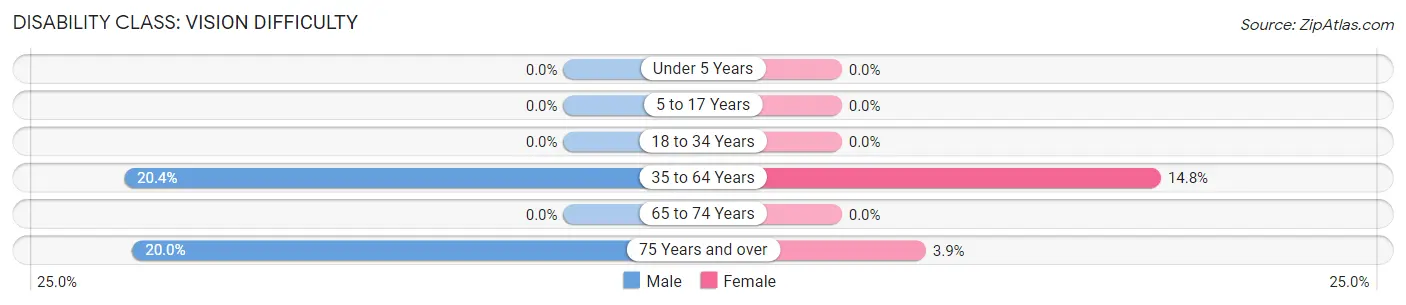
| Age Bracket | Male | Female |
| Under 5 Years | 0 (0.0%) | 0 (0.0%) |
| 5 to 17 Years | 0 (0.0%) | 0 (0.0%) |
| 18 to 34 Years | 0 (0.0%) | 0 (0.0%) |
| 35 to 64 Years | 43 (20.4%) | 32 (14.8%) |
| 65 to 74 Years | 0 (0.0%) | 0 (0.0%) |
| 75 Years and over | 8 (20.0%) | 3 (3.9%) |
Disability Class: Cognitive Difficulty
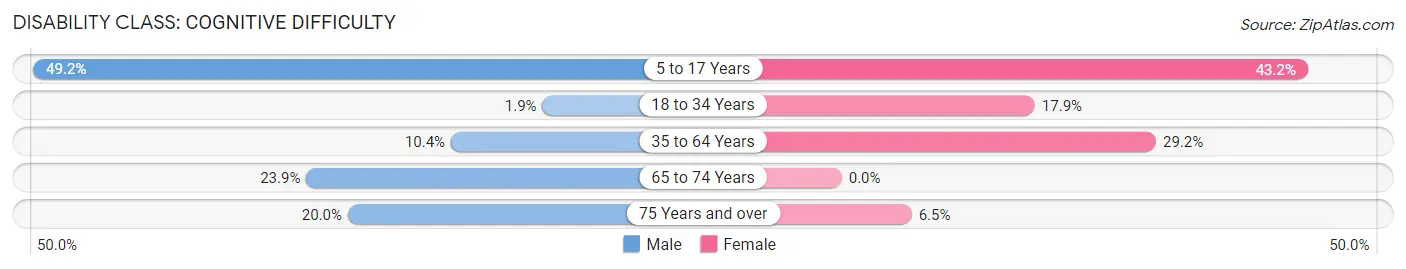
| Age Bracket | Male | Female |
| 5 to 17 Years | 31 (49.2%) | 16 (43.2%) |
| 18 to 34 Years | 2 (1.9%) | 19 (17.9%) |
| 35 to 64 Years | 22 (10.4%) | 63 (29.2%) |
| 65 to 74 Years | 21 (23.9%) | 0 (0.0%) |
| 75 Years and over | 8 (20.0%) | 5 (6.5%) |
Disability Class: Ambulatory Difficulty
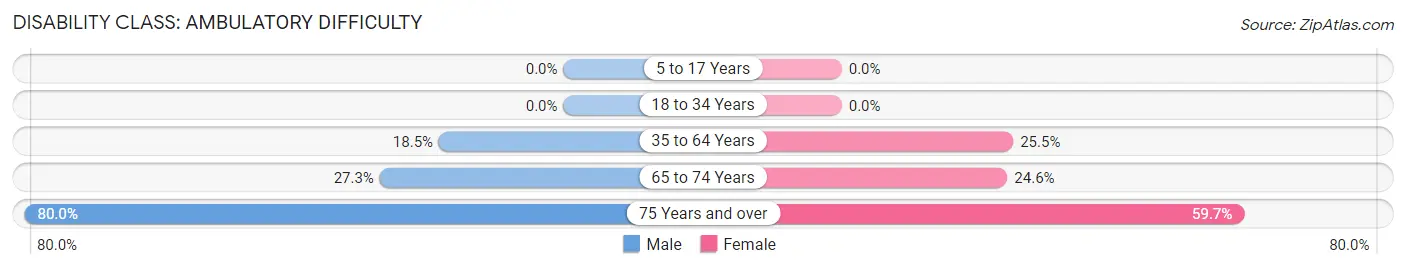
| Age Bracket | Male | Female |
| 5 to 17 Years | 0 (0.0%) | 0 (0.0%) |
| 18 to 34 Years | 0 (0.0%) | 0 (0.0%) |
| 35 to 64 Years | 39 (18.5%) | 55 (25.5%) |
| 65 to 74 Years | 24 (27.3%) | 15 (24.6%) |
| 75 Years and over | 32 (80.0%) | 46 (59.7%) |
Disability Class: Self-Care Difficulty
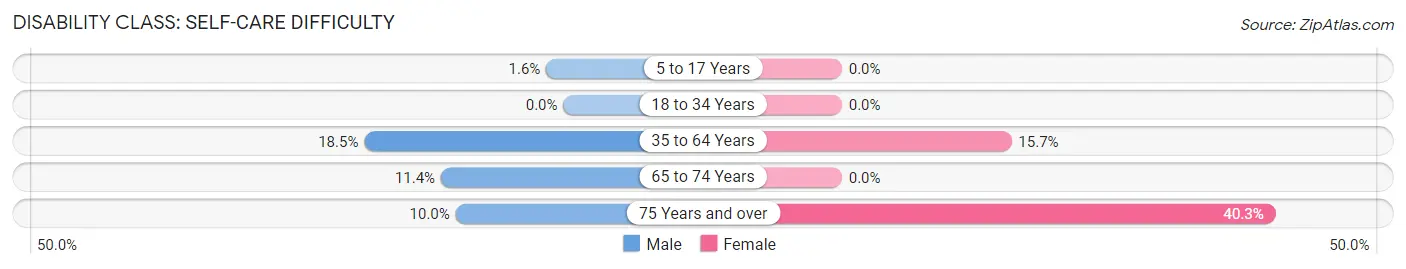
| Age Bracket | Male | Female |
| 5 to 17 Years | 1 (1.6%) | 0 (0.0%) |
| 18 to 34 Years | 0 (0.0%) | 0 (0.0%) |
| 35 to 64 Years | 39 (18.5%) | 34 (15.7%) |
| 65 to 74 Years | 10 (11.4%) | 0 (0.0%) |
| 75 Years and over | 4 (10.0%) | 31 (40.3%) |
Technology Access in Grand Coulee
Computing Device Access in Grand Coulee
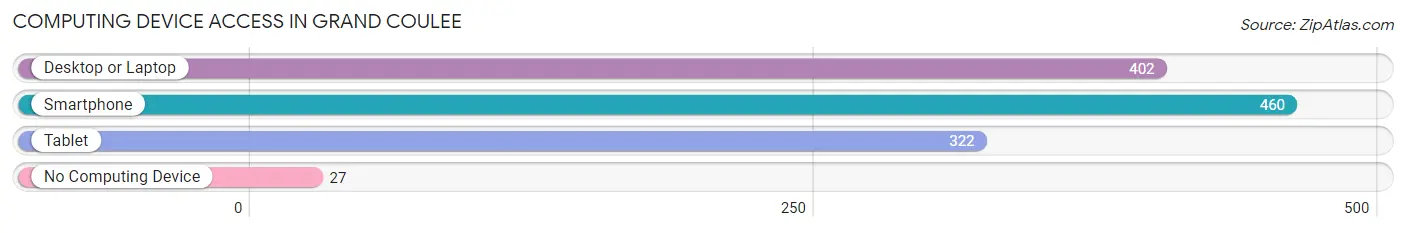
| Device Type | # Households | % Households |
| Desktop or Laptop | 402 | 73.2% |
| Smartphone | 460 | 83.8% |
| Tablet | 322 | 58.7% |
| No Computing Device | 27 | 4.9% |
| Total | 549 | 100.0% |
Internet Access in Grand Coulee
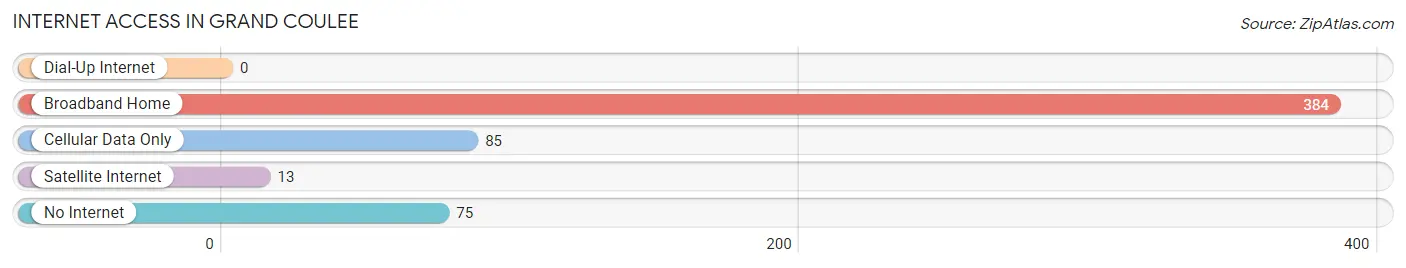
| Internet Type | # Households | % Households |
| Dial-Up Internet | 0 | 0.0% |
| Broadband Home | 384 | 70.0% |
| Cellular Data Only | 85 | 15.5% |
| Satellite Internet | 13 | 2.4% |
| No Internet | 75 | 13.7% |
| Total | 549 | 100.0% |
Grand Coulee Summary
Grand Coulee, Washington is a small town located in the northeastern corner of the state, near the border with Canada. It is situated in the Columbia River Valley, and is surrounded by the Grand Coulee Dam, the largest hydroelectric dam in the United States. The town has a population of about 1,000 people, and is the home of the Grand Coulee Dam Visitor Center.
History
Grand Coulee was first settled in the late 1800s by homesteaders who were attracted to the area by the abundance of water and the potential for hydroelectric power. The town was officially incorporated in 1909, and the Grand Coulee Dam was completed in 1941. The dam was built to provide irrigation for the surrounding area, and to generate hydroelectric power. The dam was also used to control flooding in the Columbia River Valley.
The town of Grand Coulee has been shaped by the presence of the dam. The town has grown and changed over the years, but the dam has remained a constant presence. The town has become a popular tourist destination, and the Grand Coulee Dam Visitor Center is a popular attraction.
Geography
Grand Coulee is located in the northeastern corner of Washington, near the border with Canada. The town is situated in the Columbia River Valley, and is surrounded by the Grand Coulee Dam. The town is located at an elevation of 1,890 feet, and has a total area of 1.2 square miles.
The climate in Grand Coulee is semi-arid, with hot summers and cold winters. The average annual temperature is around 50 degrees Fahrenheit, and the average annual precipitation is around 10 inches.
Economy
The economy of Grand Coulee is largely based on tourism and the hydroelectric power generated by the Grand Coulee Dam. The town is home to the Grand Coulee Dam Visitor Center, which attracts thousands of visitors each year. The town also has a number of small businesses, including restaurants, shops, and lodging.
The town is also home to a number of agricultural operations, including fruit and vegetable farms, and cattle ranches. The town is also home to a number of manufacturing operations, including a wood products plant and a concrete plant.
Demographics
As of the 2010 census, the population of Grand Coulee was 1,042. The racial makeup of the town was 94.3% White, 0.7% African American, 0.7% Native American, 0.3% Asian, 0.1% Pacific Islander, and 3.0% from other races. The median household income was $35,938, and the median family income was $41,250.
The town has a large number of retirees, and the median age of the population is 47. The town also has a large number of families, and the median age of the population is 33. The town has a high rate of homeownership, with over 70% of the population owning their own homes.
Common Questions
What is Per Capita Income in Grand Coulee?
Per Capita income in Grand Coulee is $32,462.
What is the Median Family Income in Grand Coulee?
Median Family Income in Grand Coulee is $86,042.
What is the Median Household income in Grand Coulee?
Median Household Income in Grand Coulee is $47,361.
What is Income or Wage Gap in Grand Coulee?
Income or Wage Gap in Grand Coulee is 64.2%.
Women in Grand Coulee earn 35.8 cents for every dollar earned by a man.
What is Inequality or Gini Index in Grand Coulee?
Inequality or Gini Index in Grand Coulee is 0.54.
What is the Total Population of Grand Coulee?
Total Population of Grand Coulee is 1,034.
What is the Total Male Population of Grand Coulee?
Total Male Population of Grand Coulee is 537.
What is the Total Female Population of Grand Coulee?
Total Female Population of Grand Coulee is 497.
What is the Ratio of Males per 100 Females in Grand Coulee?
There are 108.05 Males per 100 Females in Grand Coulee.
What is the Ratio of Females per 100 Males in Grand Coulee?
There are 92.55 Females per 100 Males in Grand Coulee.
What is the Median Population Age in Grand Coulee?
Median Population Age in Grand Coulee is 53.8 Years.
What is the Average Family Size in Grand Coulee
Average Family Size in Grand Coulee is 2.4 People.
What is the Average Household Size in Grand Coulee
Average Household Size in Grand Coulee is 1.8 People.
How Large is the Labor Force in Grand Coulee?
There are 417 People in the Labor Forcein in Grand Coulee.
What is the Percentage of People in the Labor Force in Grand Coulee?
43.9% of People are in the Labor Force in Grand Coulee.
What is the Unemployment Rate in Grand Coulee?
Unemployment Rate in Grand Coulee is 12.7%.