Mabton, WA Map & Demographics
Mabton Map
Mabton Overview
$16,478
PER CAPITA INCOME
$50,694
AVG FAMILY INCOME
$50,000
AVG HOUSEHOLD INCOME
18.4%
WAGE / INCOME GAP [ % ]
81.6¢/ $1
WAGE / INCOME GAP [ $ ]
0.41
INEQUALITY / GINI INDEX
2,314
TOTAL POPULATION
1,175
MALE POPULATION
1,139
FEMALE POPULATION
103.16
MALES / 100 FEMALES
96.94
FEMALES / 100 MALES
24.3
MEDIAN AGE
4.2
AVG FAMILY SIZE
4.1
AVG HOUSEHOLD SIZE
1,046
LABOR FORCE [ PEOPLE ]
67.6%
PERCENT IN LABOR FORCE
9.6%
UNEMPLOYMENT RATE
Mabton Zip Codes
Mabton Area Codes
Income in Mabton
Income Overview in Mabton
Per Capita Income in Mabton is $16,478, while median incomes of families and households are $50,694 and $50,000 respectively.
| Characteristic | Number | Measure |
| Per Capita Income | 2,314 | $16,478 |
| Median Family Income | 505 | $50,694 |
| Mean Family Income | 505 | $66,912 |
| Median Household Income | 568 | $50,000 |
| Mean Household Income | 568 | $67,061 |
| Income Deficit | 505 | $0 |
| Wage / Income Gap (%) | 2,314 | 18.37% |
| Wage / Income Gap ($) | 2,314 | 81.63¢ per $1 |
| Gini / Inequality Index | 2,314 | 0.41 |
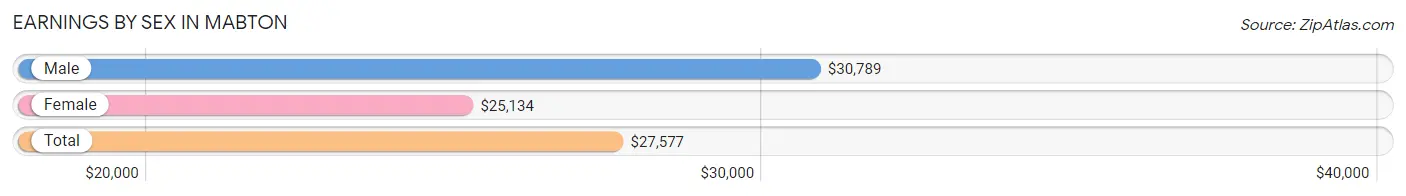
Earnings by Sex in Mabton
Average Earnings in Mabton are $27,577, $30,789 for men and $25,134 for women, a difference of 18.4%.
| Sex | Number | Average Earnings |
| Male | 600 (54.9%) | $30,789 |
| Female | 493 (45.1%) | $25,134 |
| Total | 1,093 (100.0%) | $27,577 |
Earnings by Sex by Income Bracket in Mabton
The most common earnings brackets in Mabton are $30,000 to $34,999 for men (92 | 15.3%) and $30,000 to $34,999 for women (72 | 14.6%).
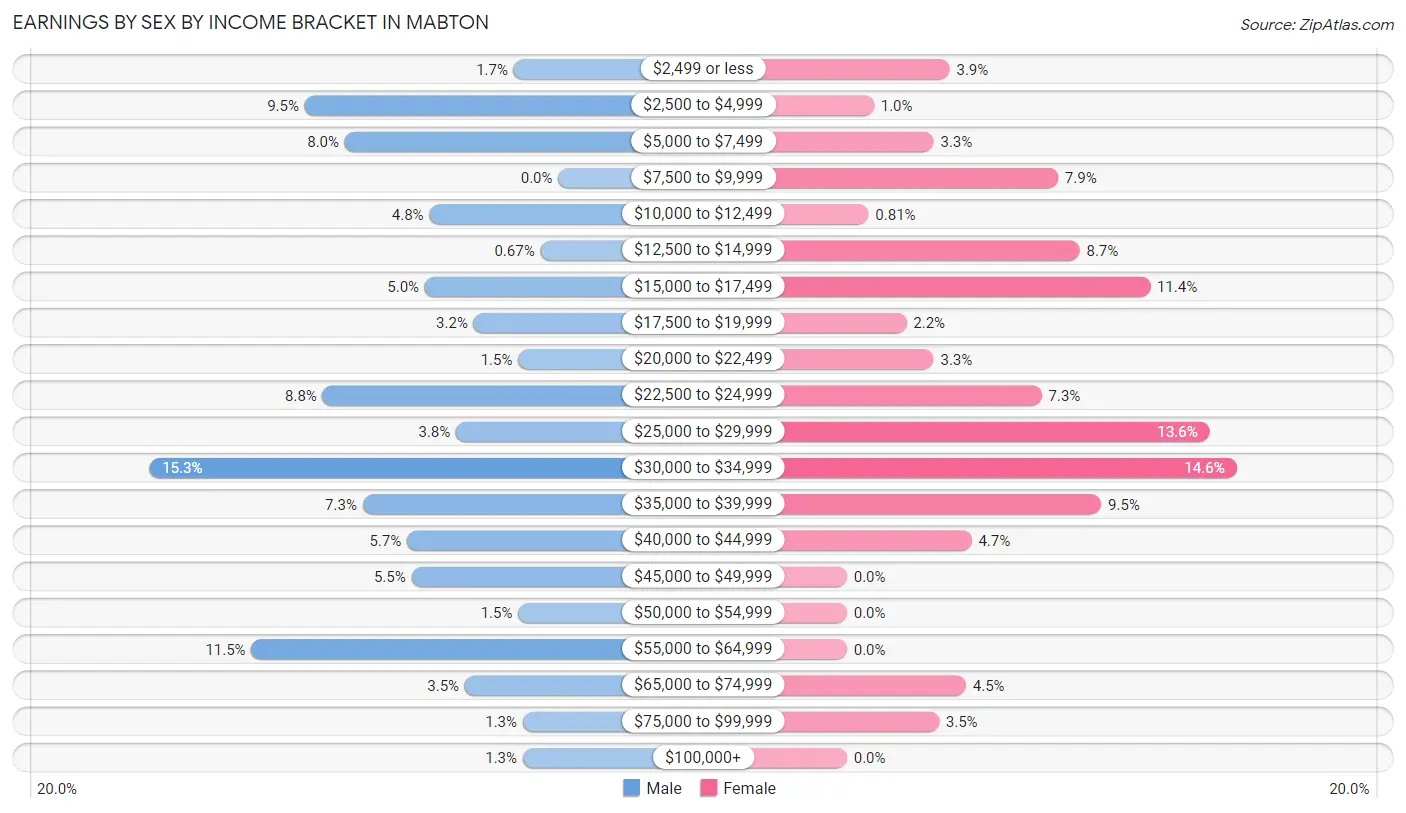
| Income | Male | Female |
| $2,499 or less | 10 (1.7%) | 19 (3.8%) |
| $2,500 to $4,999 | 57 (9.5%) | 5 (1.0%) |
| $5,000 to $7,499 | 48 (8.0%) | 16 (3.3%) |
| $7,500 to $9,999 | 0 (0.0%) | 39 (7.9%) |
| $10,000 to $12,499 | 29 (4.8%) | 4 (0.8%) |
| $12,500 to $14,999 | 4 (0.7%) | 43 (8.7%) |
| $15,000 to $17,499 | 30 (5.0%) | 56 (11.4%) |
| $17,500 to $19,999 | 19 (3.2%) | 11 (2.2%) |
| $20,000 to $22,499 | 9 (1.5%) | 16 (3.3%) |
| $22,500 to $24,999 | 53 (8.8%) | 36 (7.3%) |
| $25,000 to $29,999 | 23 (3.8%) | 67 (13.6%) |
| $30,000 to $34,999 | 92 (15.3%) | 72 (14.6%) |
| $35,000 to $39,999 | 44 (7.3%) | 47 (9.5%) |
| $40,000 to $44,999 | 34 (5.7%) | 23 (4.7%) |
| $45,000 to $49,999 | 33 (5.5%) | 0 (0.0%) |
| $50,000 to $54,999 | 9 (1.5%) | 0 (0.0%) |
| $55,000 to $64,999 | 69 (11.5%) | 0 (0.0%) |
| $65,000 to $74,999 | 21 (3.5%) | 22 (4.5%) |
| $75,000 to $99,999 | 8 (1.3%) | 17 (3.5%) |
| $100,000+ | 8 (1.3%) | 0 (0.0%) |
| Total | 600 (100.0%) | 493 (100.0%) |
Earnings by Sex by Educational Attainment in Mabton
Average earnings in Mabton are $35,682 for men and $27,564 for women, a difference of 22.8%. Men with an educational attainment of college or associate's degree enjoy the highest average annual earnings of $57,875, while those with less than high school education earn the least with $33,429. Women with an educational attainment of high school diploma earn the most with the average annual earnings of $30,288, while those with college or associate's degree education have the smallest earnings of $24,545.
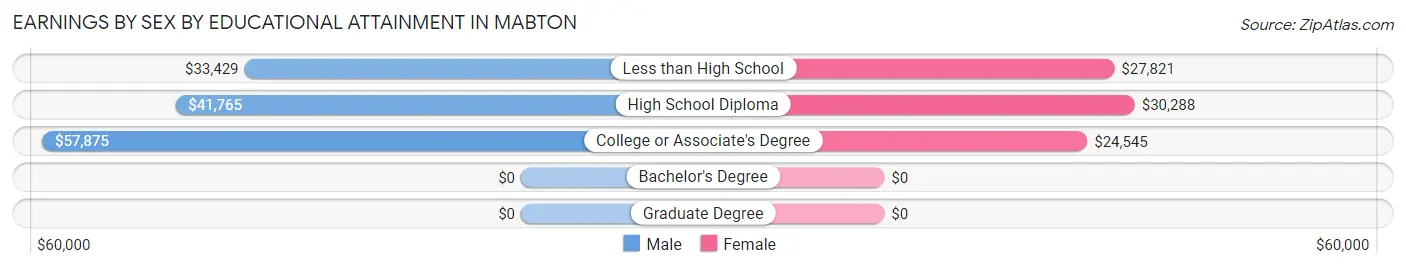
| Educational Attainment | Male Income | Female Income |
| Less than High School | $33,429 | $27,821 |
| High School Diploma | $41,765 | $30,288 |
| College or Associate's Degree | $57,875 | $24,545 |
| Bachelor's Degree | - | - |
| Graduate Degree | - | - |
| Total | $35,682 | $27,564 |
Family Income in Mabton
Family Income Brackets in Mabton
According to the Mabton family income data, there are 89 families falling into the $75,000 to $99,999 income range, which is the most common income bracket and makes up 17.6% of all families. Conversely, the $150,000 to $199,999 income bracket is the least frequent group with only 9 families (1.8%) belonging to this category.
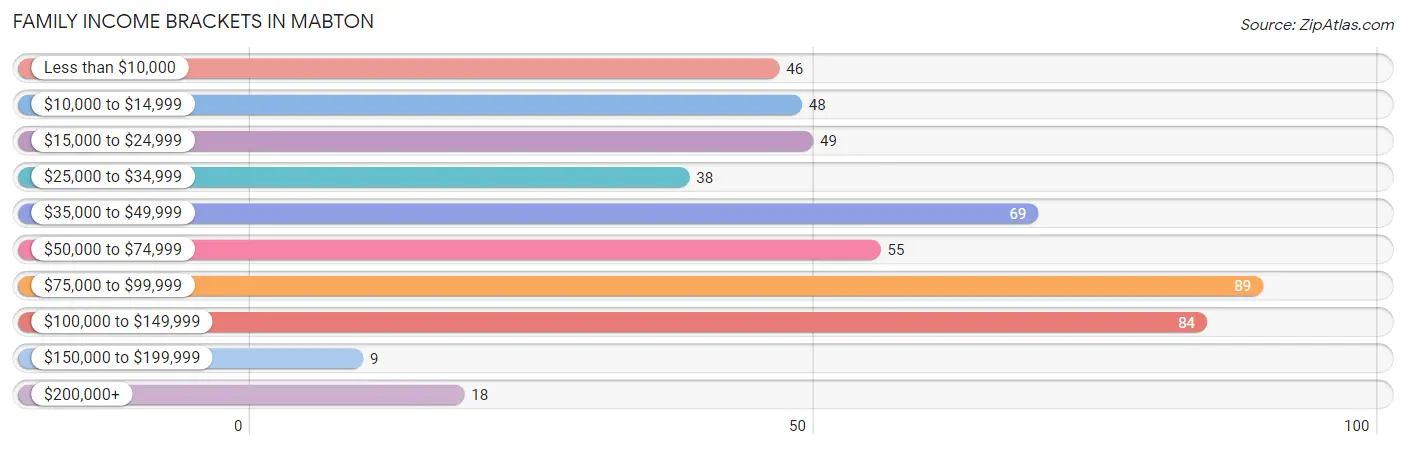
| Income Bracket | # Families | % Families |
| Less than $10,000 | 46 | 9.1% |
| $10,000 to $14,999 | 48 | 9.5% |
| $15,000 to $24,999 | 49 | 9.7% |
| $25,000 to $34,999 | 38 | 7.5% |
| $35,000 to $49,999 | 69 | 13.7% |
| $50,000 to $74,999 | 55 | 10.9% |
| $75,000 to $99,999 | 89 | 17.6% |
| $100,000 to $149,999 | 84 | 16.6% |
| $150,000 to $199,999 | 9 | 1.8% |
| $200,000+ | 18 | 3.6% |
Family Income by Famaliy Size in Mabton
4-person families (102 | 20.2%) account for the highest median family income in Mabton with $81,250 per family, while 4-person families (102 | 20.2%) have the highest median income of $20,312 per family member.
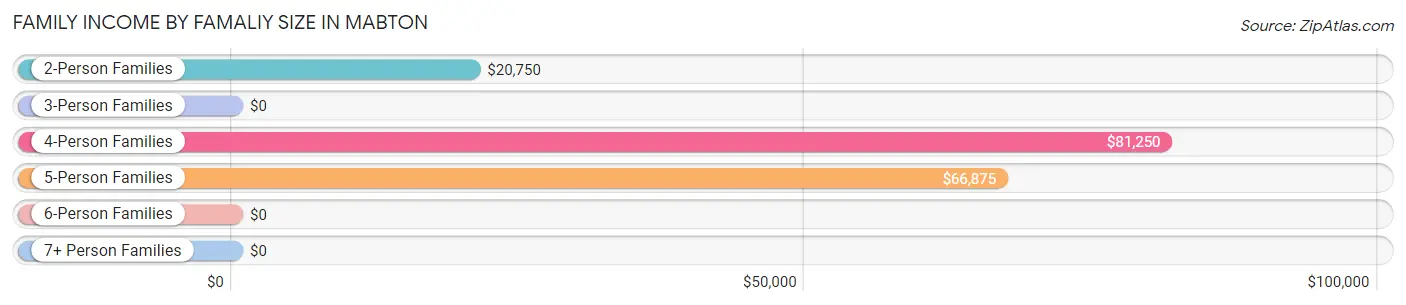
| Income Bracket | # Families | Median Income |
| 2-Person Families | 129 (25.5%) | $20,750 |
| 3-Person Families | 95 (18.8%) | $0 |
| 4-Person Families | 102 (20.2%) | $81,250 |
| 5-Person Families | 96 (19.0%) | $66,875 |
| 6-Person Families | 50 (9.9%) | $0 |
| 7+ Person Families | 33 (6.5%) | $0 |
| Total | 505 (100.0%) | $50,694 |
Family Income by Number of Earners in Mabton
The median family income in Mabton is $50,694, with families comprising 3+ earners (163) having the highest median family income of $105,469, while families with no earners (78) have the lowest median family income of $10,750, accounting for 32.3% and 15.4% of families, respectively.
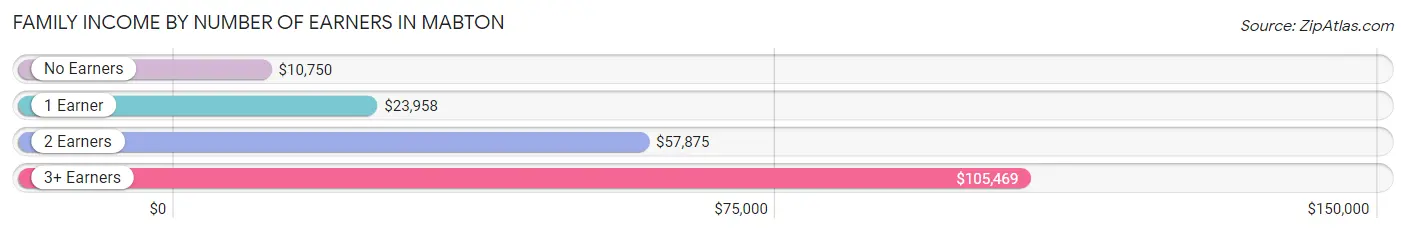
| Number of Earners | # Families | Median Income |
| No Earners | 78 (15.4%) | $10,750 |
| 1 Earner | 143 (28.3%) | $23,958 |
| 2 Earners | 121 (24.0%) | $57,875 |
| 3+ Earners | 163 (32.3%) | $105,469 |
| Total | 505 (100.0%) | $50,694 |
Household Income in Mabton
Household Income Brackets in Mabton
With 113 households falling in the category, the $15,000 to $24,999 income range is the most frequent in Mabton, accounting for 19.9% of all households. In contrast, only 9 households (1.6%) fall into the $150,000 to $199,999 income bracket, making it the least populous group.
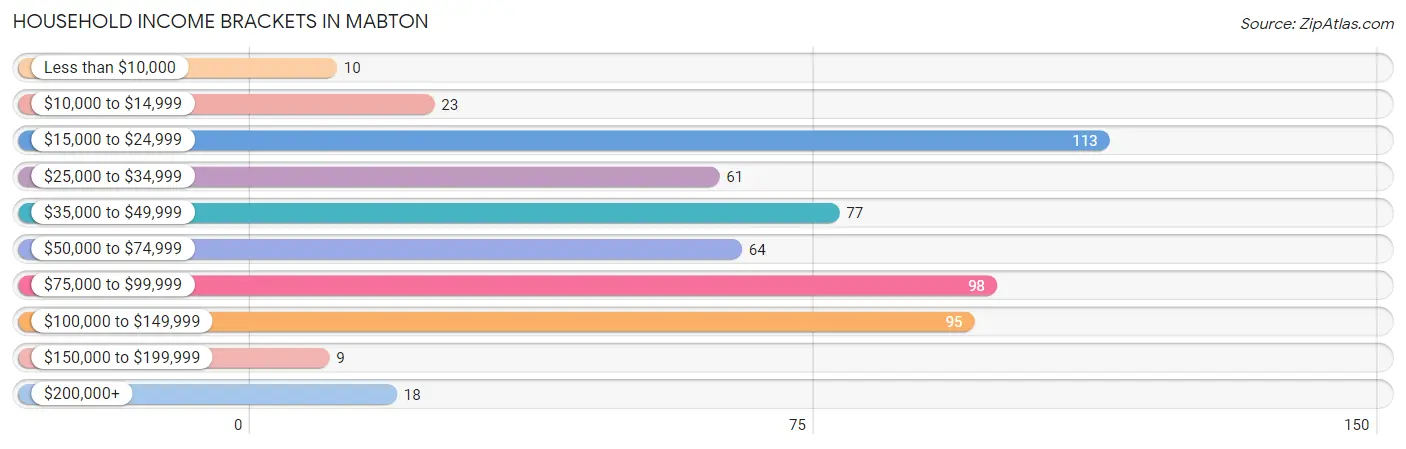
| Income Bracket | # Households | % Households |
| Less than $10,000 | 10 | 1.8% |
| $10,000 to $14,999 | 23 | 4.0% |
| $15,000 to $24,999 | 113 | 19.9% |
| $25,000 to $34,999 | 61 | 10.7% |
| $35,000 to $49,999 | 77 | 13.6% |
| $50,000 to $74,999 | 64 | 11.3% |
| $75,000 to $99,999 | 98 | 17.3% |
| $100,000 to $149,999 | 95 | 16.7% |
| $150,000 to $199,999 | 9 | 1.6% |
| $200,000+ | 18 | 3.2% |
Household Income by Householder Age in Mabton
The median household income in Mabton is $50,000, with the highest median household income of $67,625 found in the 45 to 64 years age bracket for the primary householder. A total of 169 households (29.7%) fall into this category. Meanwhile, the 15 to 24 years age bracket for the primary householder has the lowest median household income of $0, with 77 households (13.6%) in this group.
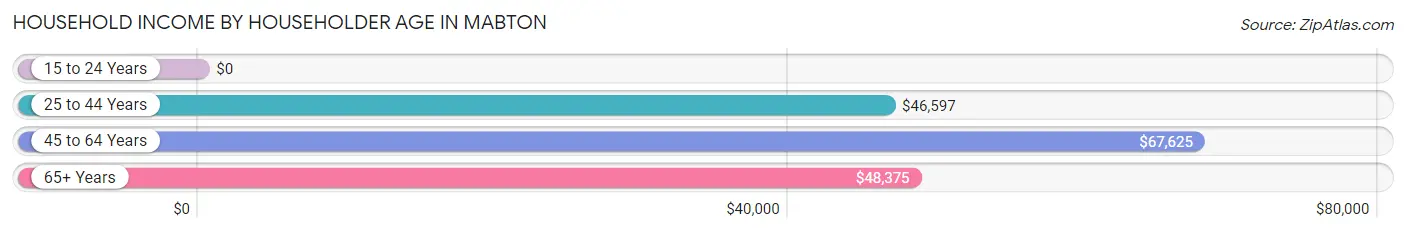
| Income Bracket | # Households | Median Income |
| 15 to 24 Years | 77 (13.6%) | $0 |
| 25 to 44 Years | 187 (32.9%) | $46,597 |
| 45 to 64 Years | 169 (29.7%) | $67,625 |
| 65+ Years | 135 (23.8%) | $48,375 |
| Total | 568 (100.0%) | $50,000 |
Poverty in Mabton
Income Below Poverty by Sex and Age in Mabton
With 23.6% poverty level for males and 21.1% for females among the residents of Mabton, 15 year old males and 5 year old females are the most vulnerable to poverty, with 10 males (47.6%) and 29 females (70.7%) in their respective age groups living below the poverty level.
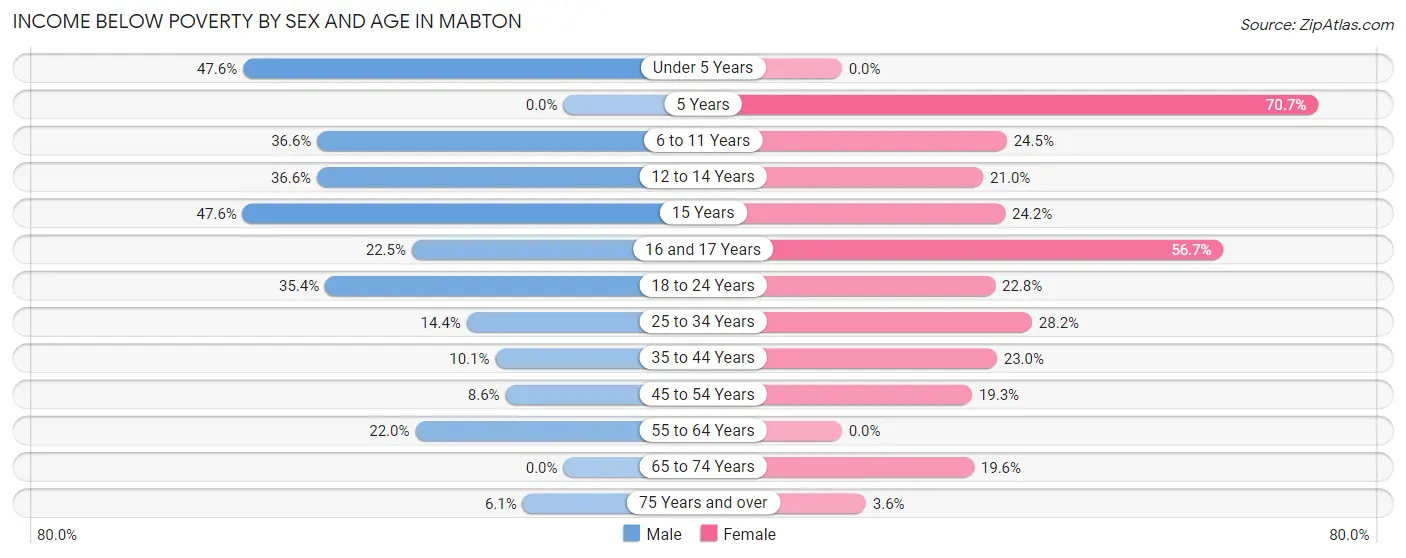
| Age Bracket | Male | Female |
| Under 5 Years | 39 (47.6%) | 0 (0.0%) |
| 5 Years | 0 (0.0%) | 29 (70.7%) |
| 6 to 11 Years | 53 (36.5%) | 24 (24.5%) |
| 12 to 14 Years | 30 (36.6%) | 17 (21.0%) |
| 15 Years | 10 (47.6%) | 8 (24.2%) |
| 16 and 17 Years | 9 (22.5%) | 17 (56.7%) |
| 18 to 24 Years | 69 (35.4%) | 43 (22.8%) |
| 25 to 34 Years | 26 (14.4%) | 35 (28.2%) |
| 35 to 44 Years | 9 (10.1%) | 32 (23.0%) |
| 45 to 54 Years | 8 (8.6%) | 23 (19.3%) |
| 55 to 64 Years | 20 (22.0%) | 0 (0.0%) |
| 65 to 74 Years | 0 (0.0%) | 10 (19.6%) |
| 75 Years and over | 2 (6.1%) | 2 (3.6%) |
| Total | 275 (23.6%) | 240 (21.1%) |
Income Above Poverty by Sex and Age in Mabton
According to the poverty statistics in Mabton, males aged 5 years and females aged under 5 years are the age groups that are most secure financially, with 100.0% of males and 100.0% of females in these age groups living above the poverty line.
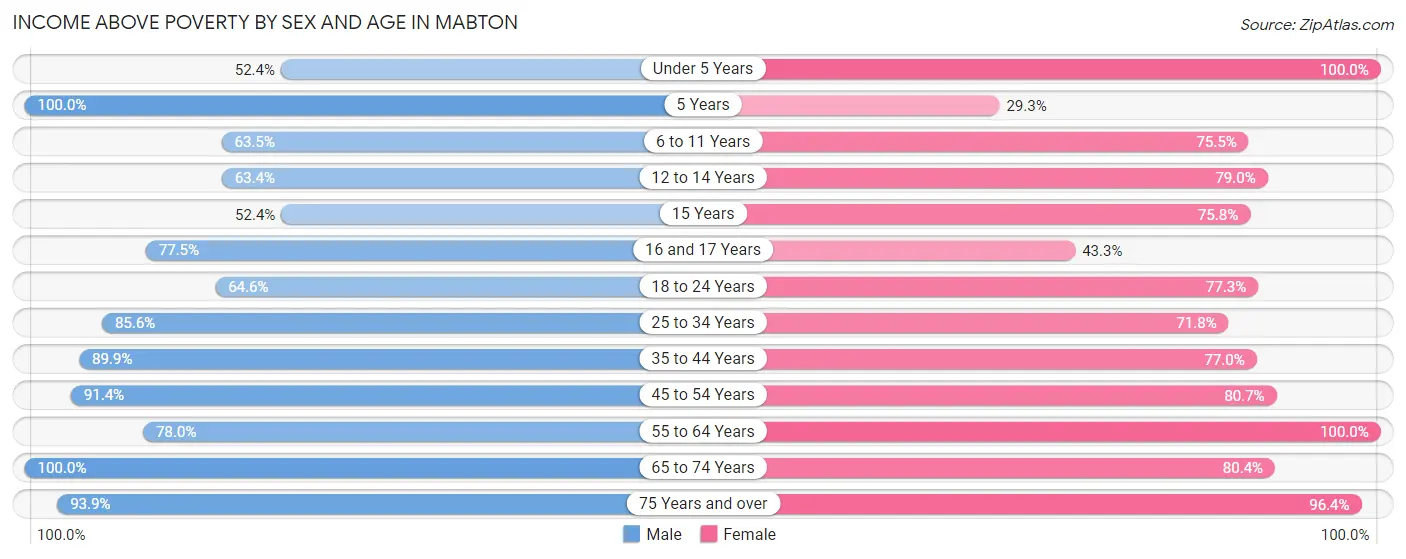
| Age Bracket | Male | Female |
| Under 5 Years | 43 (52.4%) | 116 (100.0%) |
| 5 Years | 54 (100.0%) | 12 (29.3%) |
| 6 to 11 Years | 92 (63.4%) | 74 (75.5%) |
| 12 to 14 Years | 52 (63.4%) | 64 (79.0%) |
| 15 Years | 11 (52.4%) | 25 (75.8%) |
| 16 and 17 Years | 31 (77.5%) | 13 (43.3%) |
| 18 to 24 Years | 126 (64.6%) | 146 (77.2%) |
| 25 to 34 Years | 155 (85.6%) | 89 (71.8%) |
| 35 to 44 Years | 80 (89.9%) | 107 (77.0%) |
| 45 to 54 Years | 85 (91.4%) | 96 (80.7%) |
| 55 to 64 Years | 71 (78.0%) | 58 (100.0%) |
| 65 to 74 Years | 59 (100.0%) | 41 (80.4%) |
| 75 Years and over | 31 (93.9%) | 54 (96.4%) |
| Total | 890 (76.4%) | 895 (78.8%) |
Income Below Poverty Among Married-Couple Families in Mabton
The poverty statistics for married-couple families in Mabton show that 6.7% or 16 of the total 240 families live below the poverty line. Families with 5 or more children have the highest poverty rate of 100.0%, comprising of 7 families. On the other hand, families with no children have the lowest poverty rate of 0.0%, which includes 0 families.
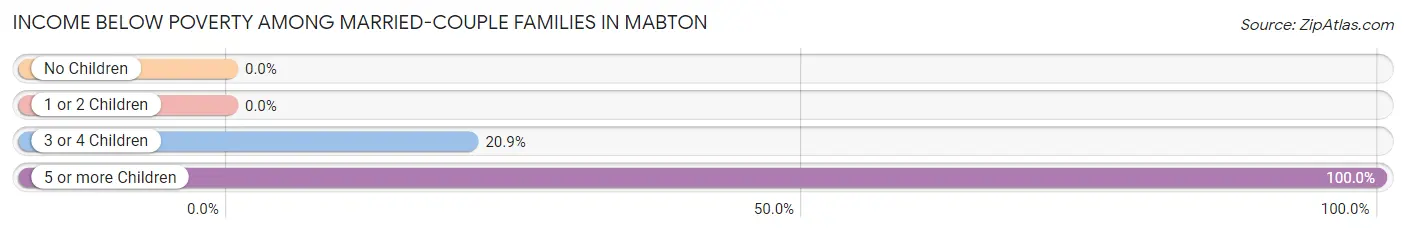
| Children | Above Poverty | Below Poverty |
| No Children | 84 (100.0%) | 0 (0.0%) |
| 1 or 2 Children | 106 (100.0%) | 0 (0.0%) |
| 3 or 4 Children | 34 (79.1%) | 9 (20.9%) |
| 5 or more Children | 0 (0.0%) | 7 (100.0%) |
| Total | 224 (93.3%) | 16 (6.7%) |
Income Below Poverty Among Single-Parent Households in Mabton
According to the poverty data in Mabton, 11.0% or 8 single-father households and 55.7% or 107 single-mother households are living below the poverty line. Among single-father households, those with no children have the highest poverty rate, with 8 households (18.2%) experiencing poverty. Likewise, among single-mother households, those with 1 or 2 children have the highest poverty rate, with 73 households (63.5%) falling below the poverty line.
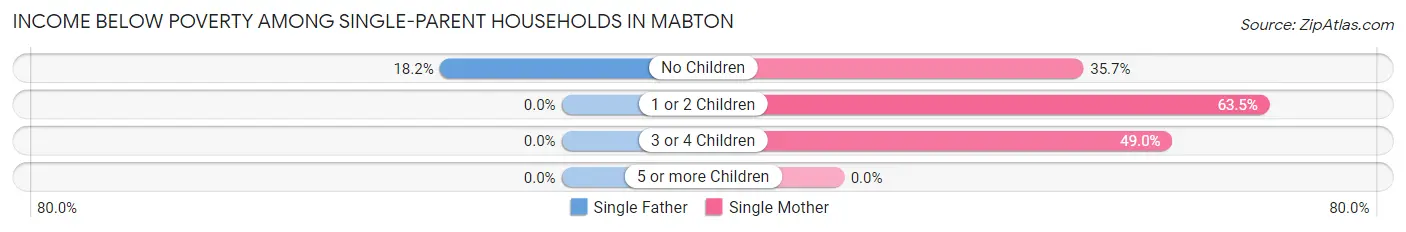
| Children | Single Father | Single Mother |
| No Children | 8 (18.2%) | 10 (35.7%) |
| 1 or 2 Children | 0 (0.0%) | 73 (63.5%) |
| 3 or 4 Children | 0 (0.0%) | 24 (49.0%) |
| 5 or more Children | 0 (0.0%) | 0 (0.0%) |
| Total | 8 (11.0%) | 107 (55.7%) |
Income Below Poverty Among Married-Couple vs Single-Parent Households in Mabton
The poverty data for Mabton shows that 16 of the married-couple family households (6.7%) and 115 of the single-parent households (43.4%) are living below the poverty level. Within the married-couple family households, those with 5 or more children have the highest poverty rate, with 7 households (100.0%) falling below the poverty line. Among the single-parent households, those with 1 or 2 children have the highest poverty rate, with 73 household (53.7%) living below poverty.
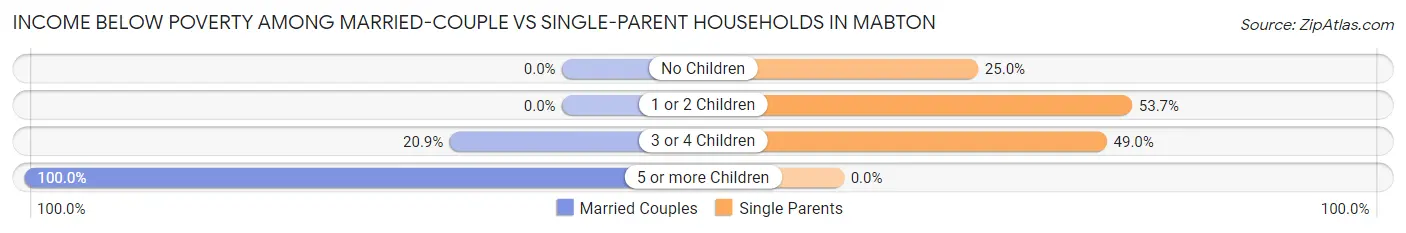
| Children | Married-Couple Families | Single-Parent Households |
| No Children | 0 (0.0%) | 18 (25.0%) |
| 1 or 2 Children | 0 (0.0%) | 73 (53.7%) |
| 3 or 4 Children | 9 (20.9%) | 24 (49.0%) |
| 5 or more Children | 7 (100.0%) | 0 (0.0%) |
| Total | 16 (6.7%) | 115 (43.4%) |
Race in Mabton
The most populous races in Mabton are Hispanic or Latino (2,211 | 95.6%), Two or more Races (938 | 40.5%), and White / Caucasian (878 | 37.9%).
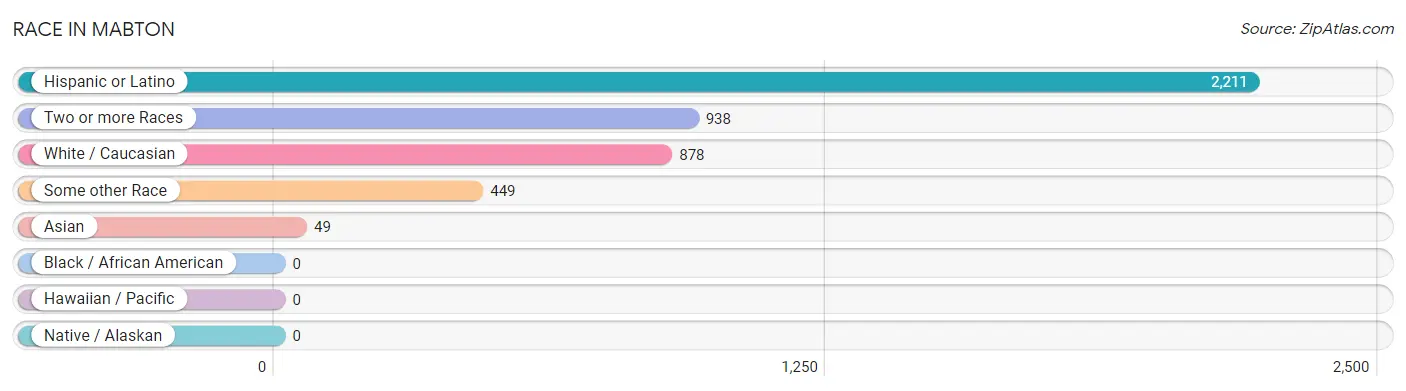
| Race | # Population | % Population |
| Asian | 49 | 2.1% |
| Black / African American | 0 | 0.0% |
| Hawaiian / Pacific | 0 | 0.0% |
| Hispanic or Latino | 2,211 | 95.6% |
| Native / Alaskan | 0 | 0.0% |
| White / Caucasian | 878 | 37.9% |
| Two or more Races | 938 | 40.5% |
| Some other Race | 449 | 19.4% |
| Total | 2,314 | 100.0% |
Ancestry in Mabton
The most populous ancestries reported in Mabton are Mexican (2,167 | 93.6%), Korean (49 | 2.1%), Central American (28 | 1.2%), Salvadoran (28 | 1.2%), and Mexican American Indian (26 | 1.1%), together accounting for 99.3% of all Mabton residents.
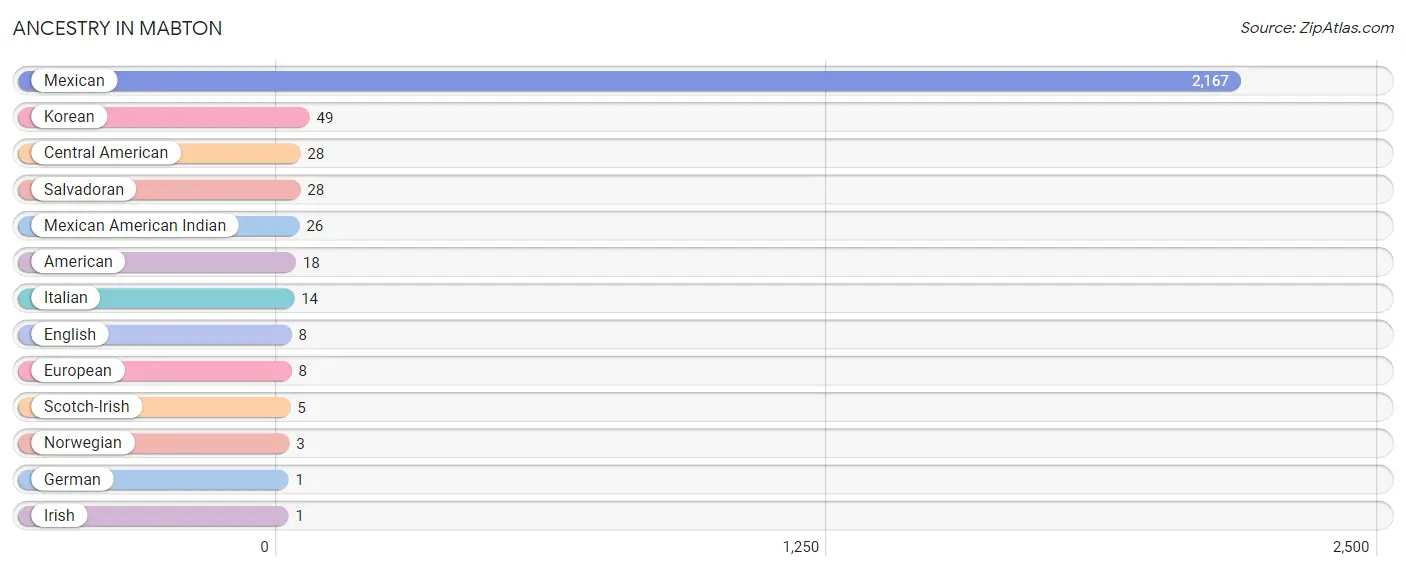
| Ancestry | # Population | % Population |
| American | 18 | 0.8% |
| Central American | 28 | 1.2% |
| English | 8 | 0.4% |
| European | 8 | 0.4% |
| German | 1 | 0.0% |
| Irish | 1 | 0.0% |
| Italian | 14 | 0.6% |
| Korean | 49 | 2.1% |
| Mexican | 2,167 | 93.6% |
| Mexican American Indian | 26 | 1.1% |
| Norwegian | 3 | 0.1% |
| Salvadoran | 28 | 1.2% |
| Scotch-Irish | 5 | 0.2% | View All 13 Rows |
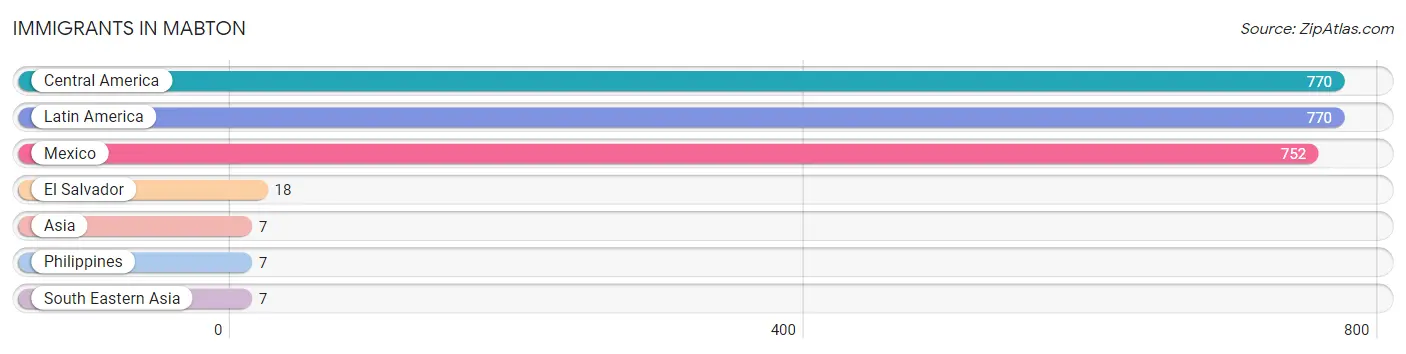
Immigrants in Mabton
The most numerous immigrant groups reported in Mabton came from Central America (770 | 33.3%), Latin America (770 | 33.3%), Mexico (752 | 32.5%), El Salvador (18 | 0.8%), and Asia (7 | 0.3%), together accounting for 100.1% of all Mabton residents.
| Immigration Origin | # Population | % Population |
| Asia | 7 | 0.3% |
| Central America | 770 | 33.3% |
| El Salvador | 18 | 0.8% |
| Latin America | 770 | 33.3% |
| Mexico | 752 | 32.5% |
| Philippines | 7 | 0.3% |
| South Eastern Asia | 7 | 0.3% | View All 7 Rows |
Sex and Age in Mabton
Sex and Age in Mabton
The most populous age groups in Mabton are 5 to 9 Years (169 | 14.4%) for men and 20 to 24 Years (152 | 13.4%) for women.
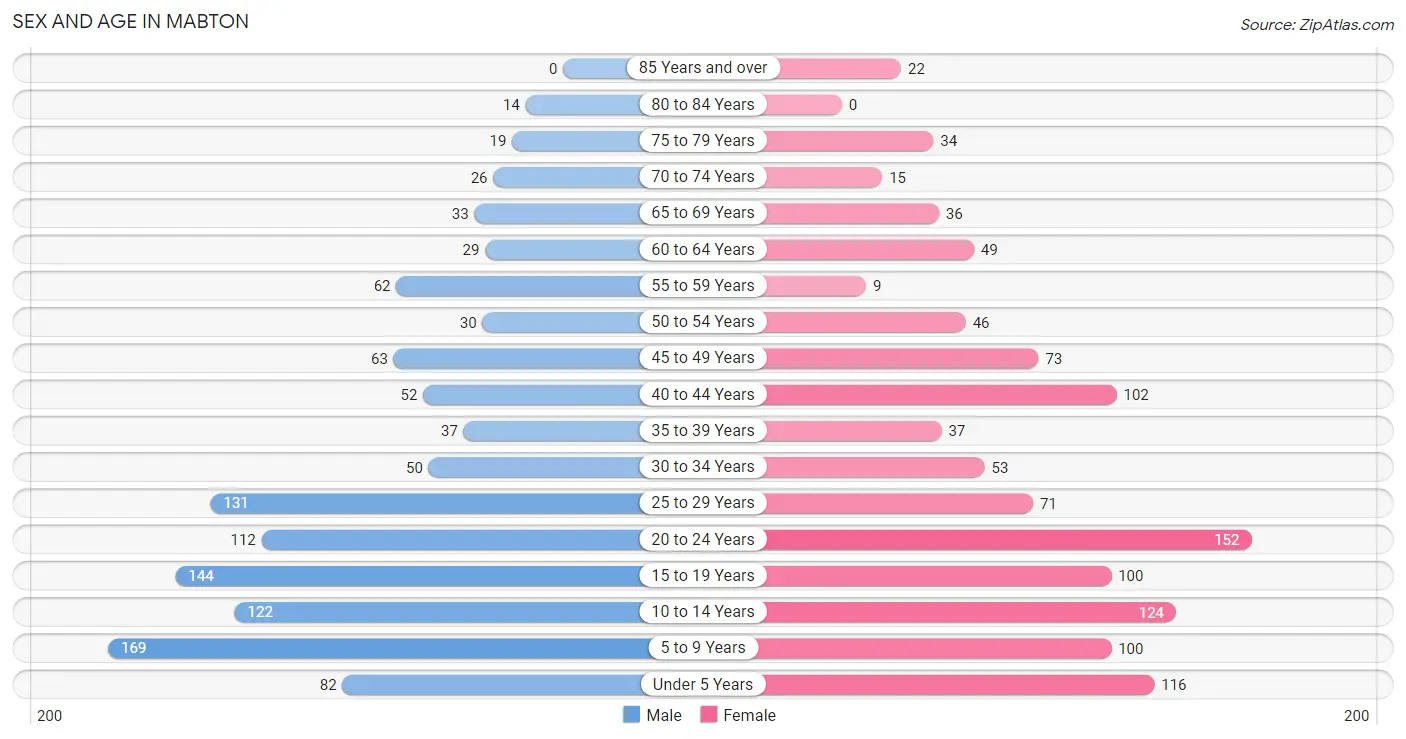
| Age Bracket | Male | Female |
| Under 5 Years | 82 (7.0%) | 116 (10.2%) |
| 5 to 9 Years | 169 (14.4%) | 100 (8.8%) |
| 10 to 14 Years | 122 (10.4%) | 124 (10.9%) |
| 15 to 19 Years | 144 (12.3%) | 100 (8.8%) |
| 20 to 24 Years | 112 (9.5%) | 152 (13.4%) |
| 25 to 29 Years | 131 (11.2%) | 71 (6.2%) |
| 30 to 34 Years | 50 (4.3%) | 53 (4.6%) |
| 35 to 39 Years | 37 (3.2%) | 37 (3.3%) |
| 40 to 44 Years | 52 (4.4%) | 102 (9.0%) |
| 45 to 49 Years | 63 (5.4%) | 73 (6.4%) |
| 50 to 54 Years | 30 (2.5%) | 46 (4.0%) |
| 55 to 59 Years | 62 (5.3%) | 9 (0.8%) |
| 60 to 64 Years | 29 (2.5%) | 49 (4.3%) |
| 65 to 69 Years | 33 (2.8%) | 36 (3.2%) |
| 70 to 74 Years | 26 (2.2%) | 15 (1.3%) |
| 75 to 79 Years | 19 (1.6%) | 34 (3.0%) |
| 80 to 84 Years | 14 (1.2%) | 0 (0.0%) |
| 85 Years and over | 0 (0.0%) | 22 (1.9%) |
| Total | 1,175 (100.0%) | 1,139 (100.0%) |
Families and Households in Mabton
Median Family Size in Mabton
The median family size in Mabton is 4.16 persons per family, with married-couple families (240 | 47.5%) accounting for the largest median family size of 4.44 persons per family. On the other hand, single male/father families (73 | 14.5%) represent the smallest median family size with 3.16 persons per family.
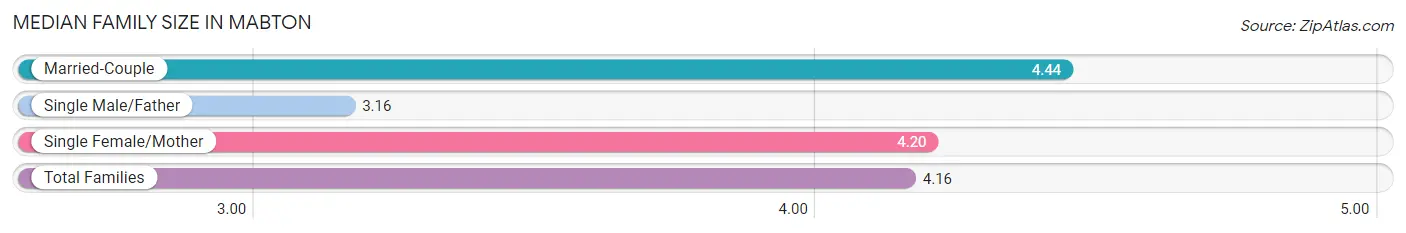
| Family Type | # Families | Family Size |
| Married-Couple | 240 (47.5%) | 4.44 |
| Single Male/Father | 73 (14.5%) | 3.16 |
| Single Female/Mother | 192 (38.0%) | 4.20 |
| Total Families | 505 (100.0%) | 4.16 |
Median Household Size in Mabton
The median household size in Mabton is 4.06 persons per household, with married-couple households (240 | 42.2%) accounting for the largest median household size of 4.54 persons per household. non-family households (63 | 11.1%) represent the smallest median household size with 1.30 persons per household.
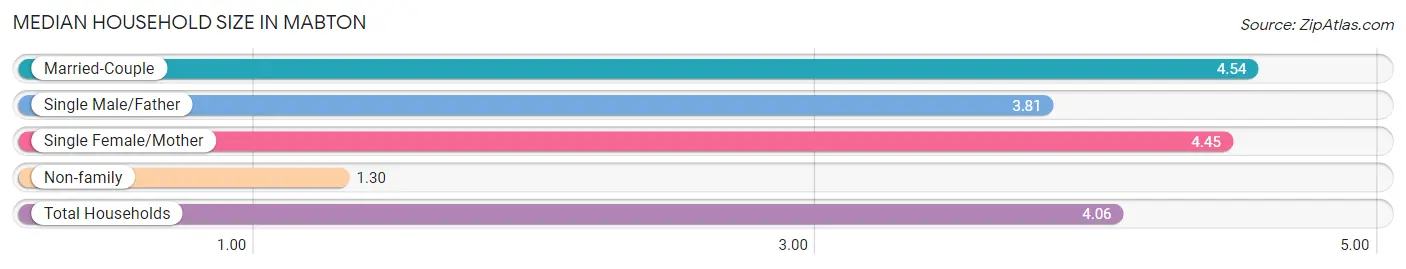
| Household Type | # Households | Household Size |
| Married-Couple | 240 (42.2%) | 4.54 |
| Single Male/Father | 73 (12.9%) | 3.81 |
| Single Female/Mother | 192 (33.8%) | 4.45 |
| Non-family | 63 (11.1%) | 1.30 |
| Total Households | 568 (100.0%) | 4.06 |
Household Size by Marriage Status in Mabton
Out of a total of 568 households in Mabton, 505 (88.9%) are family households, while 63 (11.1%) are nonfamily households. The most numerous type of family households are 5-person households, comprising 127, and the most common type of nonfamily households are 1-person households, comprising 44.
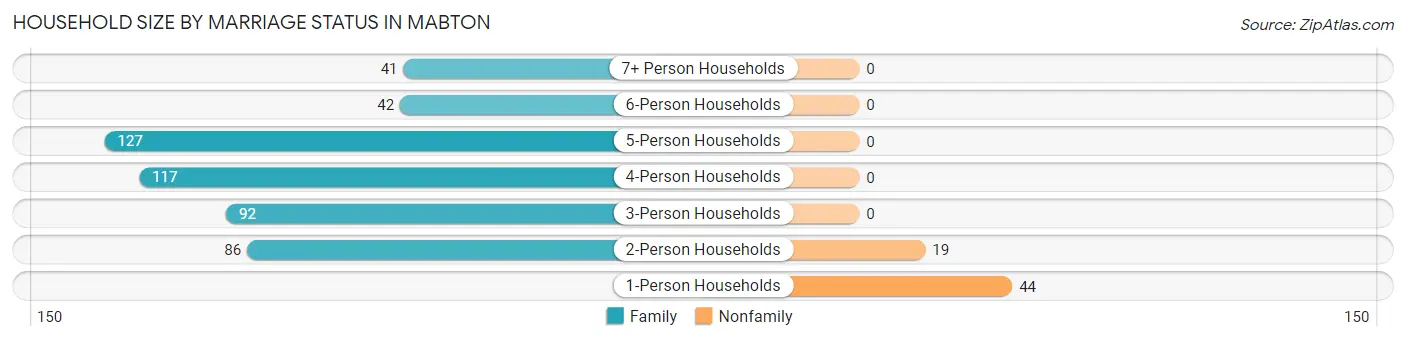
| Household Size | Family Households | Nonfamily Households |
| 1-Person Households | - | 44 (7.7%) |
| 2-Person Households | 86 (15.1%) | 19 (3.4%) |
| 3-Person Households | 92 (16.2%) | 0 (0.0%) |
| 4-Person Households | 117 (20.6%) | 0 (0.0%) |
| 5-Person Households | 127 (22.4%) | 0 (0.0%) |
| 6-Person Households | 42 (7.4%) | 0 (0.0%) |
| 7+ Person Households | 41 (7.2%) | 0 (0.0%) |
| Total | 505 (88.9%) | 63 (11.1%) |
Female Fertility in Mabton
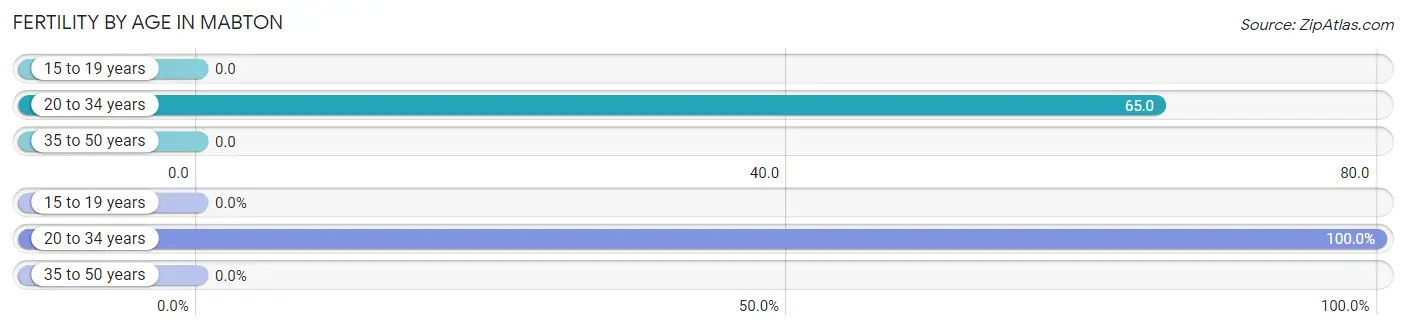
Fertility by Age in Mabton
Average fertility rate in Mabton is 30.0 births per 1,000 women. Women in the age bracket of 20 to 34 years have the highest fertility rate with 65.0 births per 1,000 women. Women in the age bracket of 20 to 34 years acount for 100.0% of all women with births.
| Age Bracket | Women with Births | Births / 1,000 Women |
| 15 to 19 years | 0 (0.0%) | 0.0 |
| 20 to 34 years | 18 (100.0%) | 65.0 |
| 35 to 50 years | 0 (0.0%) | 0.0 |
| Total | 18 (100.0%) | 30.0 |
Fertility by Age by Marriage Status in Mabton
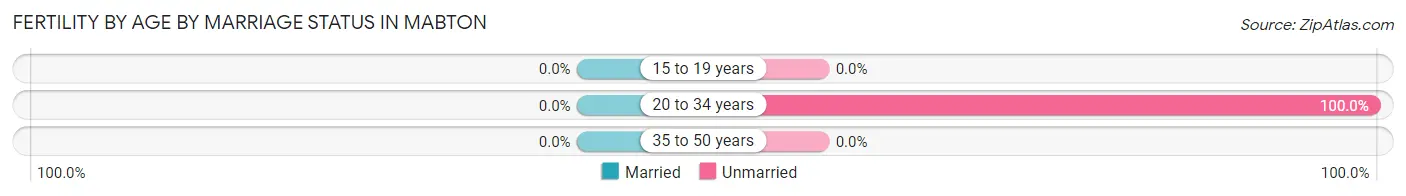
| Age Bracket | Married | Unmarried |
| 15 to 19 years | 0 (0.0%) | 0 (0.0%) |
| 20 to 34 years | 0 (0.0%) | 18 (100.0%) |
| 35 to 50 years | 0 (0.0%) | 0 (0.0%) |
| Total | 0 (0.0%) | 18 (100.0%) |
Fertility by Education in Mabton
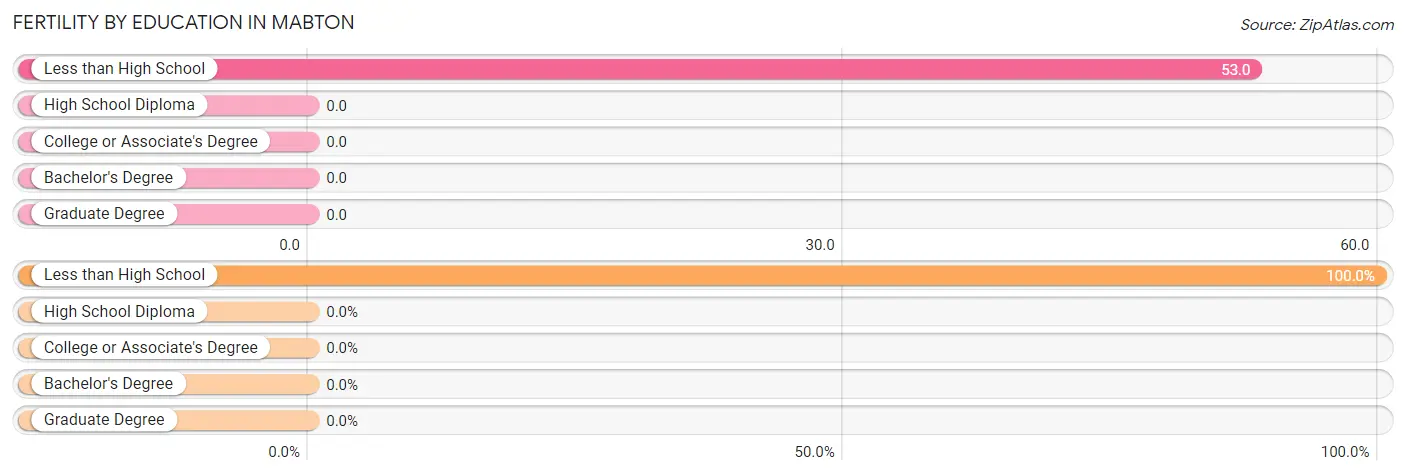
| Educational Attainment | Women with Births | Births / 1,000 Women |
| Less than High School | 18 (100.0%) | 53.0 |
| High School Diploma | 0 (0.0%) | 0.0 |
| College or Associate's Degree | 0 (0.0%) | 0.0 |
| Bachelor's Degree | 0 (0.0%) | 0.0 |
| Graduate Degree | 0 (0.0%) | 0.0 |
| Total | 18 (100.0%) | 30.0 |
Fertility by Education by Marriage Status in Mabton
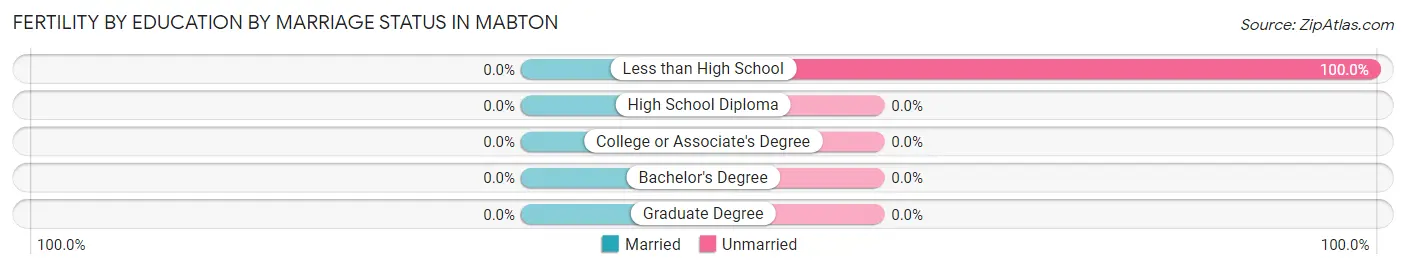
| Educational Attainment | Married | Unmarried |
| Less than High School | 0 (0.0%) | 18 (100.0%) |
| High School Diploma | 0 (0.0%) | 0 (0.0%) |
| College or Associate's Degree | 0 (0.0%) | 0 (0.0%) |
| Bachelor's Degree | 0 (0.0%) | 0 (0.0%) |
| Graduate Degree | 0 (0.0%) | 0 (0.0%) |
| Total | 0 (0.0%) | 18 (100.0%) |
Employment Characteristics in Mabton
Employment by Class of Employer in Mabton
Among the 919 employed individuals in Mabton, private company employees (684 | 74.4%), not-for-profit organizations (123 | 13.4%), and self-employed (not incorporated) (42 | 4.6%) make up the most common classes of employment.
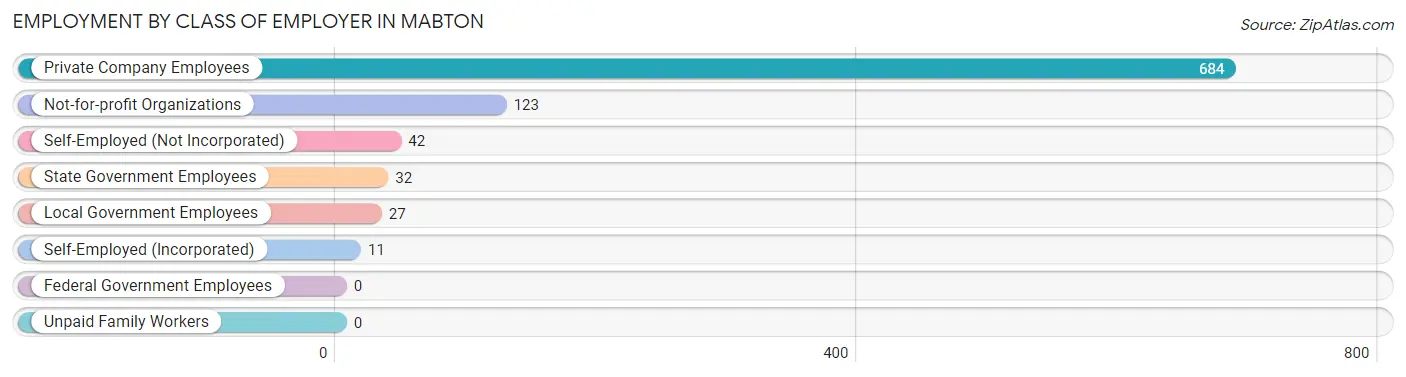
| Employer Class | # Employees | % Employees |
| Private Company Employees | 684 | 74.4% |
| Self-Employed (Incorporated) | 11 | 1.2% |
| Self-Employed (Not Incorporated) | 42 | 4.6% |
| Not-for-profit Organizations | 123 | 13.4% |
| Local Government Employees | 27 | 2.9% |
| State Government Employees | 32 | 3.5% |
| Federal Government Employees | 0 | 0.0% |
| Unpaid Family Workers | 0 | 0.0% |
| Total | 919 | 100.0% |
Employment Status by Age in Mabton
According to the labor force statistics for Mabton, out of the total population over 16 years of age (1,547), 67.6% or 1,046 individuals are in the labor force, with 9.6% or 100 of them unemployed. The age group with the highest labor force participation rate is 25 to 29 years, with 91.6% or 185 individuals in the labor force. Within the labor force, the 60 to 64 years age range has the highest percentage of unemployed individuals, with 25.0% or 9 of them being unemployed.
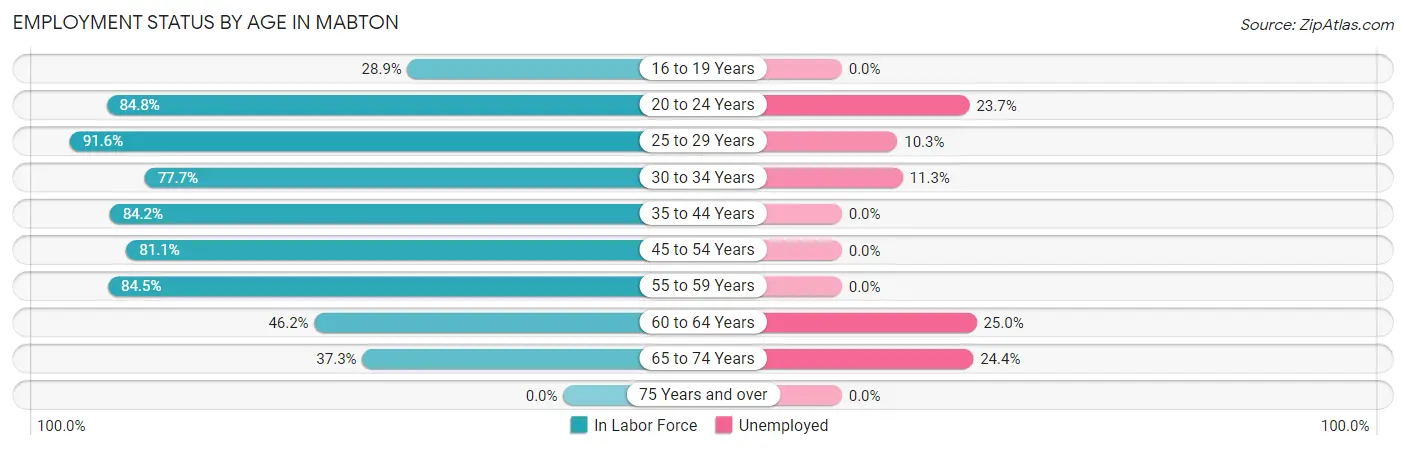
| Age Bracket | In Labor Force | Unemployed |
| 16 to 19 Years | 55 (28.9%) | 0 (0.0%) |
| 20 to 24 Years | 224 (84.8%) | 53 (23.7%) |
| 25 to 29 Years | 185 (91.6%) | 19 (10.3%) |
| 30 to 34 Years | 80 (77.7%) | 9 (11.3%) |
| 35 to 44 Years | 192 (84.2%) | 0 (0.0%) |
| 45 to 54 Years | 172 (81.1%) | 0 (0.0%) |
| 55 to 59 Years | 60 (84.5%) | 0 (0.0%) |
| 60 to 64 Years | 36 (46.2%) | 9 (25.0%) |
| 65 to 74 Years | 41 (37.3%) | 10 (24.4%) |
| 75 Years and over | 0 (0.0%) | 0 (0.0%) |
| Total | 1,046 (67.6%) | 100 (9.6%) |
Employment Status by Educational Attainment in Mabton
According to labor force statistics for Mabton, 81.1% of individuals (725) out of the total population between 25 and 64 years of age (894) are in the labor force, with 5.1% or 37 of them being unemployed. The group with the highest labor force participation rate are those with the educational attainment of bachelor's degree or higher, with 100.0% or 17 individuals in the labor force. Within the labor force, individuals with college / associate degree education have the highest percentage of unemployment, with 15.4% or 19 of them being unemployed.
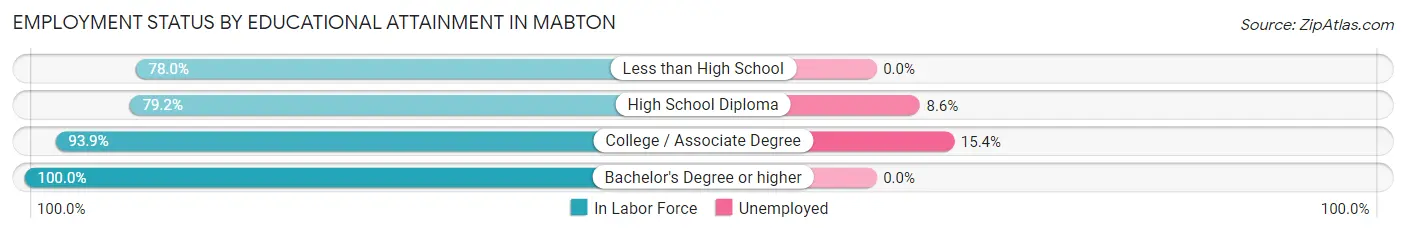
| Educational Attainment | In Labor Force | Unemployed |
| Less than High School | 376 (78.0%) | 0 (0.0%) |
| High School Diploma | 209 (79.2%) | 23 (8.6%) |
| College / Associate Degree | 123 (93.9%) | 20 (15.4%) |
| Bachelor's Degree or higher | 17 (100.0%) | 0 (0.0%) |
| Total | 725 (81.1%) | 46 (5.1%) |
Employment Occupations by Sex in Mabton
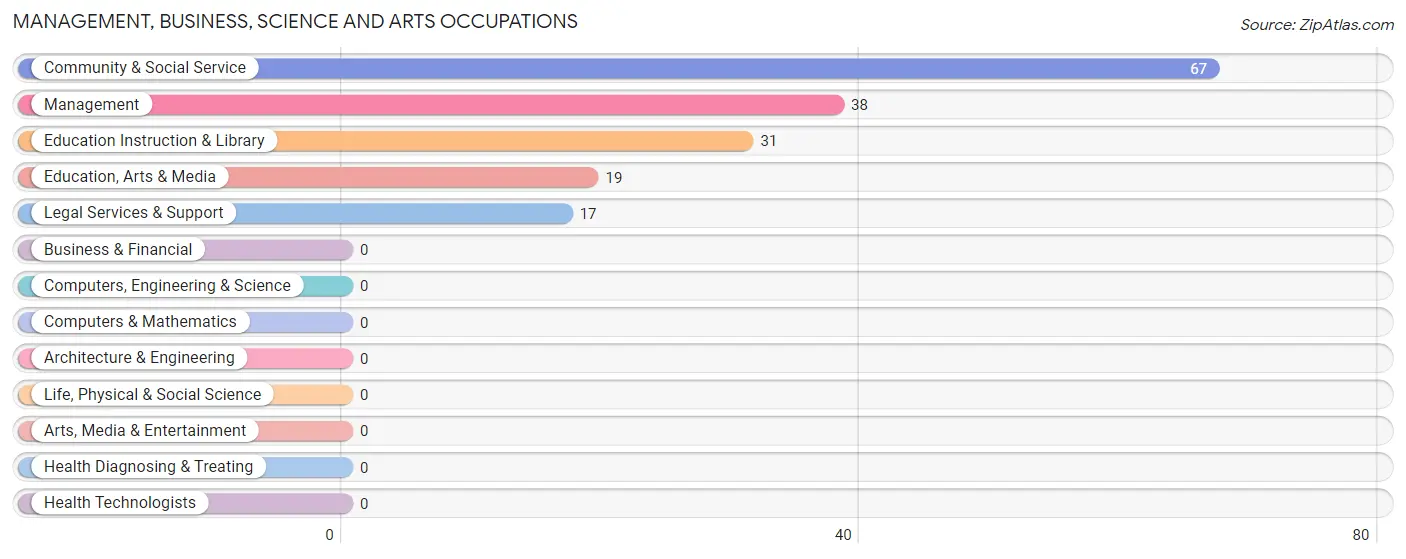
Management, Business, Science and Arts Occupations
The most common Management, Business, Science and Arts occupations in Mabton are Community & Social Service (67 | 7.1%), Management (38 | 4.0%), Education Instruction & Library (31 | 3.3%), Education, Arts & Media (19 | 2.0%), and Legal Services & Support (17 | 1.8%).
Management, Business, Science and Arts Occupations by Sex
Within the Management, Business, Science and Arts occupations in Mabton, the most male-oriented occupations are Management (78.9%), Education Instruction & Library (25.8%), and Community & Social Service (11.9%), while the most female-oriented occupations are Education, Arts & Media (100.0%), Legal Services & Support (100.0%), and Community & Social Service (88.1%).
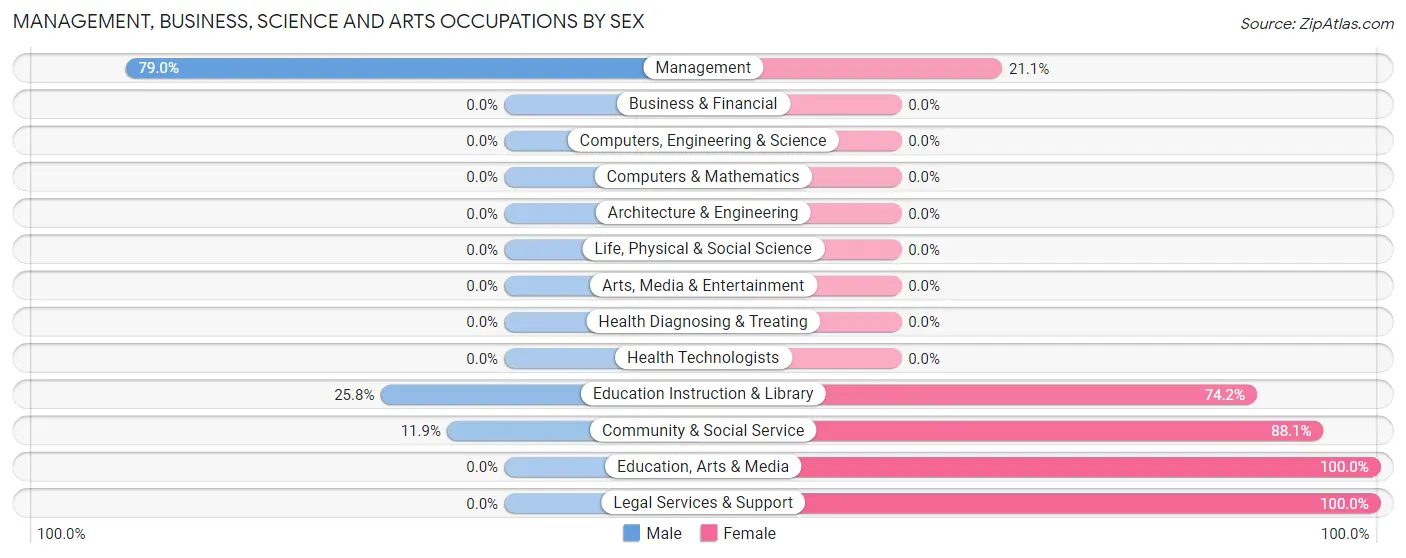
| Occupation | Male | Female |
| Management | 30 (78.9%) | 8 (21.0%) |
| Business & Financial | 0 (0.0%) | 0 (0.0%) |
| Computers, Engineering & Science | 0 (0.0%) | 0 (0.0%) |
| Computers & Mathematics | 0 (0.0%) | 0 (0.0%) |
| Architecture & Engineering | 0 (0.0%) | 0 (0.0%) |
| Life, Physical & Social Science | 0 (0.0%) | 0 (0.0%) |
| Community & Social Service | 8 (11.9%) | 59 (88.1%) |
| Education, Arts & Media | 0 (0.0%) | 19 (100.0%) |
| Legal Services & Support | 0 (0.0%) | 17 (100.0%) |
| Education Instruction & Library | 8 (25.8%) | 23 (74.2%) |
| Arts, Media & Entertainment | 0 (0.0%) | 0 (0.0%) |
| Health Diagnosing & Treating | 0 (0.0%) | 0 (0.0%) |
| Health Technologists | 0 (0.0%) | 0 (0.0%) |
| Total (Category) | 38 (36.2%) | 67 (63.8%) |
| Total (Overall) | 488 (51.6%) | 457 (48.4%) |
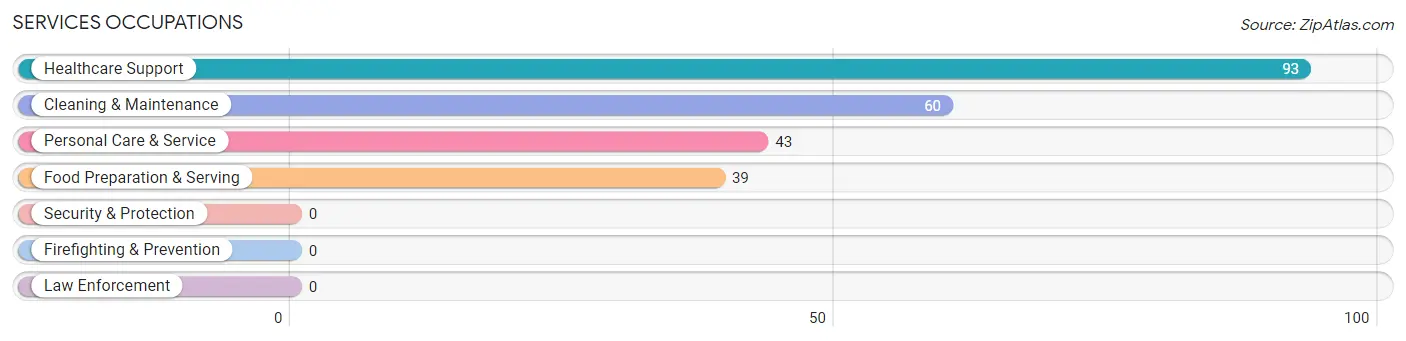
Services Occupations
The most common Services occupations in Mabton are Healthcare Support (93 | 9.8%), Cleaning & Maintenance (60 | 6.4%), Personal Care & Service (43 | 4.5%), and Food Preparation & Serving (39 | 4.1%).
Services Occupations by Sex
Within the Services occupations in Mabton, the most male-oriented occupations are Food Preparation & Serving (69.2%), Cleaning & Maintenance (38.3%), and Personal Care & Service (23.3%), while the most female-oriented occupations are Healthcare Support (100.0%), Personal Care & Service (76.7%), and Cleaning & Maintenance (61.7%).
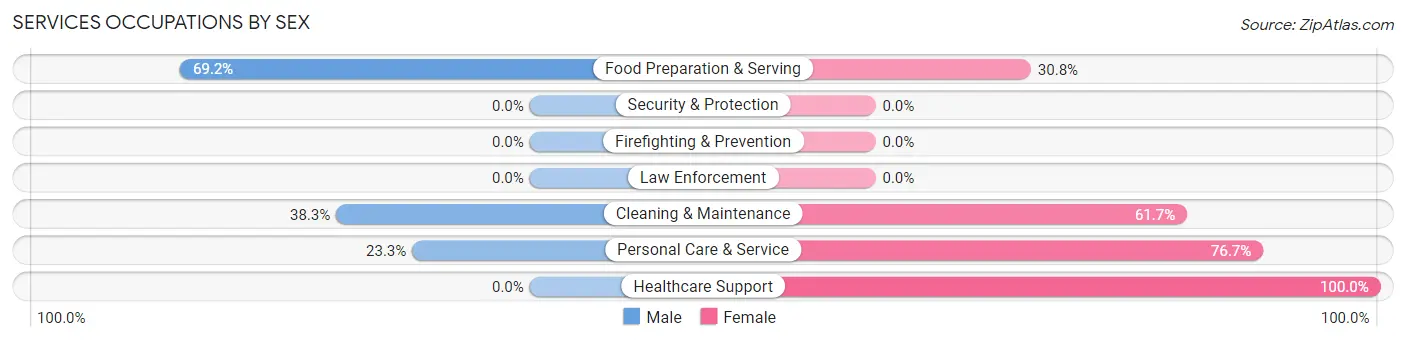
| Occupation | Male | Female |
| Healthcare Support | 0 (0.0%) | 93 (100.0%) |
| Security & Protection | 0 (0.0%) | 0 (0.0%) |
| Firefighting & Prevention | 0 (0.0%) | 0 (0.0%) |
| Law Enforcement | 0 (0.0%) | 0 (0.0%) |
| Food Preparation & Serving | 27 (69.2%) | 12 (30.8%) |
| Cleaning & Maintenance | 23 (38.3%) | 37 (61.7%) |
| Personal Care & Service | 10 (23.3%) | 33 (76.7%) |
| Total (Category) | 60 (25.5%) | 175 (74.5%) |
| Total (Overall) | 488 (51.6%) | 457 (48.4%) |
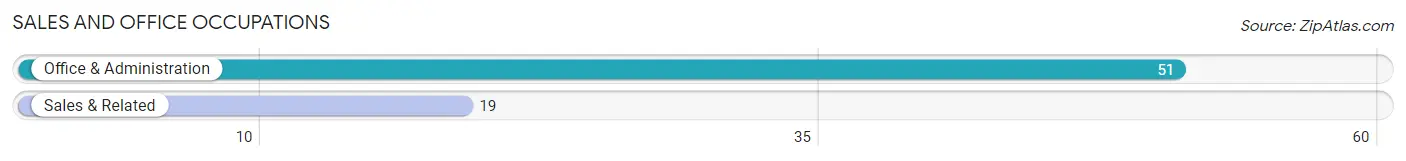
Sales and Office Occupations
The most common Sales and Office occupations in Mabton are Office & Administration (51 | 5.4%), and Sales & Related (19 | 2.0%).
Sales and Office Occupations by Sex
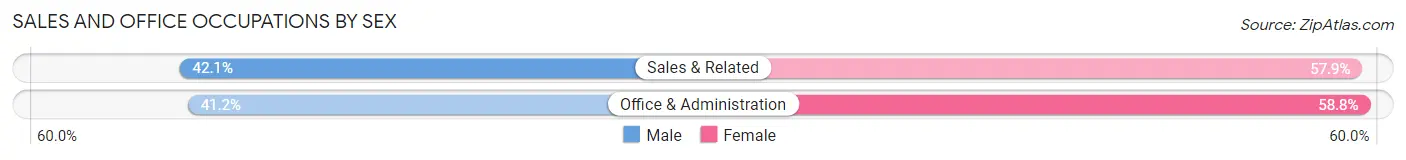
| Occupation | Male | Female |
| Sales & Related | 8 (42.1%) | 11 (57.9%) |
| Office & Administration | 21 (41.2%) | 30 (58.8%) |
| Total (Category) | 29 (41.4%) | 41 (58.6%) |
| Total (Overall) | 488 (51.6%) | 457 (48.4%) |
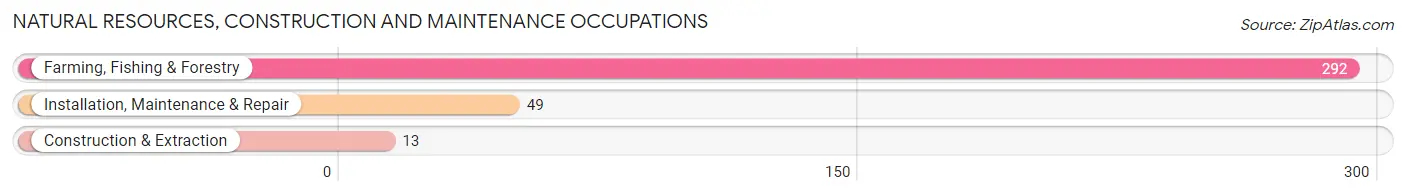
Natural Resources, Construction and Maintenance Occupations
The most common Natural Resources, Construction and Maintenance occupations in Mabton are Farming, Fishing & Forestry (292 | 30.9%), Installation, Maintenance & Repair (49 | 5.2%), and Construction & Extraction (13 | 1.4%).
Natural Resources, Construction and Maintenance Occupations by Sex
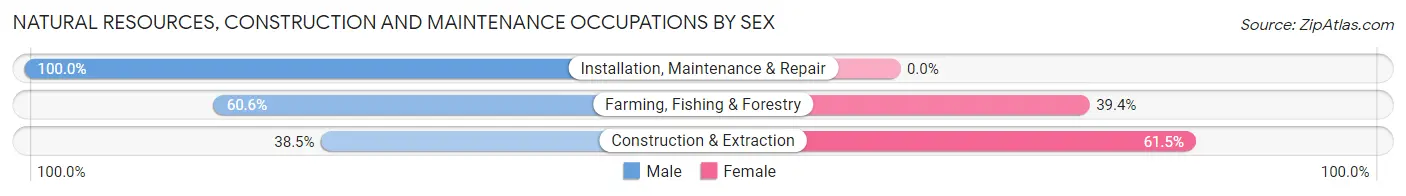
| Occupation | Male | Female |
| Farming, Fishing & Forestry | 177 (60.6%) | 115 (39.4%) |
| Construction & Extraction | 5 (38.5%) | 8 (61.5%) |
| Installation, Maintenance & Repair | 49 (100.0%) | 0 (0.0%) |
| Total (Category) | 231 (65.2%) | 123 (34.7%) |
| Total (Overall) | 488 (51.6%) | 457 (48.4%) |
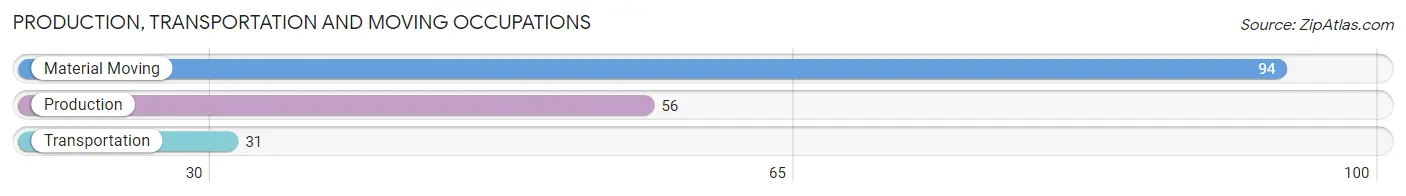
Production, Transportation and Moving Occupations
The most common Production, Transportation and Moving occupations in Mabton are Material Moving (94 | 10.0%), Production (56 | 5.9%), and Transportation (31 | 3.3%).
Production, Transportation and Moving Occupations by Sex
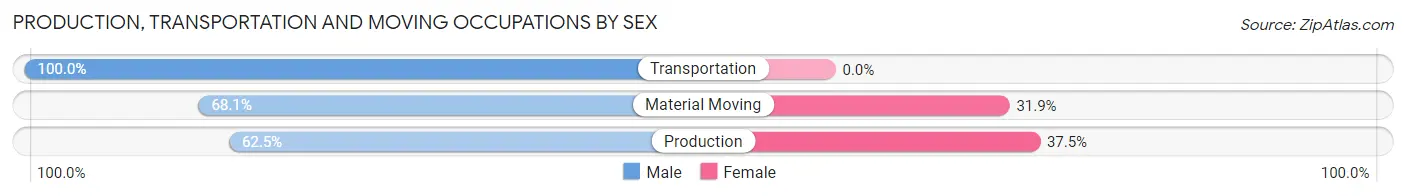
| Occupation | Male | Female |
| Production | 35 (62.5%) | 21 (37.5%) |
| Transportation | 31 (100.0%) | 0 (0.0%) |
| Material Moving | 64 (68.1%) | 30 (31.9%) |
| Total (Category) | 130 (71.8%) | 51 (28.2%) |
| Total (Overall) | 488 (51.6%) | 457 (48.4%) |
Employment Industries by Sex in Mabton
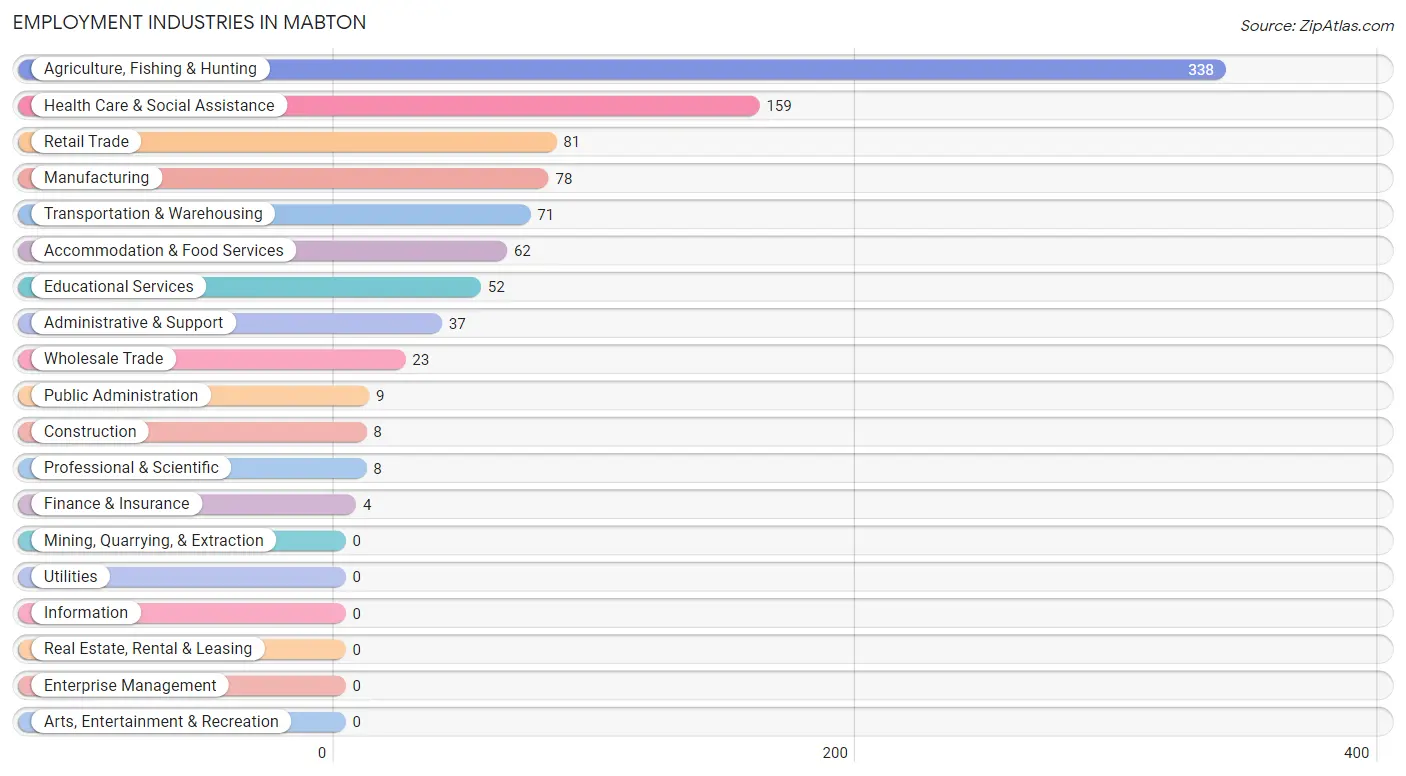
Employment Industries in Mabton
The major employment industries in Mabton include Agriculture, Fishing & Hunting (338 | 35.8%), Health Care & Social Assistance (159 | 16.8%), Retail Trade (81 | 8.6%), Manufacturing (78 | 8.3%), and Transportation & Warehousing (71 | 7.5%).
Employment Industries by Sex in Mabton
The Mabton industries that see more men than women are Wholesale Trade (95.7%), Transportation & Warehousing (74.7%), and Manufacturing (73.1%), whereas the industries that tend to have a higher number of women are Construction (100.0%), Finance & Insurance (100.0%), and Professional & Scientific (100.0%).
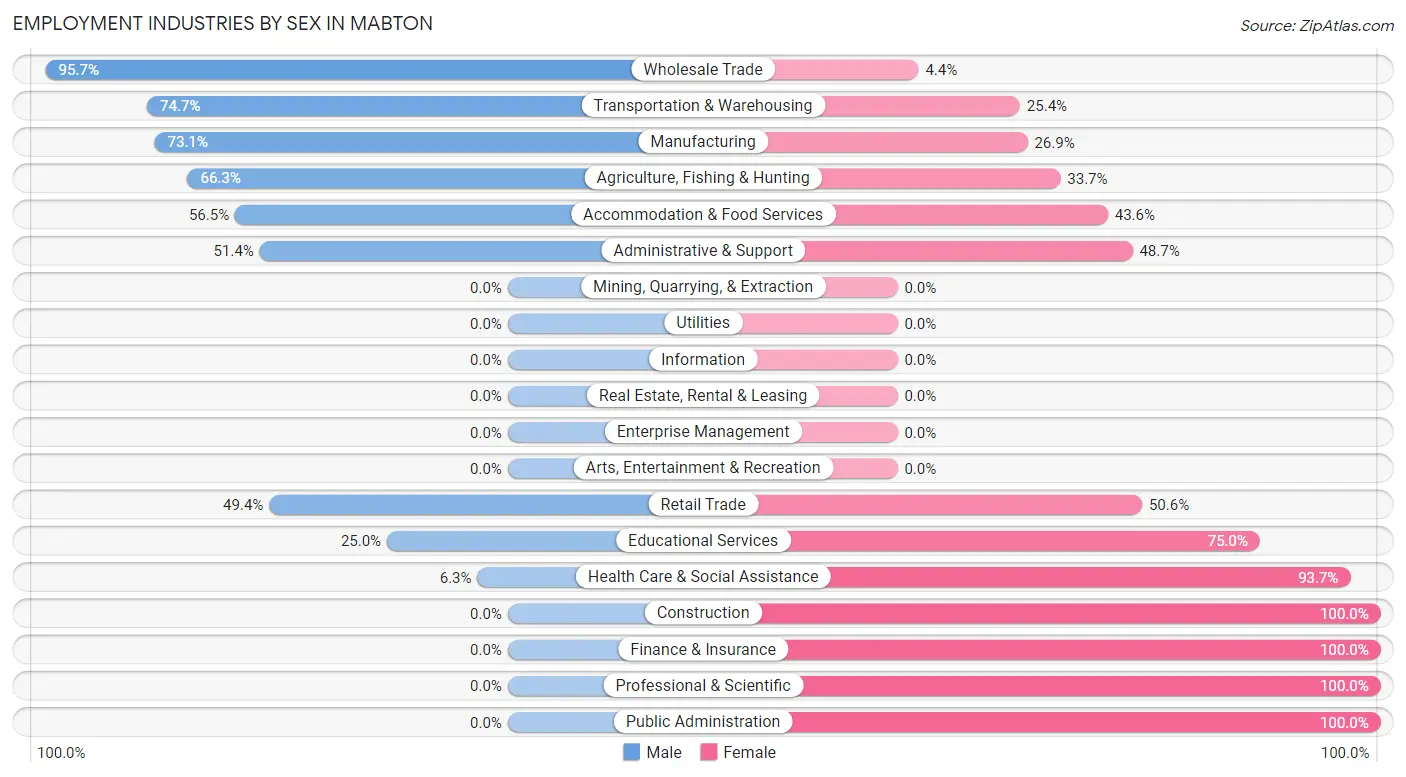
| Industry | Male | Female |
| Agriculture, Fishing & Hunting | 224 (66.3%) | 114 (33.7%) |
| Mining, Quarrying, & Extraction | 0 (0.0%) | 0 (0.0%) |
| Construction | 0 (0.0%) | 8 (100.0%) |
| Manufacturing | 57 (73.1%) | 21 (26.9%) |
| Wholesale Trade | 22 (95.7%) | 1 (4.3%) |
| Retail Trade | 40 (49.4%) | 41 (50.6%) |
| Transportation & Warehousing | 53 (74.7%) | 18 (25.4%) |
| Utilities | 0 (0.0%) | 0 (0.0%) |
| Information | 0 (0.0%) | 0 (0.0%) |
| Finance & Insurance | 0 (0.0%) | 4 (100.0%) |
| Real Estate, Rental & Leasing | 0 (0.0%) | 0 (0.0%) |
| Professional & Scientific | 0 (0.0%) | 8 (100.0%) |
| Enterprise Management | 0 (0.0%) | 0 (0.0%) |
| Administrative & Support | 19 (51.3%) | 18 (48.6%) |
| Educational Services | 13 (25.0%) | 39 (75.0%) |
| Health Care & Social Assistance | 10 (6.3%) | 149 (93.7%) |
| Arts, Entertainment & Recreation | 0 (0.0%) | 0 (0.0%) |
| Accommodation & Food Services | 35 (56.5%) | 27 (43.5%) |
| Public Administration | 0 (0.0%) | 9 (100.0%) |
| Total | 488 (51.6%) | 457 (48.4%) |
Education in Mabton
School Enrollment in Mabton
The most common levels of schooling among the 781 students in Mabton are middle school (206 | 26.4%), high school (201 | 25.7%), and elementary school (134 | 17.2%).
| School Level | # Students | % Students |
| Nursery / Preschool | 18 | 2.3% |
| Kindergarten | 126 | 16.1% |
| Elementary School | 134 | 17.2% |
| Middle School | 206 | 26.4% |
| High School | 201 | 25.7% |
| College / Undergraduate | 96 | 12.3% |
| Graduate / Professional | 0 | 0.0% |
| Total | 781 | 100.0% |
School Enrollment by Age by Funding Source in Mabton
Out of a total of 781 students who are enrolled in schools in Mabton, 11 (1.4%) attend a private institution, while the remaining 770 (98.6%) are enrolled in public schools. The age group of 20 to 24 year olds has the highest likelihood of being enrolled in private schools, with 11 (17.2% in the age bracket) enrolled. Conversely, the age group of 3 to 4 year olds has the lowest likelihood of being enrolled in a private school, with 18 (100.0% in the age bracket) attending a public institution.
| Age Bracket | Public School | Private School |
| 3 to 4 Year Olds | 18 (100.0%) | 0 (0.0%) |
| 5 to 9 Year Old | 247 (100.0%) | 0 (0.0%) |
| 10 to 14 Year Olds | 240 (100.0%) | 0 (0.0%) |
| 15 to 17 Year Olds | 114 (100.0%) | 0 (0.0%) |
| 18 to 19 Year Olds | 75 (100.0%) | 0 (0.0%) |
| 20 to 24 Year Olds | 53 (82.8%) | 11 (17.2%) |
| 25 to 34 Year Olds | 23 (100.0%) | 0 (0.0%) |
| 35 Years and over | 0 (0.0%) | 0 (0.0%) |
| Total | 770 (98.6%) | 11 (1.4%) |
Educational Attainment by Field of Study in Mabton
Arts & humanities (17 | 77.3%), and education (5 | 22.7%) are the most common fields of study among 22 individuals in Mabton who have obtained a bachelor's degree or higher.
| Field of Study | # Graduates | % Graduates |
| Computers & Mathematics | 0 | 0.0% |
| Bio, Nature & Agricultural | 0 | 0.0% |
| Physical & Health Sciences | 0 | 0.0% |
| Psychology | 0 | 0.0% |
| Social Sciences | 0 | 0.0% |
| Engineering | 0 | 0.0% |
| Multidisciplinary Studies | 0 | 0.0% |
| Science & Technology | 0 | 0.0% |
| Business | 0 | 0.0% |
| Education | 5 | 22.7% |
| Literature & Languages | 0 | 0.0% |
| Liberal Arts & History | 0 | 0.0% |
| Visual & Performing Arts | 0 | 0.0% |
| Communications | 0 | 0.0% |
| Arts & Humanities | 17 | 77.3% |
| Total | 22 | 100.0% |
Transportation & Commute in Mabton
Vehicle Availability by Sex in Mabton
The most prevalent vehicle ownership categories in Mabton are males with 3 vehicles (175, accounting for 36.2%) and females with 3 vehicles (142, making up 40.1%).
| Vehicles Available | Male | Female |
| No Vehicle | 0 (0.0%) | 0 (0.0%) |
| 1 Vehicle | 34 (7.0%) | 69 (15.8%) |
| 2 Vehicles | 125 (25.9%) | 79 (18.1%) |
| 3 Vehicles | 175 (36.2%) | 142 (32.6%) |
| 4 Vehicles | 90 (18.6%) | 135 (31.0%) |
| 5 or more Vehicles | 59 (12.2%) | 11 (2.5%) |
| Total | 483 (100.0%) | 436 (100.0%) |
Commute Time in Mabton
The most frequently occuring commute durations in Mabton are 15 to 19 minutes (164 commuters, 19.0%), 30 to 34 minutes (132 commuters, 15.3%), and 45 to 59 minutes (130 commuters, 15.1%).
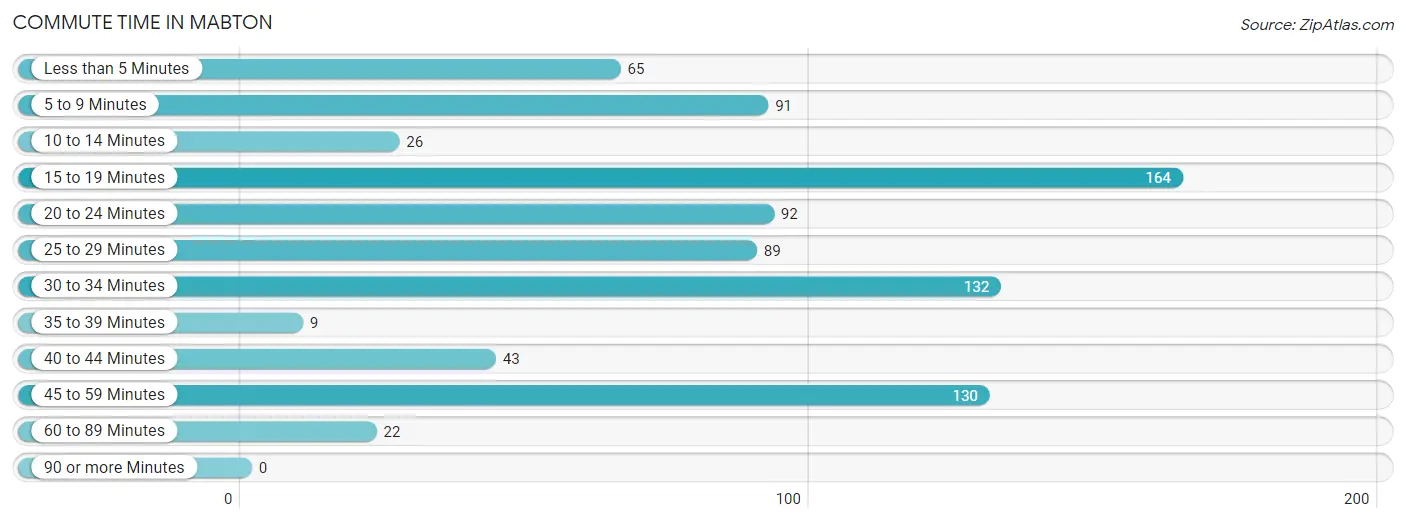
| Commute Time | # Commuters | % Commuters |
| Less than 5 Minutes | 65 | 7.5% |
| 5 to 9 Minutes | 91 | 10.5% |
| 10 to 14 Minutes | 26 | 3.0% |
| 15 to 19 Minutes | 164 | 19.0% |
| 20 to 24 Minutes | 92 | 10.7% |
| 25 to 29 Minutes | 89 | 10.3% |
| 30 to 34 Minutes | 132 | 15.3% |
| 35 to 39 Minutes | 9 | 1.0% |
| 40 to 44 Minutes | 43 | 5.0% |
| 45 to 59 Minutes | 130 | 15.1% |
| 60 to 89 Minutes | 22 | 2.5% |
| 90 or more Minutes | 0 | 0.0% |
Commute Time by Sex in Mabton
The most common commute times in Mabton are 15 to 19 minutes (102 commuters, 22.4%) for males and 15 to 19 minutes (62 commuters, 15.2%) for females.
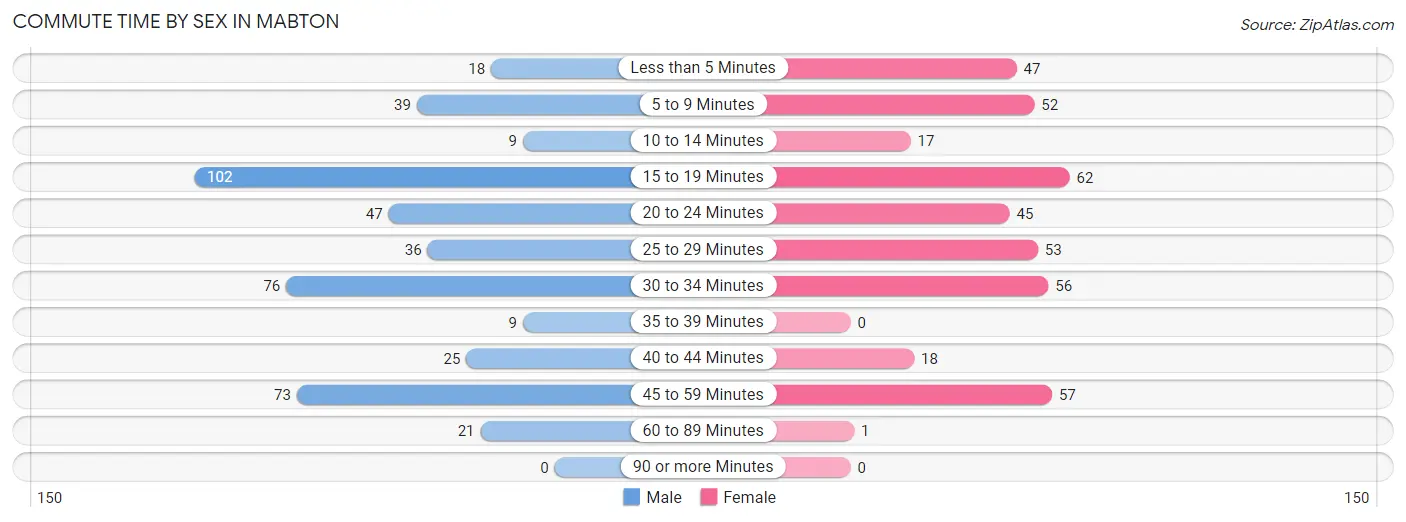
| Commute Time | Male | Female |
| Less than 5 Minutes | 18 (4.0%) | 47 (11.5%) |
| 5 to 9 Minutes | 39 (8.6%) | 52 (12.8%) |
| 10 to 14 Minutes | 9 (2.0%) | 17 (4.2%) |
| 15 to 19 Minutes | 102 (22.4%) | 62 (15.2%) |
| 20 to 24 Minutes | 47 (10.3%) | 45 (11.0%) |
| 25 to 29 Minutes | 36 (7.9%) | 53 (13.0%) |
| 30 to 34 Minutes | 76 (16.7%) | 56 (13.7%) |
| 35 to 39 Minutes | 9 (2.0%) | 0 (0.0%) |
| 40 to 44 Minutes | 25 (5.5%) | 18 (4.4%) |
| 45 to 59 Minutes | 73 (16.0%) | 57 (14.0%) |
| 60 to 89 Minutes | 21 (4.6%) | 1 (0.3%) |
| 90 or more Minutes | 0 (0.0%) | 0 (0.0%) |
Time of Departure to Work by Sex in Mabton
The most frequent times of departure to work in Mabton are 5:00 AM to 5:29 AM (86, 18.9%) for males and 6:00 AM to 6:29 AM (88, 21.6%) for females.
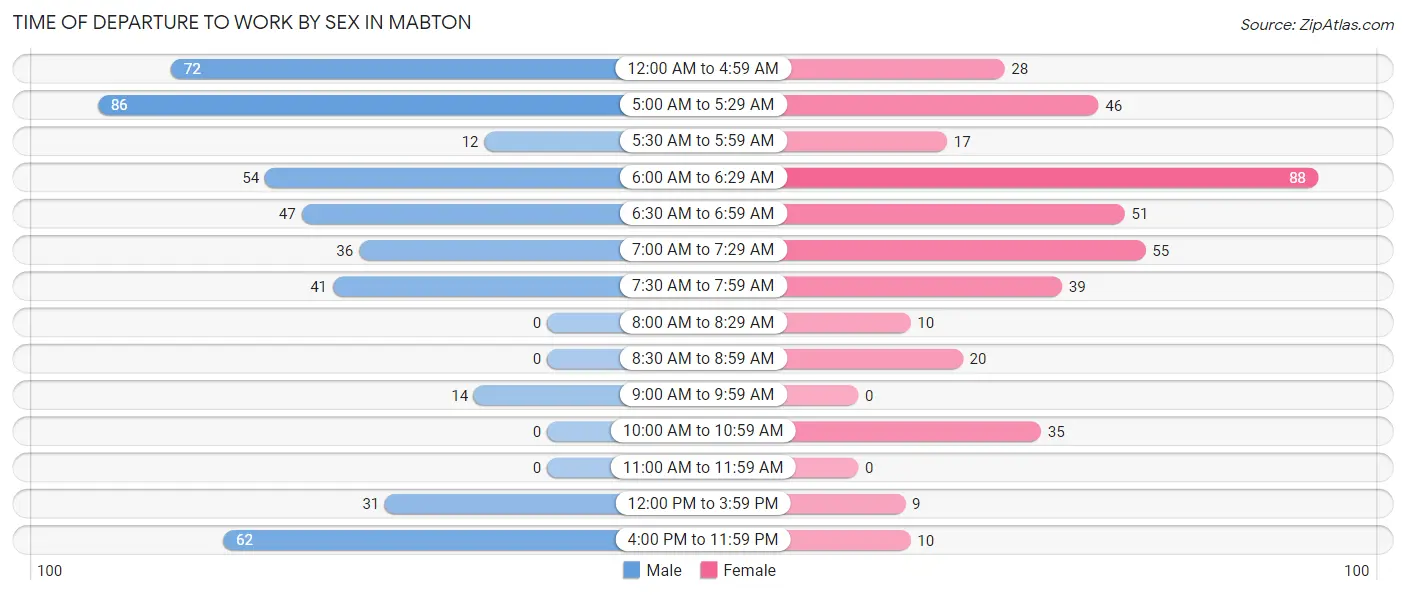
| Time of Departure | Male | Female |
| 12:00 AM to 4:59 AM | 72 (15.8%) | 28 (6.9%) |
| 5:00 AM to 5:29 AM | 86 (18.9%) | 46 (11.3%) |
| 5:30 AM to 5:59 AM | 12 (2.6%) | 17 (4.2%) |
| 6:00 AM to 6:29 AM | 54 (11.9%) | 88 (21.6%) |
| 6:30 AM to 6:59 AM | 47 (10.3%) | 51 (12.5%) |
| 7:00 AM to 7:29 AM | 36 (7.9%) | 55 (13.5%) |
| 7:30 AM to 7:59 AM | 41 (9.0%) | 39 (9.6%) |
| 8:00 AM to 8:29 AM | 0 (0.0%) | 10 (2.5%) |
| 8:30 AM to 8:59 AM | 0 (0.0%) | 20 (4.9%) |
| 9:00 AM to 9:59 AM | 14 (3.1%) | 0 (0.0%) |
| 10:00 AM to 10:59 AM | 0 (0.0%) | 35 (8.6%) |
| 11:00 AM to 11:59 AM | 0 (0.0%) | 0 (0.0%) |
| 12:00 PM to 3:59 PM | 31 (6.8%) | 9 (2.2%) |
| 4:00 PM to 11:59 PM | 62 (13.6%) | 10 (2.5%) |
| Total | 455 (100.0%) | 408 (100.0%) |
Housing Occupancy in Mabton
Occupancy by Ownership in Mabton
Of the total 568 dwellings in Mabton, owner-occupied units account for 327 (57.6%), while renter-occupied units make up 241 (42.4%).
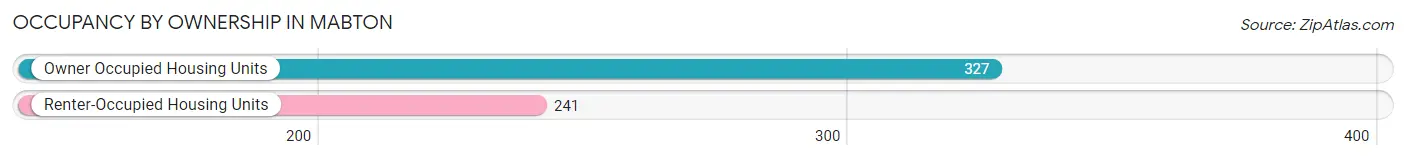
| Occupancy | # Housing Units | % Housing Units |
| Owner Occupied Housing Units | 327 | 57.6% |
| Renter-Occupied Housing Units | 241 | 42.4% |
| Total Occupied Housing Units | 568 | 100.0% |
Occupancy by Household Size in Mabton
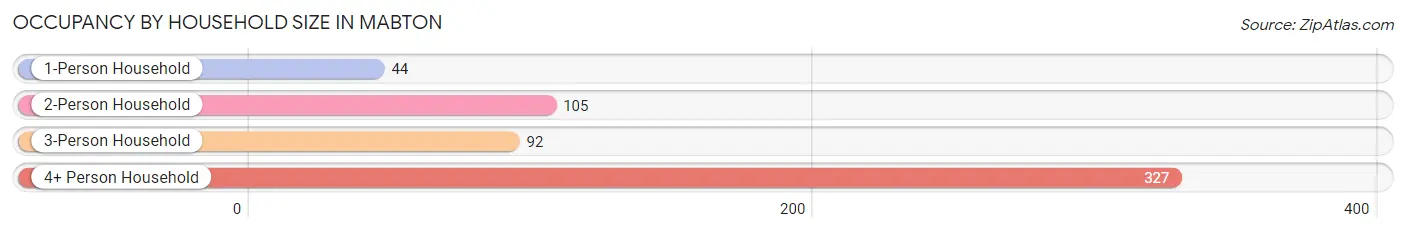
| Household Size | # Housing Units | % Housing Units |
| 1-Person Household | 44 | 7.7% |
| 2-Person Household | 105 | 18.5% |
| 3-Person Household | 92 | 16.2% |
| 4+ Person Household | 327 | 57.6% |
| Total Housing Units | 568 | 100.0% |
Occupancy by Ownership by Household Size in Mabton
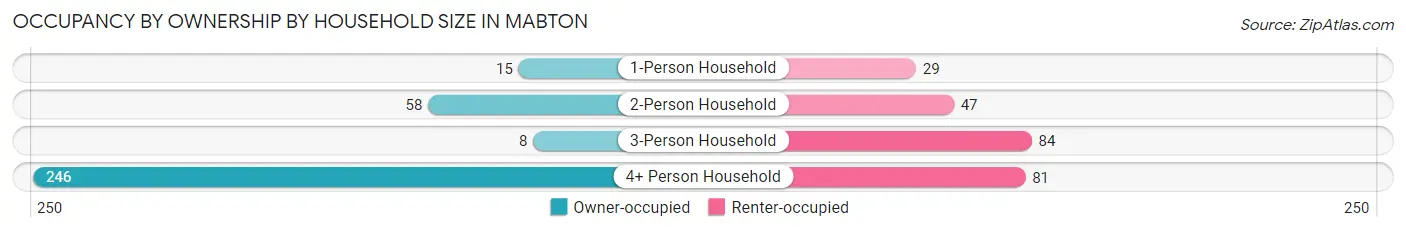
| Household Size | Owner-occupied | Renter-occupied |
| 1-Person Household | 15 (34.1%) | 29 (65.9%) |
| 2-Person Household | 58 (55.2%) | 47 (44.8%) |
| 3-Person Household | 8 (8.7%) | 84 (91.3%) |
| 4+ Person Household | 246 (75.2%) | 81 (24.8%) |
| Total Housing Units | 327 (57.6%) | 241 (42.4%) |
Occupancy by Educational Attainment in Mabton
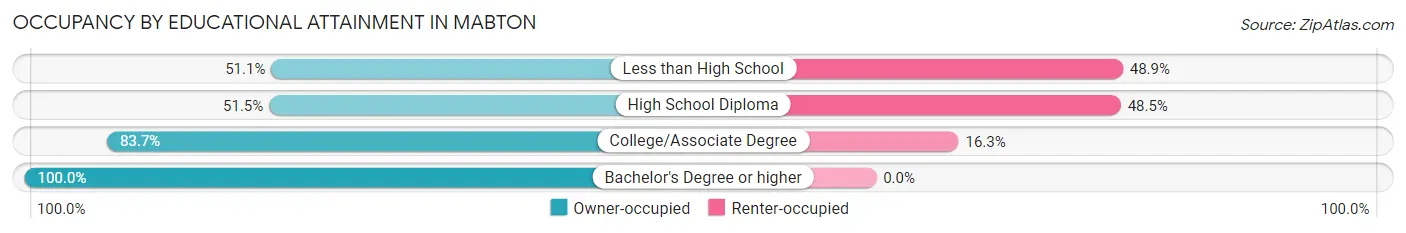
| Household Size | Owner-occupied | Renter-occupied |
| Less than High School | 185 (51.1%) | 177 (48.9%) |
| High School Diploma | 51 (51.5%) | 48 (48.5%) |
| College/Associate Degree | 82 (83.7%) | 16 (16.3%) |
| Bachelor's Degree or higher | 9 (100.0%) | 0 (0.0%) |
Occupancy by Age of Householder in Mabton
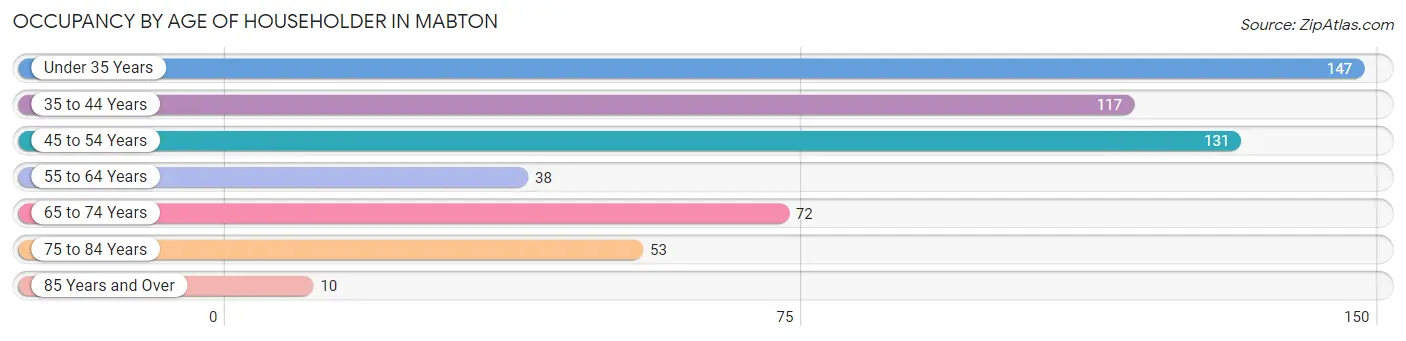
| Age Bracket | # Households | % Households |
| Under 35 Years | 147 | 25.9% |
| 35 to 44 Years | 117 | 20.6% |
| 45 to 54 Years | 131 | 23.1% |
| 55 to 64 Years | 38 | 6.7% |
| 65 to 74 Years | 72 | 12.7% |
| 75 to 84 Years | 53 | 9.3% |
| 85 Years and Over | 10 | 1.8% |
| Total | 568 | 100.0% |
Housing Finances in Mabton
Median Income by Occupancy in Mabton
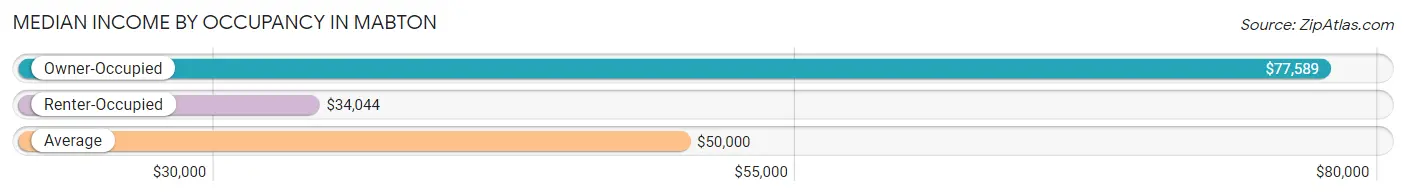
| Occupancy Type | # Households | Median Income |
| Owner-Occupied | 327 (57.6%) | $77,589 |
| Renter-Occupied | 241 (42.4%) | $34,044 |
| Average | 568 (100.0%) | $50,000 |
Occupancy by Householder Income Bracket in Mabton
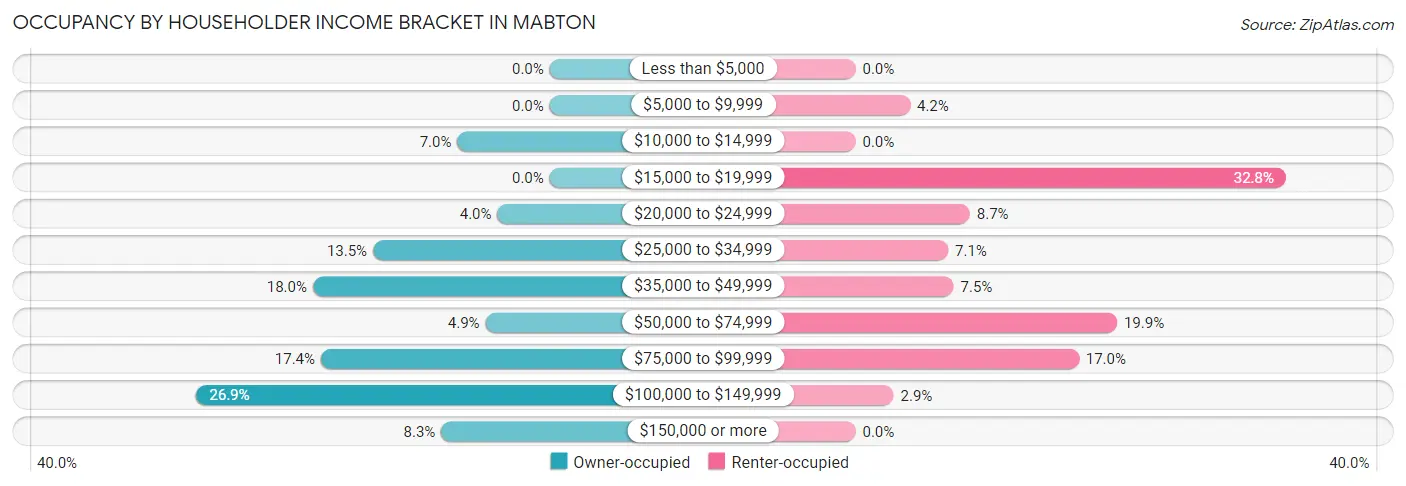
| Income Bracket | Owner-occupied | Renter-occupied |
| Less than $5,000 | 0 (0.0%) | 0 (0.0%) |
| $5,000 to $9,999 | 0 (0.0%) | 10 (4.2%) |
| $10,000 to $14,999 | 23 (7.0%) | 0 (0.0%) |
| $15,000 to $19,999 | 0 (0.0%) | 79 (32.8%) |
| $20,000 to $24,999 | 13 (4.0%) | 21 (8.7%) |
| $25,000 to $34,999 | 44 (13.5%) | 17 (7.0%) |
| $35,000 to $49,999 | 59 (18.0%) | 18 (7.5%) |
| $50,000 to $74,999 | 16 (4.9%) | 48 (19.9%) |
| $75,000 to $99,999 | 57 (17.4%) | 41 (17.0%) |
| $100,000 to $149,999 | 88 (26.9%) | 7 (2.9%) |
| $150,000 or more | 27 (8.3%) | 0 (0.0%) |
| Total | 327 (100.0%) | 241 (100.0%) |
Monthly Housing Cost Tiers in Mabton
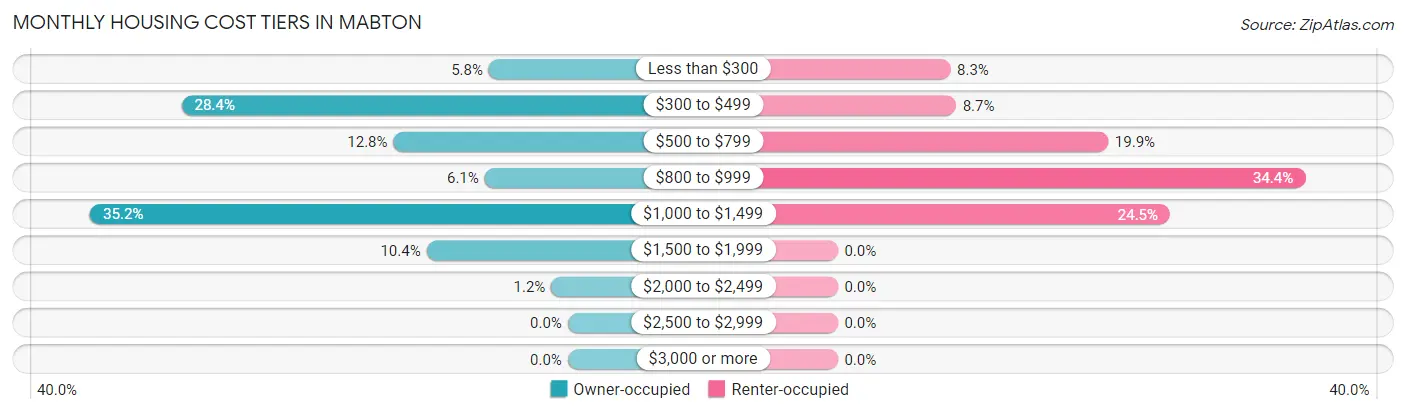
| Monthly Cost | Owner-occupied | Renter-occupied |
| Less than $300 | 19 (5.8%) | 20 (8.3%) |
| $300 to $499 | 93 (28.4%) | 21 (8.7%) |
| $500 to $799 | 42 (12.8%) | 48 (19.9%) |
| $800 to $999 | 20 (6.1%) | 83 (34.4%) |
| $1,000 to $1,499 | 115 (35.2%) | 59 (24.5%) |
| $1,500 to $1,999 | 34 (10.4%) | 0 (0.0%) |
| $2,000 to $2,499 | 4 (1.2%) | 0 (0.0%) |
| $2,500 to $2,999 | 0 (0.0%) | 0 (0.0%) |
| $3,000 or more | 0 (0.0%) | 0 (0.0%) |
| Total | 327 (100.0%) | 241 (100.0%) |
Physical Housing Characteristics in Mabton
Housing Structures in Mabton
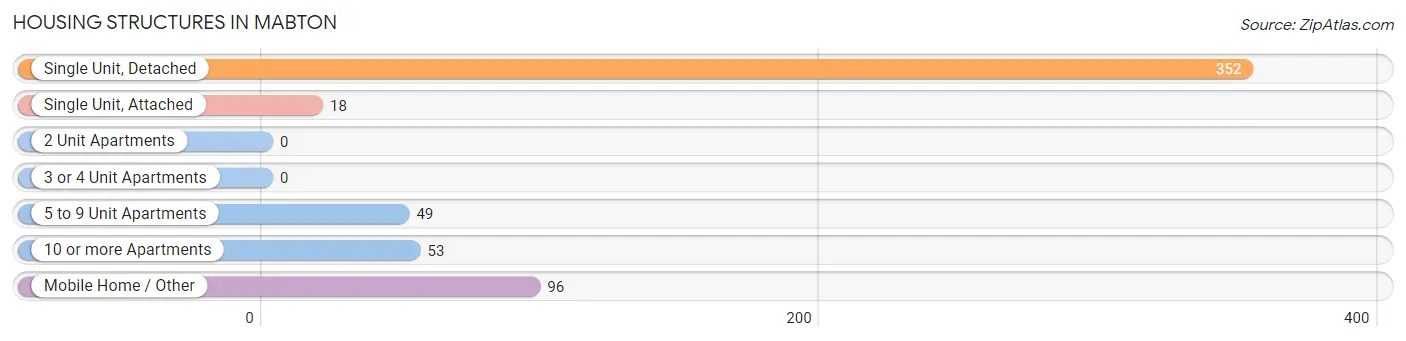
| Structure Type | # Housing Units | % Housing Units |
| Single Unit, Detached | 352 | 62.0% |
| Single Unit, Attached | 18 | 3.2% |
| 2 Unit Apartments | 0 | 0.0% |
| 3 or 4 Unit Apartments | 0 | 0.0% |
| 5 to 9 Unit Apartments | 49 | 8.6% |
| 10 or more Apartments | 53 | 9.3% |
| Mobile Home / Other | 96 | 16.9% |
| Total | 568 | 100.0% |
Housing Structures by Occupancy in Mabton
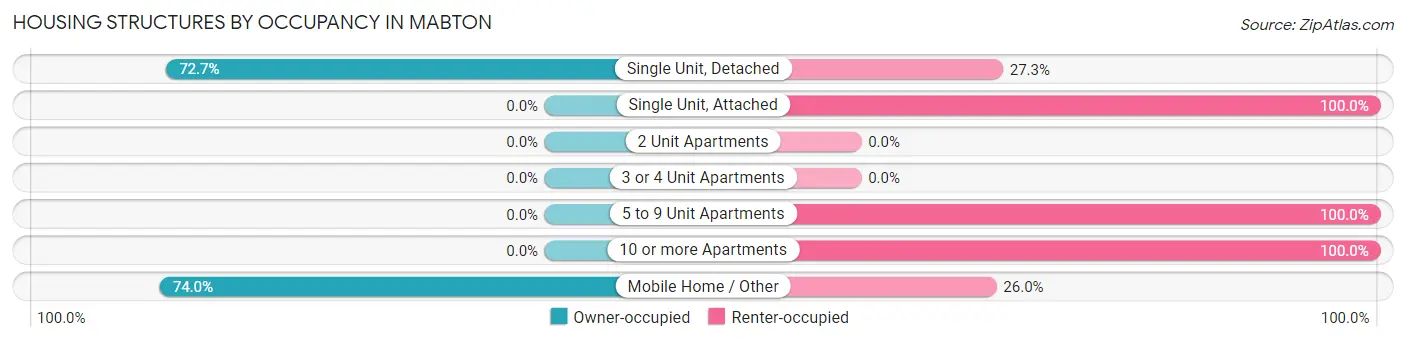
| Structure Type | Owner-occupied | Renter-occupied |
| Single Unit, Detached | 256 (72.7%) | 96 (27.3%) |
| Single Unit, Attached | 0 (0.0%) | 18 (100.0%) |
| 2 Unit Apartments | 0 (0.0%) | 0 (0.0%) |
| 3 or 4 Unit Apartments | 0 (0.0%) | 0 (0.0%) |
| 5 to 9 Unit Apartments | 0 (0.0%) | 49 (100.0%) |
| 10 or more Apartments | 0 (0.0%) | 53 (100.0%) |
| Mobile Home / Other | 71 (74.0%) | 25 (26.0%) |
| Total | 327 (57.6%) | 241 (42.4%) |
Housing Structures by Number of Rooms in Mabton
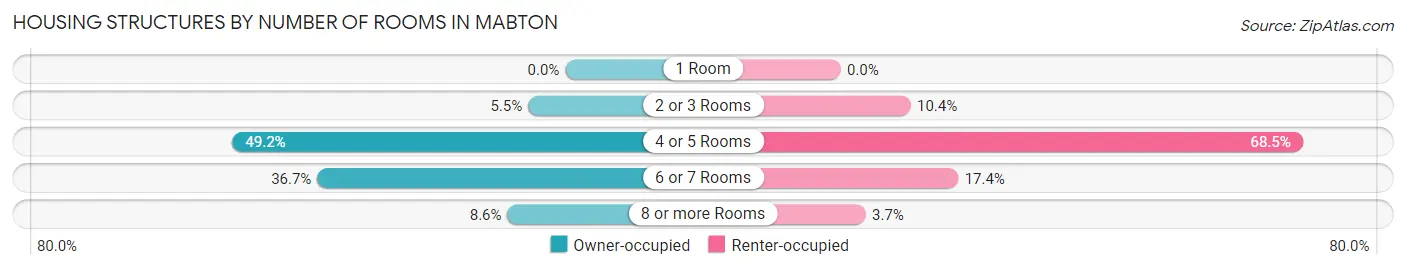
| Number of Rooms | Owner-occupied | Renter-occupied |
| 1 Room | 0 (0.0%) | 0 (0.0%) |
| 2 or 3 Rooms | 18 (5.5%) | 25 (10.4%) |
| 4 or 5 Rooms | 161 (49.2%) | 165 (68.5%) |
| 6 or 7 Rooms | 120 (36.7%) | 42 (17.4%) |
| 8 or more Rooms | 28 (8.6%) | 9 (3.7%) |
| Total | 327 (100.0%) | 241 (100.0%) |
Housing Structure by Heating Type in Mabton
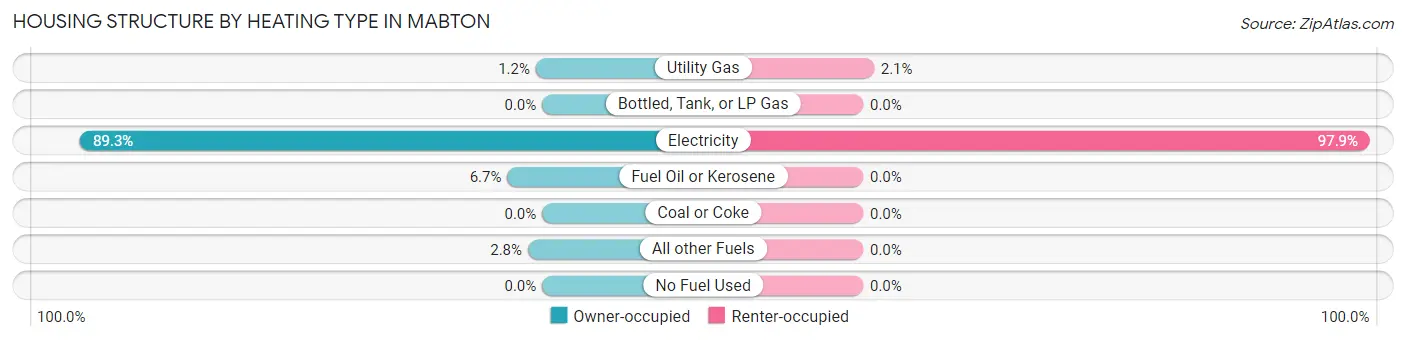
| Heating Type | Owner-occupied | Renter-occupied |
| Utility Gas | 4 (1.2%) | 5 (2.1%) |
| Bottled, Tank, or LP Gas | 0 (0.0%) | 0 (0.0%) |
| Electricity | 292 (89.3%) | 236 (97.9%) |
| Fuel Oil or Kerosene | 22 (6.7%) | 0 (0.0%) |
| Coal or Coke | 0 (0.0%) | 0 (0.0%) |
| All other Fuels | 9 (2.8%) | 0 (0.0%) |
| No Fuel Used | 0 (0.0%) | 0 (0.0%) |
| Total | 327 (100.0%) | 241 (100.0%) |
Household Vehicle Usage in Mabton
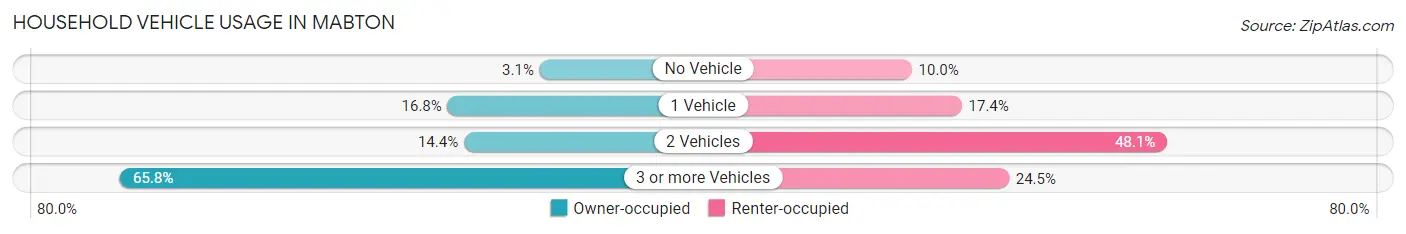
| Vehicles per Household | Owner-occupied | Renter-occupied |
| No Vehicle | 10 (3.1%) | 24 (10.0%) |
| 1 Vehicle | 55 (16.8%) | 42 (17.4%) |
| 2 Vehicles | 47 (14.4%) | 116 (48.1%) |
| 3 or more Vehicles | 215 (65.7%) | 59 (24.5%) |
| Total | 327 (100.0%) | 241 (100.0%) |
Real Estate & Mortgages in Mabton
Real Estate and Mortgage Overview in Mabton
| Characteristic | Without Mortgage | With Mortgage |
| Housing Units | 154 | 173 |
| Median Property Value | $103,400 | $164,200 |
| Median Household Income | - | - |
| Monthly Housing Costs | $400 | $0 |
| Real Estate Taxes | $1,056 | $0 |
Property Value by Mortgage Status in Mabton
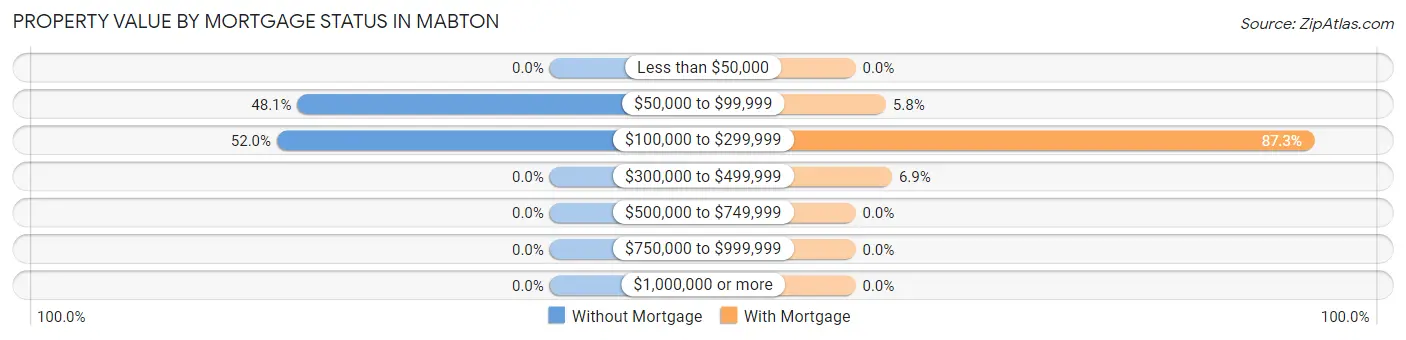
| Property Value | Without Mortgage | With Mortgage |
| Less than $50,000 | 0 (0.0%) | 0 (0.0%) |
| $50,000 to $99,999 | 74 (48.0%) | 10 (5.8%) |
| $100,000 to $299,999 | 80 (51.9%) | 151 (87.3%) |
| $300,000 to $499,999 | 0 (0.0%) | 12 (6.9%) |
| $500,000 to $749,999 | 0 (0.0%) | 0 (0.0%) |
| $750,000 to $999,999 | 0 (0.0%) | 0 (0.0%) |
| $1,000,000 or more | 0 (0.0%) | 0 (0.0%) |
| Total | 154 (100.0%) | 173 (100.0%) |
Household Income by Mortgage Status in Mabton
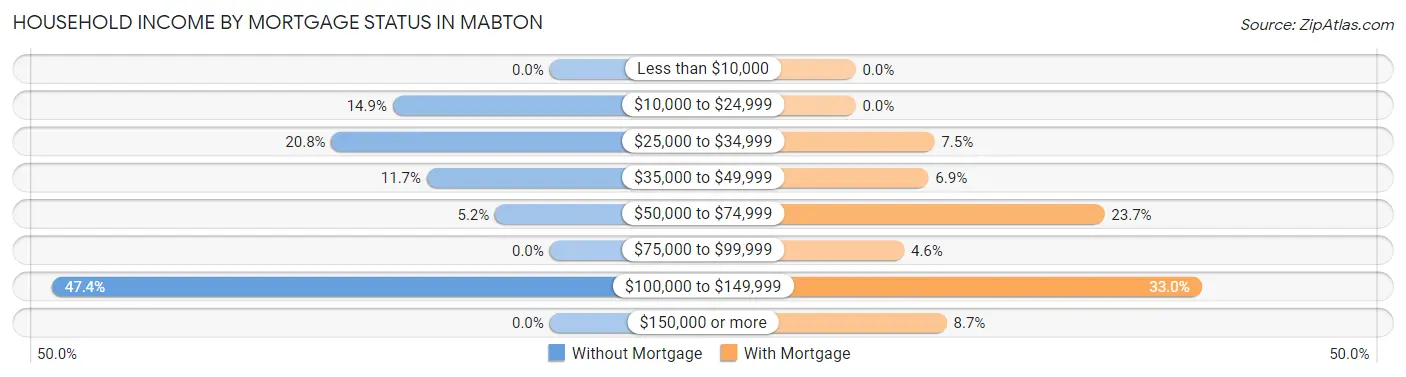
| Household Income | Without Mortgage | With Mortgage |
| Less than $10,000 | 0 (0.0%) | 0 (0.0%) |
| $10,000 to $24,999 | 23 (14.9%) | 0 (0.0%) |
| $25,000 to $34,999 | 32 (20.8%) | 13 (7.5%) |
| $35,000 to $49,999 | 18 (11.7%) | 12 (6.9%) |
| $50,000 to $74,999 | 8 (5.2%) | 41 (23.7%) |
| $75,000 to $99,999 | 0 (0.0%) | 8 (4.6%) |
| $100,000 to $149,999 | 73 (47.4%) | 57 (33.0%) |
| $150,000 or more | 0 (0.0%) | 15 (8.7%) |
| Total | 154 (100.0%) | 173 (100.0%) |
Property Value to Household Income Ratio in Mabton
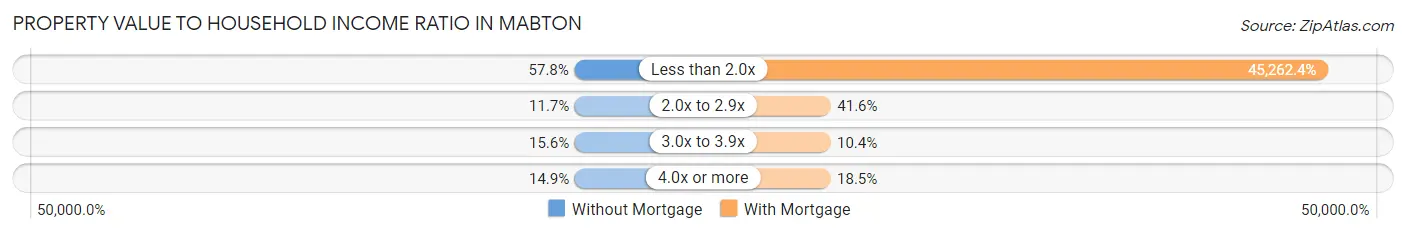
| Value-to-Income Ratio | Without Mortgage | With Mortgage |
| Less than 2.0x | 89 (57.8%) | 78,304 (45,262.4%) |
| 2.0x to 2.9x | 18 (11.7%) | 72 (41.6%) |
| 3.0x to 3.9x | 24 (15.6%) | 18 (10.4%) |
| 4.0x or more | 23 (14.9%) | 32 (18.5%) |
| Total | 154 (100.0%) | 173 (100.0%) |
Real Estate Taxes by Mortgage Status in Mabton
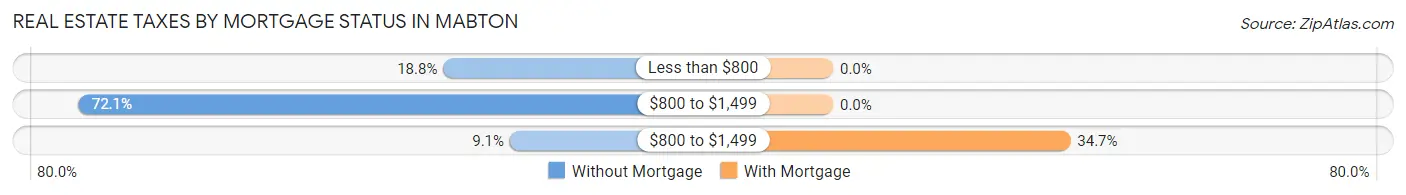
| Property Taxes | Without Mortgage | With Mortgage |
| Less than $800 | 29 (18.8%) | 0 (0.0%) |
| $800 to $1,499 | 111 (72.1%) | 0 (0.0%) |
| $800 to $1,499 | 14 (9.1%) | 60 (34.7%) |
| Total | 154 (100.0%) | 173 (100.0%) |
Health & Disability in Mabton
Health Insurance Coverage by Age in Mabton
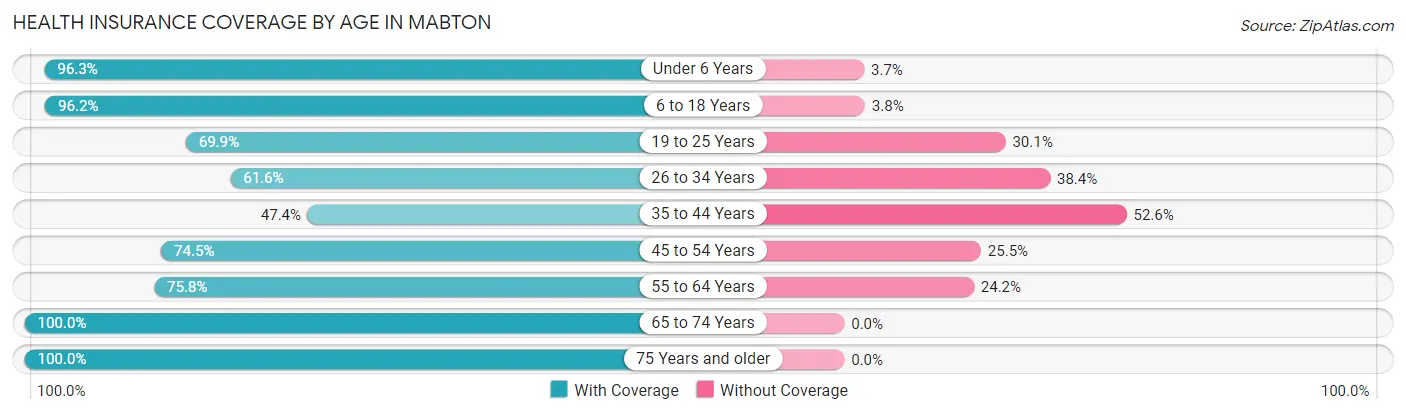
| Age Bracket | With Coverage | Without Coverage |
| Under 6 Years | 286 (96.3%) | 11 (3.7%) |
| 6 to 18 Years | 601 (96.2%) | 24 (3.8%) |
| 19 to 25 Years | 242 (69.9%) | 104 (30.1%) |
| 26 to 34 Years | 159 (61.6%) | 99 (38.4%) |
| 35 to 44 Years | 108 (47.4%) | 120 (52.6%) |
| 45 to 54 Years | 158 (74.5%) | 54 (25.5%) |
| 55 to 64 Years | 113 (75.8%) | 36 (24.2%) |
| 65 to 74 Years | 110 (100.0%) | 0 (0.0%) |
| 75 Years and older | 89 (100.0%) | 0 (0.0%) |
| Total | 1,866 (80.6%) | 448 (19.4%) |
Health Insurance Coverage by Citizenship Status in Mabton
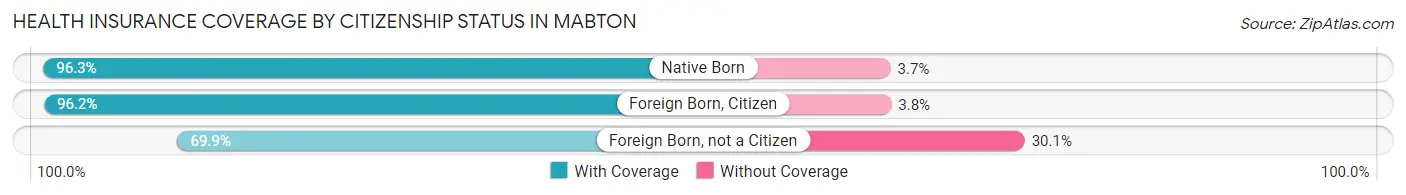
| Citizenship Status | With Coverage | Without Coverage |
| Native Born | 286 (96.3%) | 11 (3.7%) |
| Foreign Born, Citizen | 601 (96.2%) | 24 (3.8%) |
| Foreign Born, not a Citizen | 242 (69.9%) | 104 (30.1%) |
Health Insurance Coverage by Household Income in Mabton
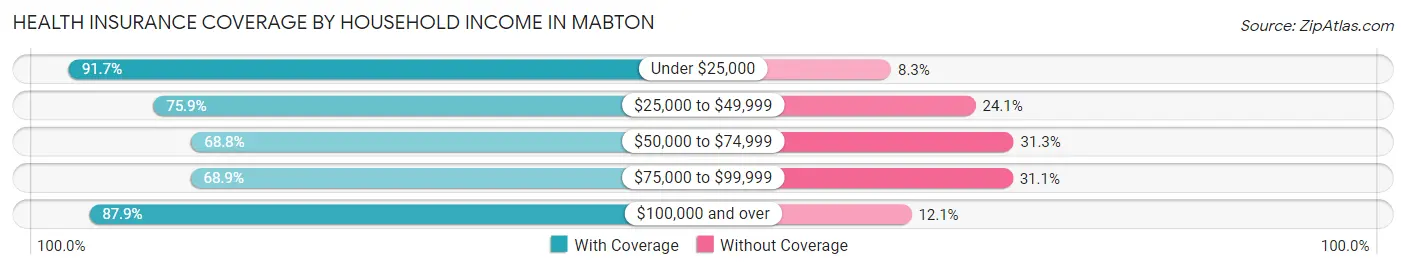
| Household Income | With Coverage | Without Coverage |
| Under $25,000 | 376 (91.7%) | 34 (8.3%) |
| $25,000 to $49,999 | 390 (75.9%) | 124 (24.1%) |
| $50,000 to $74,999 | 198 (68.8%) | 90 (31.2%) |
| $75,000 to $99,999 | 246 (68.9%) | 111 (31.1%) |
| $100,000 and over | 646 (87.9%) | 89 (12.1%) |
Public vs Private Health Insurance Coverage by Age in Mabton
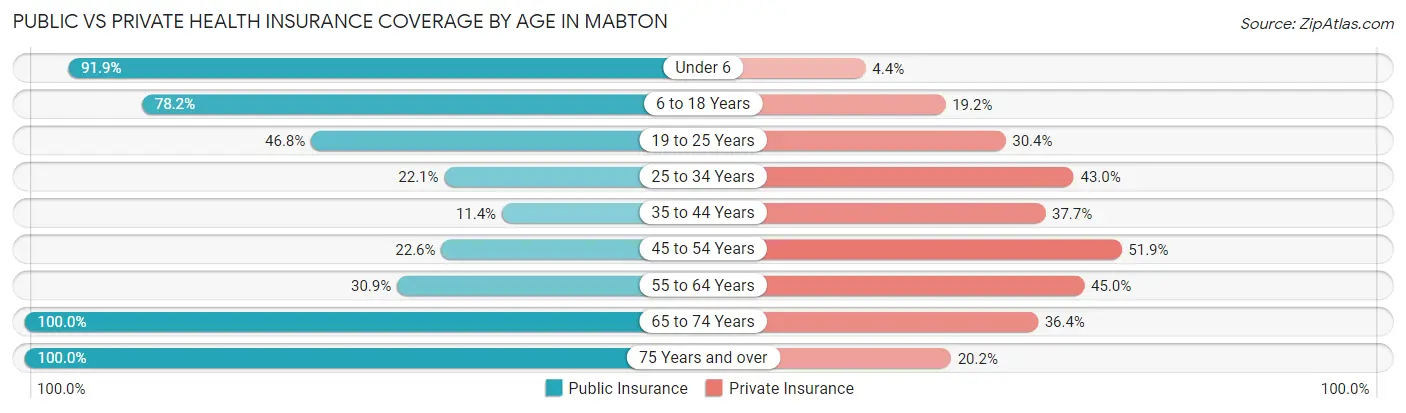
| Age Bracket | Public Insurance | Private Insurance |
| Under 6 | 273 (91.9%) | 13 (4.4%) |
| 6 to 18 Years | 489 (78.2%) | 120 (19.2%) |
| 19 to 25 Years | 162 (46.8%) | 105 (30.3%) |
| 25 to 34 Years | 57 (22.1%) | 111 (43.0%) |
| 35 to 44 Years | 26 (11.4%) | 86 (37.7%) |
| 45 to 54 Years | 48 (22.6%) | 110 (51.9%) |
| 55 to 64 Years | 46 (30.9%) | 67 (45.0%) |
| 65 to 74 Years | 110 (100.0%) | 40 (36.4%) |
| 75 Years and over | 89 (100.0%) | 18 (20.2%) |
| Total | 1,300 (56.2%) | 670 (28.9%) |
Disability Status by Sex by Age in Mabton
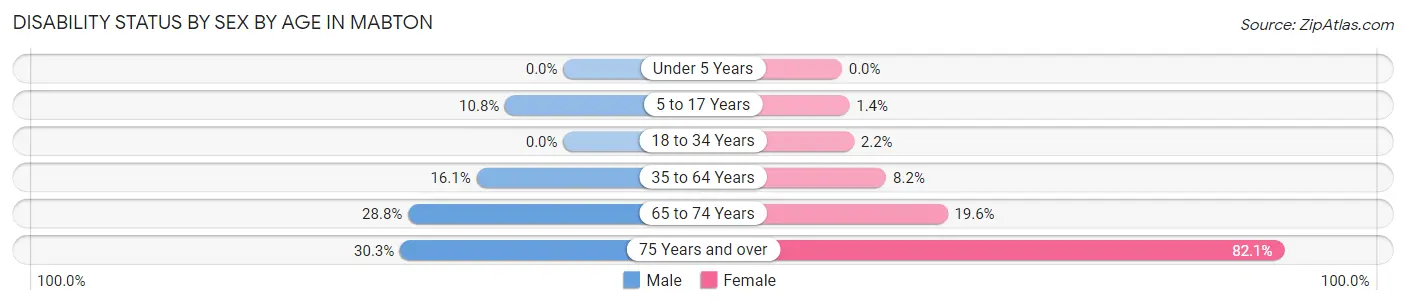
| Age Bracket | Male | Female |
| Under 5 Years | 0 (0.0%) | 0 (0.0%) |
| 5 to 17 Years | 38 (10.8%) | 4 (1.4%) |
| 18 to 34 Years | 0 (0.0%) | 7 (2.2%) |
| 35 to 64 Years | 44 (16.1%) | 26 (8.2%) |
| 65 to 74 Years | 17 (28.8%) | 10 (19.6%) |
| 75 Years and over | 10 (30.3%) | 46 (82.1%) |
Disability Class by Sex by Age in Mabton
Disability Class: Hearing Difficulty
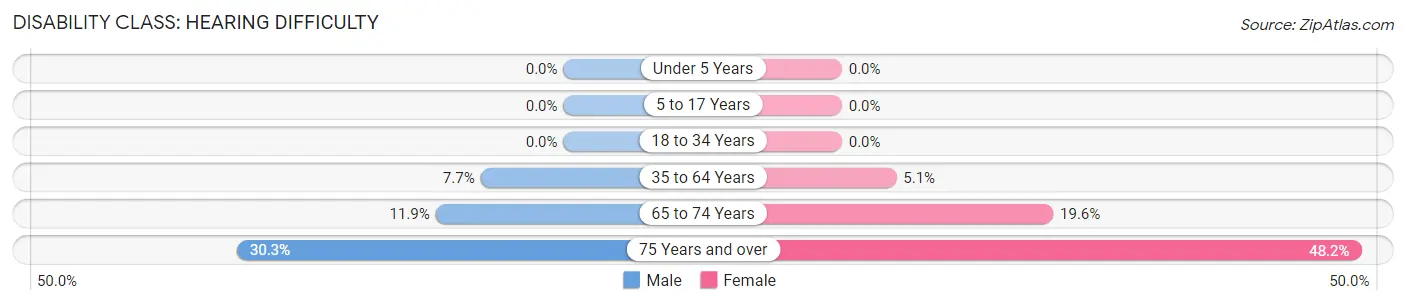
| Age Bracket | Male | Female |
| Under 5 Years | 0 (0.0%) | 0 (0.0%) |
| 5 to 17 Years | 0 (0.0%) | 0 (0.0%) |
| 18 to 34 Years | 0 (0.0%) | 0 (0.0%) |
| 35 to 64 Years | 21 (7.7%) | 16 (5.1%) |
| 65 to 74 Years | 7 (11.9%) | 10 (19.6%) |
| 75 Years and over | 10 (30.3%) | 27 (48.2%) |
Disability Class: Vision Difficulty
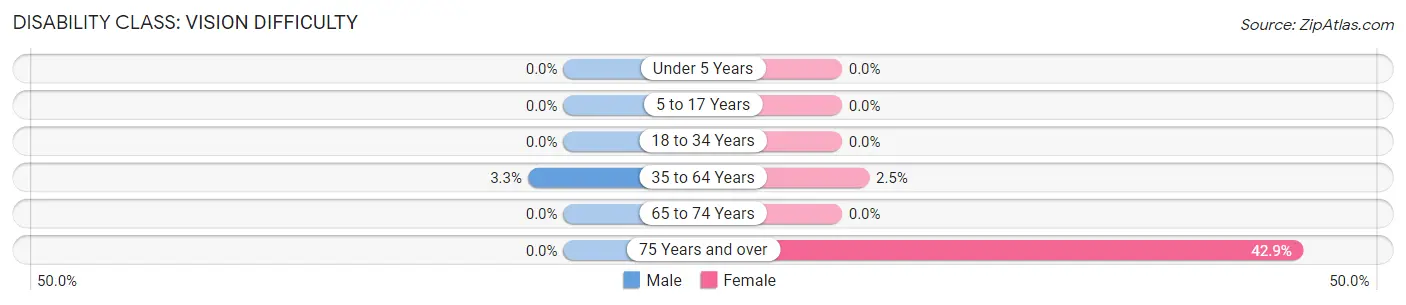
| Age Bracket | Male | Female |
| Under 5 Years | 0 (0.0%) | 0 (0.0%) |
| 5 to 17 Years | 0 (0.0%) | 0 (0.0%) |
| 18 to 34 Years | 0 (0.0%) | 0 (0.0%) |
| 35 to 64 Years | 9 (3.3%) | 8 (2.5%) |
| 65 to 74 Years | 0 (0.0%) | 0 (0.0%) |
| 75 Years and over | 0 (0.0%) | 24 (42.9%) |
Disability Class: Cognitive Difficulty
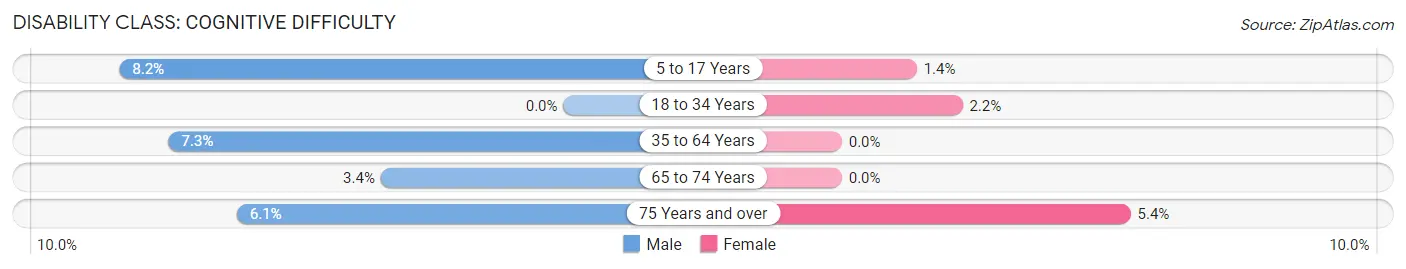
| Age Bracket | Male | Female |
| 5 to 17 Years | 29 (8.2%) | 4 (1.4%) |
| 18 to 34 Years | 0 (0.0%) | 7 (2.2%) |
| 35 to 64 Years | 20 (7.3%) | 0 (0.0%) |
| 65 to 74 Years | 2 (3.4%) | 0 (0.0%) |
| 75 Years and over | 2 (6.1%) | 3 (5.4%) |
Disability Class: Ambulatory Difficulty
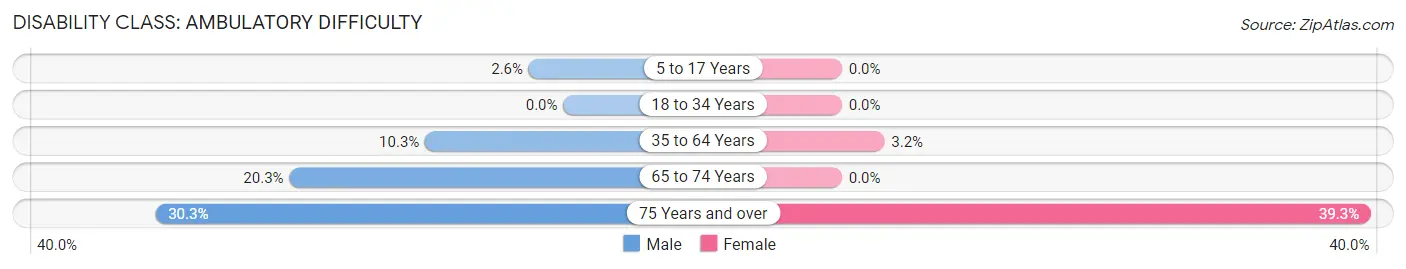
| Age Bracket | Male | Female |
| 5 to 17 Years | 9 (2.6%) | 0 (0.0%) |
| 18 to 34 Years | 0 (0.0%) | 0 (0.0%) |
| 35 to 64 Years | 28 (10.3%) | 10 (3.2%) |
| 65 to 74 Years | 12 (20.3%) | 0 (0.0%) |
| 75 Years and over | 10 (30.3%) | 22 (39.3%) |
Disability Class: Self-Care Difficulty
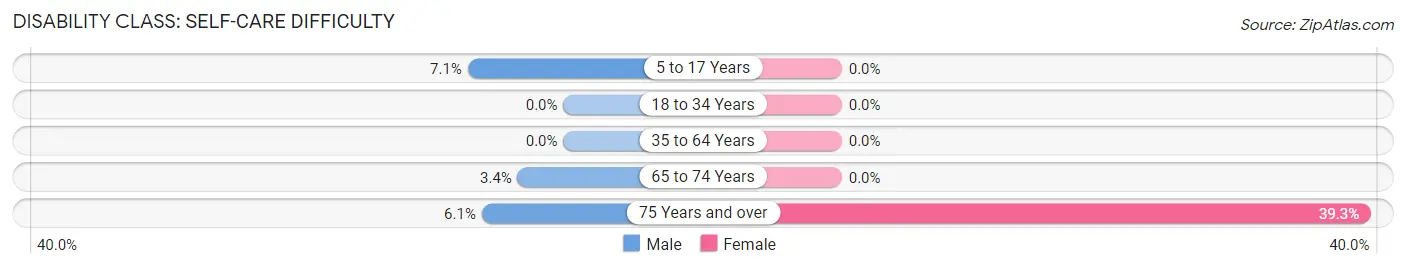
| Age Bracket | Male | Female |
| 5 to 17 Years | 25 (7.1%) | 0 (0.0%) |
| 18 to 34 Years | 0 (0.0%) | 0 (0.0%) |
| 35 to 64 Years | 0 (0.0%) | 0 (0.0%) |
| 65 to 74 Years | 2 (3.4%) | 0 (0.0%) |
| 75 Years and over | 2 (6.1%) | 22 (39.3%) |
Technology Access in Mabton
Computing Device Access in Mabton
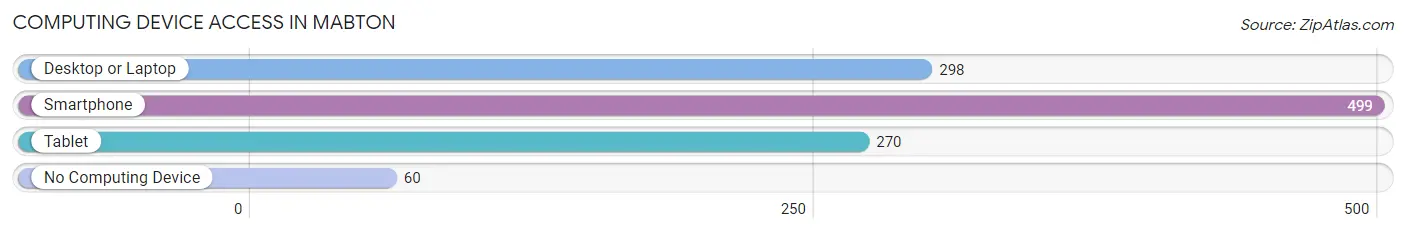
| Device Type | # Households | % Households |
| Desktop or Laptop | 298 | 52.5% |
| Smartphone | 499 | 87.8% |
| Tablet | 270 | 47.5% |
| No Computing Device | 60 | 10.6% |
| Total | 568 | 100.0% |
Internet Access in Mabton
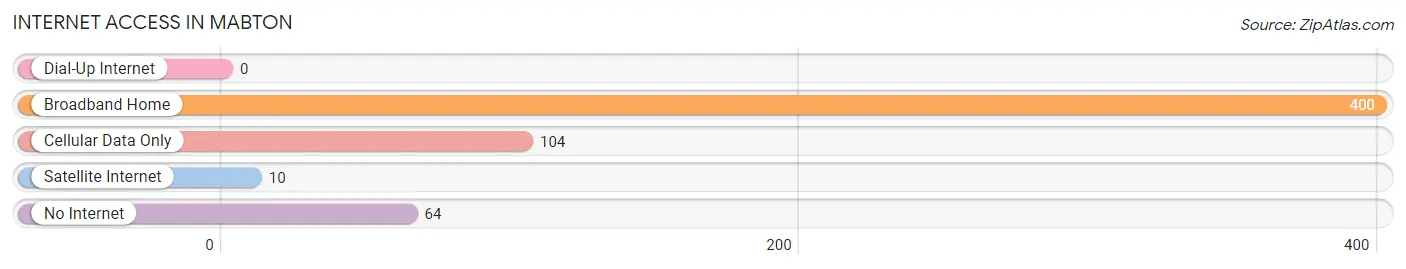
| Internet Type | # Households | % Households |
| Dial-Up Internet | 0 | 0.0% |
| Broadband Home | 400 | 70.4% |
| Cellular Data Only | 104 | 18.3% |
| Satellite Internet | 10 | 1.8% |
| No Internet | 64 | 11.3% |
| Total | 568 | 100.0% |
Mabton Summary
Mabton is a small town located in Yakima County, Washington, United States. It is situated in the Yakima Valley, approximately 10 miles south of the city of Yakima. The population of Mabton was 1,845 at the 2010 census.
History
Mabton was founded in 1906 by the Mabton Land Company, which was owned by the Northern Pacific Railway. The town was named after the Mabton family, who were early settlers in the area. The town was originally a farming community, and the main crops grown were apples, cherries, and hops.
In the early 1900s, Mabton was a thriving community with a variety of businesses, including a bank, a hotel, a movie theater, and a variety of stores. The town also had a school, a library, and a post office.
In the 1950s, the town began to decline as the local economy shifted away from agriculture. The population of Mabton decreased from 1,845 in 1950 to 1,541 in 2000.
Geography
Mabton is located in the Yakima Valley, which is part of the Columbia Plateau. The town is situated at an elevation of 1,072 feet above sea level. The climate in Mabton is semi-arid, with hot summers and cold winters.
The town is located near the Yakima River, which provides irrigation for the local farms. The town is also located near the Yakima Training Center, a military base that is used for training by the United States Army.
Economy
The economy of Mabton is largely based on agriculture. The main crops grown in the area are apples, cherries, hops, and grapes. The town also has a number of small businesses, including restaurants, stores, and service providers.
The town is also home to a number of manufacturing companies, including a canning factory and a wood products plant. The town is also home to a number of wineries, which produce a variety of wines.
Demographics
As of the 2010 census, the population of Mabton was 1,845. The racial makeup of the town was 75.3% White, 0.7% African American, 0.9% Native American, 0.3% Asian, 0.1% Pacific Islander, 19.2% from other races, and 3.5% from two or more races. Hispanic or Latino of any race were 33.2% of the population.
The median household income in Mabton was $31,250, and the median family income was $37,500. The per capita income in Mabton was $14,945. About 18.2% of the population was below the poverty line.
Conclusion
Mabton is a small town located in Yakima County, Washington. It was founded in 1906 and has a population of 1,845. The economy of Mabton is largely based on agriculture, and the town is also home to a number of manufacturing companies and wineries. The population of Mabton is diverse, with a majority of the population being Hispanic or Latino.
Common Questions
What is Per Capita Income in Mabton?
Per Capita income in Mabton is $16,478.
What is the Median Family Income in Mabton?
Median Family Income in Mabton is $50,694.
What is the Median Household income in Mabton?
Median Household Income in Mabton is $50,000.
What is Income or Wage Gap in Mabton?
Income or Wage Gap in Mabton is 18.4%.
Women in Mabton earn 81.6 cents for every dollar earned by a man.
What is Inequality or Gini Index in Mabton?
Inequality or Gini Index in Mabton is 0.41.
What is the Total Population of Mabton?
Total Population of Mabton is 2,314.
What is the Total Male Population of Mabton?
Total Male Population of Mabton is 1,175.
What is the Total Female Population of Mabton?
Total Female Population of Mabton is 1,139.
What is the Ratio of Males per 100 Females in Mabton?
There are 103.16 Males per 100 Females in Mabton.
What is the Ratio of Females per 100 Males in Mabton?
There are 96.94 Females per 100 Males in Mabton.
What is the Median Population Age in Mabton?
Median Population Age in Mabton is 24.3 Years.
What is the Average Family Size in Mabton
Average Family Size in Mabton is 4.2 People.
What is the Average Household Size in Mabton
Average Household Size in Mabton is 4.1 People.
How Large is the Labor Force in Mabton?
There are 1,046 People in the Labor Forcein in Mabton.
What is the Percentage of People in the Labor Force in Mabton?
67.6% of People are in the Labor Force in Mabton.
What is the Unemployment Rate in Mabton?
Unemployment Rate in Mabton is 9.6%.