Touchet, WA Map & Demographics
Touchet Map
Touchet Overview
$30,450
PER CAPITA INCOME
$93,333
AVG FAMILY INCOME
$94,083
AVG HOUSEHOLD INCOME
43.0%
WAGE / INCOME GAP [ % ]
57.0¢/ $1
WAGE / INCOME GAP [ $ ]
0.15
INEQUALITY / GINI INDEX
485
TOTAL POPULATION
252
MALE POPULATION
233
FEMALE POPULATION
108.15
MALES / 100 FEMALES
92.46
FEMALES / 100 MALES
40.0
MEDIAN AGE
2.9
AVG FAMILY SIZE
2.8
AVG HOUSEHOLD SIZE
228
LABOR FORCE [ PEOPLE ]
71.7%
PERCENT IN LABOR FORCE
Touchet Zip Codes
Touchet Area Codes
Income in Touchet
Income Overview in Touchet
Per Capita Income in Touchet is $30,450, while median incomes of families and households are $93,333 and $94,083 respectively.
| Characteristic | Number | Measure |
| Per Capita Income | 485 | $30,450 |
| Median Family Income | 156 | $93,333 |
| Mean Family Income | 156 | $91,026 |
| Median Household Income | 171 | $94,083 |
| Mean Household Income | 171 | $92,989 |
| Income Deficit | 156 | $0 |
| Wage / Income Gap (%) | 485 | 42.98% |
| Wage / Income Gap ($) | 485 | 57.02¢ per $1 |
| Gini / Inequality Index | 485 | 0.15 |
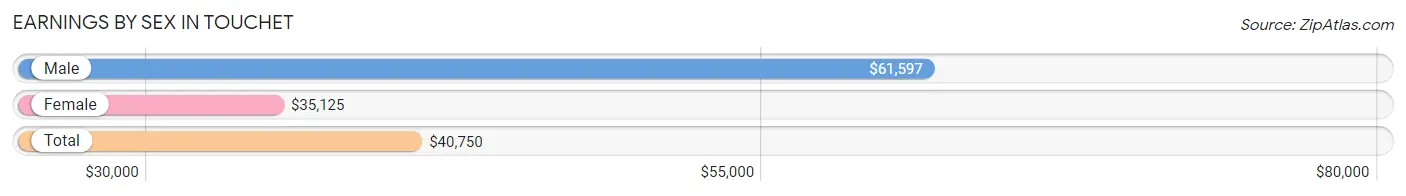
Earnings by Sex in Touchet
Average Earnings in Touchet are $40,750, $61,597 for men and $35,125 for women, a difference of 43.0%.
| Sex | Number | Average Earnings |
| Male | 121 (48.6%) | $61,597 |
| Female | 128 (51.4%) | $35,125 |
| Total | 249 (100.0%) | $40,750 |
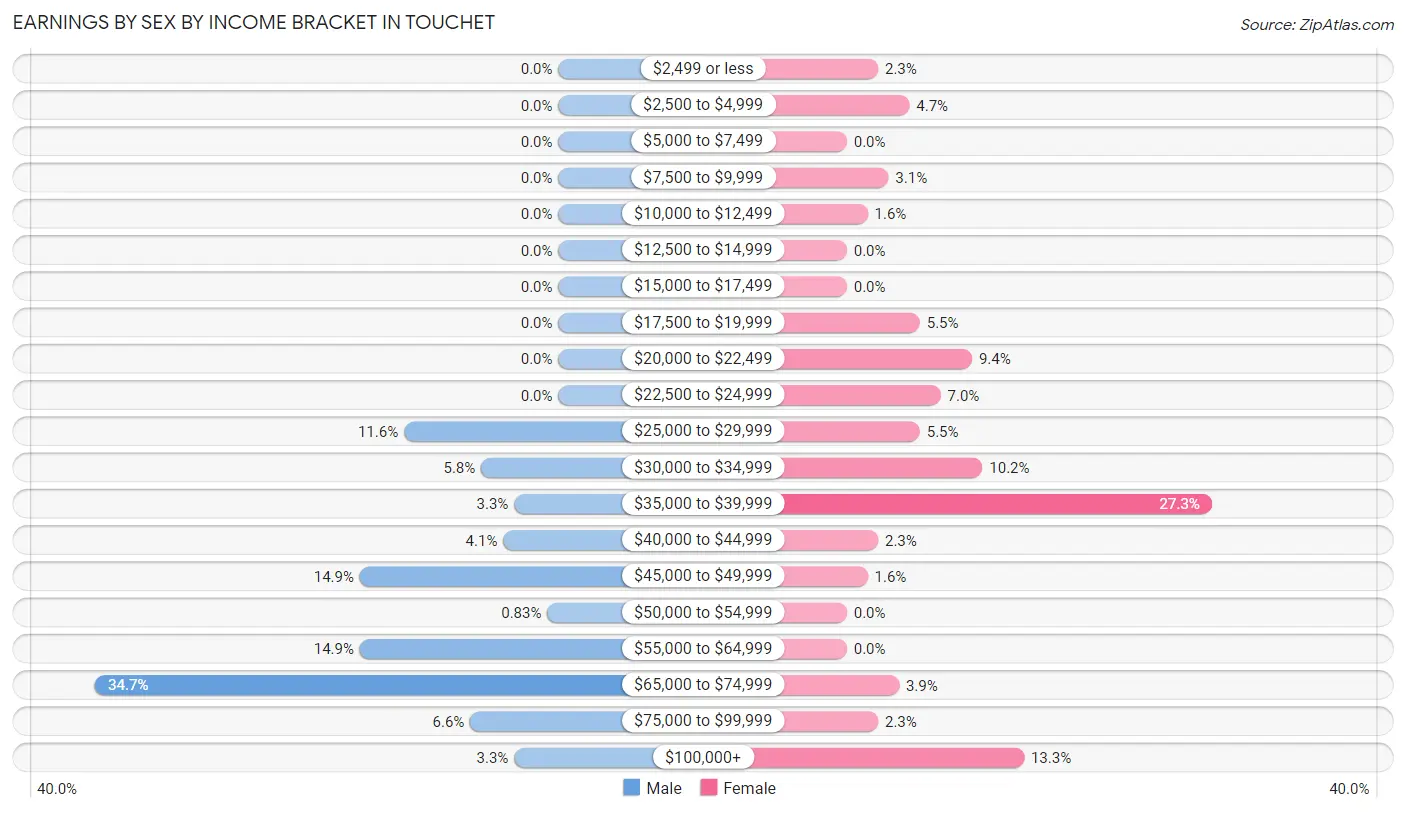
Earnings by Sex by Income Bracket in Touchet
The most common earnings brackets in Touchet are $65,000 to $74,999 for men (42 | 34.7%) and $35,000 to $39,999 for women (35 | 27.3%).
| Income | Male | Female |
| $2,499 or less | 0 (0.0%) | 3 (2.3%) |
| $2,500 to $4,999 | 0 (0.0%) | 6 (4.7%) |
| $5,000 to $7,499 | 0 (0.0%) | 0 (0.0%) |
| $7,500 to $9,999 | 0 (0.0%) | 4 (3.1%) |
| $10,000 to $12,499 | 0 (0.0%) | 2 (1.6%) |
| $12,500 to $14,999 | 0 (0.0%) | 0 (0.0%) |
| $15,000 to $17,499 | 0 (0.0%) | 0 (0.0%) |
| $17,500 to $19,999 | 0 (0.0%) | 7 (5.5%) |
| $20,000 to $22,499 | 0 (0.0%) | 12 (9.4%) |
| $22,500 to $24,999 | 0 (0.0%) | 9 (7.0%) |
| $25,000 to $29,999 | 14 (11.6%) | 7 (5.5%) |
| $30,000 to $34,999 | 7 (5.8%) | 13 (10.2%) |
| $35,000 to $39,999 | 4 (3.3%) | 35 (27.3%) |
| $40,000 to $44,999 | 5 (4.1%) | 3 (2.3%) |
| $45,000 to $49,999 | 18 (14.9%) | 2 (1.6%) |
| $50,000 to $54,999 | 1 (0.8%) | 0 (0.0%) |
| $55,000 to $64,999 | 18 (14.9%) | 0 (0.0%) |
| $65,000 to $74,999 | 42 (34.7%) | 5 (3.9%) |
| $75,000 to $99,999 | 8 (6.6%) | 3 (2.3%) |
| $100,000+ | 4 (3.3%) | 17 (13.3%) |
| Total | 121 (100.0%) | 128 (100.0%) |
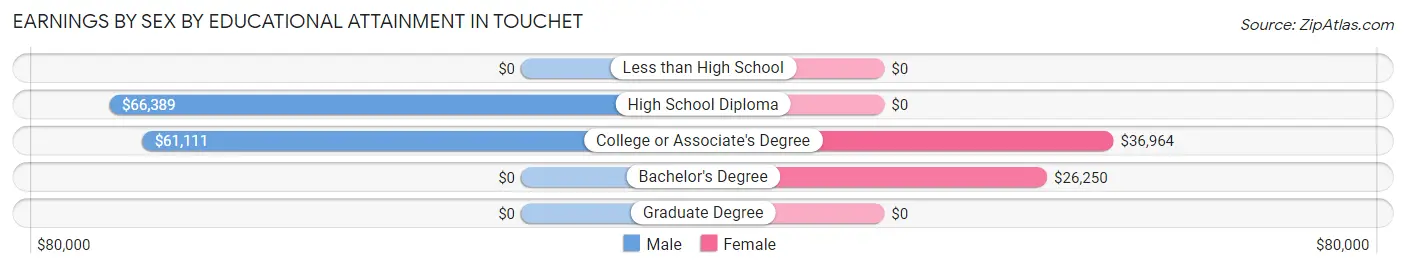
Earnings by Sex by Educational Attainment in Touchet
Average earnings in Touchet are $61,597 for men and $35,563 for women, a difference of 42.3%. Men with an educational attainment of high school diploma enjoy the highest average annual earnings of $66,389, while those with college or associate's degree education earn the least with $61,111. Women with an educational attainment of college or associate's degree earn the most with the average annual earnings of $36,964, while those with bachelor's degree education have the smallest earnings of $26,250.
| Educational Attainment | Male Income | Female Income |
| Less than High School | - | - |
| High School Diploma | $66,389 | $0 |
| College or Associate's Degree | $61,111 | $36,964 |
| Bachelor's Degree | - | - |
| Graduate Degree | - | - |
| Total | $61,597 | $35,563 |
Family Income in Touchet
Family Income Brackets in Touchet
According to the Touchet family income data, there are 66 families falling into the $75,000 to $99,999 income range, which is the most common income bracket and makes up 42.3% of all families.
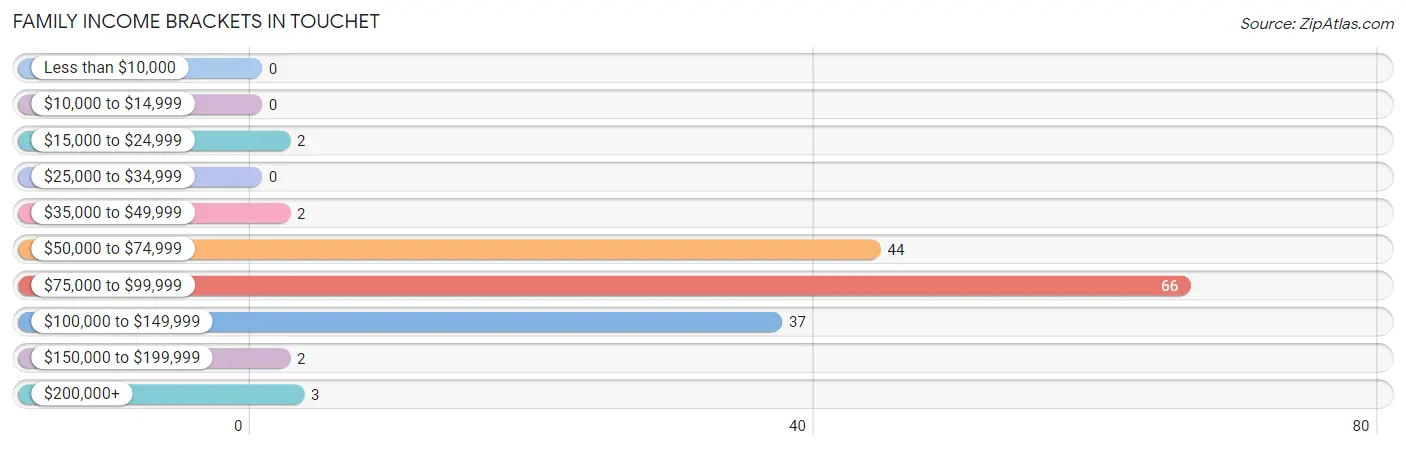
| Income Bracket | # Families | % Families |
| Less than $10,000 | 0 | 0.0% |
| $10,000 to $14,999 | 0 | 0.0% |
| $15,000 to $24,999 | 2 | 1.3% |
| $25,000 to $34,999 | 0 | 0.0% |
| $35,000 to $49,999 | 2 | 1.3% |
| $50,000 to $74,999 | 44 | 28.2% |
| $75,000 to $99,999 | 66 | 42.3% |
| $100,000 to $149,999 | 37 | 23.7% |
| $150,000 to $199,999 | 2 | 1.3% |
| $200,000+ | 3 | 1.9% |
Family Income by Famaliy Size in Touchet
4-person families (29 | 18.6%) account for the highest median family income in Touchet with $94,417 per family, while 2-person families (75 | 48.1%) have the highest median income of $39,453 per family member.
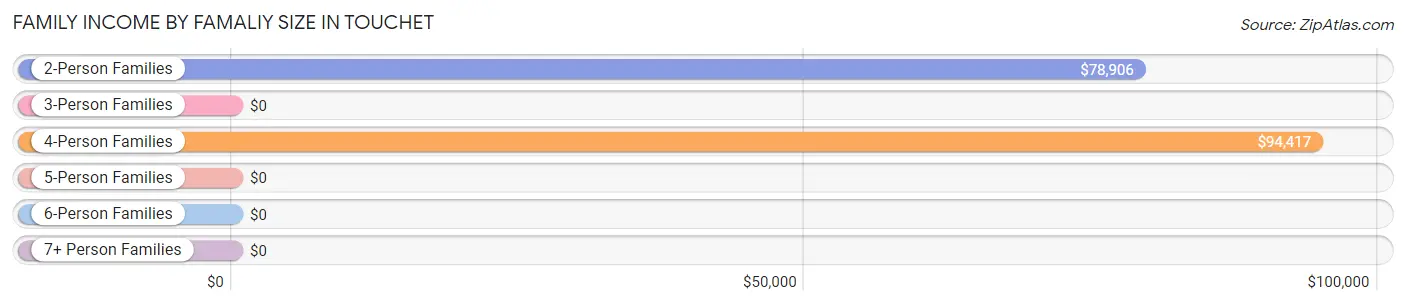
| Income Bracket | # Families | Median Income |
| 2-Person Families | 75 (48.1%) | $78,906 |
| 3-Person Families | 17 (10.9%) | $0 |
| 4-Person Families | 29 (18.6%) | $94,417 |
| 5-Person Families | 33 (21.1%) | $0 |
| 6-Person Families | 2 (1.3%) | $0 |
| 7+ Person Families | 0 (0.0%) | $0 |
| Total | 156 (100.0%) | $93,333 |
Family Income by Number of Earners in Touchet
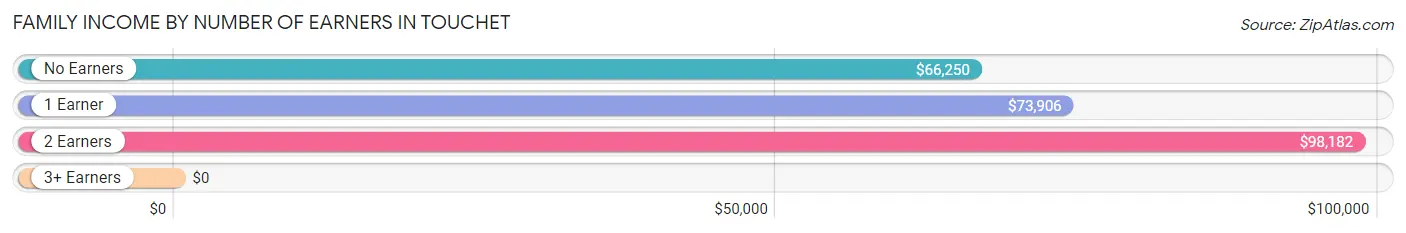
| Number of Earners | # Families | Median Income |
| No Earners | 7 (4.5%) | $66,250 |
| 1 Earner | 47 (30.1%) | $73,906 |
| 2 Earners | 98 (62.8%) | $98,182 |
| 3+ Earners | 4 (2.6%) | $0 |
| Total | 156 (100.0%) | $93,333 |
Household Income in Touchet
Household Income Brackets in Touchet
With 74 households falling in the category, the $75,000 to $99,999 income range is the most frequent in Touchet, accounting for 43.3% of all households.
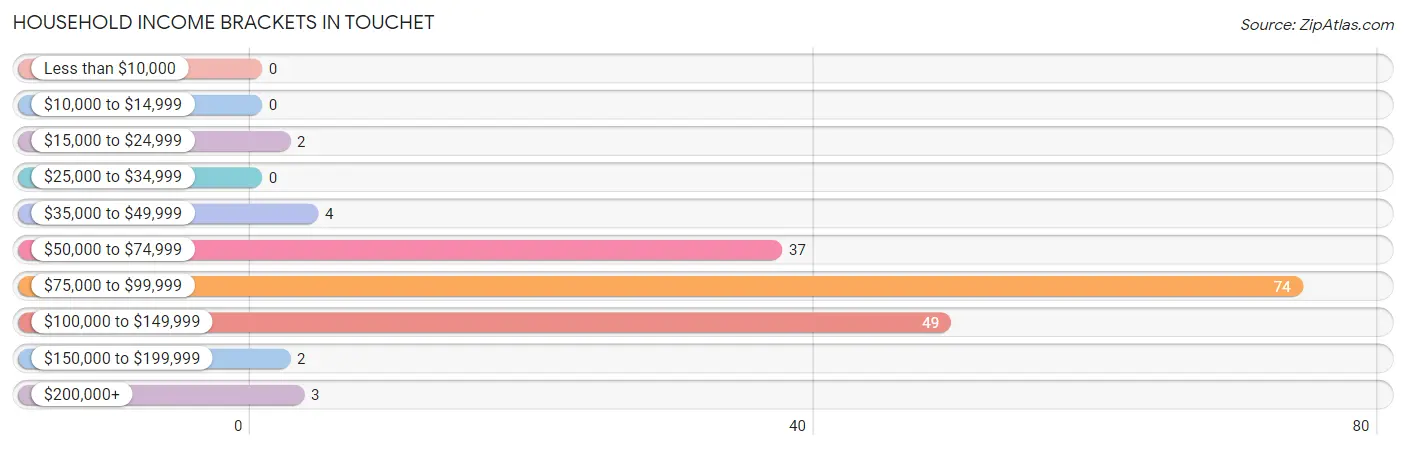
| Income Bracket | # Households | % Households |
| Less than $10,000 | 0 | 0.0% |
| $10,000 to $14,999 | 0 | 0.0% |
| $15,000 to $24,999 | 2 | 1.2% |
| $25,000 to $34,999 | 0 | 0.0% |
| $35,000 to $49,999 | 4 | 2.3% |
| $50,000 to $74,999 | 37 | 21.6% |
| $75,000 to $99,999 | 74 | 43.3% |
| $100,000 to $149,999 | 49 | 28.7% |
| $150,000 to $199,999 | 2 | 1.2% |
| $200,000+ | 3 | 1.8% |
Household Income by Householder Age in Touchet
The median household income in Touchet is $94,083, with the highest median household income of $99,231 found in the 45 to 64 years age bracket for the primary householder. A total of 100 households (58.5%) fall into this category.
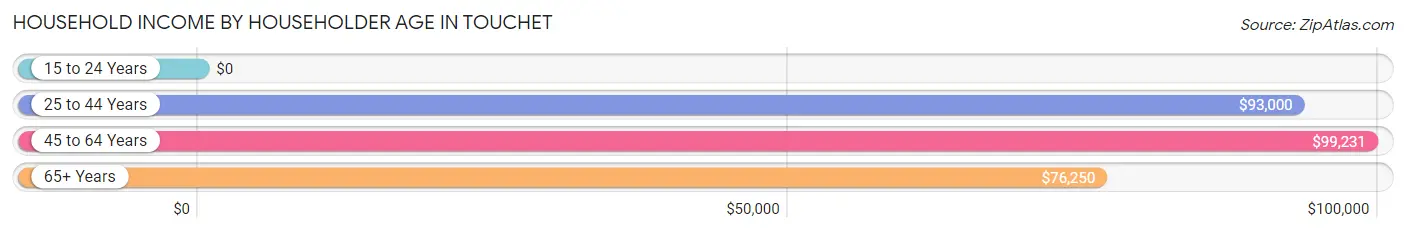
| Income Bracket | # Households | Median Income |
| 15 to 24 Years | 0 (0.0%) | $0 |
| 25 to 44 Years | 50 (29.2%) | $93,000 |
| 45 to 64 Years | 100 (58.5%) | $99,231 |
| 65+ Years | 21 (12.3%) | $76,250 |
| Total | 171 (100.0%) | $94,083 |
Poverty in Touchet
Income Below Poverty by Sex and Age in Touchet
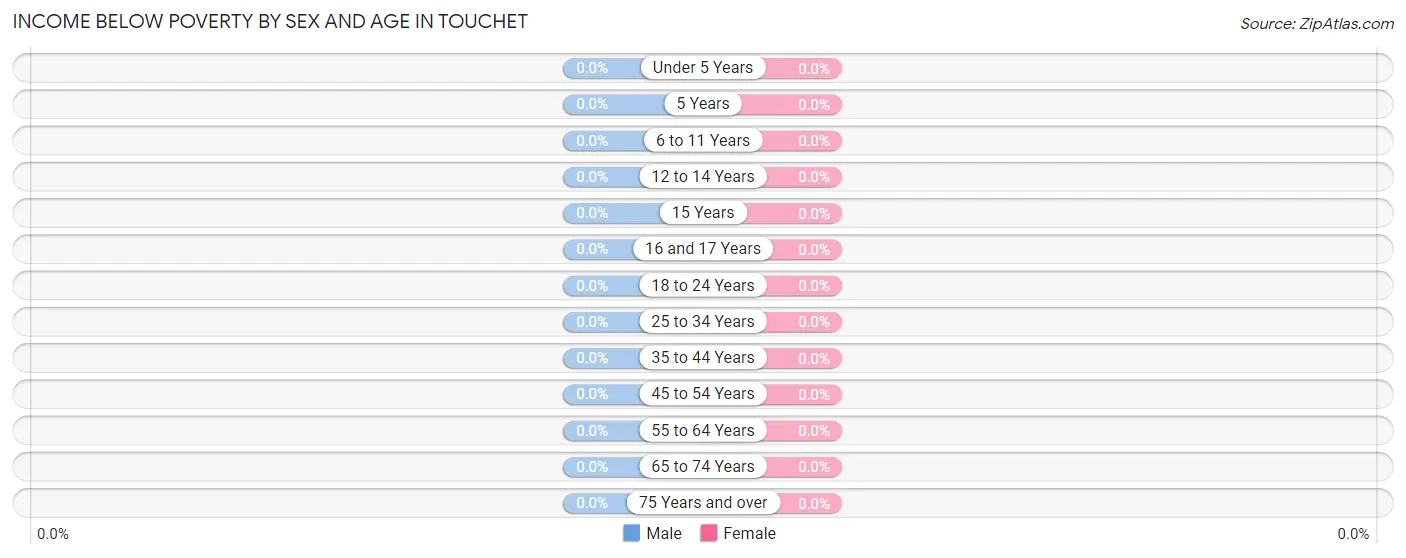
| Age Bracket | Male | Female |
| Under 5 Years | 0 (0.0%) | 0 (0.0%) |
| 5 Years | 0 (0.0%) | 0 (0.0%) |
| 6 to 11 Years | 0 (0.0%) | 0 (0.0%) |
| 12 to 14 Years | 0 (0.0%) | 0 (0.0%) |
| 15 Years | 0 (0.0%) | 0 (0.0%) |
| 16 and 17 Years | 0 (0.0%) | 0 (0.0%) |
| 18 to 24 Years | 0 (0.0%) | 0 (0.0%) |
| 25 to 34 Years | 0 (0.0%) | 0 (0.0%) |
| 35 to 44 Years | 0 (0.0%) | 0 (0.0%) |
| 45 to 54 Years | 0 (0.0%) | 0 (0.0%) |
| 55 to 64 Years | 0 (0.0%) | 0 (0.0%) |
| 65 to 74 Years | 0 (0.0%) | 0 (0.0%) |
| 75 Years and over | 0 (0.0%) | 0 (0.0%) |
| Total | 0 (0.0%) | 0 (0.0%) |
Income Above Poverty by Sex and Age in Touchet
According to the poverty statistics in Touchet, males aged under 5 years and females aged under 5 years are the age groups that are most secure financially, with 100.0% of males and 100.0% of females in these age groups living above the poverty line.
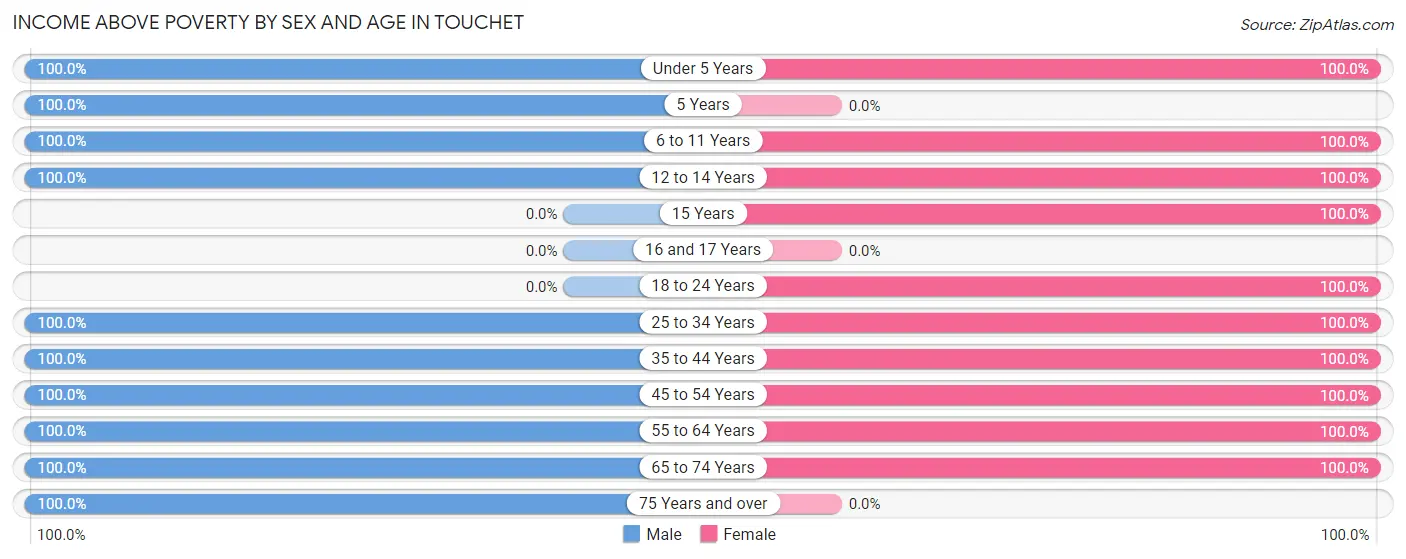
| Age Bracket | Male | Female |
| Under 5 Years | 12 (100.0%) | 13 (100.0%) |
| 5 Years | 12 (100.0%) | 0 (0.0%) |
| 6 to 11 Years | 41 (100.0%) | 20 (100.0%) |
| 12 to 14 Years | 25 (100.0%) | 20 (100.0%) |
| 15 Years | 0 (0.0%) | 24 (100.0%) |
| 16 and 17 Years | 0 (0.0%) | 0 (0.0%) |
| 18 to 24 Years | 0 (0.0%) | 7 (100.0%) |
| 25 to 34 Years | 21 (100.0%) | 29 (100.0%) |
| 35 to 44 Years | 34 (100.0%) | 17 (100.0%) |
| 45 to 54 Years | 44 (100.0%) | 44 (100.0%) |
| 55 to 64 Years | 43 (100.0%) | 43 (100.0%) |
| 65 to 74 Years | 15 (100.0%) | 16 (100.0%) |
| 75 Years and over | 5 (100.0%) | 0 (0.0%) |
| Total | 252 (100.0%) | 233 (100.0%) |
Income Below Poverty Among Married-Couple Families in Touchet
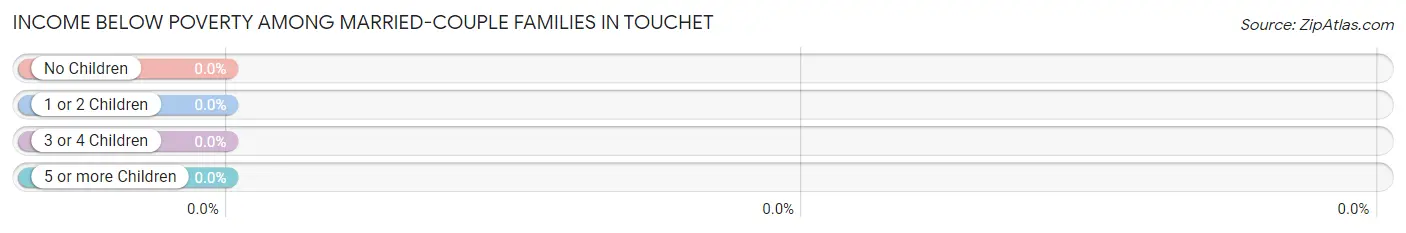
| Children | Above Poverty | Below Poverty |
| No Children | 82 (100.0%) | 0 (0.0%) |
| 1 or 2 Children | 38 (100.0%) | 0 (0.0%) |
| 3 or 4 Children | 27 (100.0%) | 0 (0.0%) |
| 5 or more Children | 0 (0.0%) | 0 (0.0%) |
| Total | 147 (100.0%) | 0 (0.0%) |
Income Below Poverty Among Single-Parent Households in Touchet
| Children | Single Father | Single Mother |
| No Children | 0 (0.0%) | 0 (0.0%) |
| 1 or 2 Children | 0 (0.0%) | 0 (0.0%) |
| 3 or 4 Children | 0 (0.0%) | 0 (0.0%) |
| 5 or more Children | 0 (0.0%) | 0 (0.0%) |
| Total | 0 (0.0%) | 0 (0.0%) |
Income Below Poverty Among Married-Couple vs Single-Parent Households in Touchet
| Children | Married-Couple Families | Single-Parent Households |
| No Children | 0 (0.0%) | 0 (0.0%) |
| 1 or 2 Children | 0 (0.0%) | 0 (0.0%) |
| 3 or 4 Children | 0 (0.0%) | 0 (0.0%) |
| 5 or more Children | 0 (0.0%) | 0 (0.0%) |
| Total | 0 (0.0%) | 0 (0.0%) |
Race in Touchet
The most populous races in Touchet are White / Caucasian (305 | 62.9%), Hispanic or Latino (169 | 34.8%), and Two or more Races (67 | 13.8%).
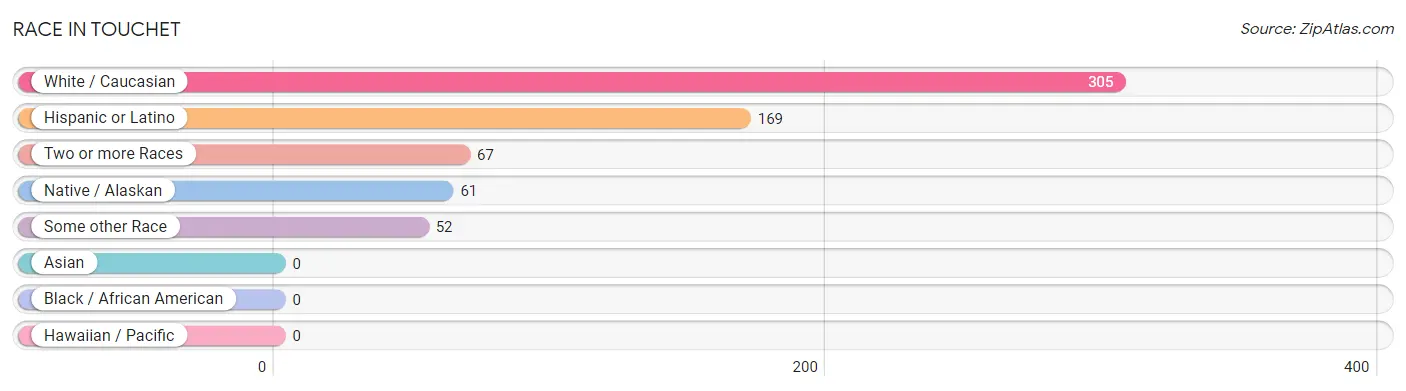
| Race | # Population | % Population |
| Asian | 0 | 0.0% |
| Black / African American | 0 | 0.0% |
| Hawaiian / Pacific | 0 | 0.0% |
| Hispanic or Latino | 169 | 34.8% |
| Native / Alaskan | 61 | 12.6% |
| White / Caucasian | 305 | 62.9% |
| Two or more Races | 67 | 13.8% |
| Some other Race | 52 | 10.7% |
| Total | 485 | 100.0% |
Ancestry in Touchet
The most populous ancestries reported in Touchet are Mexican (141 | 29.1%), American (81 | 16.7%), German (56 | 11.6%), Central American Indian (46 | 9.5%), and English (30 | 6.2%), together accounting for 73.0% of all Touchet residents.
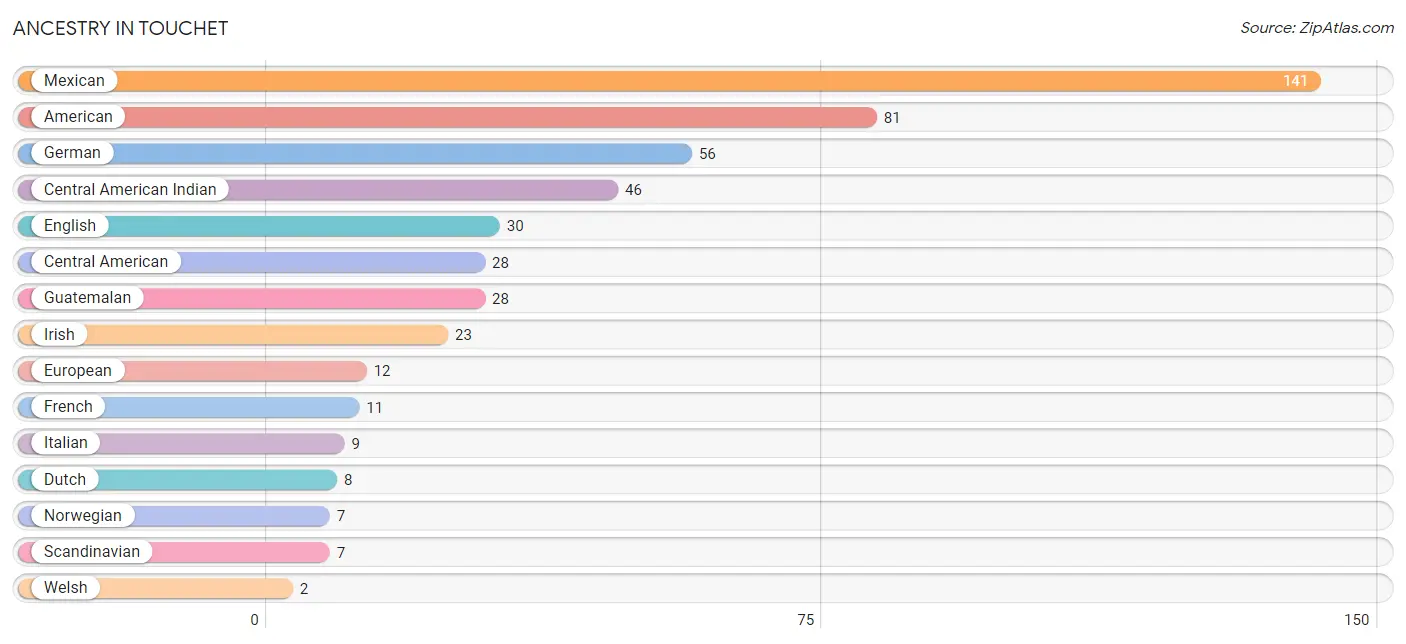
| Ancestry | # Population | % Population |
| American | 81 | 16.7% |
| Central American | 28 | 5.8% |
| Central American Indian | 46 | 9.5% |
| Dutch | 8 | 1.7% |
| English | 30 | 6.2% |
| European | 12 | 2.5% |
| French | 11 | 2.3% |
| German | 56 | 11.6% |
| Guatemalan | 28 | 5.8% |
| Irish | 23 | 4.7% |
| Italian | 9 | 1.9% |
| Mexican | 141 | 29.1% |
| Norwegian | 7 | 1.4% |
| Scandinavian | 7 | 1.4% |
| Welsh | 2 | 0.4% | View All 15 Rows |
Immigrants in Touchet
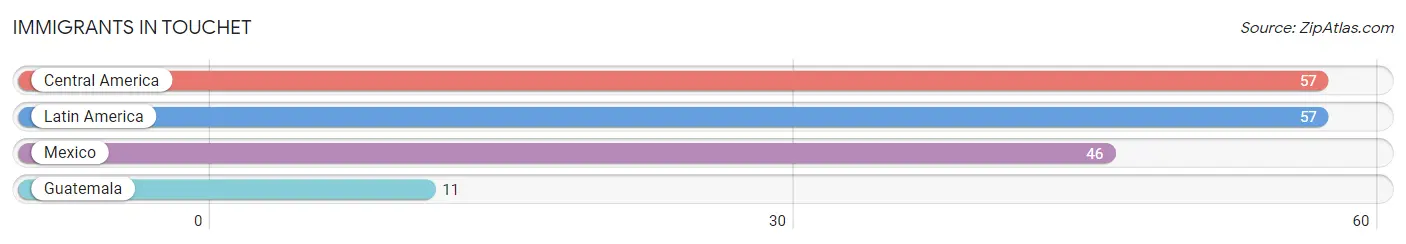
The most numerous immigrant groups reported in Touchet came from Central America (57 | 11.7%), Latin America (57 | 11.7%), Mexico (46 | 9.5%), and Guatemala (11 | 2.3%), together accounting for 35.2% of all Touchet residents.
| Immigration Origin | # Population | % Population |
| Central America | 57 | 11.7% |
| Guatemala | 11 | 2.3% |
| Latin America | 57 | 11.7% |
| Mexico | 46 | 9.5% | View All 4 Rows |
Sex and Age in Touchet
Sex and Age in Touchet
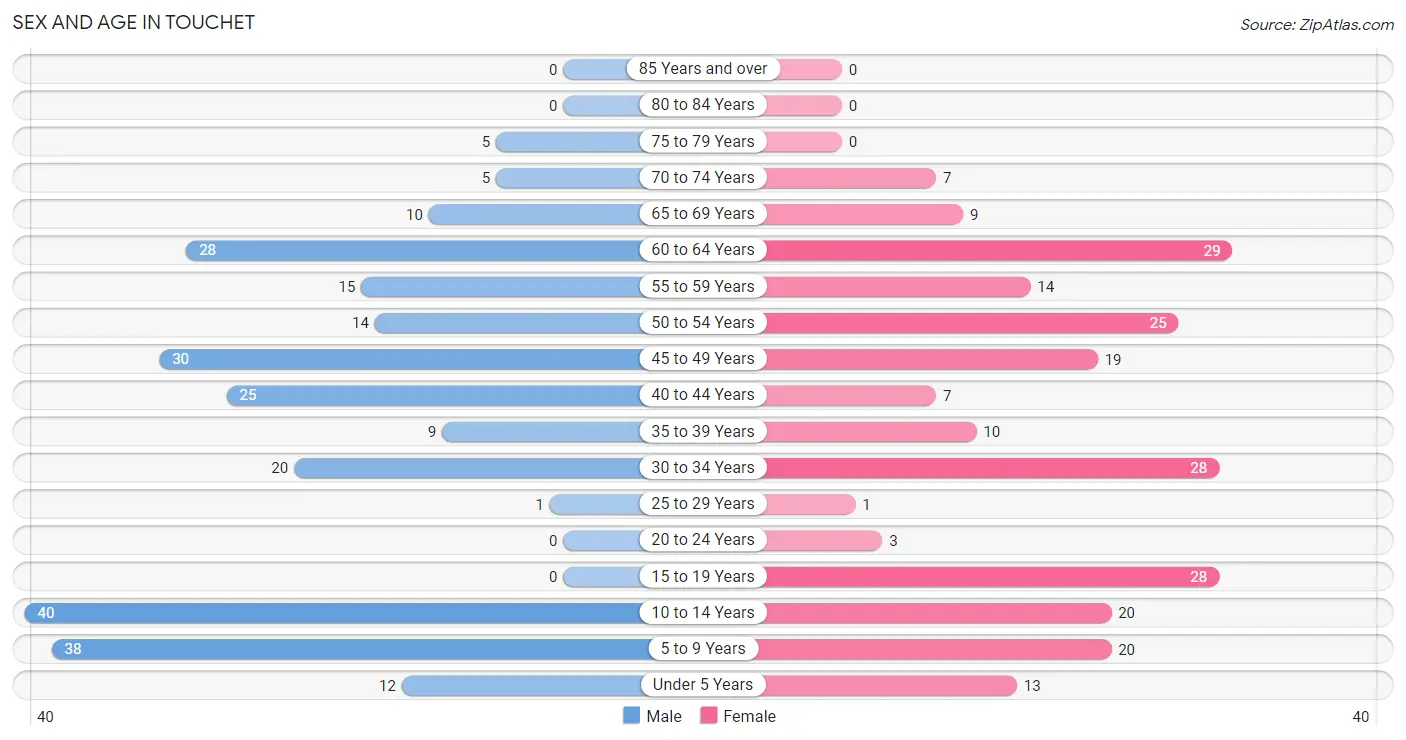
The most populous age groups in Touchet are 10 to 14 Years (40 | 15.9%) for men and 60 to 64 Years (29 | 12.4%) for women.
| Age Bracket | Male | Female |
| Under 5 Years | 12 (4.8%) | 13 (5.6%) |
| 5 to 9 Years | 38 (15.1%) | 20 (8.6%) |
| 10 to 14 Years | 40 (15.9%) | 20 (8.6%) |
| 15 to 19 Years | 0 (0.0%) | 28 (12.0%) |
| 20 to 24 Years | 0 (0.0%) | 3 (1.3%) |
| 25 to 29 Years | 1 (0.4%) | 1 (0.4%) |
| 30 to 34 Years | 20 (7.9%) | 28 (12.0%) |
| 35 to 39 Years | 9 (3.6%) | 10 (4.3%) |
| 40 to 44 Years | 25 (9.9%) | 7 (3.0%) |
| 45 to 49 Years | 30 (11.9%) | 19 (8.2%) |
| 50 to 54 Years | 14 (5.6%) | 25 (10.7%) |
| 55 to 59 Years | 15 (5.9%) | 14 (6.0%) |
| 60 to 64 Years | 28 (11.1%) | 29 (12.4%) |
| 65 to 69 Years | 10 (4.0%) | 9 (3.9%) |
| 70 to 74 Years | 5 (2.0%) | 7 (3.0%) |
| 75 to 79 Years | 5 (2.0%) | 0 (0.0%) |
| 80 to 84 Years | 0 (0.0%) | 0 (0.0%) |
| 85 Years and over | 0 (0.0%) | 0 (0.0%) |
| Total | 252 (100.0%) | 233 (100.0%) |
Families and Households in Touchet
Median Family Size in Touchet
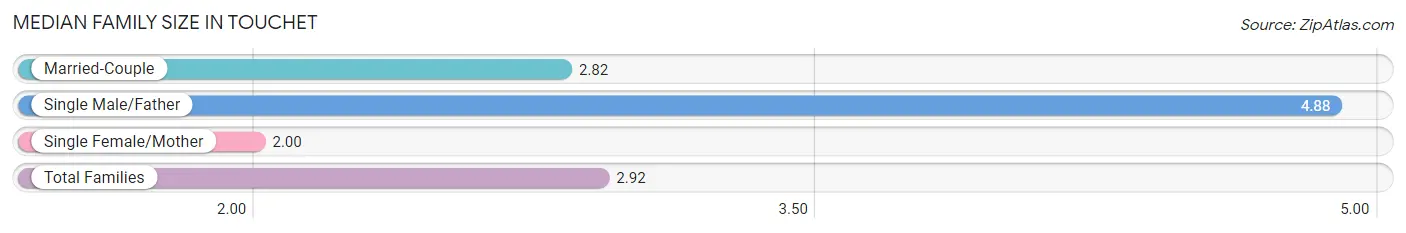
The median family size in Touchet is 2.92 persons per family, with single male/father families (8 | 5.1%) accounting for the largest median family size of 4.88 persons per family. On the other hand, single female/mother families (1 | 0.6%) represent the smallest median family size with 2.00 persons per family.
| Family Type | # Families | Family Size |
| Married-Couple | 147 (94.2%) | 2.82 |
| Single Male/Father | 8 (5.1%) | 4.88 |
| Single Female/Mother | 1 (0.6%) | 2.00 |
| Total Families | 156 (100.0%) | 2.92 |
Median Household Size in Touchet
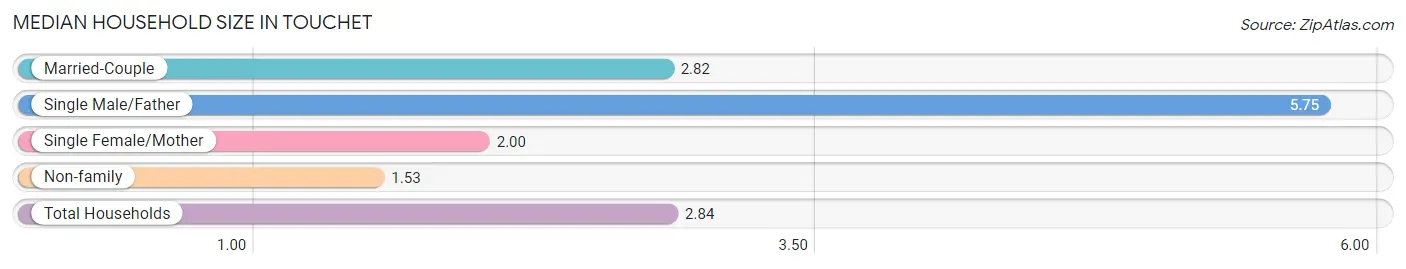
The median household size in Touchet is 2.84 persons per household, with single male/father households (8 | 4.7%) accounting for the largest median household size of 5.75 persons per household. non-family households (15 | 8.8%) represent the smallest median household size with 1.53 persons per household.
| Household Type | # Households | Household Size |
| Married-Couple | 147 (86.0%) | 2.82 |
| Single Male/Father | 8 (4.7%) | 5.75 |
| Single Female/Mother | 1 (0.6%) | 2.00 |
| Non-family | 15 (8.8%) | 1.53 |
| Total Households | 171 (100.0%) | 2.84 |
Household Size by Marriage Status in Touchet
Out of a total of 171 households in Touchet, 156 (91.2%) are family households, while 15 (8.8%) are nonfamily households. The most numerous type of family households are 2-person households, comprising 75, and the most common type of nonfamily households are 1-person households, comprising 10.
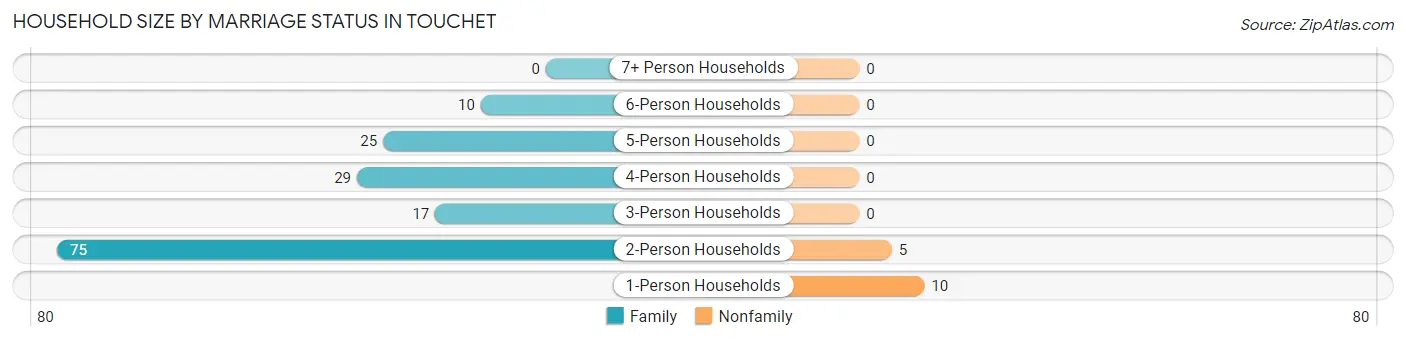
| Household Size | Family Households | Nonfamily Households |
| 1-Person Households | - | 10 (5.9%) |
| 2-Person Households | 75 (43.9%) | 5 (2.9%) |
| 3-Person Households | 17 (9.9%) | 0 (0.0%) |
| 4-Person Households | 29 (17.0%) | 0 (0.0%) |
| 5-Person Households | 25 (14.6%) | 0 (0.0%) |
| 6-Person Households | 10 (5.9%) | 0 (0.0%) |
| 7+ Person Households | 0 (0.0%) | 0 (0.0%) |
| Total | 156 (91.2%) | 15 (8.8%) |
Female Fertility in Touchet
Fertility by Age in Touchet
| Age Bracket | Women with Births | Births / 1,000 Women |
| 15 to 19 years | 0 (0.0%) | 0.0 |
| 20 to 34 years | 0 (0.0%) | 0.0 |
| 35 to 50 years | 0 (0.0%) | 0.0 |
| Total | 0 (0.0%) | 0.0 |
Fertility by Age by Marriage Status in Touchet
| Age Bracket | Married | Unmarried |
| 15 to 19 years | 0 (0.0%) | 0 (0.0%) |
| 20 to 34 years | 0 (0.0%) | 0 (0.0%) |
| 35 to 50 years | 0 (0.0%) | 0 (0.0%) |
| Total | 0 (0.0%) | 0 (0.0%) |
Fertility by Education in Touchet
| Educational Attainment | Women with Births | Births / 1,000 Women |
| Less than High School | 0 (0.0%) | 0.0 |
| High School Diploma | 0 (0.0%) | 0.0 |
| College or Associate's Degree | 0 (0.0%) | 0.0 |
| Bachelor's Degree | 0 (0.0%) | 0.0 |
| Graduate Degree | 0 (0.0%) | 0.0 |
| Total | 0 (0.0%) | 0.0 |
Fertility by Education by Marriage Status in Touchet
| Educational Attainment | Married | Unmarried |
| Less than High School | 0 (0.0%) | 0 (0.0%) |
| High School Diploma | 0 (0.0%) | 0 (0.0%) |
| College or Associate's Degree | 0 (0.0%) | 0 (0.0%) |
| Bachelor's Degree | 0 (0.0%) | 0 (0.0%) |
| Graduate Degree | 0 (0.0%) | 0 (0.0%) |
| Total | 0 (0.0%) | 0 (0.0%) |
Employment Characteristics in Touchet
Employment by Class of Employer in Touchet
Among the 228 employed individuals in Touchet, private company employees (96 | 42.1%), state government employees (61 | 26.8%), and not-for-profit organizations (28 | 12.3%) make up the most common classes of employment.
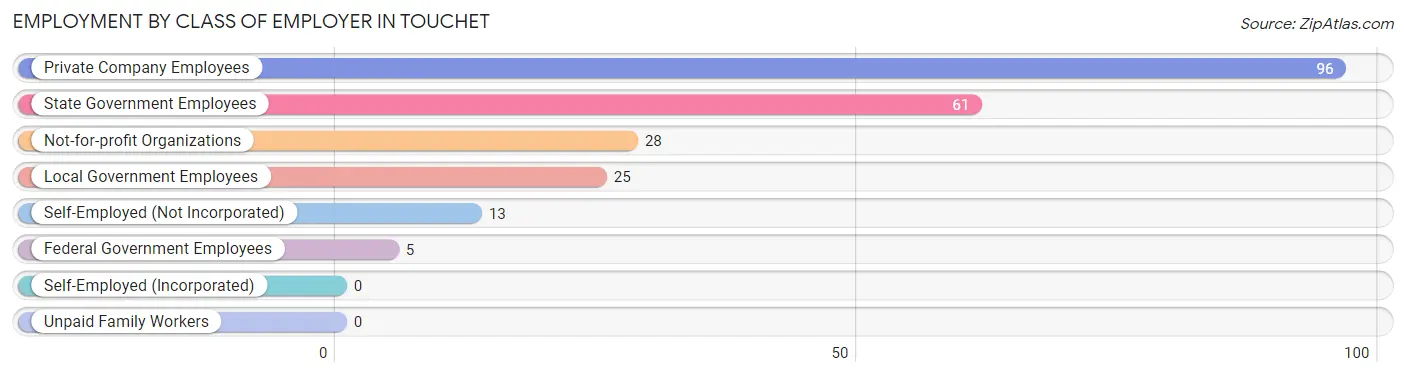
| Employer Class | # Employees | % Employees |
| Private Company Employees | 96 | 42.1% |
| Self-Employed (Incorporated) | 0 | 0.0% |
| Self-Employed (Not Incorporated) | 13 | 5.7% |
| Not-for-profit Organizations | 28 | 12.3% |
| Local Government Employees | 25 | 11.0% |
| State Government Employees | 61 | 26.8% |
| Federal Government Employees | 5 | 2.2% |
| Unpaid Family Workers | 0 | 0.0% |
| Total | 228 | 100.0% |
Employment Status by Age in Touchet
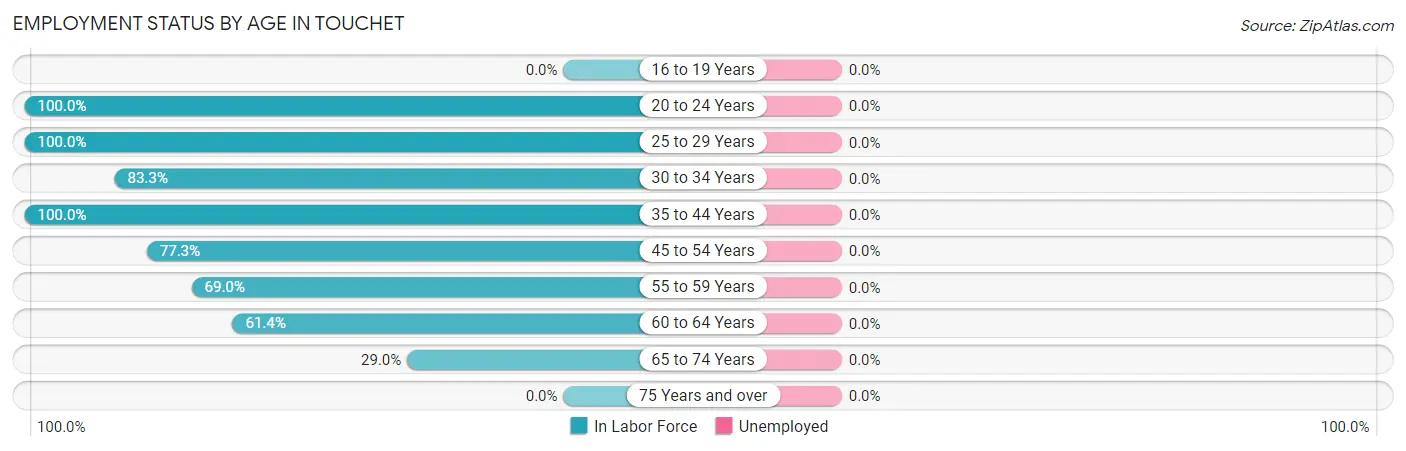
| Age Bracket | In Labor Force | Unemployed |
| 16 to 19 Years | 0 (0.0%) | 0 (0.0%) |
| 20 to 24 Years | 3 (100.0%) | 0 (0.0%) |
| 25 to 29 Years | 2 (100.0%) | 0 (0.0%) |
| 30 to 34 Years | 40 (83.3%) | 0 (0.0%) |
| 35 to 44 Years | 51 (100.0%) | 0 (0.0%) |
| 45 to 54 Years | 68 (77.3%) | 0 (0.0%) |
| 55 to 59 Years | 20 (69.0%) | 0 (0.0%) |
| 60 to 64 Years | 35 (61.4%) | 0 (0.0%) |
| 65 to 74 Years | 9 (29.0%) | 0 (0.0%) |
| 75 Years and over | 0 (0.0%) | 0 (0.0%) |
| Total | 228 (71.7%) | 0 (0.0%) |
Employment Status by Educational Attainment in Touchet
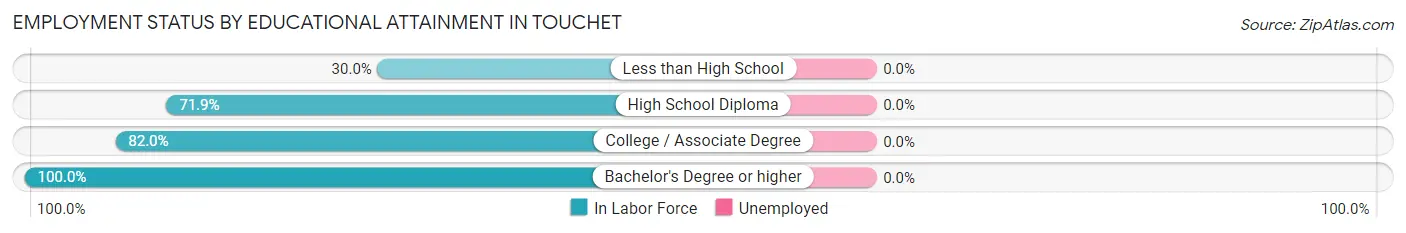
| Educational Attainment | In Labor Force | Unemployed |
| Less than High School | 6 (30.0%) | 0 (0.0%) |
| High School Diploma | 41 (71.9%) | 0 (0.0%) |
| College / Associate Degree | 132 (82.0%) | 0 (0.0%) |
| Bachelor's Degree or higher | 37 (100.0%) | 0 (0.0%) |
| Total | 216 (78.5%) | 0 (0.0%) |
Employment Occupations by Sex in Touchet
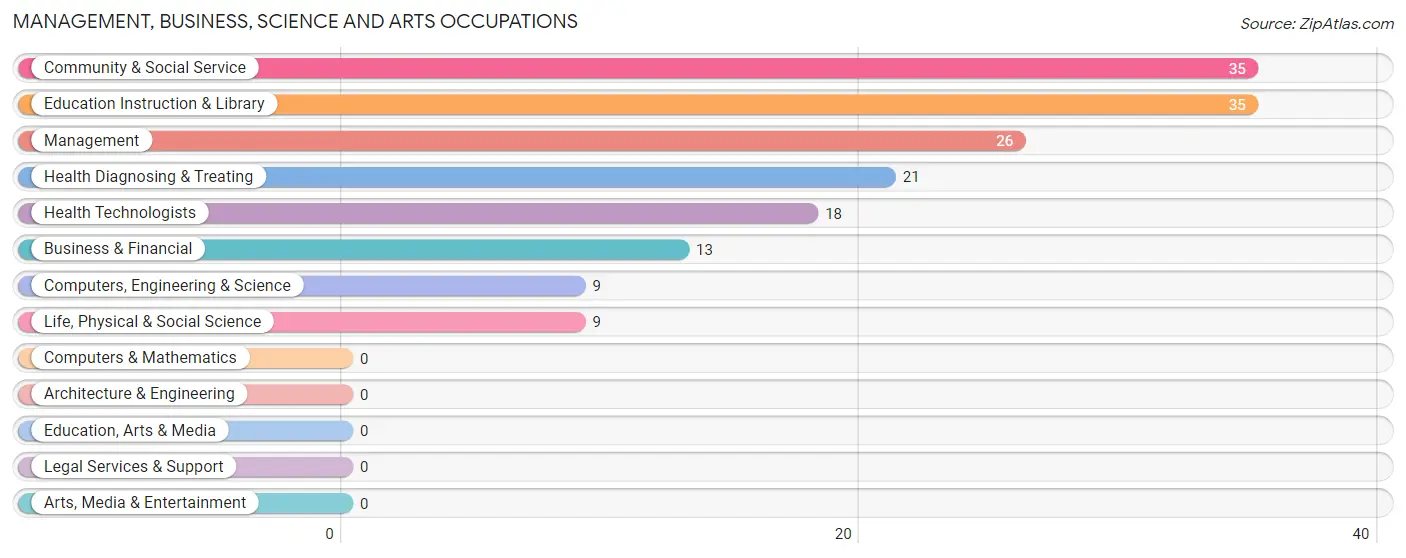
Management, Business, Science and Arts Occupations
The most common Management, Business, Science and Arts occupations in Touchet are Community & Social Service (35 | 15.3%), Education Instruction & Library (35 | 15.3%), Management (26 | 11.4%), Health Diagnosing & Treating (21 | 9.2%), and Health Technologists (18 | 7.9%).
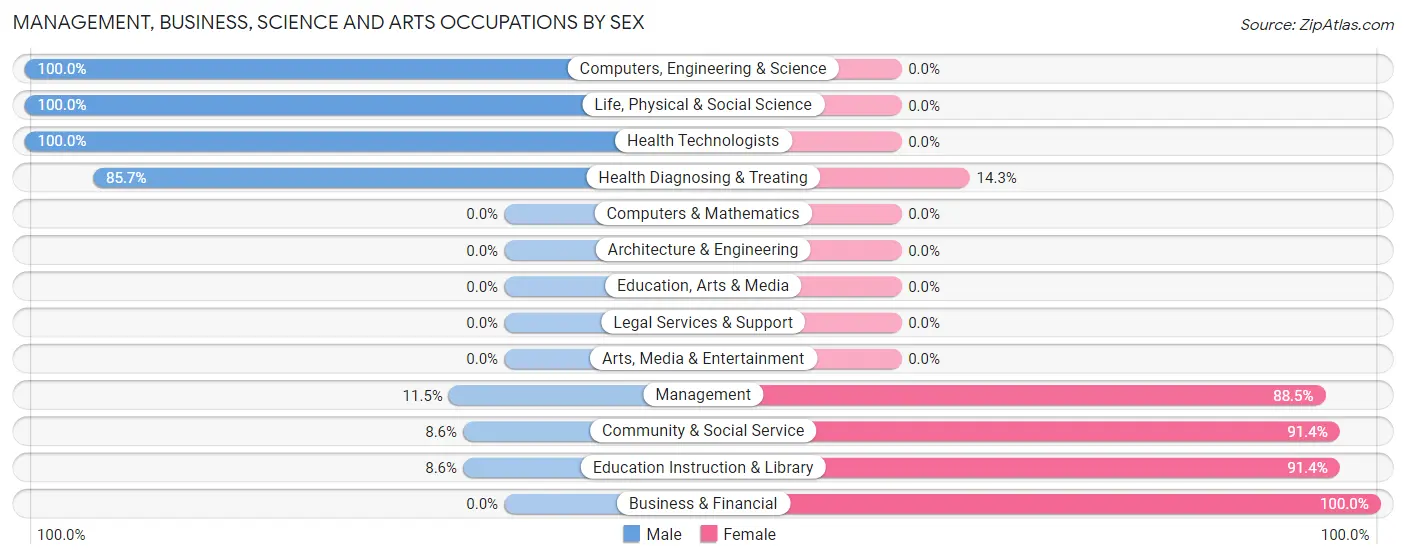
Management, Business, Science and Arts Occupations by Sex
Within the Management, Business, Science and Arts occupations in Touchet, the most male-oriented occupations are Computers, Engineering & Science (100.0%), Life, Physical & Social Science (100.0%), and Health Technologists (100.0%), while the most female-oriented occupations are Business & Financial (100.0%), Community & Social Service (91.4%), and Education Instruction & Library (91.4%).
| Occupation | Male | Female |
| Management | 3 (11.5%) | 23 (88.5%) |
| Business & Financial | 0 (0.0%) | 13 (100.0%) |
| Computers, Engineering & Science | 9 (100.0%) | 0 (0.0%) |
| Computers & Mathematics | 0 (0.0%) | 0 (0.0%) |
| Architecture & Engineering | 0 (0.0%) | 0 (0.0%) |
| Life, Physical & Social Science | 9 (100.0%) | 0 (0.0%) |
| Community & Social Service | 3 (8.6%) | 32 (91.4%) |
| Education, Arts & Media | 0 (0.0%) | 0 (0.0%) |
| Legal Services & Support | 0 (0.0%) | 0 (0.0%) |
| Education Instruction & Library | 3 (8.6%) | 32 (91.4%) |
| Arts, Media & Entertainment | 0 (0.0%) | 0 (0.0%) |
| Health Diagnosing & Treating | 18 (85.7%) | 3 (14.3%) |
| Health Technologists | 18 (100.0%) | 0 (0.0%) |
| Total (Category) | 33 (31.7%) | 71 (68.3%) |
| Total (Overall) | 107 (46.9%) | 121 (53.1%) |
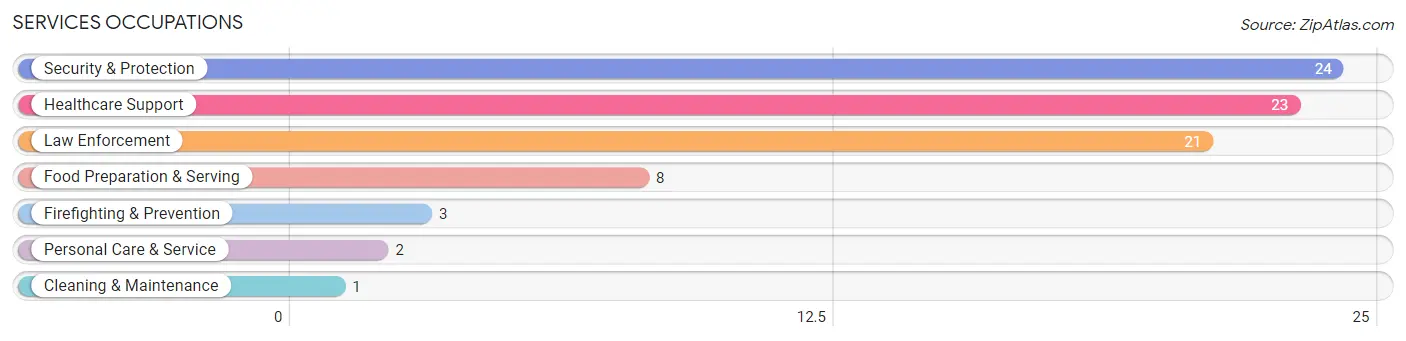
Services Occupations
The most common Services occupations in Touchet are Security & Protection (24 | 10.5%), Healthcare Support (23 | 10.1%), Law Enforcement (21 | 9.2%), Food Preparation & Serving (8 | 3.5%), and Firefighting & Prevention (3 | 1.3%).
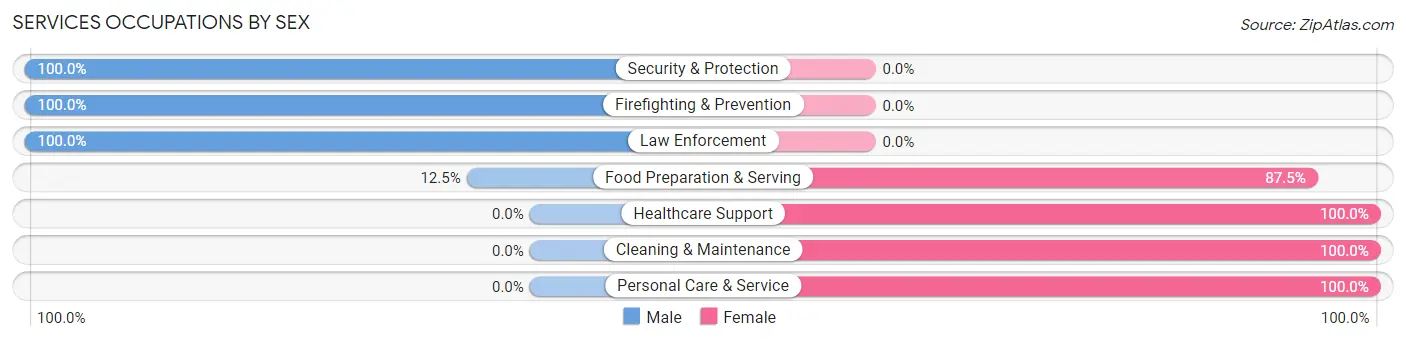
Services Occupations by Sex
Within the Services occupations in Touchet, the most male-oriented occupations are Security & Protection (100.0%), Firefighting & Prevention (100.0%), and Law Enforcement (100.0%), while the most female-oriented occupations are Healthcare Support (100.0%), Cleaning & Maintenance (100.0%), and Personal Care & Service (100.0%).
| Occupation | Male | Female |
| Healthcare Support | 0 (0.0%) | 23 (100.0%) |
| Security & Protection | 24 (100.0%) | 0 (0.0%) |
| Firefighting & Prevention | 3 (100.0%) | 0 (0.0%) |
| Law Enforcement | 21 (100.0%) | 0 (0.0%) |
| Food Preparation & Serving | 1 (12.5%) | 7 (87.5%) |
| Cleaning & Maintenance | 0 (0.0%) | 1 (100.0%) |
| Personal Care & Service | 0 (0.0%) | 2 (100.0%) |
| Total (Category) | 25 (43.1%) | 33 (56.9%) |
| Total (Overall) | 107 (46.9%) | 121 (53.1%) |
Sales and Office Occupations
The most common Sales and Office occupations in Touchet are Office & Administration (14 | 6.1%), and Sales & Related (2 | 0.9%).
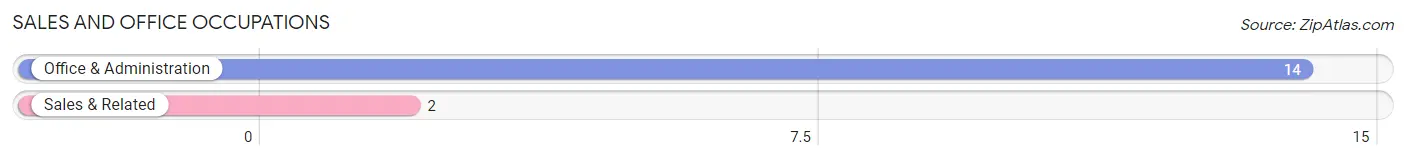
Sales and Office Occupations by Sex
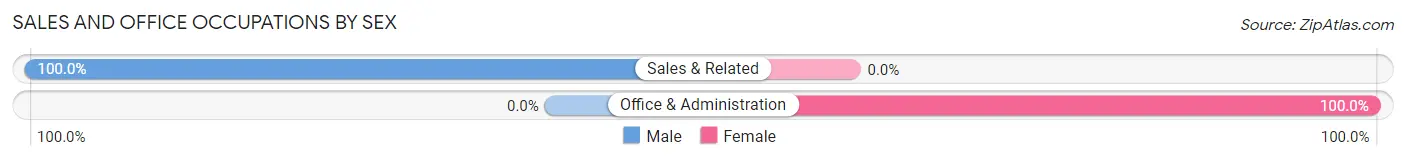
| Occupation | Male | Female |
| Sales & Related | 2 (100.0%) | 0 (0.0%) |
| Office & Administration | 0 (0.0%) | 14 (100.0%) |
| Total (Category) | 2 (12.5%) | 14 (87.5%) |
| Total (Overall) | 107 (46.9%) | 121 (53.1%) |
Natural Resources, Construction and Maintenance Occupations
The most common Natural Resources, Construction and Maintenance occupations in Touchet are Farming, Fishing & Forestry (15 | 6.6%), and Installation, Maintenance & Repair (9 | 4.0%).
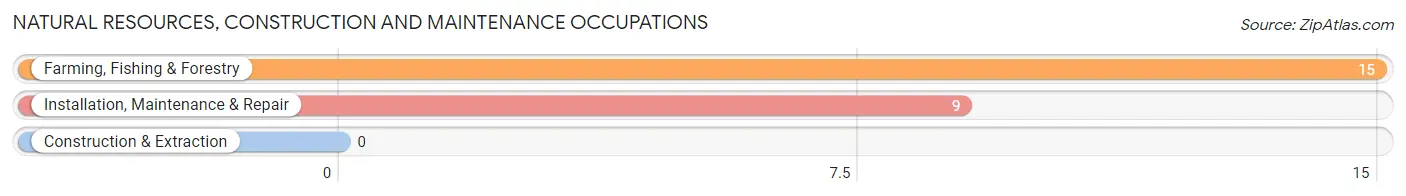
Natural Resources, Construction and Maintenance Occupations by Sex
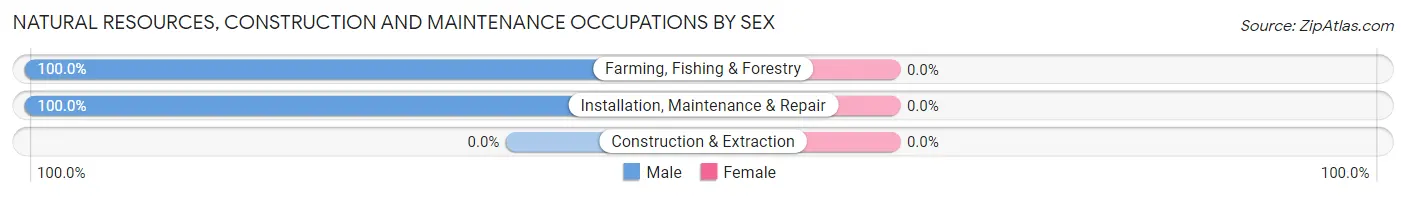
| Occupation | Male | Female |
| Farming, Fishing & Forestry | 15 (100.0%) | 0 (0.0%) |
| Construction & Extraction | 0 (0.0%) | 0 (0.0%) |
| Installation, Maintenance & Repair | 9 (100.0%) | 0 (0.0%) |
| Total (Category) | 24 (100.0%) | 0 (0.0%) |
| Total (Overall) | 107 (46.9%) | 121 (53.1%) |
Production, Transportation and Moving Occupations
The most common Production, Transportation and Moving occupations in Touchet are Production (12 | 5.3%), Material Moving (8 | 3.5%), and Transportation (6 | 2.6%).
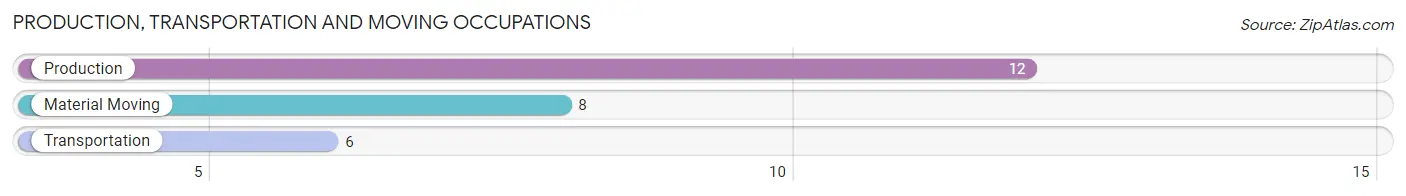
Production, Transportation and Moving Occupations by Sex
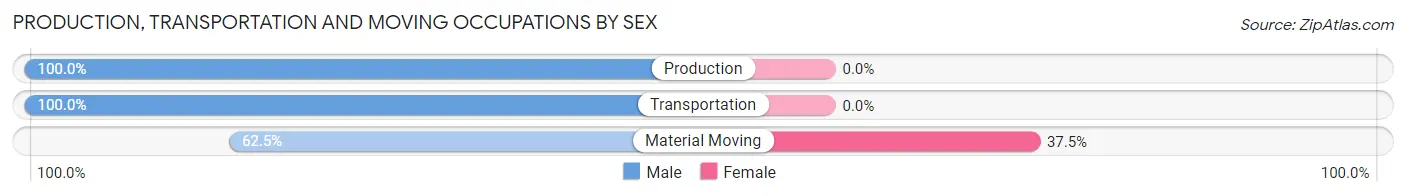
| Occupation | Male | Female |
| Production | 12 (100.0%) | 0 (0.0%) |
| Transportation | 6 (100.0%) | 0 (0.0%) |
| Material Moving | 5 (62.5%) | 3 (37.5%) |
| Total (Category) | 23 (88.5%) | 3 (11.5%) |
| Total (Overall) | 107 (46.9%) | 121 (53.1%) |
Employment Industries by Sex in Touchet
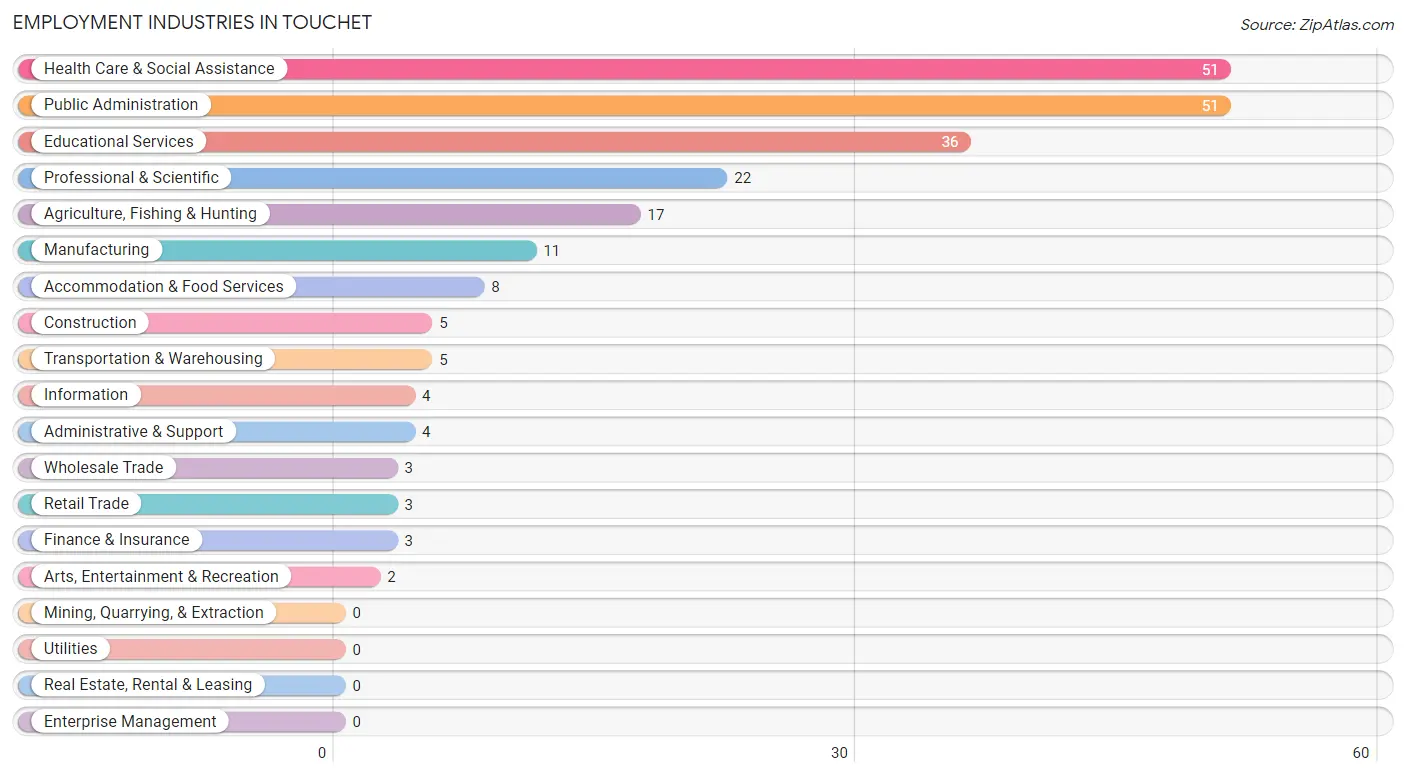
Employment Industries in Touchet
The major employment industries in Touchet include Health Care & Social Assistance (51 | 22.4%), Public Administration (51 | 22.4%), Educational Services (36 | 15.8%), Professional & Scientific (22 | 9.7%), and Agriculture, Fishing & Hunting (17 | 7.5%).
Employment Industries by Sex in Touchet
The Touchet industries that see more men than women are Agriculture, Fishing & Hunting (100.0%), Manufacturing (100.0%), and Wholesale Trade (100.0%), whereas the industries that tend to have a higher number of women are Retail Trade (100.0%), Information (100.0%), and Arts, Entertainment & Recreation (100.0%).
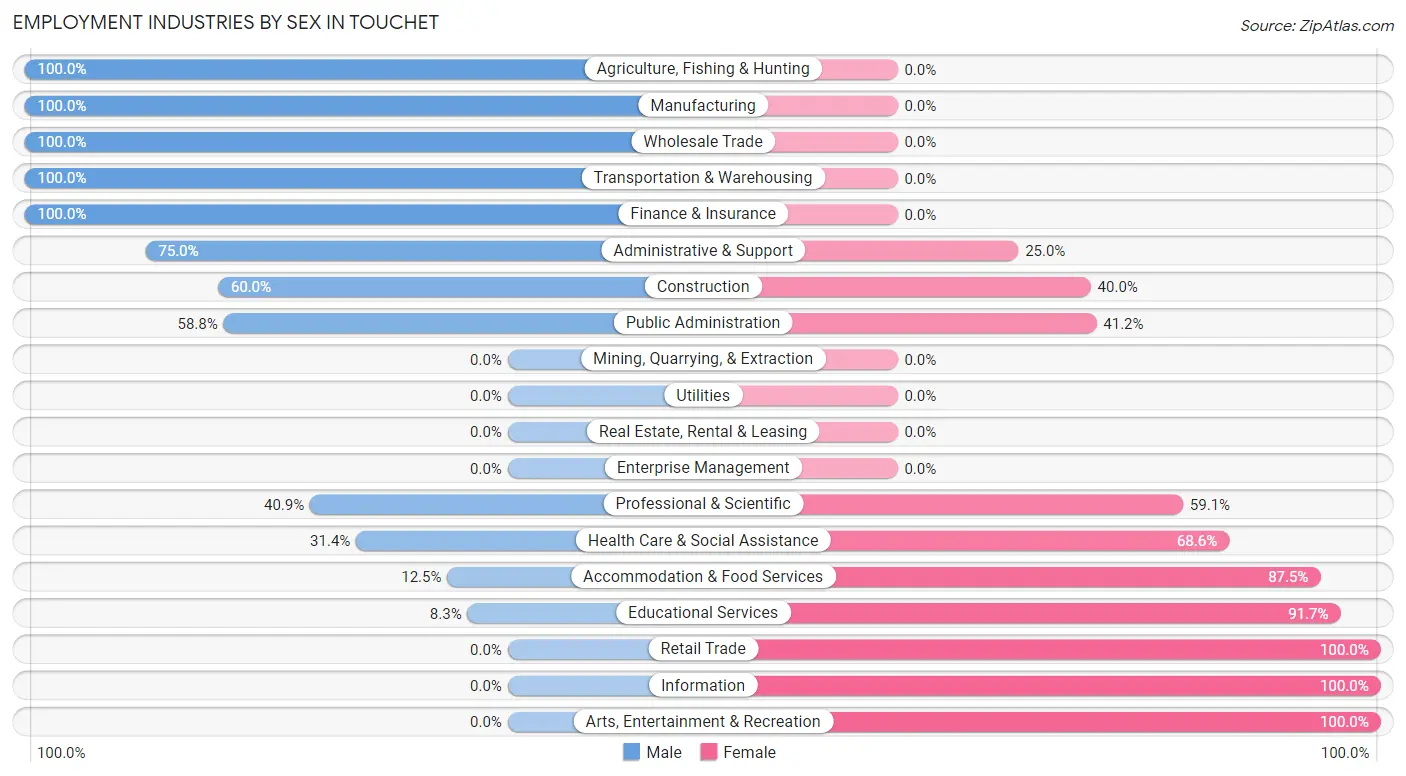
| Industry | Male | Female |
| Agriculture, Fishing & Hunting | 17 (100.0%) | 0 (0.0%) |
| Mining, Quarrying, & Extraction | 0 (0.0%) | 0 (0.0%) |
| Construction | 3 (60.0%) | 2 (40.0%) |
| Manufacturing | 11 (100.0%) | 0 (0.0%) |
| Wholesale Trade | 3 (100.0%) | 0 (0.0%) |
| Retail Trade | 0 (0.0%) | 3 (100.0%) |
| Transportation & Warehousing | 5 (100.0%) | 0 (0.0%) |
| Utilities | 0 (0.0%) | 0 (0.0%) |
| Information | 0 (0.0%) | 4 (100.0%) |
| Finance & Insurance | 3 (100.0%) | 0 (0.0%) |
| Real Estate, Rental & Leasing | 0 (0.0%) | 0 (0.0%) |
| Professional & Scientific | 9 (40.9%) | 13 (59.1%) |
| Enterprise Management | 0 (0.0%) | 0 (0.0%) |
| Administrative & Support | 3 (75.0%) | 1 (25.0%) |
| Educational Services | 3 (8.3%) | 33 (91.7%) |
| Health Care & Social Assistance | 16 (31.4%) | 35 (68.6%) |
| Arts, Entertainment & Recreation | 0 (0.0%) | 2 (100.0%) |
| Accommodation & Food Services | 1 (12.5%) | 7 (87.5%) |
| Public Administration | 30 (58.8%) | 21 (41.2%) |
| Total | 107 (46.9%) | 121 (53.1%) |
Education in Touchet
School Enrollment in Touchet
The most common levels of schooling among the 151 students in Touchet are middle school (52 | 34.4%), high school (36 | 23.8%), and elementary school (32 | 21.2%).
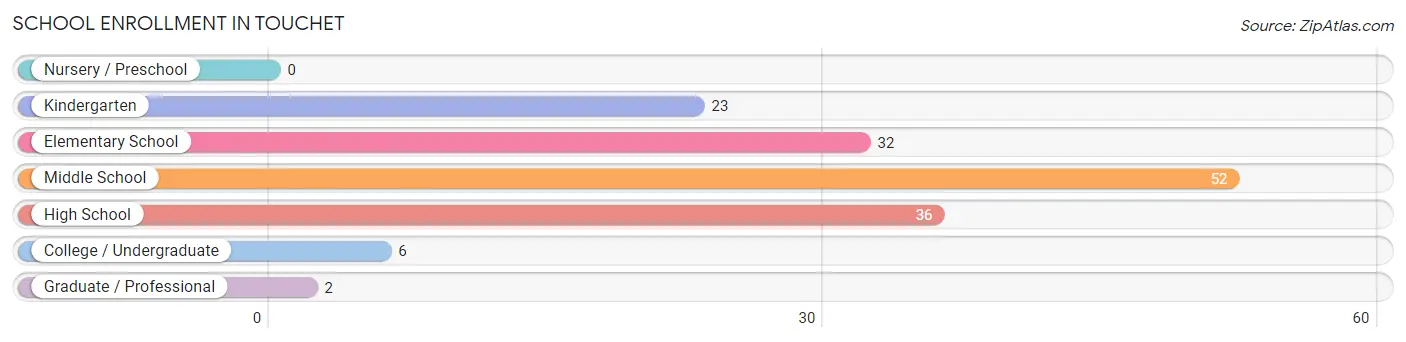
| School Level | # Students | % Students |
| Nursery / Preschool | 0 | 0.0% |
| Kindergarten | 23 | 15.2% |
| Elementary School | 32 | 21.2% |
| Middle School | 52 | 34.4% |
| High School | 36 | 23.8% |
| College / Undergraduate | 6 | 4.0% |
| Graduate / Professional | 2 | 1.3% |
| Total | 151 | 100.0% |
School Enrollment by Age by Funding Source in Touchet
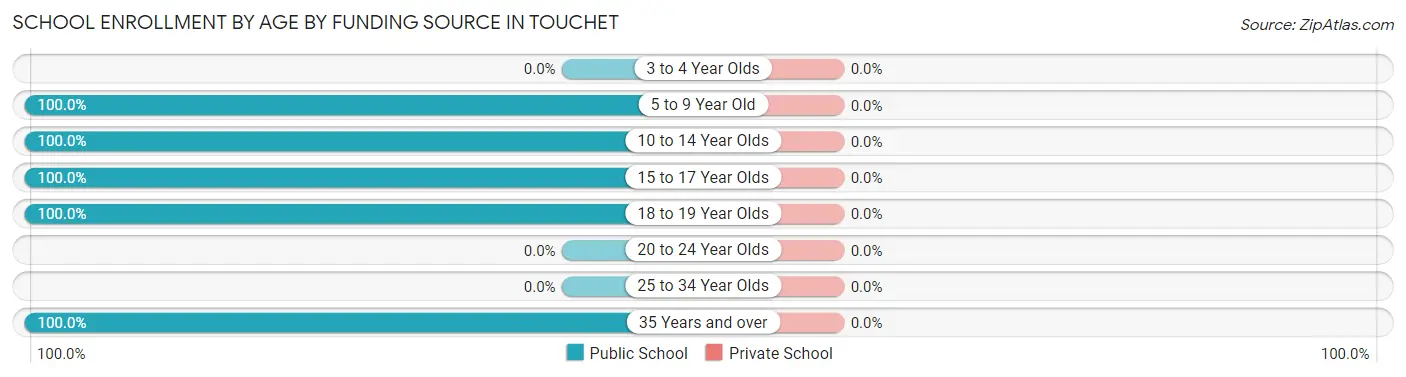
| Age Bracket | Public School | Private School |
| 3 to 4 Year Olds | 0 (0.0%) | 0 (0.0%) |
| 5 to 9 Year Old | 55 (100.0%) | 0 (0.0%) |
| 10 to 14 Year Olds | 60 (100.0%) | 0 (0.0%) |
| 15 to 17 Year Olds | 24 (100.0%) | 0 (0.0%) |
| 18 to 19 Year Olds | 4 (100.0%) | 0 (0.0%) |
| 20 to 24 Year Olds | 0 (0.0%) | 0 (0.0%) |
| 25 to 34 Year Olds | 0 (0.0%) | 0 (0.0%) |
| 35 Years and over | 8 (100.0%) | 0 (0.0%) |
| Total | 151 (100.0%) | 0 (0.0%) |
Educational Attainment by Field of Study in Touchet
Education (15 | 30.0%), engineering (12 | 24.0%), social sciences (10 | 20.0%), bio, nature & agricultural (4 | 8.0%), and multidisciplinary studies (3 | 6.0%) are the most common fields of study among 50 individuals in Touchet who have obtained a bachelor's degree or higher.
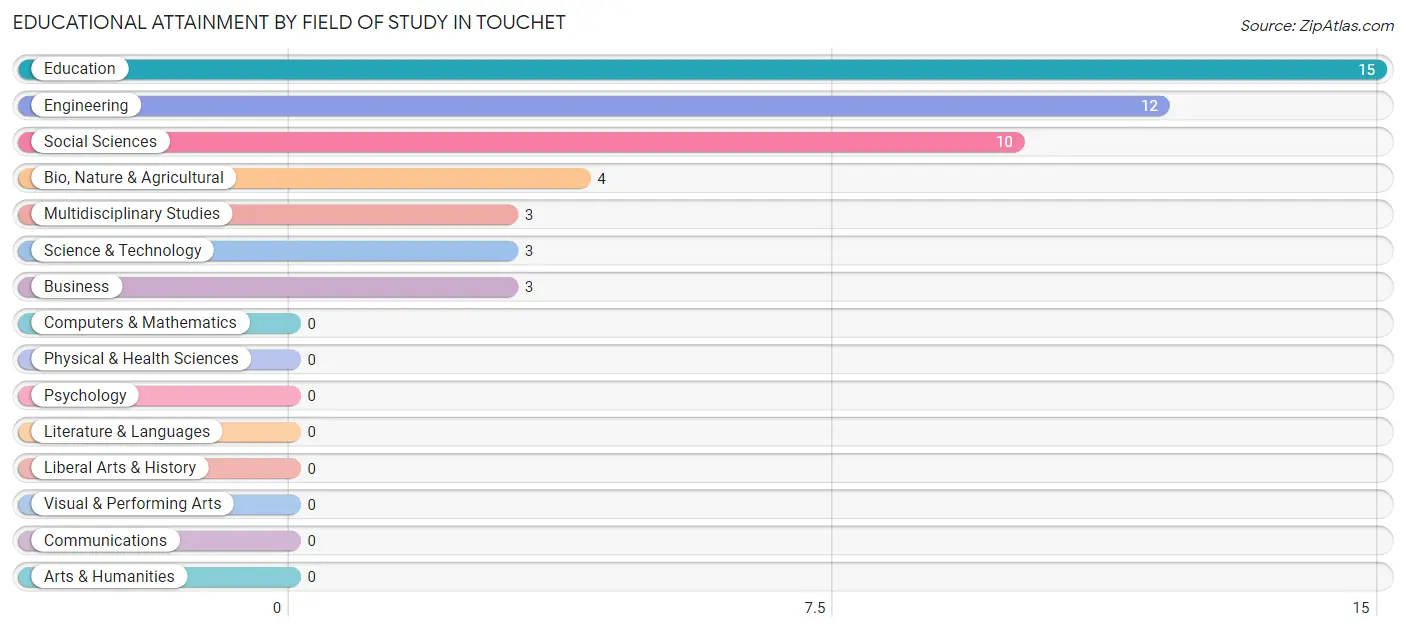
| Field of Study | # Graduates | % Graduates |
| Computers & Mathematics | 0 | 0.0% |
| Bio, Nature & Agricultural | 4 | 8.0% |
| Physical & Health Sciences | 0 | 0.0% |
| Psychology | 0 | 0.0% |
| Social Sciences | 10 | 20.0% |
| Engineering | 12 | 24.0% |
| Multidisciplinary Studies | 3 | 6.0% |
| Science & Technology | 3 | 6.0% |
| Business | 3 | 6.0% |
| Education | 15 | 30.0% |
| Literature & Languages | 0 | 0.0% |
| Liberal Arts & History | 0 | 0.0% |
| Visual & Performing Arts | 0 | 0.0% |
| Communications | 0 | 0.0% |
| Arts & Humanities | 0 | 0.0% |
| Total | 50 | 100.0% |
Transportation & Commute in Touchet
Vehicle Availability by Sex in Touchet
The most prevalent vehicle ownership categories in Touchet are males with 3 vehicles (45, accounting for 42.1%) and females with 3 vehicles (32, making up 37.2%).
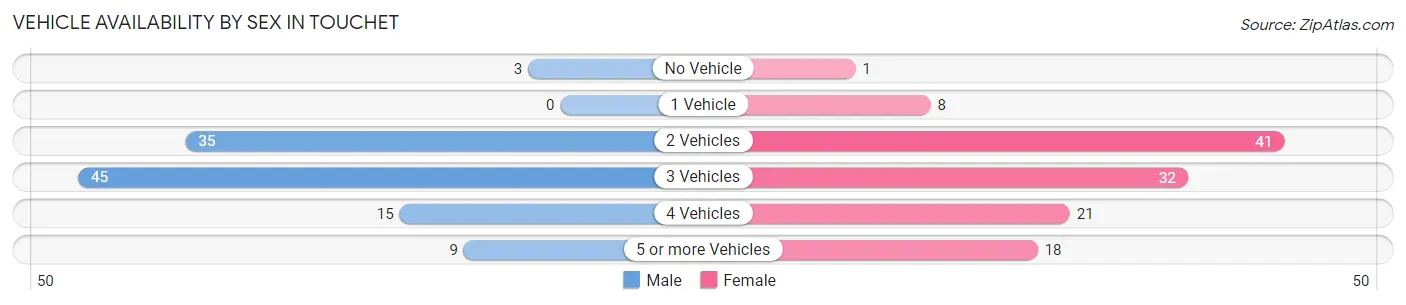
| Vehicles Available | Male | Female |
| No Vehicle | 3 (2.8%) | 1 (0.8%) |
| 1 Vehicle | 0 (0.0%) | 8 (6.6%) |
| 2 Vehicles | 35 (32.7%) | 41 (33.9%) |
| 3 Vehicles | 45 (42.1%) | 32 (26.5%) |
| 4 Vehicles | 15 (14.0%) | 21 (17.4%) |
| 5 or more Vehicles | 9 (8.4%) | 18 (14.9%) |
| Total | 107 (100.0%) | 121 (100.0%) |
Commute Time in Touchet
The most frequently occuring commute durations in Touchet are 25 to 29 minutes (79 commuters, 36.7%), 30 to 34 minutes (30 commuters, 14.0%), and 60 to 89 minutes (23 commuters, 10.7%).
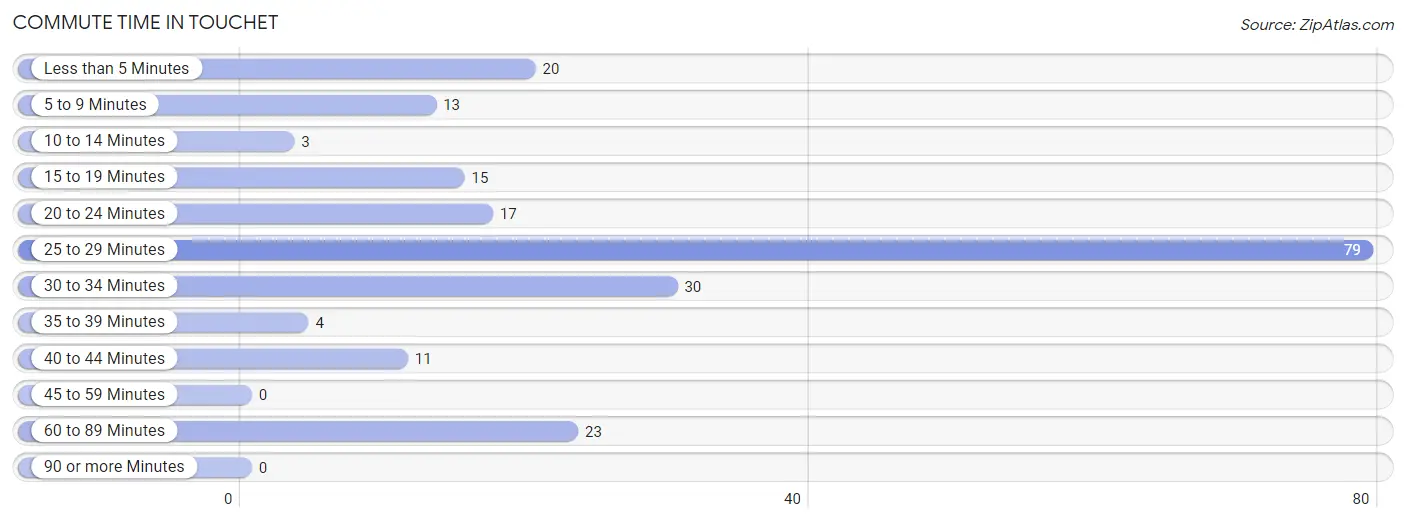
| Commute Time | # Commuters | % Commuters |
| Less than 5 Minutes | 20 | 9.3% |
| 5 to 9 Minutes | 13 | 6.0% |
| 10 to 14 Minutes | 3 | 1.4% |
| 15 to 19 Minutes | 15 | 7.0% |
| 20 to 24 Minutes | 17 | 7.9% |
| 25 to 29 Minutes | 79 | 36.7% |
| 30 to 34 Minutes | 30 | 14.0% |
| 35 to 39 Minutes | 4 | 1.9% |
| 40 to 44 Minutes | 11 | 5.1% |
| 45 to 59 Minutes | 0 | 0.0% |
| 60 to 89 Minutes | 23 | 10.7% |
| 90 or more Minutes | 0 | 0.0% |
Commute Time by Sex in Touchet
The most common commute times in Touchet are 25 to 29 minutes (31 commuters, 29.0%) for males and 25 to 29 minutes (48 commuters, 44.4%) for females.
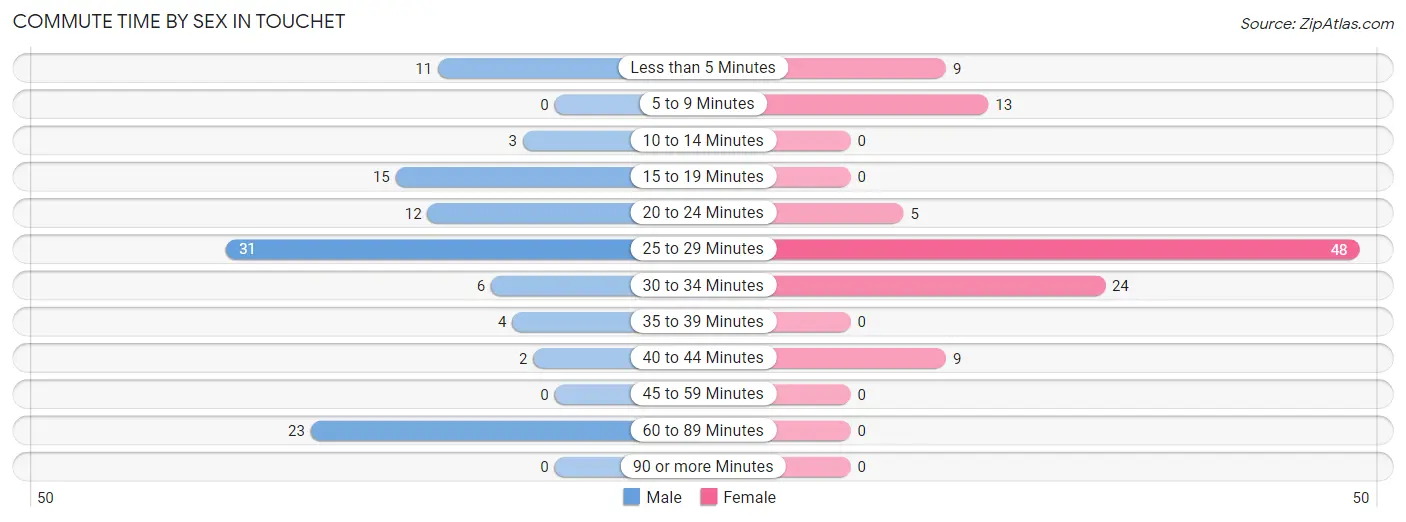
| Commute Time | Male | Female |
| Less than 5 Minutes | 11 (10.3%) | 9 (8.3%) |
| 5 to 9 Minutes | 0 (0.0%) | 13 (12.0%) |
| 10 to 14 Minutes | 3 (2.8%) | 0 (0.0%) |
| 15 to 19 Minutes | 15 (14.0%) | 0 (0.0%) |
| 20 to 24 Minutes | 12 (11.2%) | 5 (4.6%) |
| 25 to 29 Minutes | 31 (29.0%) | 48 (44.4%) |
| 30 to 34 Minutes | 6 (5.6%) | 24 (22.2%) |
| 35 to 39 Minutes | 4 (3.7%) | 0 (0.0%) |
| 40 to 44 Minutes | 2 (1.9%) | 9 (8.3%) |
| 45 to 59 Minutes | 0 (0.0%) | 0 (0.0%) |
| 60 to 89 Minutes | 23 (21.5%) | 0 (0.0%) |
| 90 or more Minutes | 0 (0.0%) | 0 (0.0%) |
Time of Departure to Work by Sex in Touchet
The most frequent times of departure to work in Touchet are 6:00 AM to 6:29 AM (27, 25.2%) for males and 7:00 AM to 7:29 AM (45, 41.7%) for females.
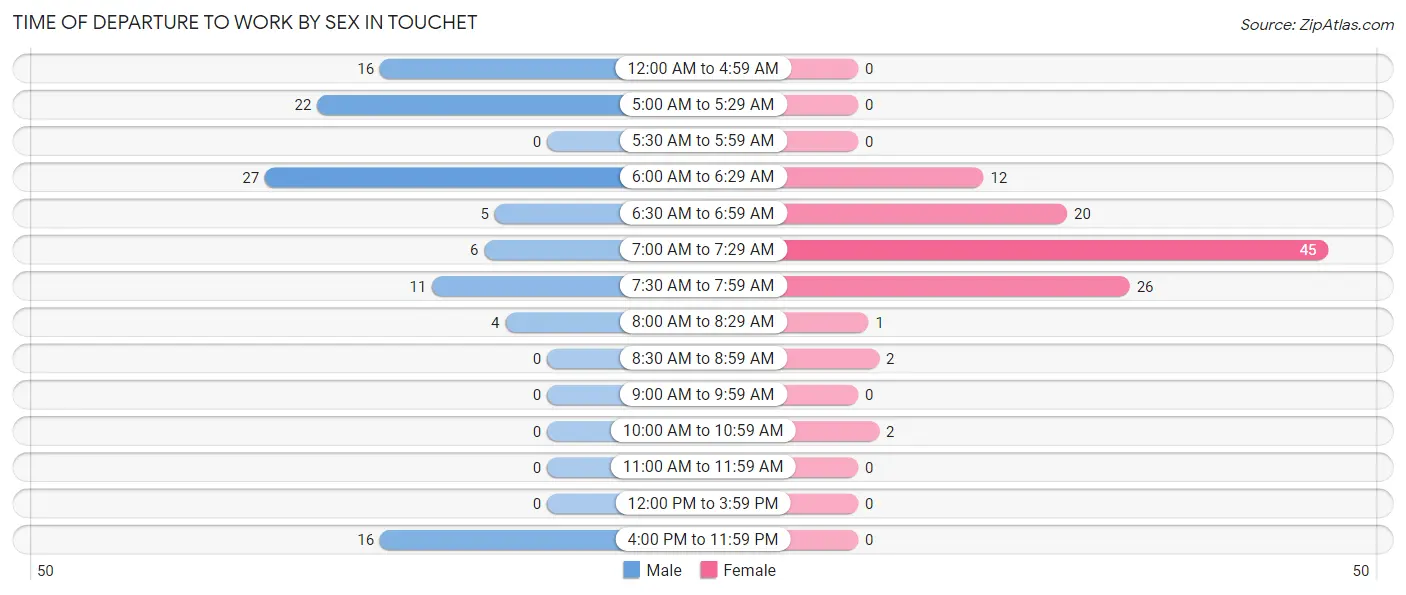
| Time of Departure | Male | Female |
| 12:00 AM to 4:59 AM | 16 (14.9%) | 0 (0.0%) |
| 5:00 AM to 5:29 AM | 22 (20.6%) | 0 (0.0%) |
| 5:30 AM to 5:59 AM | 0 (0.0%) | 0 (0.0%) |
| 6:00 AM to 6:29 AM | 27 (25.2%) | 12 (11.1%) |
| 6:30 AM to 6:59 AM | 5 (4.7%) | 20 (18.5%) |
| 7:00 AM to 7:29 AM | 6 (5.6%) | 45 (41.7%) |
| 7:30 AM to 7:59 AM | 11 (10.3%) | 26 (24.1%) |
| 8:00 AM to 8:29 AM | 4 (3.7%) | 1 (0.9%) |
| 8:30 AM to 8:59 AM | 0 (0.0%) | 2 (1.8%) |
| 9:00 AM to 9:59 AM | 0 (0.0%) | 0 (0.0%) |
| 10:00 AM to 10:59 AM | 0 (0.0%) | 2 (1.8%) |
| 11:00 AM to 11:59 AM | 0 (0.0%) | 0 (0.0%) |
| 12:00 PM to 3:59 PM | 0 (0.0%) | 0 (0.0%) |
| 4:00 PM to 11:59 PM | 16 (14.9%) | 0 (0.0%) |
| Total | 107 (100.0%) | 108 (100.0%) |
Housing Occupancy in Touchet
Occupancy by Ownership in Touchet
Of the total 171 dwellings in Touchet, owner-occupied units account for 154 (90.1%), while renter-occupied units make up 17 (9.9%).
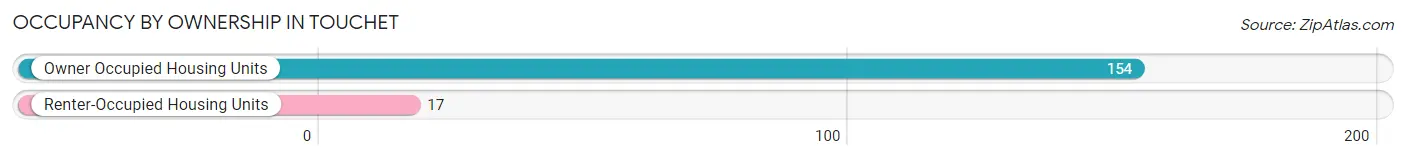
| Occupancy | # Housing Units | % Housing Units |
| Owner Occupied Housing Units | 154 | 90.1% |
| Renter-Occupied Housing Units | 17 | 9.9% |
| Total Occupied Housing Units | 171 | 100.0% |
Occupancy by Household Size in Touchet
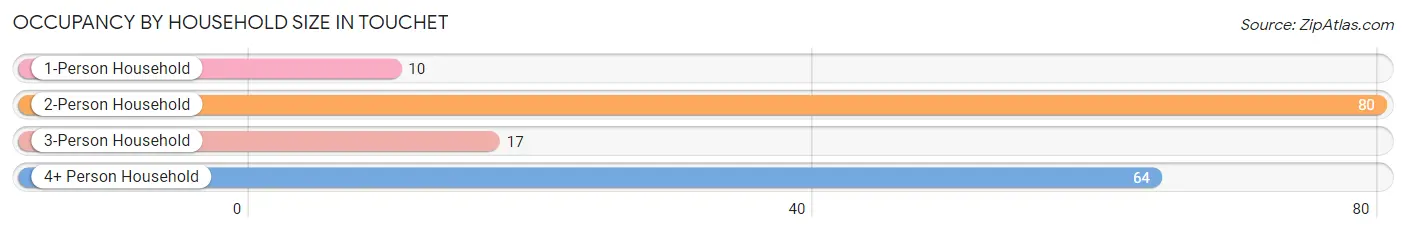
| Household Size | # Housing Units | % Housing Units |
| 1-Person Household | 10 | 5.9% |
| 2-Person Household | 80 | 46.8% |
| 3-Person Household | 17 | 9.9% |
| 4+ Person Household | 64 | 37.4% |
| Total Housing Units | 171 | 100.0% |
Occupancy by Ownership by Household Size in Touchet
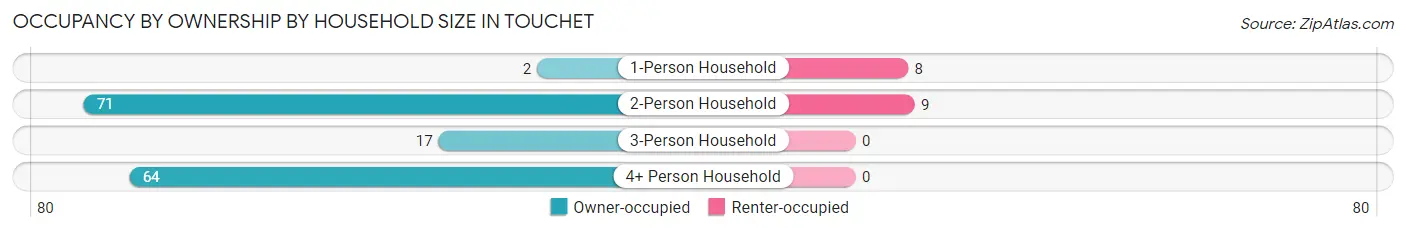
| Household Size | Owner-occupied | Renter-occupied |
| 1-Person Household | 2 (20.0%) | 8 (80.0%) |
| 2-Person Household | 71 (88.7%) | 9 (11.3%) |
| 3-Person Household | 17 (100.0%) | 0 (0.0%) |
| 4+ Person Household | 64 (100.0%) | 0 (0.0%) |
| Total Housing Units | 154 (90.1%) | 17 (9.9%) |
Occupancy by Educational Attainment in Touchet
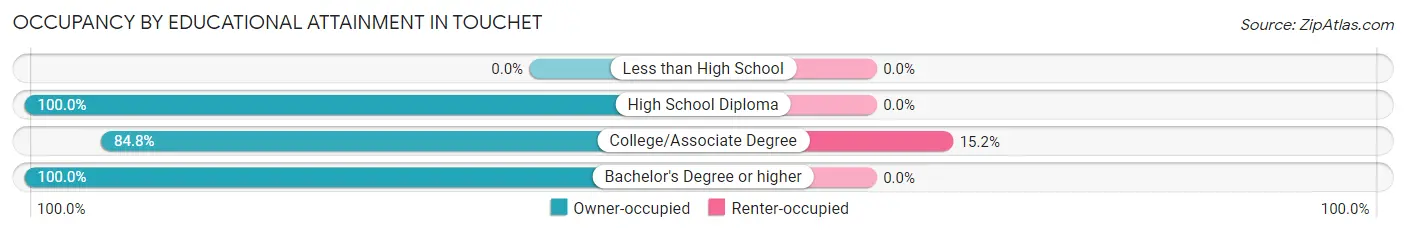
| Household Size | Owner-occupied | Renter-occupied |
| Less than High School | 0 (0.0%) | 0 (0.0%) |
| High School Diploma | 34 (100.0%) | 0 (0.0%) |
| College/Associate Degree | 95 (84.8%) | 17 (15.2%) |
| Bachelor's Degree or higher | 25 (100.0%) | 0 (0.0%) |
Occupancy by Age of Householder in Touchet
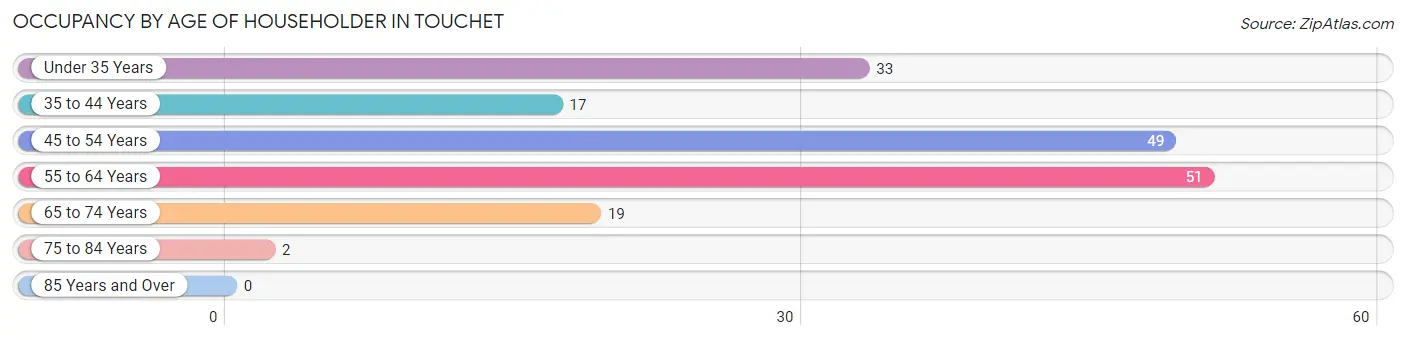
| Age Bracket | # Households | % Households |
| Under 35 Years | 33 | 19.3% |
| 35 to 44 Years | 17 | 9.9% |
| 45 to 54 Years | 49 | 28.6% |
| 55 to 64 Years | 51 | 29.8% |
| 65 to 74 Years | 19 | 11.1% |
| 75 to 84 Years | 2 | 1.2% |
| 85 Years and Over | 0 | 0.0% |
| Total | 171 | 100.0% |
Housing Finances in Touchet
Median Income by Occupancy in Touchet
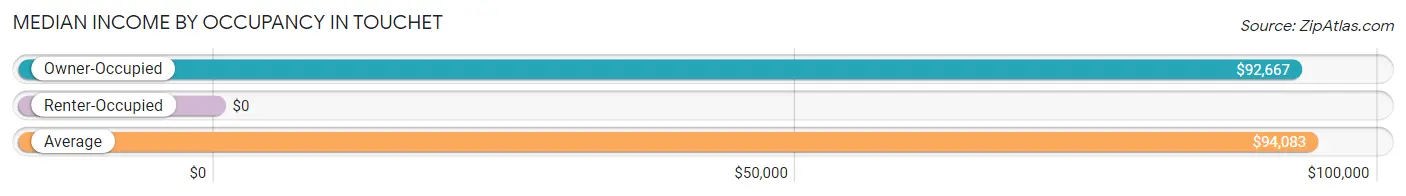
| Occupancy Type | # Households | Median Income |
| Owner-Occupied | 154 (90.1%) | $92,667 |
| Renter-Occupied | 17 (9.9%) | $0 |
| Average | 171 (100.0%) | $94,083 |
Occupancy by Householder Income Bracket in Touchet
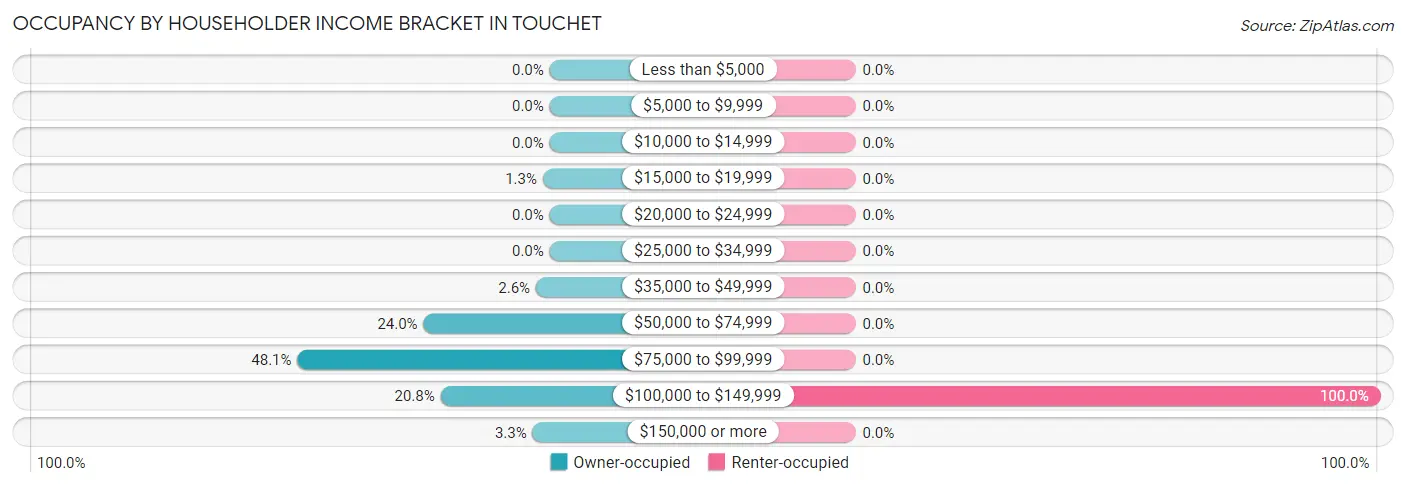
| Income Bracket | Owner-occupied | Renter-occupied |
| Less than $5,000 | 0 (0.0%) | 0 (0.0%) |
| $5,000 to $9,999 | 0 (0.0%) | 0 (0.0%) |
| $10,000 to $14,999 | 0 (0.0%) | 0 (0.0%) |
| $15,000 to $19,999 | 2 (1.3%) | 0 (0.0%) |
| $20,000 to $24,999 | 0 (0.0%) | 0 (0.0%) |
| $25,000 to $34,999 | 0 (0.0%) | 0 (0.0%) |
| $35,000 to $49,999 | 4 (2.6%) | 0 (0.0%) |
| $50,000 to $74,999 | 37 (24.0%) | 0 (0.0%) |
| $75,000 to $99,999 | 74 (48.0%) | 0 (0.0%) |
| $100,000 to $149,999 | 32 (20.8%) | 17 (100.0%) |
| $150,000 or more | 5 (3.3%) | 0 (0.0%) |
| Total | 154 (100.0%) | 17 (100.0%) |
Monthly Housing Cost Tiers in Touchet
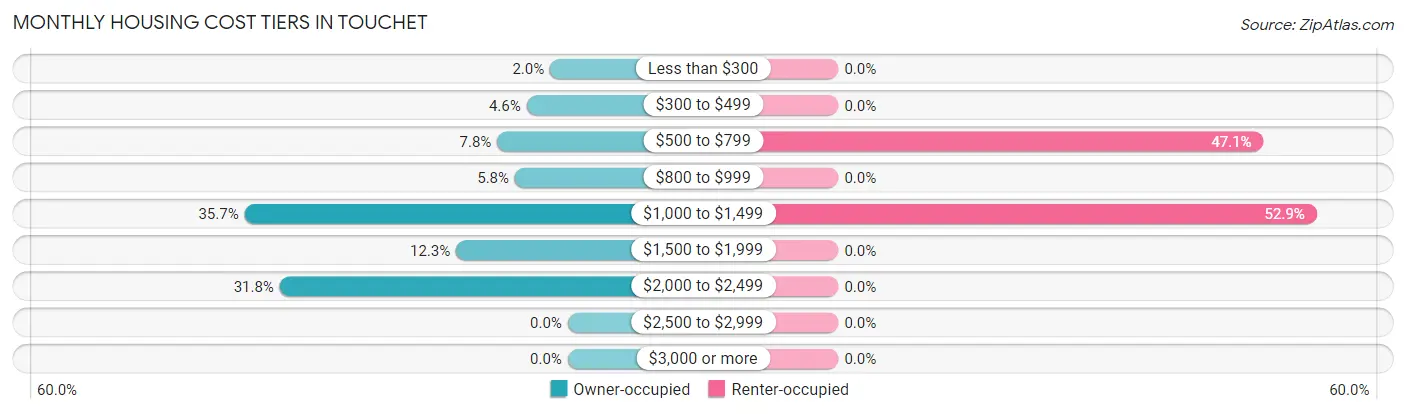
| Monthly Cost | Owner-occupied | Renter-occupied |
| Less than $300 | 3 (1.9%) | 0 (0.0%) |
| $300 to $499 | 7 (4.5%) | 0 (0.0%) |
| $500 to $799 | 12 (7.8%) | 8 (47.1%) |
| $800 to $999 | 9 (5.8%) | 0 (0.0%) |
| $1,000 to $1,499 | 55 (35.7%) | 9 (52.9%) |
| $1,500 to $1,999 | 19 (12.3%) | 0 (0.0%) |
| $2,000 to $2,499 | 49 (31.8%) | 0 (0.0%) |
| $2,500 to $2,999 | 0 (0.0%) | 0 (0.0%) |
| $3,000 or more | 0 (0.0%) | 0 (0.0%) |
| Total | 154 (100.0%) | 17 (100.0%) |
Physical Housing Characteristics in Touchet
Housing Structures in Touchet
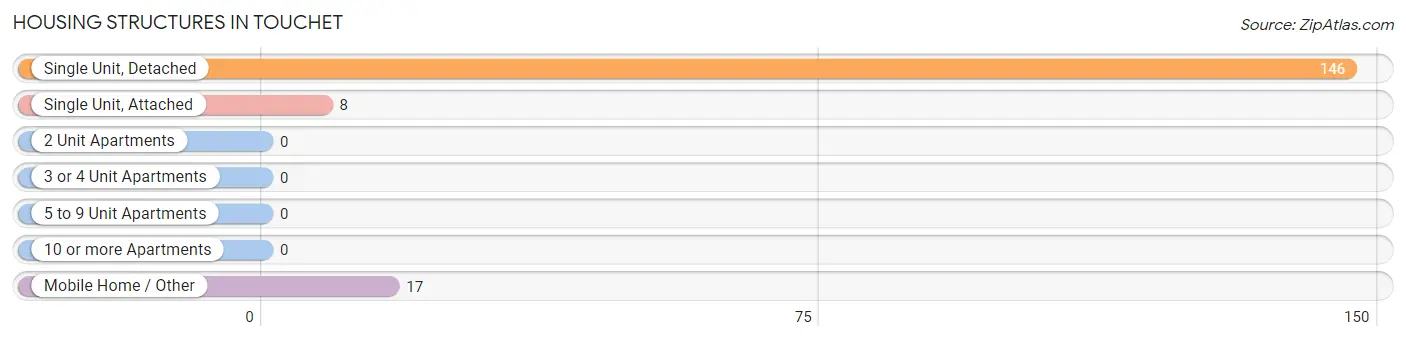
| Structure Type | # Housing Units | % Housing Units |
| Single Unit, Detached | 146 | 85.4% |
| Single Unit, Attached | 8 | 4.7% |
| 2 Unit Apartments | 0 | 0.0% |
| 3 or 4 Unit Apartments | 0 | 0.0% |
| 5 to 9 Unit Apartments | 0 | 0.0% |
| 10 or more Apartments | 0 | 0.0% |
| Mobile Home / Other | 17 | 9.9% |
| Total | 171 | 100.0% |
Housing Structures by Occupancy in Touchet
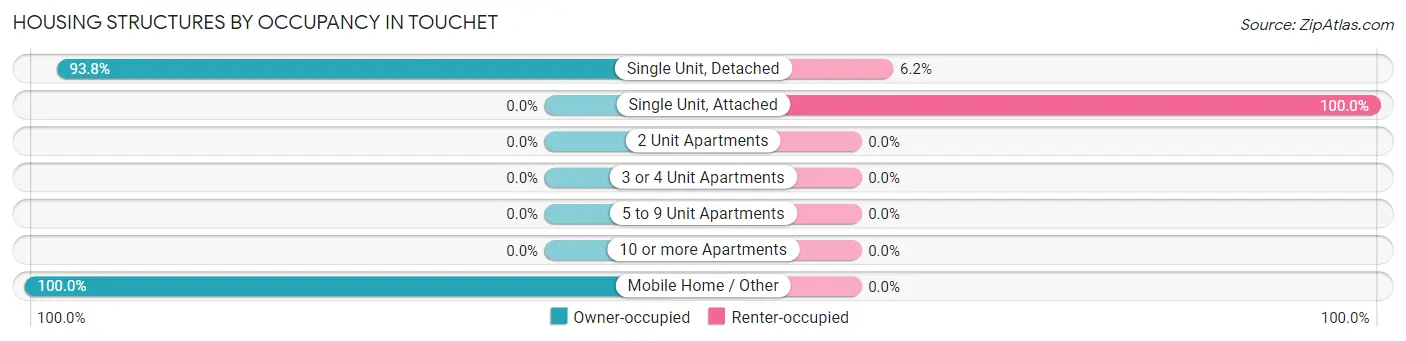
| Structure Type | Owner-occupied | Renter-occupied |
| Single Unit, Detached | 137 (93.8%) | 9 (6.2%) |
| Single Unit, Attached | 0 (0.0%) | 8 (100.0%) |
| 2 Unit Apartments | 0 (0.0%) | 0 (0.0%) |
| 3 or 4 Unit Apartments | 0 (0.0%) | 0 (0.0%) |
| 5 to 9 Unit Apartments | 0 (0.0%) | 0 (0.0%) |
| 10 or more Apartments | 0 (0.0%) | 0 (0.0%) |
| Mobile Home / Other | 17 (100.0%) | 0 (0.0%) |
| Total | 154 (90.1%) | 17 (9.9%) |
Housing Structures by Number of Rooms in Touchet
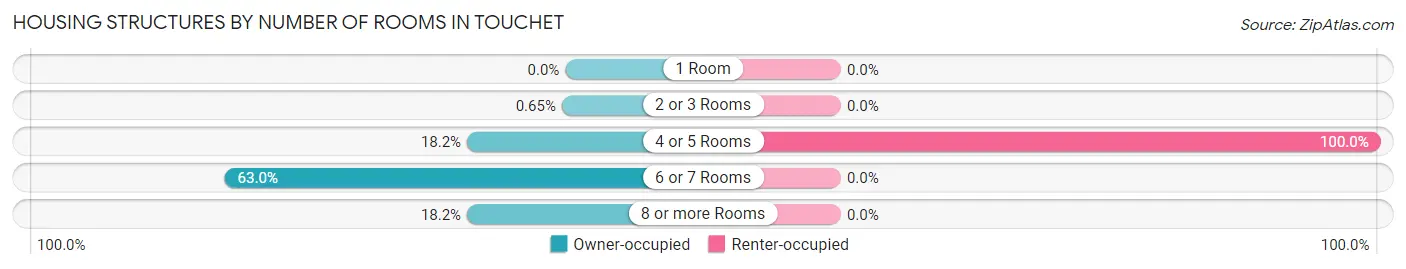
| Number of Rooms | Owner-occupied | Renter-occupied |
| 1 Room | 0 (0.0%) | 0 (0.0%) |
| 2 or 3 Rooms | 1 (0.6%) | 0 (0.0%) |
| 4 or 5 Rooms | 28 (18.2%) | 17 (100.0%) |
| 6 or 7 Rooms | 97 (63.0%) | 0 (0.0%) |
| 8 or more Rooms | 28 (18.2%) | 0 (0.0%) |
| Total | 154 (100.0%) | 17 (100.0%) |
Housing Structure by Heating Type in Touchet
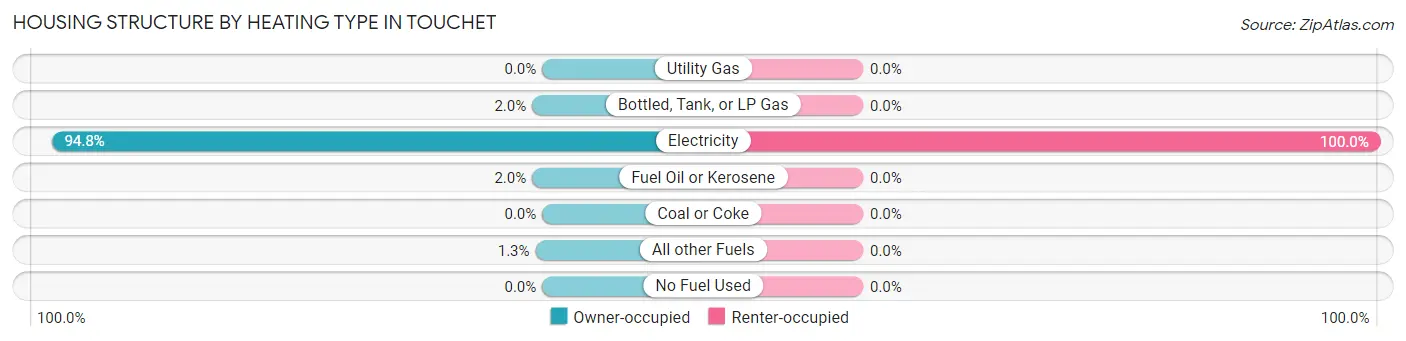
| Heating Type | Owner-occupied | Renter-occupied |
| Utility Gas | 0 (0.0%) | 0 (0.0%) |
| Bottled, Tank, or LP Gas | 3 (1.9%) | 0 (0.0%) |
| Electricity | 146 (94.8%) | 17 (100.0%) |
| Fuel Oil or Kerosene | 3 (1.9%) | 0 (0.0%) |
| Coal or Coke | 0 (0.0%) | 0 (0.0%) |
| All other Fuels | 2 (1.3%) | 0 (0.0%) |
| No Fuel Used | 0 (0.0%) | 0 (0.0%) |
| Total | 154 (100.0%) | 17 (100.0%) |
Household Vehicle Usage in Touchet
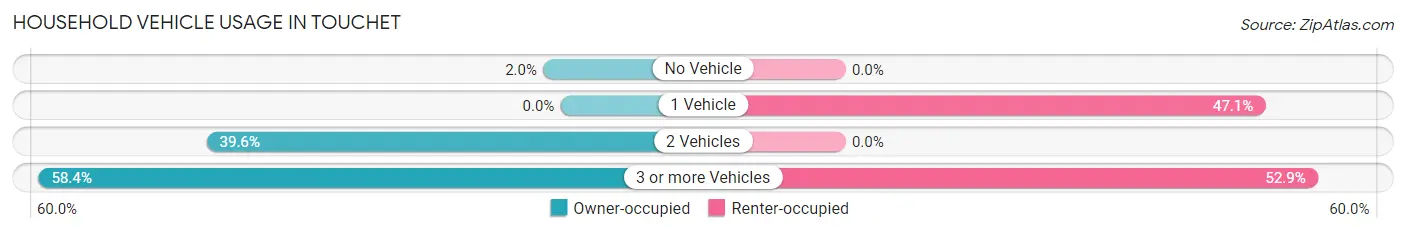
| Vehicles per Household | Owner-occupied | Renter-occupied |
| No Vehicle | 3 (1.9%) | 0 (0.0%) |
| 1 Vehicle | 0 (0.0%) | 8 (47.1%) |
| 2 Vehicles | 61 (39.6%) | 0 (0.0%) |
| 3 or more Vehicles | 90 (58.4%) | 9 (52.9%) |
| Total | 154 (100.0%) | 17 (100.0%) |
Real Estate & Mortgages in Touchet
Real Estate and Mortgage Overview in Touchet
| Characteristic | Without Mortgage | With Mortgage |
| Housing Units | 23 | 131 |
| Median Property Value | $325,000 | $259,400 |
| Median Household Income | $76,750 | $5 |
| Monthly Housing Costs | $550 | $0 |
| Real Estate Taxes | $2,722 | $0 |
Property Value by Mortgage Status in Touchet
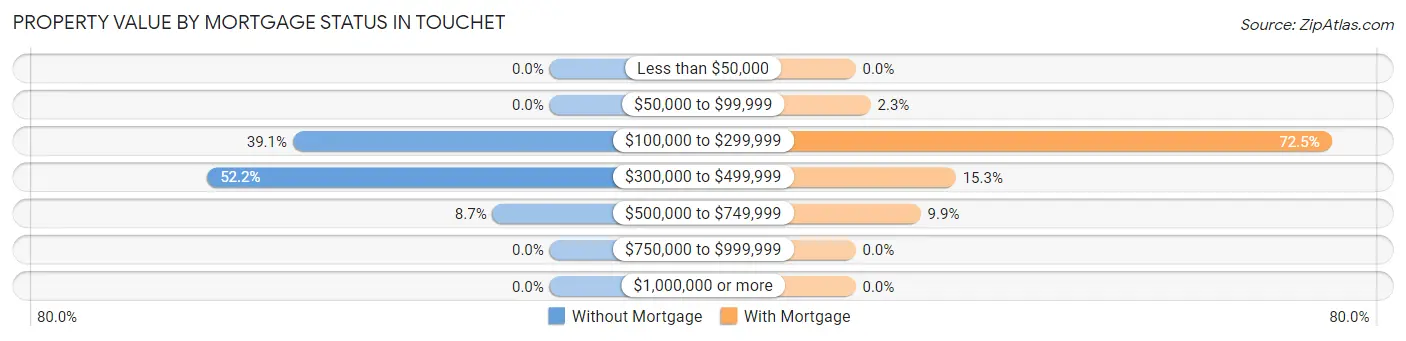
| Property Value | Without Mortgage | With Mortgage |
| Less than $50,000 | 0 (0.0%) | 0 (0.0%) |
| $50,000 to $99,999 | 0 (0.0%) | 3 (2.3%) |
| $100,000 to $299,999 | 9 (39.1%) | 95 (72.5%) |
| $300,000 to $499,999 | 12 (52.2%) | 20 (15.3%) |
| $500,000 to $749,999 | 2 (8.7%) | 13 (9.9%) |
| $750,000 to $999,999 | 0 (0.0%) | 0 (0.0%) |
| $1,000,000 or more | 0 (0.0%) | 0 (0.0%) |
| Total | 23 (100.0%) | 131 (100.0%) |
Household Income by Mortgage Status in Touchet
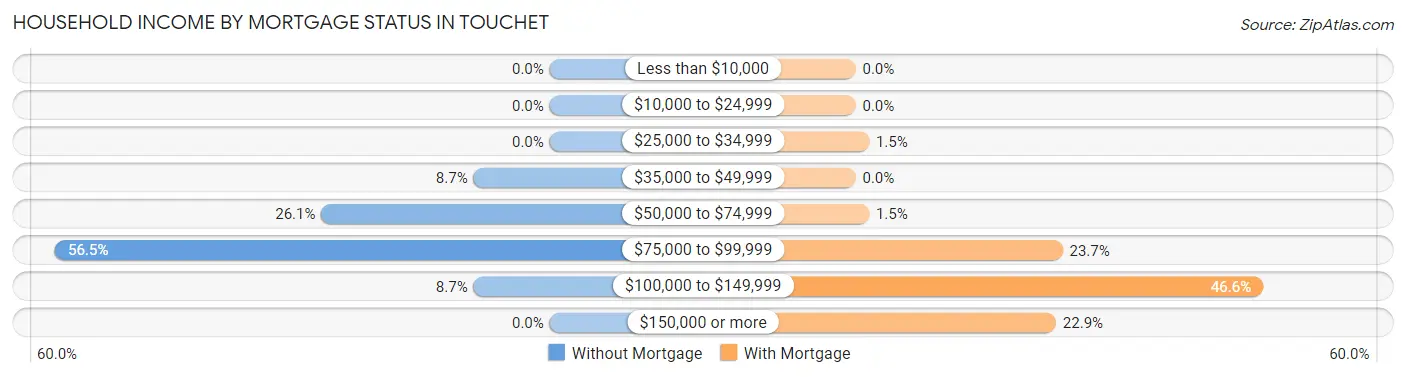
| Household Income | Without Mortgage | With Mortgage |
| Less than $10,000 | 0 (0.0%) | 0 (0.0%) |
| $10,000 to $24,999 | 0 (0.0%) | 0 (0.0%) |
| $25,000 to $34,999 | 0 (0.0%) | 2 (1.5%) |
| $35,000 to $49,999 | 2 (8.7%) | 0 (0.0%) |
| $50,000 to $74,999 | 6 (26.1%) | 2 (1.5%) |
| $75,000 to $99,999 | 13 (56.5%) | 31 (23.7%) |
| $100,000 to $149,999 | 2 (8.7%) | 61 (46.6%) |
| $150,000 or more | 0 (0.0%) | 30 (22.9%) |
| Total | 23 (100.0%) | 131 (100.0%) |
Property Value to Household Income Ratio in Touchet
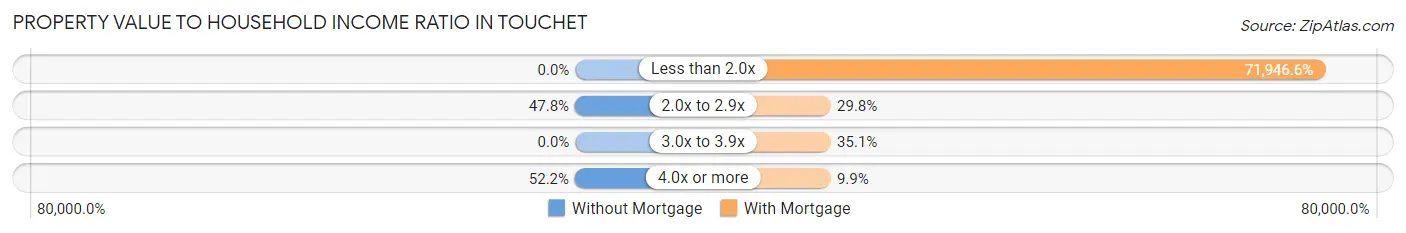
| Value-to-Income Ratio | Without Mortgage | With Mortgage |
| Less than 2.0x | 0 (0.0%) | 94,250 (71,946.6%) |
| 2.0x to 2.9x | 11 (47.8%) | 39 (29.8%) |
| 3.0x to 3.9x | 0 (0.0%) | 46 (35.1%) |
| 4.0x or more | 12 (52.2%) | 13 (9.9%) |
| Total | 23 (100.0%) | 131 (100.0%) |
Real Estate Taxes by Mortgage Status in Touchet
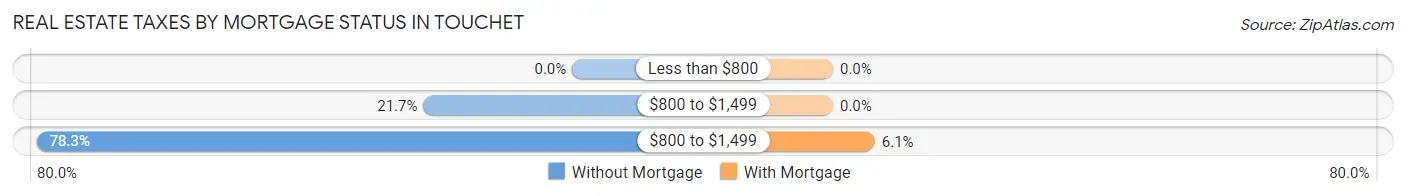
| Property Taxes | Without Mortgage | With Mortgage |
| Less than $800 | 0 (0.0%) | 0 (0.0%) |
| $800 to $1,499 | 5 (21.7%) | 0 (0.0%) |
| $800 to $1,499 | 18 (78.3%) | 8 (6.1%) |
| Total | 23 (100.0%) | 131 (100.0%) |
Health & Disability in Touchet
Health Insurance Coverage by Age in Touchet
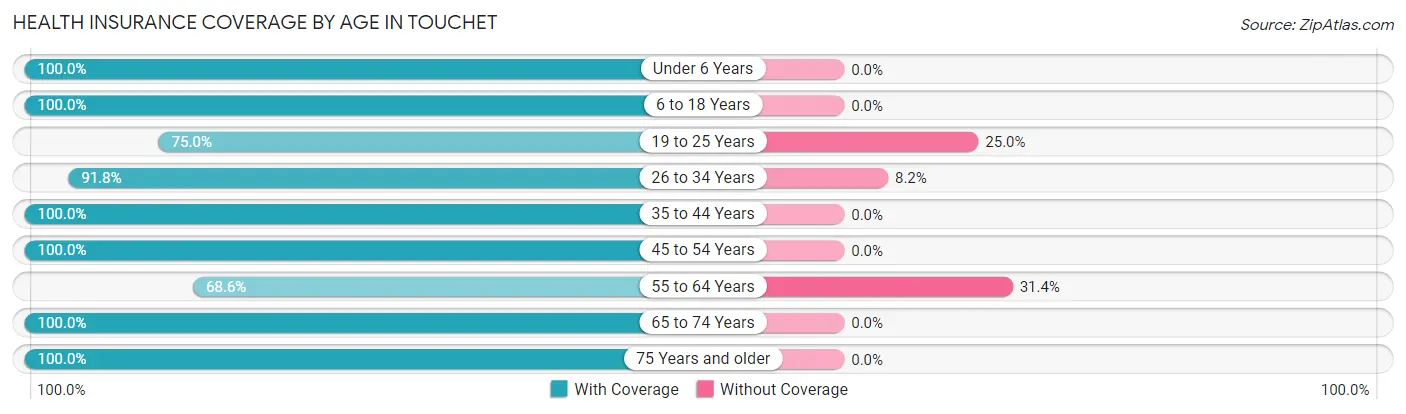
| Age Bracket | With Coverage | Without Coverage |
| Under 6 Years | 37 (100.0%) | 0 (0.0%) |
| 6 to 18 Years | 134 (100.0%) | 0 (0.0%) |
| 19 to 25 Years | 3 (75.0%) | 1 (25.0%) |
| 26 to 34 Years | 45 (91.8%) | 4 (8.2%) |
| 35 to 44 Years | 51 (100.0%) | 0 (0.0%) |
| 45 to 54 Years | 88 (100.0%) | 0 (0.0%) |
| 55 to 64 Years | 59 (68.6%) | 27 (31.4%) |
| 65 to 74 Years | 31 (100.0%) | 0 (0.0%) |
| 75 Years and older | 5 (100.0%) | 0 (0.0%) |
| Total | 453 (93.4%) | 32 (6.6%) |
Health Insurance Coverage by Citizenship Status in Touchet
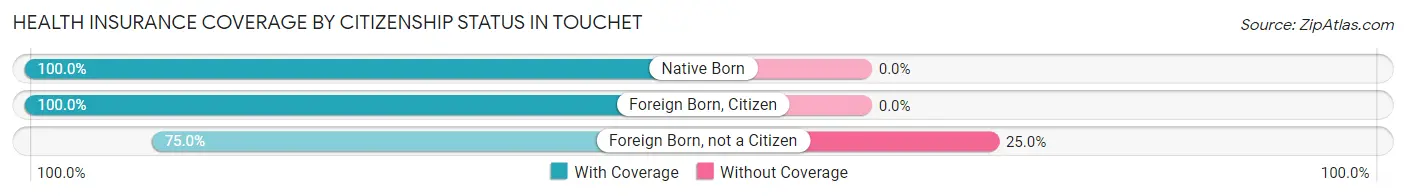
| Citizenship Status | With Coverage | Without Coverage |
| Native Born | 37 (100.0%) | 0 (0.0%) |
| Foreign Born, Citizen | 134 (100.0%) | 0 (0.0%) |
| Foreign Born, not a Citizen | 3 (75.0%) | 1 (25.0%) |
Health Insurance Coverage by Household Income in Touchet
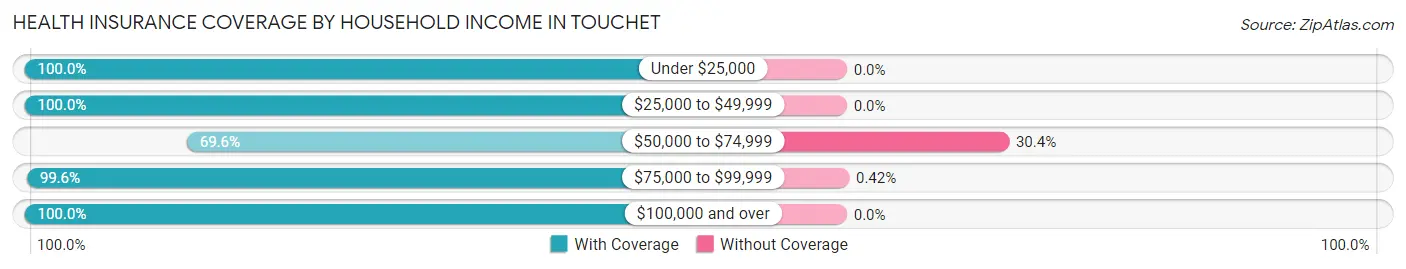
| Household Income | With Coverage | Without Coverage |
| Under $25,000 | 5 (100.0%) | 0 (0.0%) |
| $25,000 to $49,999 | 5 (100.0%) | 0 (0.0%) |
| $50,000 to $74,999 | 71 (69.6%) | 31 (30.4%) |
| $75,000 to $99,999 | 239 (99.6%) | 1 (0.4%) |
| $100,000 and over | 133 (100.0%) | 0 (0.0%) |
Public vs Private Health Insurance Coverage by Age in Touchet
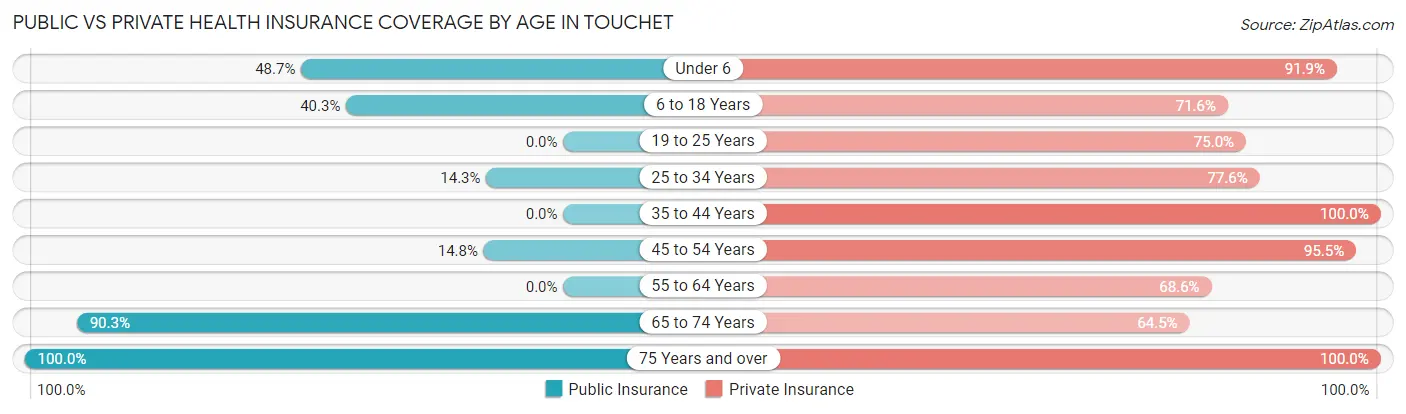
| Age Bracket | Public Insurance | Private Insurance |
| Under 6 | 18 (48.6%) | 34 (91.9%) |
| 6 to 18 Years | 54 (40.3%) | 96 (71.6%) |
| 19 to 25 Years | 0 (0.0%) | 3 (75.0%) |
| 25 to 34 Years | 7 (14.3%) | 38 (77.5%) |
| 35 to 44 Years | 0 (0.0%) | 51 (100.0%) |
| 45 to 54 Years | 13 (14.8%) | 84 (95.5%) |
| 55 to 64 Years | 0 (0.0%) | 59 (68.6%) |
| 65 to 74 Years | 28 (90.3%) | 20 (64.5%) |
| 75 Years and over | 5 (100.0%) | 5 (100.0%) |
| Total | 125 (25.8%) | 390 (80.4%) |
Disability Status by Sex by Age in Touchet
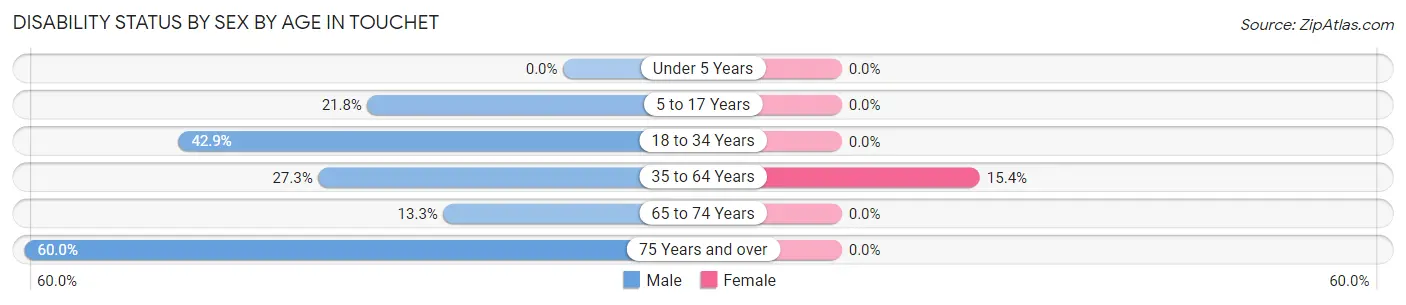
| Age Bracket | Male | Female |
| Under 5 Years | 0 (0.0%) | 0 (0.0%) |
| 5 to 17 Years | 17 (21.8%) | 0 (0.0%) |
| 18 to 34 Years | 9 (42.9%) | 0 (0.0%) |
| 35 to 64 Years | 33 (27.3%) | 16 (15.4%) |
| 65 to 74 Years | 2 (13.3%) | 0 (0.0%) |
| 75 Years and over | 3 (60.0%) | 0 (0.0%) |
Disability Class by Sex by Age in Touchet
Disability Class: Hearing Difficulty
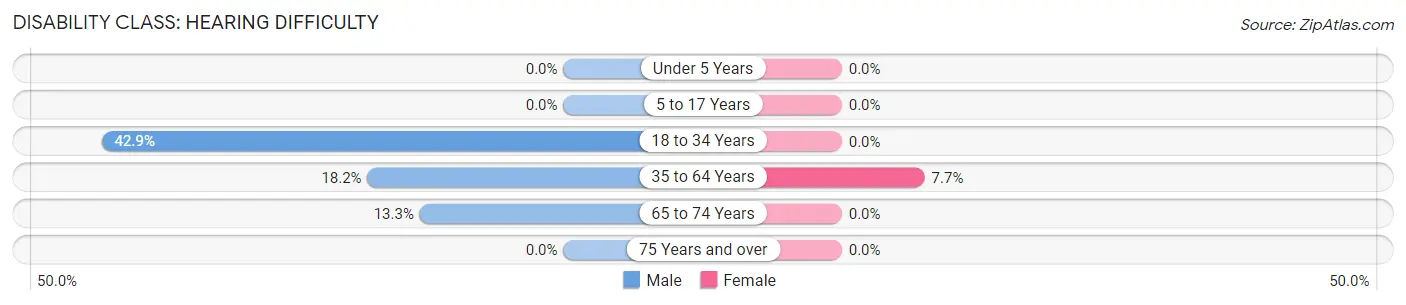
| Age Bracket | Male | Female |
| Under 5 Years | 0 (0.0%) | 0 (0.0%) |
| 5 to 17 Years | 0 (0.0%) | 0 (0.0%) |
| 18 to 34 Years | 9 (42.9%) | 0 (0.0%) |
| 35 to 64 Years | 22 (18.2%) | 8 (7.7%) |
| 65 to 74 Years | 2 (13.3%) | 0 (0.0%) |
| 75 Years and over | 0 (0.0%) | 0 (0.0%) |
Disability Class: Vision Difficulty
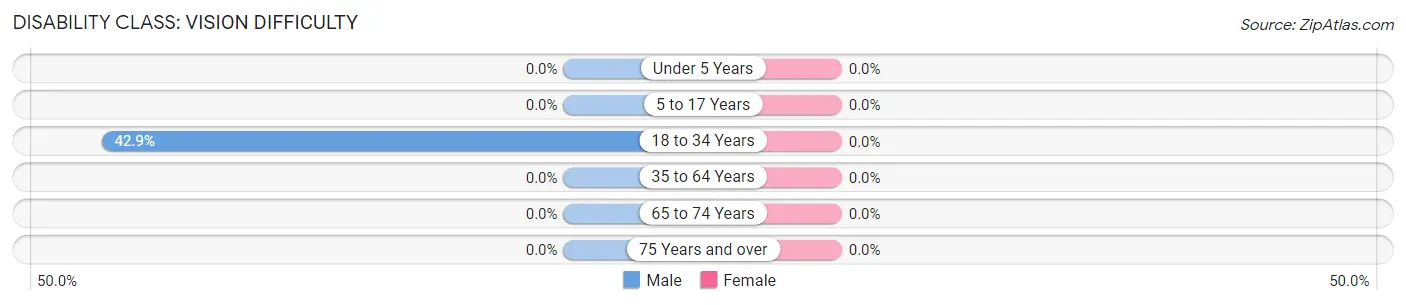
| Age Bracket | Male | Female |
| Under 5 Years | 0 (0.0%) | 0 (0.0%) |
| 5 to 17 Years | 0 (0.0%) | 0 (0.0%) |
| 18 to 34 Years | 9 (42.9%) | 0 (0.0%) |
| 35 to 64 Years | 0 (0.0%) | 0 (0.0%) |
| 65 to 74 Years | 0 (0.0%) | 0 (0.0%) |
| 75 Years and over | 0 (0.0%) | 0 (0.0%) |
Disability Class: Cognitive Difficulty
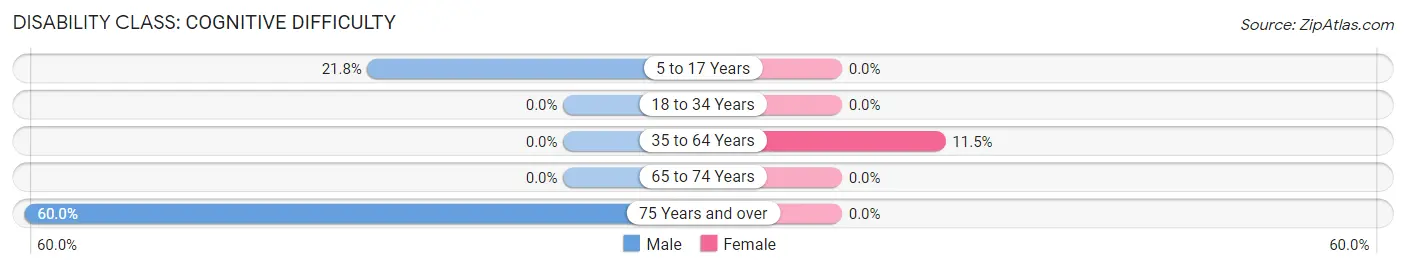
| Age Bracket | Male | Female |
| 5 to 17 Years | 17 (21.8%) | 0 (0.0%) |
| 18 to 34 Years | 0 (0.0%) | 0 (0.0%) |
| 35 to 64 Years | 0 (0.0%) | 12 (11.5%) |
| 65 to 74 Years | 0 (0.0%) | 0 (0.0%) |
| 75 Years and over | 3 (60.0%) | 0 (0.0%) |
Disability Class: Ambulatory Difficulty
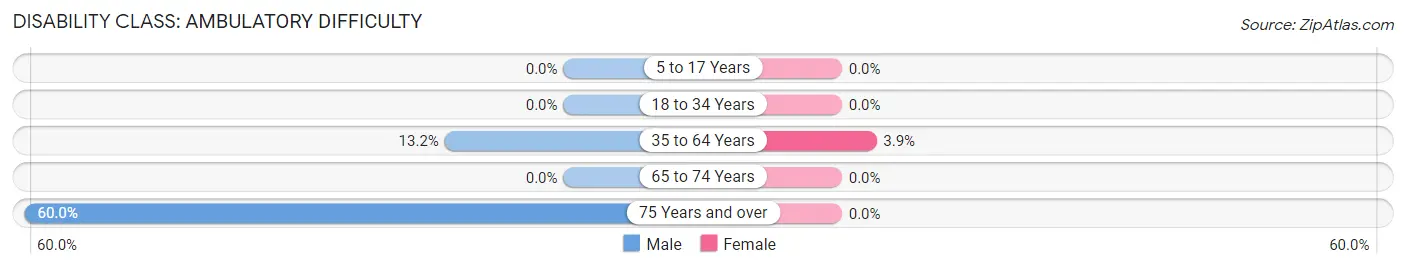
| Age Bracket | Male | Female |
| 5 to 17 Years | 0 (0.0%) | 0 (0.0%) |
| 18 to 34 Years | 0 (0.0%) | 0 (0.0%) |
| 35 to 64 Years | 16 (13.2%) | 4 (3.8%) |
| 65 to 74 Years | 0 (0.0%) | 0 (0.0%) |
| 75 Years and over | 3 (60.0%) | 0 (0.0%) |
Disability Class: Self-Care Difficulty
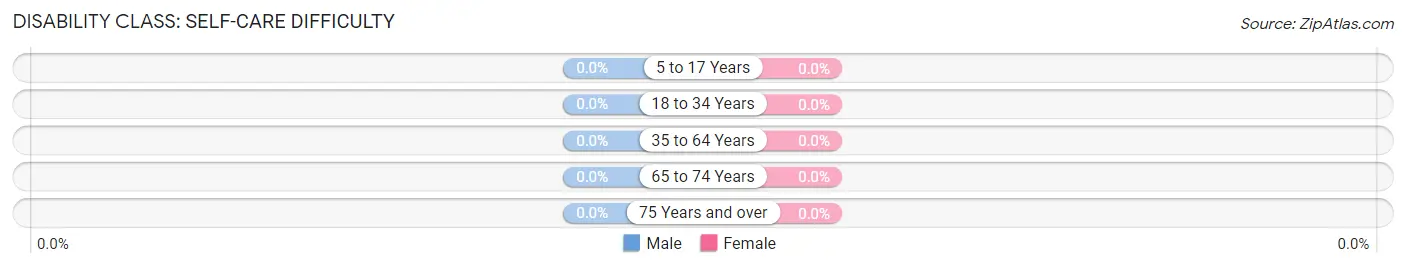
| Age Bracket | Male | Female |
| 5 to 17 Years | 0 (0.0%) | 0 (0.0%) |
| 18 to 34 Years | 0 (0.0%) | 0 (0.0%) |
| 35 to 64 Years | 0 (0.0%) | 0 (0.0%) |
| 65 to 74 Years | 0 (0.0%) | 0 (0.0%) |
| 75 Years and over | 0 (0.0%) | 0 (0.0%) |
Technology Access in Touchet
Computing Device Access in Touchet
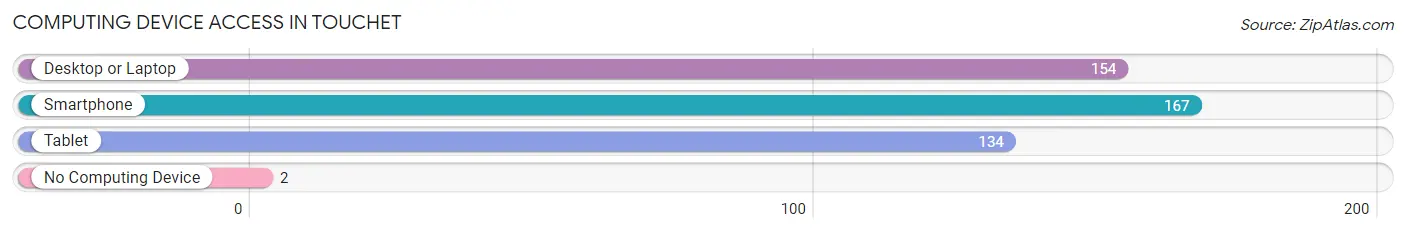
| Device Type | # Households | % Households |
| Desktop or Laptop | 154 | 90.1% |
| Smartphone | 167 | 97.7% |
| Tablet | 134 | 78.4% |
| No Computing Device | 2 | 1.2% |
| Total | 171 | 100.0% |
Internet Access in Touchet
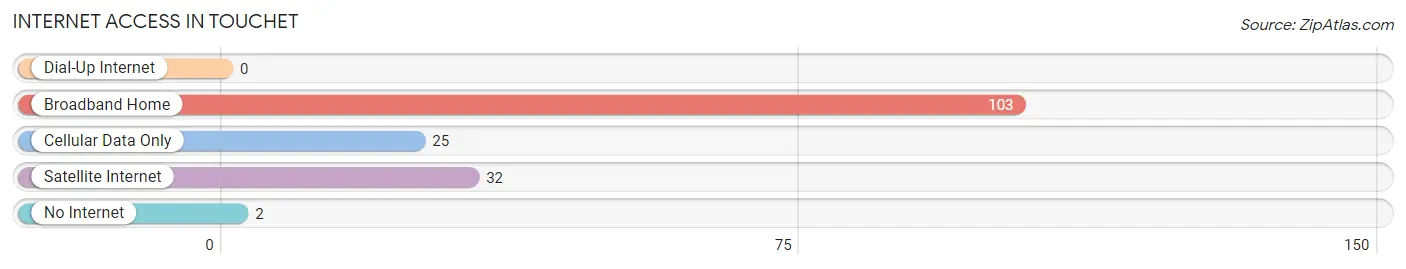
| Internet Type | # Households | % Households |
| Dial-Up Internet | 0 | 0.0% |
| Broadband Home | 103 | 60.2% |
| Cellular Data Only | 25 | 14.6% |
| Satellite Internet | 32 | 18.7% |
| No Internet | 2 | 1.2% |
| Total | 171 | 100.0% |
Touchet Summary
Touchet is a small town located in the southeastern corner of Washington State, in the heart of the Columbia River Plateau. It is situated in the foothills of the Blue Mountains, and is surrounded by rolling hills and farmland. The town is located on the Touchet River, which is a tributary of the Columbia River. The population of Touchet was 545 in the 2010 census.
History
Touchet was first settled in the late 1800s by homesteaders who were attracted to the area by its fertile soil and abundant water. The town was originally called "Touchetville" and was established in 1883. The name was changed to Touchet in 1891. The town was incorporated in 1909.
Touchet was an important stop on the Oregon Trail, and was a major trading center for the region. The town was also a major shipping point for wheat, which was grown in the surrounding area.
Touchet was also the site of a major battle during the Nez Perce War of 1877. The battle, which was fought between the Nez Perce Indians and the U.S. Army, resulted in a victory for the Nez Perce.
Geography
Touchet is located in the southeastern corner of Washington State, in the heart of the Columbia River Plateau. The town is situated in the foothills of the Blue Mountains, and is surrounded by rolling hills and farmland. The Touchet River runs through the town, and is a tributary of the Columbia River.
The climate in Touchet is semi-arid, with hot summers and cold winters. The average annual temperature is around 50 degrees Fahrenheit. The average annual precipitation is around 12 inches.
Economy
The economy of Touchet is largely based on agriculture. Wheat, barley, and hay are the main crops grown in the area. The town is also home to several small businesses, including a grocery store, a hardware store, and a restaurant.
Touchet is also home to a number of wineries, which produce a variety of wines from grapes grown in the area. The town is also home to a number of small manufacturing companies, which produce a variety of products, including furniture, clothing, and electronics.
Demographics
The population of Touchet was 545 in the 2010 census. The population is predominantly white, with a small minority of African Americans, Hispanics, and Native Americans. The median household income in Touchet is $37,500, and the median age is 44. The town has a high rate of poverty, with nearly one-third of the population living below the poverty line.
Common Questions
What is Per Capita Income in Touchet?
Per Capita income in Touchet is $30,450.
What is the Median Family Income in Touchet?
Median Family Income in Touchet is $93,333.
What is the Median Household income in Touchet?
Median Household Income in Touchet is $94,083.
What is Income or Wage Gap in Touchet?
Income or Wage Gap in Touchet is 43.0%.
Women in Touchet earn 57.0 cents for every dollar earned by a man.
What is Inequality or Gini Index in Touchet?
Inequality or Gini Index in Touchet is 0.15.
What is the Total Population of Touchet?
Total Population of Touchet is 485.
What is the Total Male Population of Touchet?
Total Male Population of Touchet is 252.
What is the Total Female Population of Touchet?
Total Female Population of Touchet is 233.
What is the Ratio of Males per 100 Females in Touchet?
There are 108.15 Males per 100 Females in Touchet.
What is the Ratio of Females per 100 Males in Touchet?
There are 92.46 Females per 100 Males in Touchet.
What is the Median Population Age in Touchet?
Median Population Age in Touchet is 40.0 Years.
What is the Average Family Size in Touchet
Average Family Size in Touchet is 2.9 People.
What is the Average Household Size in Touchet
Average Household Size in Touchet is 2.8 People.
How Large is the Labor Force in Touchet?
There are 228 People in the Labor Forcein in Touchet.
What is the Percentage of People in the Labor Force in Touchet?
71.7% of People are in the Labor Force in Touchet.