Forks, WA Map & Demographics
Forks Map
Forks Overview
$25,564
PER CAPITA INCOME
$48,549
AVG FAMILY INCOME
$42,080
AVG HOUSEHOLD INCOME
38.7%
WAGE / INCOME GAP [ % ]
61.3¢/ $1
WAGE / INCOME GAP [ $ ]
0.45
INEQUALITY / GINI INDEX
3,380
TOTAL POPULATION
1,516
MALE POPULATION
1,864
FEMALE POPULATION
81.33
MALES / 100 FEMALES
122.96
FEMALES / 100 MALES
33.9
MEDIAN AGE
3.2
AVG FAMILY SIZE
2.5
AVG HOUSEHOLD SIZE
1,665
LABOR FORCE [ PEOPLE ]
63.1%
PERCENT IN LABOR FORCE
8.0%
UNEMPLOYMENT RATE
Forks Zip Codes
Forks Area Codes
Income in Forks
Income Overview in Forks
Per Capita Income in Forks is $25,564, while median incomes of families and households are $48,549 and $42,080 respectively.
| Characteristic | Number | Measure |
| Per Capita Income | 3,380 | $25,564 |
| Median Family Income | 817 | $48,549 |
| Mean Family Income | 817 | $70,158 |
| Median Household Income | 1,302 | $42,080 |
| Mean Household Income | 1,302 | $63,818 |
| Income Deficit | 817 | $0 |
| Wage / Income Gap (%) | 3,380 | 38.67% |
| Wage / Income Gap ($) | 3,380 | 61.33¢ per $1 |
| Gini / Inequality Index | 3,380 | 0.45 |
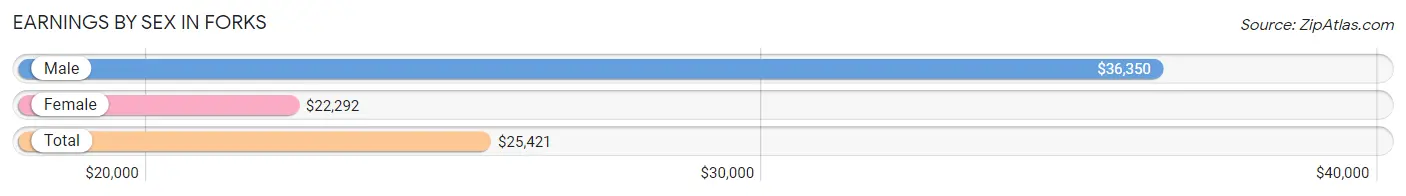
Earnings by Sex in Forks
Average Earnings in Forks are $25,421, $36,350 for men and $22,292 for women, a difference of 38.7%.
| Sex | Number | Average Earnings |
| Male | 865 (45.4%) | $36,350 |
| Female | 1,041 (54.6%) | $22,292 |
| Total | 1,906 (100.0%) | $25,421 |
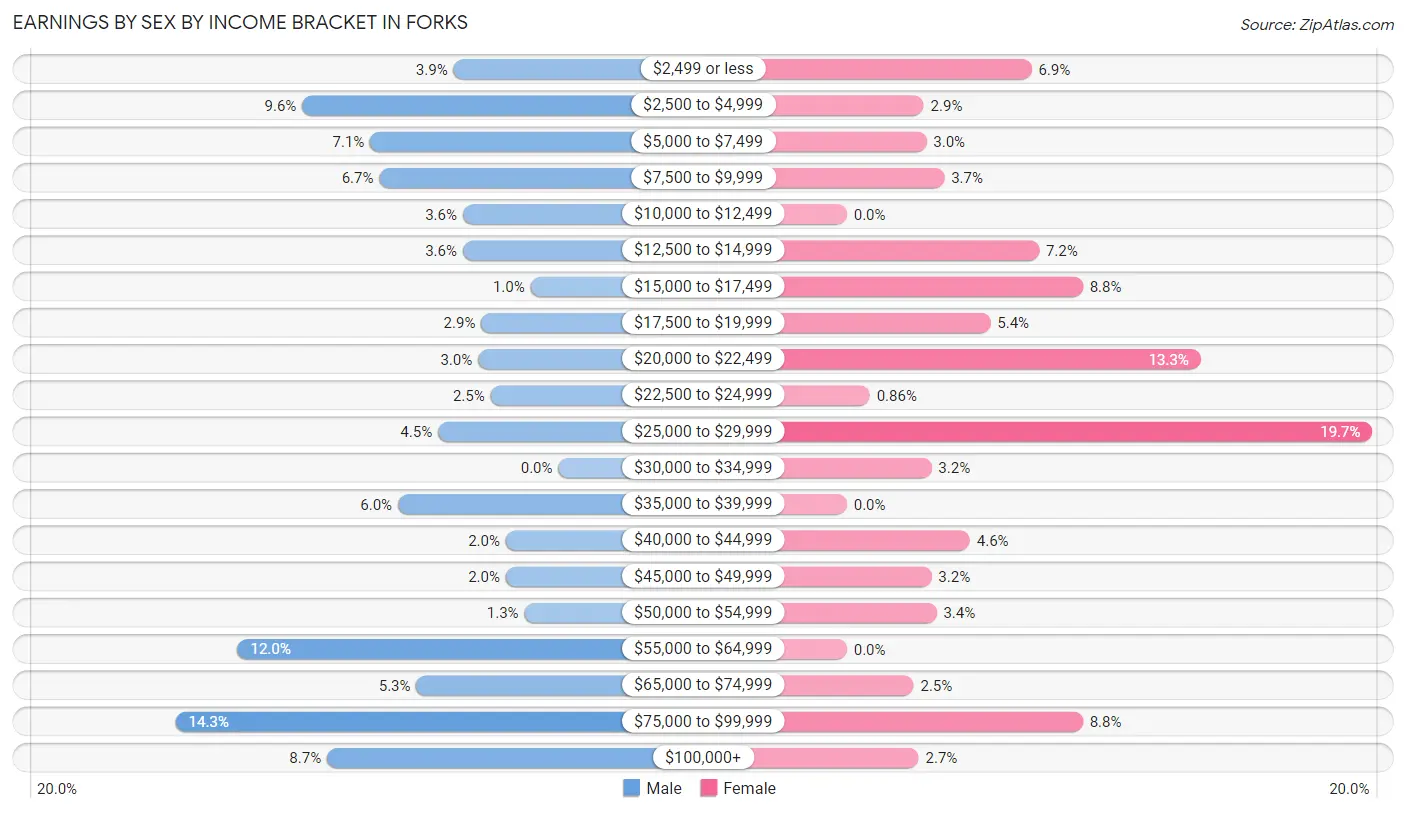
Earnings by Sex by Income Bracket in Forks
The most common earnings brackets in Forks are $75,000 to $99,999 for men (124 | 14.3%) and $25,000 to $29,999 for women (205 | 19.7%).
| Income | Male | Female |
| $2,499 or less | 34 (3.9%) | 72 (6.9%) |
| $2,500 to $4,999 | 83 (9.6%) | 30 (2.9%) |
| $5,000 to $7,499 | 61 (7.0%) | 31 (3.0%) |
| $7,500 to $9,999 | 58 (6.7%) | 38 (3.6%) |
| $10,000 to $12,499 | 31 (3.6%) | 0 (0.0%) |
| $12,500 to $14,999 | 31 (3.6%) | 75 (7.2%) |
| $15,000 to $17,499 | 9 (1.0%) | 92 (8.8%) |
| $17,500 to $19,999 | 25 (2.9%) | 56 (5.4%) |
| $20,000 to $22,499 | 26 (3.0%) | 138 (13.3%) |
| $22,500 to $24,999 | 22 (2.5%) | 9 (0.9%) |
| $25,000 to $29,999 | 39 (4.5%) | 205 (19.7%) |
| $30,000 to $34,999 | 0 (0.0%) | 33 (3.2%) |
| $35,000 to $39,999 | 52 (6.0%) | 0 (0.0%) |
| $40,000 to $44,999 | 17 (2.0%) | 48 (4.6%) |
| $45,000 to $49,999 | 17 (2.0%) | 33 (3.2%) |
| $50,000 to $54,999 | 11 (1.3%) | 35 (3.4%) |
| $55,000 to $64,999 | 104 (12.0%) | 0 (0.0%) |
| $65,000 to $74,999 | 46 (5.3%) | 26 (2.5%) |
| $75,000 to $99,999 | 124 (14.3%) | 92 (8.8%) |
| $100,000+ | 75 (8.7%) | 28 (2.7%) |
| Total | 865 (100.0%) | 1,041 (100.0%) |
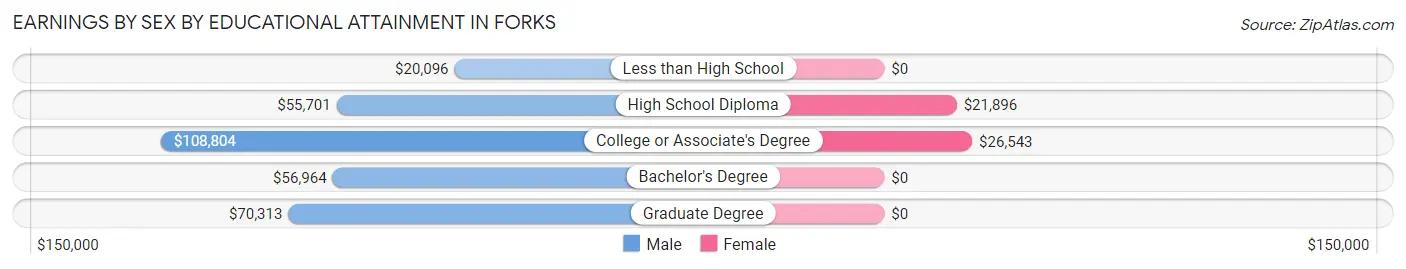
Earnings by Sex by Educational Attainment in Forks
Average earnings in Forks are $46,691 for men and $25,743 for women, a difference of 44.9%. Men with an educational attainment of college or associate's degree enjoy the highest average annual earnings of $108,804, while those with less than high school education earn the least with $20,096. Women with an educational attainment of college or associate's degree earn the most with the average annual earnings of $26,543, while those with high school diploma education have the smallest earnings of $21,896.
| Educational Attainment | Male Income | Female Income |
| Less than High School | $20,096 | $0 |
| High School Diploma | $55,701 | $21,896 |
| College or Associate's Degree | $108,804 | $26,543 |
| Bachelor's Degree | $56,964 | $0 |
| Graduate Degree | $70,313 | $0 |
| Total | $46,691 | $25,743 |
Family Income in Forks
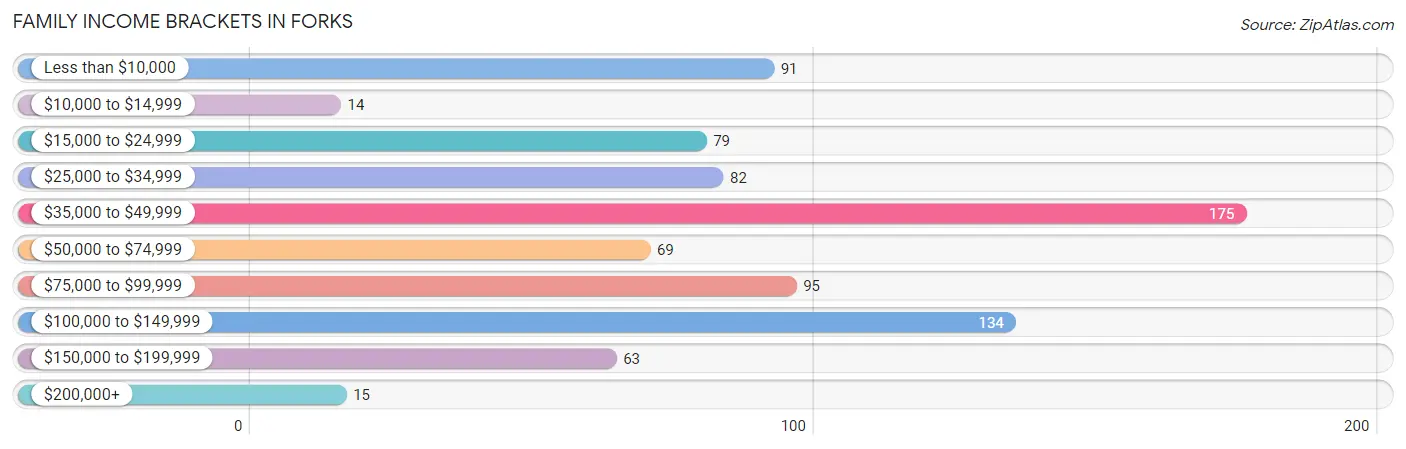
Family Income Brackets in Forks
According to the Forks family income data, there are 175 families falling into the $35,000 to $49,999 income range, which is the most common income bracket and makes up 21.4% of all families. Conversely, the $10,000 to $14,999 income bracket is the least frequent group with only 14 families (1.7%) belonging to this category.
| Income Bracket | # Families | % Families |
| Less than $10,000 | 91 | 11.1% |
| $10,000 to $14,999 | 14 | 1.7% |
| $15,000 to $24,999 | 79 | 9.7% |
| $25,000 to $34,999 | 82 | 10.0% |
| $35,000 to $49,999 | 175 | 21.4% |
| $50,000 to $74,999 | 69 | 8.4% |
| $75,000 to $99,999 | 95 | 11.6% |
| $100,000 to $149,999 | 134 | 16.4% |
| $150,000 to $199,999 | 63 | 7.7% |
| $200,000+ | 15 | 1.8% |
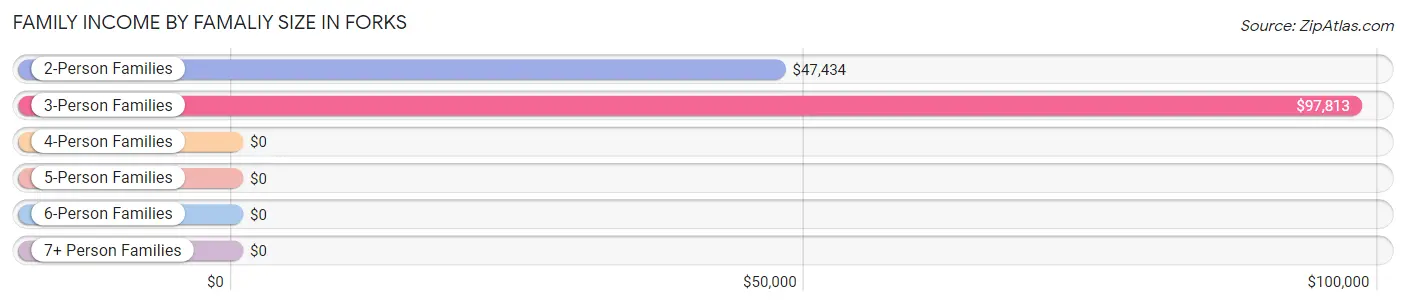
Family Income by Famaliy Size in Forks
3-person families (92 | 11.3%) account for the highest median family income in Forks with $97,813 per family, while 3-person families (92 | 11.3%) have the highest median income of $32,604 per family member.
| Income Bracket | # Families | Median Income |
| 2-Person Families | 397 (48.6%) | $47,434 |
| 3-Person Families | 92 (11.3%) | $97,813 |
| 4-Person Families | 74 (9.1%) | $0 |
| 5-Person Families | 194 (23.7%) | $0 |
| 6-Person Families | 8 (1.0%) | $0 |
| 7+ Person Families | 52 (6.4%) | $0 |
| Total | 817 (100.0%) | $48,549 |
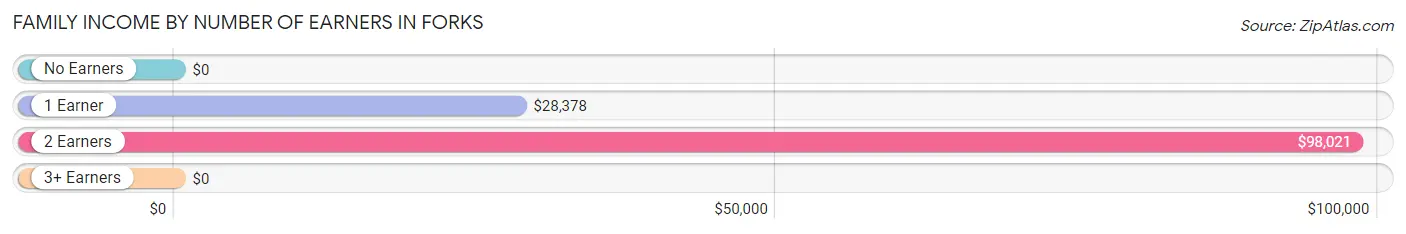
Family Income by Number of Earners in Forks
| Number of Earners | # Families | Median Income |
| No Earners | 104 (12.7%) | $0 |
| 1 Earner | 264 (32.3%) | $28,378 |
| 2 Earners | 347 (42.5%) | $98,021 |
| 3+ Earners | 102 (12.5%) | $0 |
| Total | 817 (100.0%) | $48,549 |
Household Income in Forks
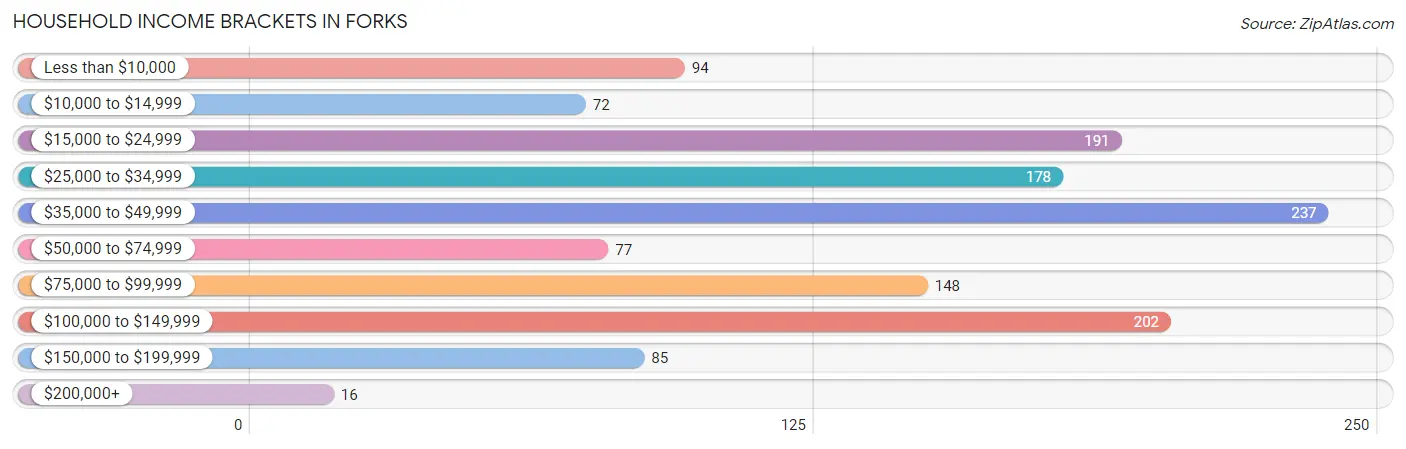
Household Income Brackets in Forks
With 237 households falling in the category, the $35,000 to $49,999 income range is the most frequent in Forks, accounting for 18.2% of all households. In contrast, only 16 households (1.2%) fall into the $200,000+ income bracket, making it the least populous group.
| Income Bracket | # Households | % Households |
| Less than $10,000 | 94 | 7.2% |
| $10,000 to $14,999 | 72 | 5.5% |
| $15,000 to $24,999 | 191 | 14.7% |
| $25,000 to $34,999 | 178 | 13.7% |
| $35,000 to $49,999 | 237 | 18.2% |
| $50,000 to $74,999 | 77 | 5.9% |
| $75,000 to $99,999 | 148 | 11.4% |
| $100,000 to $149,999 | 202 | 15.5% |
| $150,000 to $199,999 | 85 | 6.5% |
| $200,000+ | 16 | 1.2% |
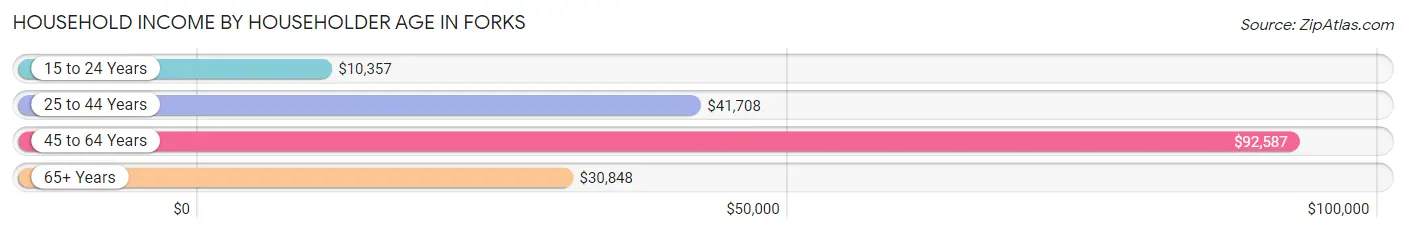
Household Income by Householder Age in Forks
The median household income in Forks is $42,080, with the highest median household income of $92,587 found in the 45 to 64 years age bracket for the primary householder. A total of 389 households (29.9%) fall into this category. Meanwhile, the 15 to 24 years age bracket for the primary householder has the lowest median household income of $10,357, with 42 households (3.2%) in this group.
| Income Bracket | # Households | Median Income |
| 15 to 24 Years | 42 (3.2%) | $10,357 |
| 25 to 44 Years | 680 (52.2%) | $41,708 |
| 45 to 64 Years | 389 (29.9%) | $92,587 |
| 65+ Years | 191 (14.7%) | $30,848 |
| Total | 1,302 (100.0%) | $42,080 |
Poverty in Forks
Income Below Poverty by Sex and Age in Forks
With 20.6% poverty level for males and 27.7% for females among the residents of Forks, 5 year old males and under 5 year old females are the most vulnerable to poverty, with 9 males (100.0%) and 162 females (100.0%) in their respective age groups living below the poverty level.
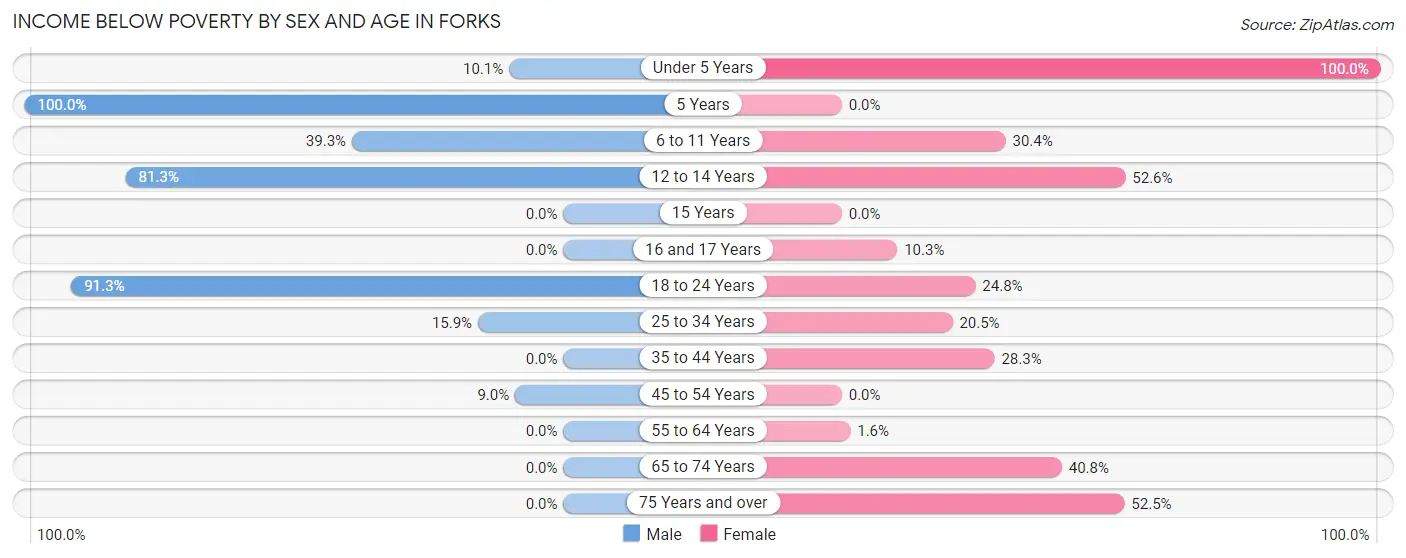
| Age Bracket | Male | Female |
| Under 5 Years | 12 (10.1%) | 162 (100.0%) |
| 5 Years | 9 (100.0%) | 0 (0.0%) |
| 6 to 11 Years | 42 (39.3%) | 31 (30.4%) |
| 12 to 14 Years | 65 (81.2%) | 20 (52.6%) |
| 15 Years | 0 (0.0%) | 0 (0.0%) |
| 16 and 17 Years | 0 (0.0%) | 7 (10.3%) |
| 18 to 24 Years | 116 (91.3%) | 31 (24.8%) |
| 25 to 34 Years | 42 (15.9%) | 68 (20.5%) |
| 35 to 44 Years | 0 (0.0%) | 104 (28.3%) |
| 45 to 54 Years | 12 (9.0%) | 0 (0.0%) |
| 55 to 64 Years | 0 (0.0%) | 3 (1.6%) |
| 65 to 74 Years | 0 (0.0%) | 49 (40.8%) |
| 75 Years and over | 0 (0.0%) | 32 (52.5%) |
| Total | 298 (20.6%) | 507 (27.7%) |
Income Above Poverty by Sex and Age in Forks
According to the poverty statistics in Forks, males aged 15 years and females aged 5 years are the age groups that are most secure financially, with 100.0% of males and 100.0% of females in these age groups living above the poverty line.
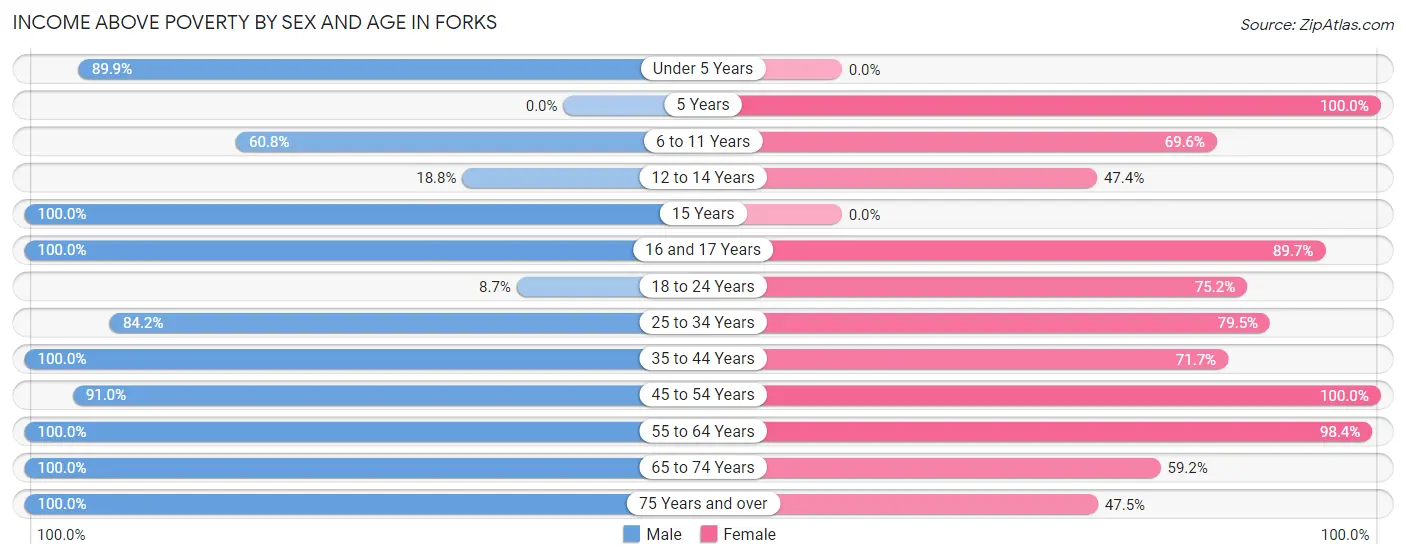
| Age Bracket | Male | Female |
| Under 5 Years | 107 (89.9%) | 0 (0.0%) |
| 5 Years | 0 (0.0%) | 106 (100.0%) |
| 6 to 11 Years | 65 (60.8%) | 71 (69.6%) |
| 12 to 14 Years | 15 (18.8%) | 18 (47.4%) |
| 15 Years | 15 (100.0%) | 0 (0.0%) |
| 16 and 17 Years | 63 (100.0%) | 61 (89.7%) |
| 18 to 24 Years | 11 (8.7%) | 94 (75.2%) |
| 25 to 34 Years | 223 (84.2%) | 263 (79.5%) |
| 35 to 44 Years | 204 (100.0%) | 263 (71.7%) |
| 45 to 54 Years | 122 (91.0%) | 158 (100.0%) |
| 55 to 64 Years | 153 (100.0%) | 188 (98.4%) |
| 65 to 74 Years | 110 (100.0%) | 71 (59.2%) |
| 75 Years and over | 62 (100.0%) | 29 (47.5%) |
| Total | 1,150 (79.4%) | 1,322 (72.3%) |
Income Below Poverty Among Married-Couple Families in Forks
The poverty statistics for married-couple families in Forks show that 9.2% or 37 of the total 400 families live below the poverty line. Families with 1 or 2 children have the highest poverty rate of 39.0%, comprising of 37 families. On the other hand, families with no children have the lowest poverty rate of 0.0%, which includes 0 families.
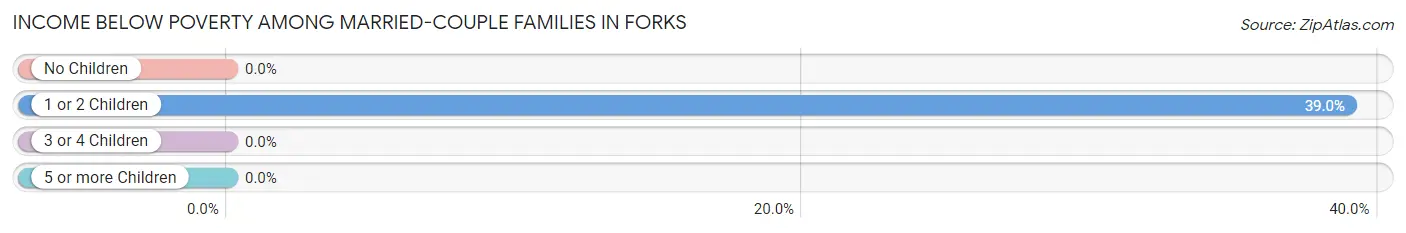
| Children | Above Poverty | Below Poverty |
| No Children | 223 (100.0%) | 0 (0.0%) |
| 1 or 2 Children | 58 (61.1%) | 37 (39.0%) |
| 3 or 4 Children | 82 (100.0%) | 0 (0.0%) |
| 5 or more Children | 0 (0.0%) | 0 (0.0%) |
| Total | 363 (90.7%) | 37 (9.2%) |
Income Below Poverty Among Single-Parent Households in Forks
According to the poverty data in Forks, 21.9% or 14 single-father households and 44.2% or 156 single-mother households are living below the poverty line. Among single-father households, those with 1 or 2 children have the highest poverty rate, with 14 households (38.9%) experiencing poverty. Likewise, among single-mother households, those with 5 or more children have the highest poverty rate, with 52 households (100.0%) falling below the poverty line.
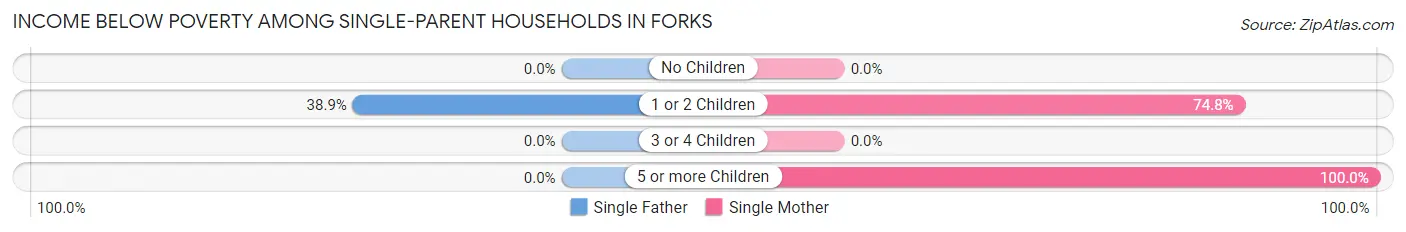
| Children | Single Father | Single Mother |
| No Children | 0 (0.0%) | 0 (0.0%) |
| 1 or 2 Children | 14 (38.9%) | 104 (74.8%) |
| 3 or 4 Children | 0 (0.0%) | 0 (0.0%) |
| 5 or more Children | 0 (0.0%) | 52 (100.0%) |
| Total | 14 (21.9%) | 156 (44.2%) |
Income Below Poverty Among Married-Couple vs Single-Parent Households in Forks
The poverty data for Forks shows that 37 of the married-couple family households (9.2%) and 170 of the single-parent households (40.8%) are living below the poverty level. Within the married-couple family households, those with 1 or 2 children have the highest poverty rate, with 37 households (39.0%) falling below the poverty line. Among the single-parent households, those with 5 or more children have the highest poverty rate, with 52 household (100.0%) living below poverty.
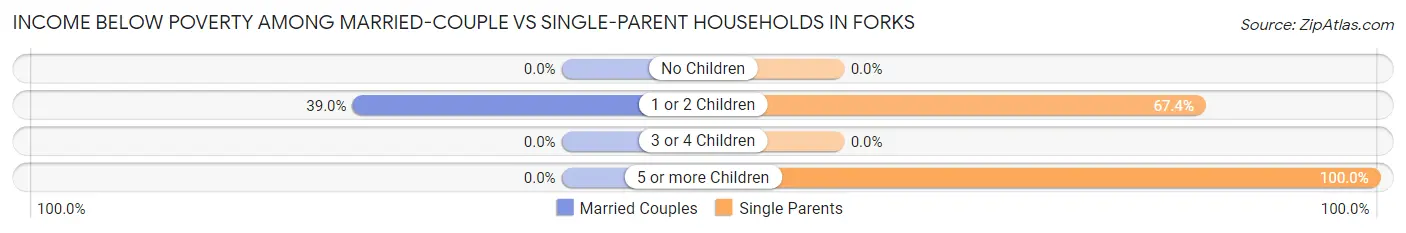
| Children | Married-Couple Families | Single-Parent Households |
| No Children | 0 (0.0%) | 0 (0.0%) |
| 1 or 2 Children | 37 (39.0%) | 118 (67.4%) |
| 3 or 4 Children | 0 (0.0%) | 0 (0.0%) |
| 5 or more Children | 0 (0.0%) | 52 (100.0%) |
| Total | 37 (9.2%) | 170 (40.8%) |
Race in Forks
The most populous races in Forks are White / Caucasian (2,229 | 65.9%), Hispanic or Latino (1,082 | 32.0%), and Two or more Races (774 | 22.9%).
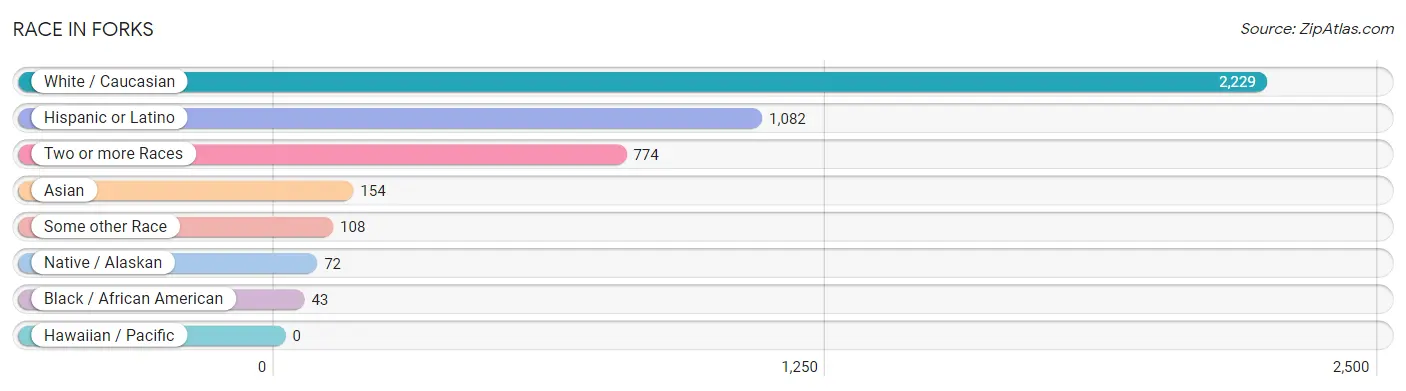
| Race | # Population | % Population |
| Asian | 154 | 4.6% |
| Black / African American | 43 | 1.3% |
| Hawaiian / Pacific | 0 | 0.0% |
| Hispanic or Latino | 1,082 | 32.0% |
| Native / Alaskan | 72 | 2.1% |
| White / Caucasian | 2,229 | 65.9% |
| Two or more Races | 774 | 22.9% |
| Some other Race | 108 | 3.2% |
| Total | 3,380 | 100.0% |
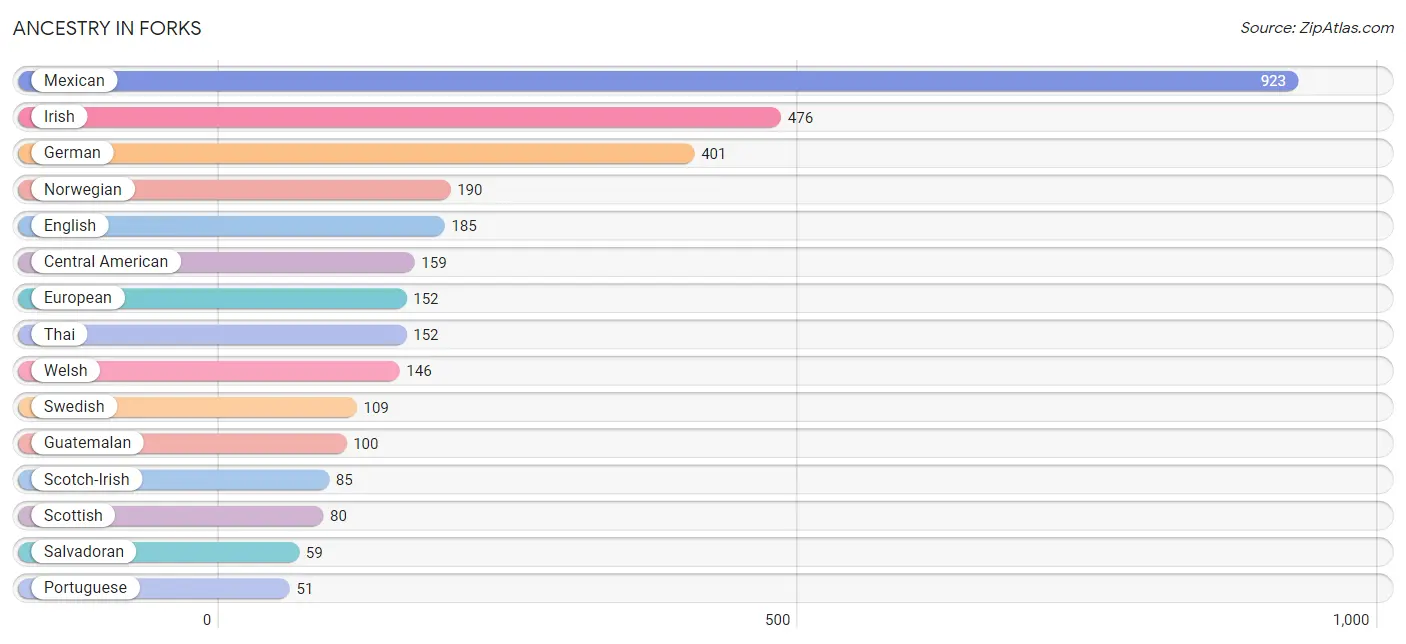
Ancestry in Forks
The most populous ancestries reported in Forks are Mexican (923 | 27.3%), Irish (476 | 14.1%), German (401 | 11.9%), Norwegian (190 | 5.6%), and English (185 | 5.5%), together accounting for 64.3% of all Forks residents.
| Ancestry | # Population | % Population |
| Apache | 5 | 0.2% |
| British | 5 | 0.2% |
| Central American | 159 | 4.7% |
| Cherokee | 19 | 0.6% |
| Dutch | 27 | 0.8% |
| English | 185 | 5.5% |
| European | 152 | 4.5% |
| French | 32 | 0.9% |
| French American Indian | 22 | 0.6% |
| French Canadian | 42 | 1.2% |
| German | 401 | 11.9% |
| Guatemalan | 100 | 3.0% |
| Irish | 476 | 14.1% |
| Italian | 21 | 0.6% |
| Korean | 2 | 0.1% |
| Lithuanian | 21 | 0.6% |
| Mexican | 923 | 27.3% |
| Norwegian | 190 | 5.6% |
| Polish | 49 | 1.5% |
| Portuguese | 51 | 1.5% |
| Russian | 2 | 0.1% |
| Salvadoran | 59 | 1.8% |
| Scotch-Irish | 85 | 2.5% |
| Scottish | 80 | 2.4% |
| Sri Lankan | 10 | 0.3% |
| Swedish | 109 | 3.2% |
| Thai | 152 | 4.5% |
| Tlingit-Haida | 17 | 0.5% |
| Welsh | 146 | 4.3% | View All 29 Rows |
Immigrants in Forks
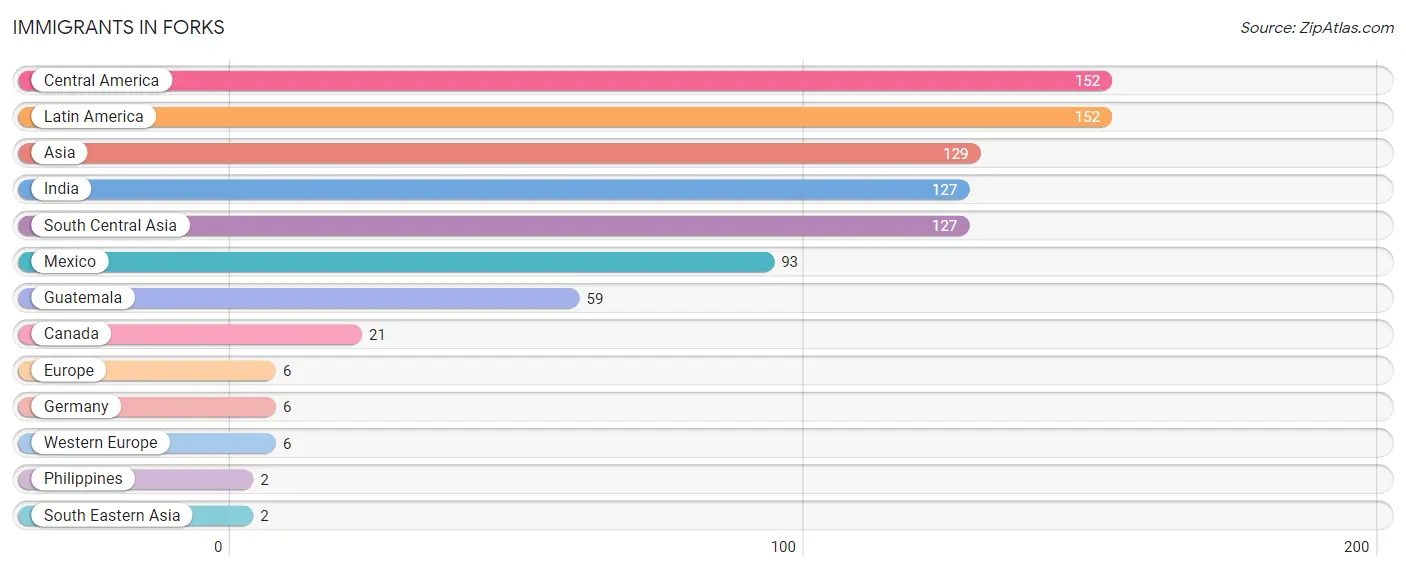
The most numerous immigrant groups reported in Forks came from Central America (152 | 4.5%), Latin America (152 | 4.5%), Asia (129 | 3.8%), India (127 | 3.8%), and South Central Asia (127 | 3.8%), together accounting for 20.3% of all Forks residents.
| Immigration Origin | # Population | % Population |
| Asia | 129 | 3.8% |
| Canada | 21 | 0.6% |
| Central America | 152 | 4.5% |
| Europe | 6 | 0.2% |
| Germany | 6 | 0.2% |
| Guatemala | 59 | 1.8% |
| India | 127 | 3.8% |
| Latin America | 152 | 4.5% |
| Mexico | 93 | 2.8% |
| Philippines | 2 | 0.1% |
| South Central Asia | 127 | 3.8% |
| South Eastern Asia | 2 | 0.1% |
| Western Europe | 6 | 0.2% | View All 13 Rows |
Sex and Age in Forks
Sex and Age in Forks
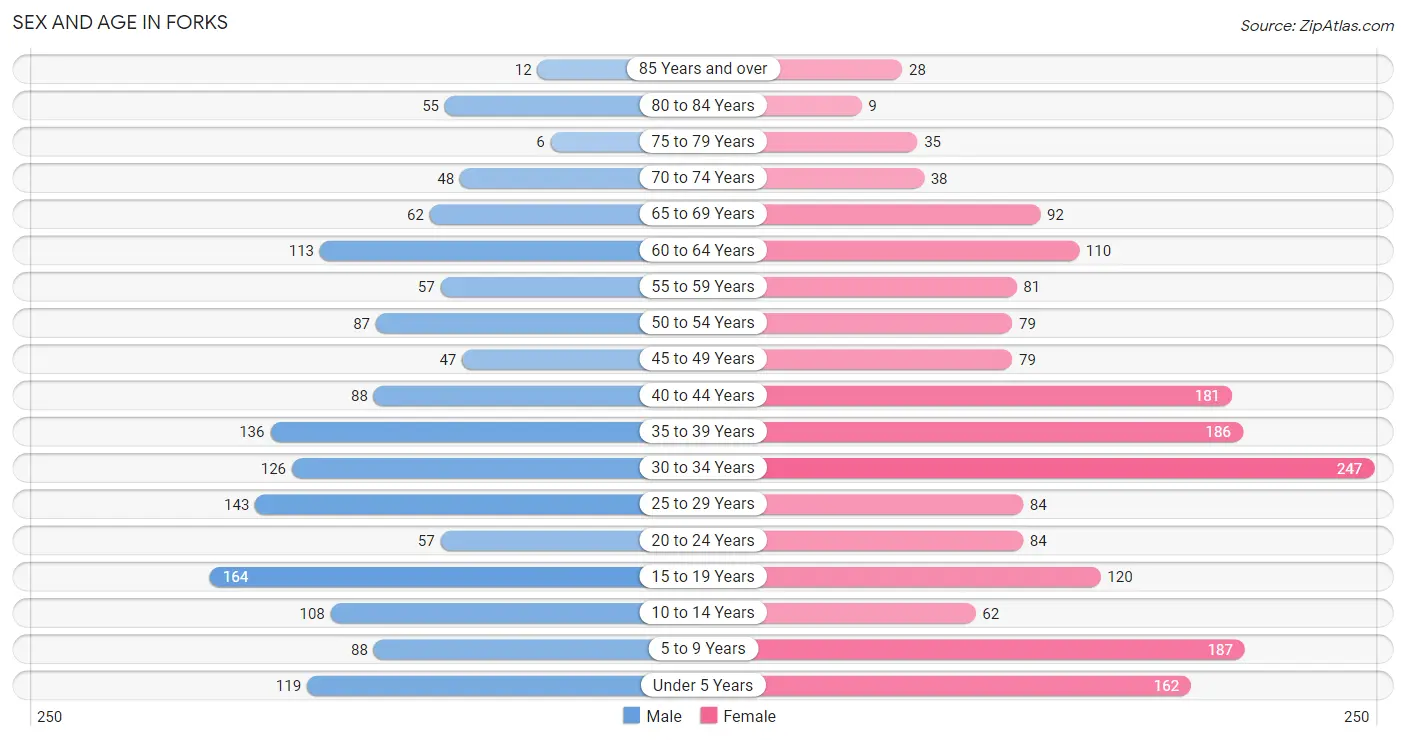
The most populous age groups in Forks are 15 to 19 Years (164 | 10.8%) for men and 30 to 34 Years (247 | 13.3%) for women.
| Age Bracket | Male | Female |
| Under 5 Years | 119 (7.9%) | 162 (8.7%) |
| 5 to 9 Years | 88 (5.8%) | 187 (10.0%) |
| 10 to 14 Years | 108 (7.1%) | 62 (3.3%) |
| 15 to 19 Years | 164 (10.8%) | 120 (6.4%) |
| 20 to 24 Years | 57 (3.8%) | 84 (4.5%) |
| 25 to 29 Years | 143 (9.4%) | 84 (4.5%) |
| 30 to 34 Years | 126 (8.3%) | 247 (13.3%) |
| 35 to 39 Years | 136 (9.0%) | 186 (10.0%) |
| 40 to 44 Years | 88 (5.8%) | 181 (9.7%) |
| 45 to 49 Years | 47 (3.1%) | 79 (4.2%) |
| 50 to 54 Years | 87 (5.7%) | 79 (4.2%) |
| 55 to 59 Years | 57 (3.8%) | 81 (4.3%) |
| 60 to 64 Years | 113 (7.4%) | 110 (5.9%) |
| 65 to 69 Years | 62 (4.1%) | 92 (4.9%) |
| 70 to 74 Years | 48 (3.2%) | 38 (2.0%) |
| 75 to 79 Years | 6 (0.4%) | 35 (1.9%) |
| 80 to 84 Years | 55 (3.6%) | 9 (0.5%) |
| 85 Years and over | 12 (0.8%) | 28 (1.5%) |
| Total | 1,516 (100.0%) | 1,864 (100.0%) |
Families and Households in Forks
Median Family Size in Forks
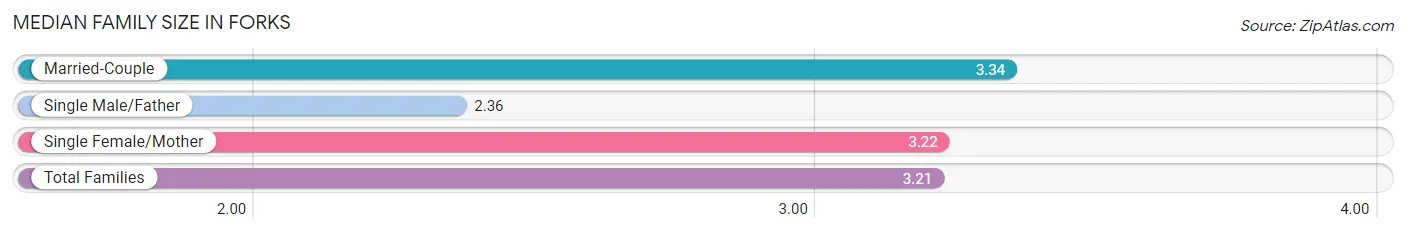
The median family size in Forks is 3.21 persons per family, with married-couple families (400 | 49.0%) accounting for the largest median family size of 3.34 persons per family. On the other hand, single male/father families (64 | 7.8%) represent the smallest median family size with 2.36 persons per family.
| Family Type | # Families | Family Size |
| Married-Couple | 400 (49.0%) | 3.34 |
| Single Male/Father | 64 (7.8%) | 2.36 |
| Single Female/Mother | 353 (43.2%) | 3.22 |
| Total Families | 817 (100.0%) | 3.21 |
Median Household Size in Forks
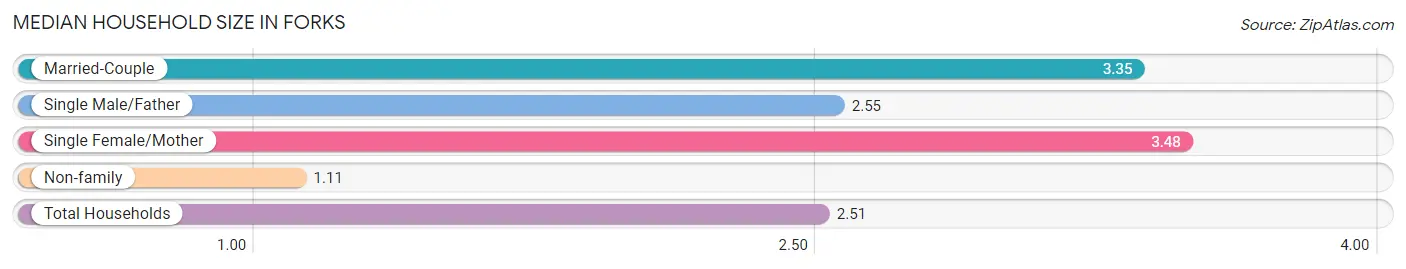
The median household size in Forks is 2.51 persons per household, with single female/mother households (353 | 27.1%) accounting for the largest median household size of 3.48 persons per household. non-family households (485 | 37.2%) represent the smallest median household size with 1.11 persons per household.
| Household Type | # Households | Household Size |
| Married-Couple | 400 (30.7%) | 3.35 |
| Single Male/Father | 64 (4.9%) | 2.55 |
| Single Female/Mother | 353 (27.1%) | 3.48 |
| Non-family | 485 (37.2%) | 1.11 |
| Total Households | 1,302 (100.0%) | 2.51 |
Household Size by Marriage Status in Forks
Out of a total of 1,302 households in Forks, 817 (62.7%) are family households, while 485 (37.2%) are nonfamily households. The most numerous type of family households are 2-person households, comprising 361, and the most common type of nonfamily households are 1-person households, comprising 425.
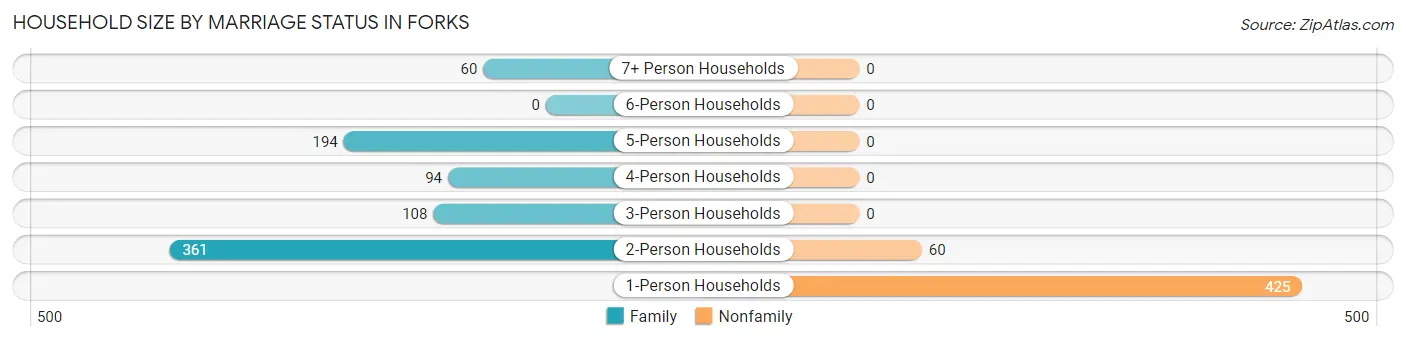
| Household Size | Family Households | Nonfamily Households |
| 1-Person Households | - | 425 (32.6%) |
| 2-Person Households | 361 (27.7%) | 60 (4.6%) |
| 3-Person Households | 108 (8.3%) | 0 (0.0%) |
| 4-Person Households | 94 (7.2%) | 0 (0.0%) |
| 5-Person Households | 194 (14.9%) | 0 (0.0%) |
| 6-Person Households | 0 (0.0%) | 0 (0.0%) |
| 7+ Person Households | 60 (4.6%) | 0 (0.0%) |
| Total | 817 (62.7%) | 485 (37.2%) |
Female Fertility in Forks
Fertility by Age in Forks
Average fertility rate in Forks is 28.0 births per 1,000 women. Women in the age bracket of 20 to 34 years have the highest fertility rate with 70.0 births per 1,000 women. Women in the age bracket of 20 to 34 years acount for 100.0% of all women with births.
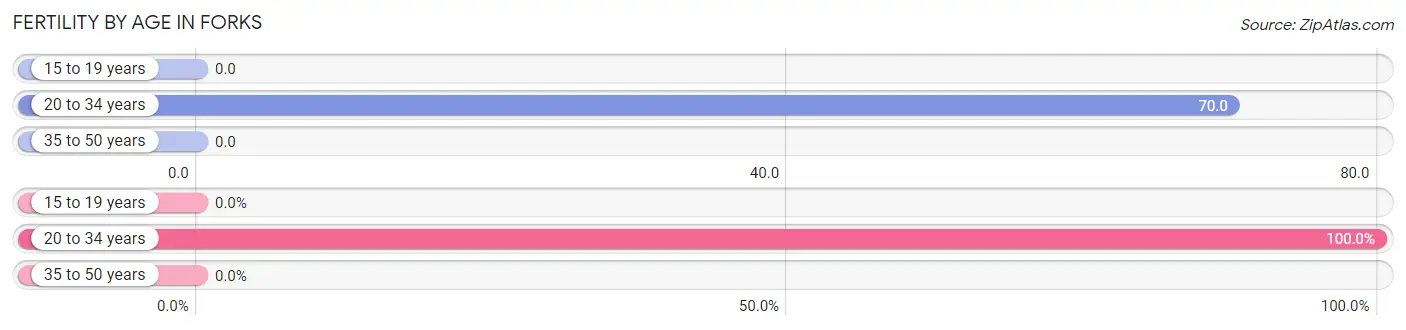
| Age Bracket | Women with Births | Births / 1,000 Women |
| 15 to 19 years | 0 (0.0%) | 0.0 |
| 20 to 34 years | 29 (100.0%) | 70.0 |
| 35 to 50 years | 0 (0.0%) | 0.0 |
| Total | 29 (100.0%) | 28.0 |
Fertility by Age by Marriage Status in Forks
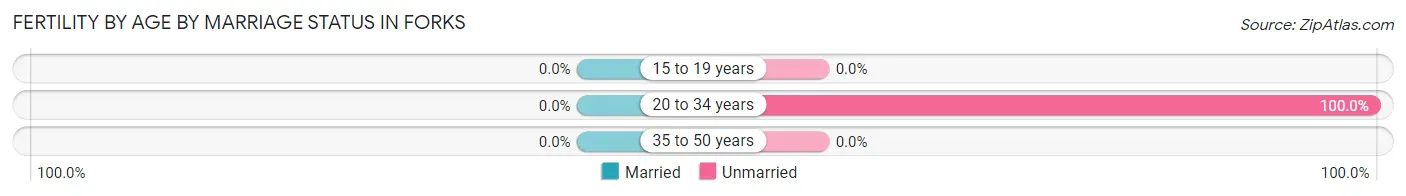
| Age Bracket | Married | Unmarried |
| 15 to 19 years | 0 (0.0%) | 0 (0.0%) |
| 20 to 34 years | 0 (0.0%) | 29 (100.0%) |
| 35 to 50 years | 0 (0.0%) | 0 (0.0%) |
| Total | 0 (0.0%) | 29 (100.0%) |
Fertility by Education in Forks
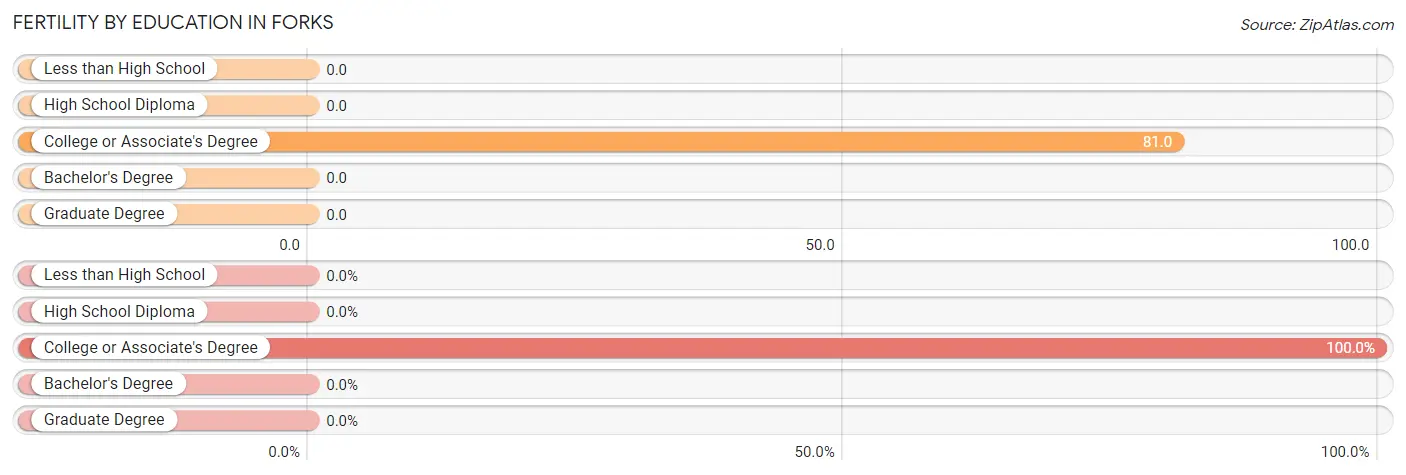
| Educational Attainment | Women with Births | Births / 1,000 Women |
| Less than High School | 0 (0.0%) | 0.0 |
| High School Diploma | 0 (0.0%) | 0.0 |
| College or Associate's Degree | 29 (100.0%) | 81.0 |
| Bachelor's Degree | 0 (0.0%) | 0.0 |
| Graduate Degree | 0 (0.0%) | 0.0 |
| Total | 29 (100.0%) | 28.0 |
Fertility by Education by Marriage Status in Forks
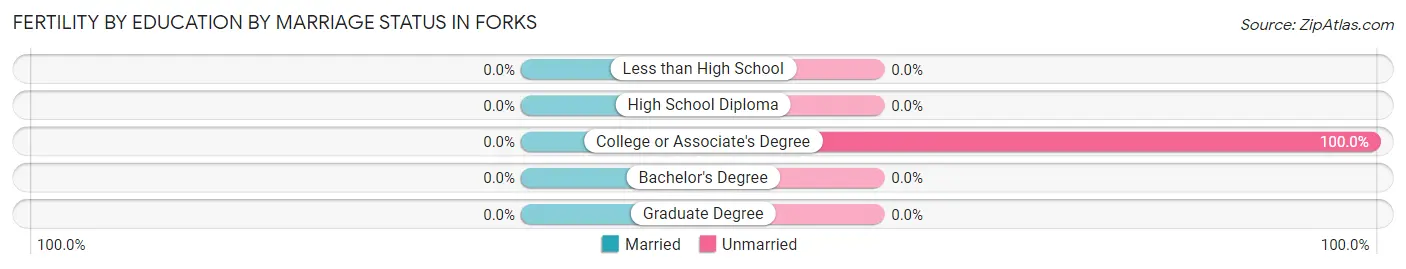
| Educational Attainment | Married | Unmarried |
| Less than High School | 0 (0.0%) | 0 (0.0%) |
| High School Diploma | 0 (0.0%) | 0 (0.0%) |
| College or Associate's Degree | 0 (0.0%) | 29 (100.0%) |
| Bachelor's Degree | 0 (0.0%) | 0 (0.0%) |
| Graduate Degree | 0 (0.0%) | 0 (0.0%) |
| Total | 0 (0.0%) | 29 (100.0%) |
Employment Characteristics in Forks
Employment by Class of Employer in Forks
Among the 1,510 employed individuals in Forks, private company employees (743 | 49.2%), state government employees (238 | 15.8%), and local government employees (222 | 14.7%) make up the most common classes of employment.
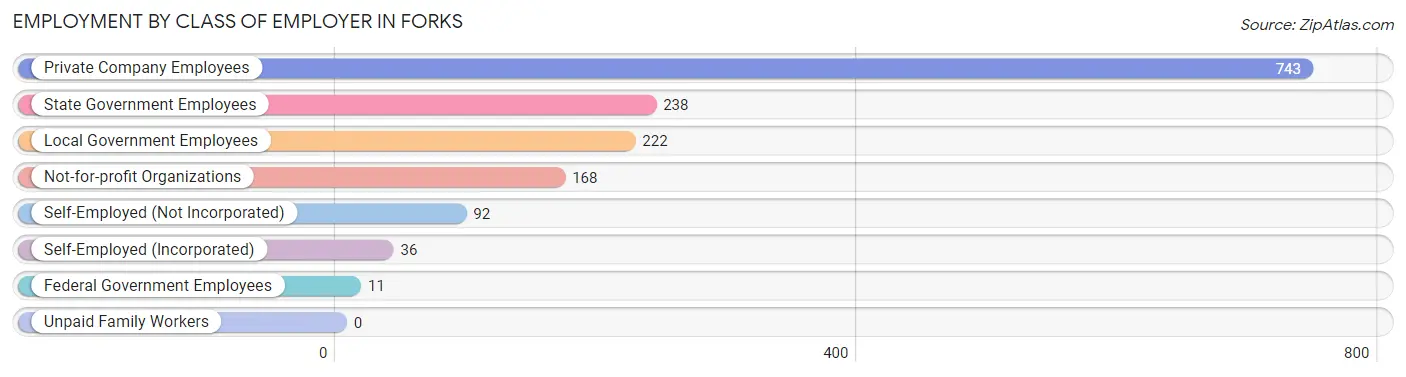
| Employer Class | # Employees | % Employees |
| Private Company Employees | 743 | 49.2% |
| Self-Employed (Incorporated) | 36 | 2.4% |
| Self-Employed (Not Incorporated) | 92 | 6.1% |
| Not-for-profit Organizations | 168 | 11.1% |
| Local Government Employees | 222 | 14.7% |
| State Government Employees | 238 | 15.8% |
| Federal Government Employees | 11 | 0.7% |
| Unpaid Family Workers | 0 | 0.0% |
| Total | 1,510 | 100.0% |
Employment Status by Age in Forks
According to the labor force statistics for Forks, out of the total population over 16 years of age (2,639), 63.1% or 1,665 individuals are in the labor force, with 8.0% or 133 of them unemployed. The age group with the highest labor force participation rate is 30 to 34 years, with 79.9% or 298 individuals in the labor force. Within the labor force, the 20 to 24 years age range has the highest percentage of unemployed individuals, with 44.1% or 41 of them being unemployed.
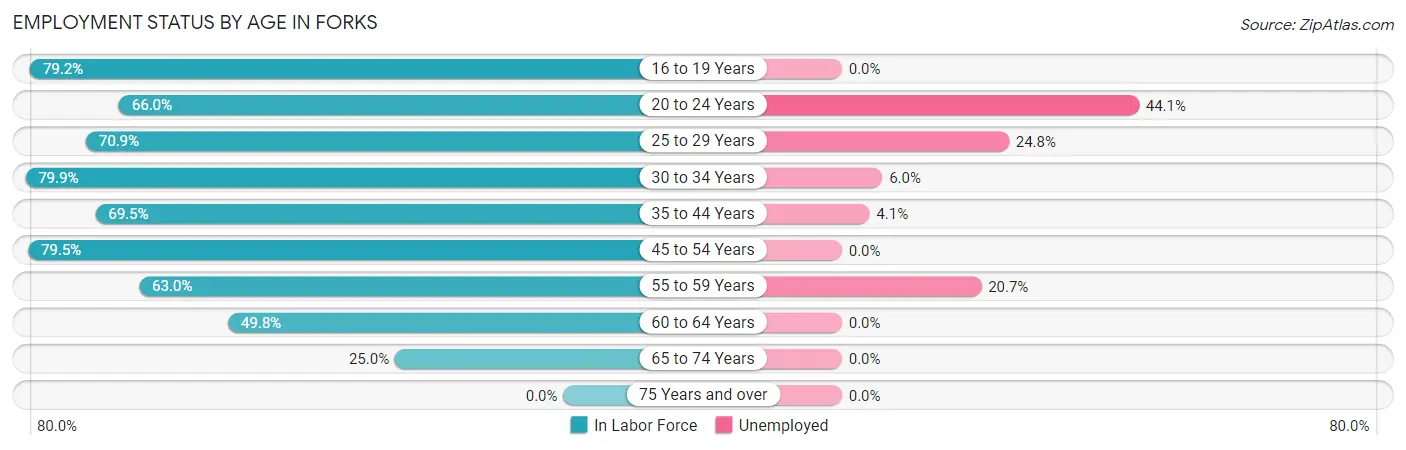
| Age Bracket | In Labor Force | Unemployed |
| 16 to 19 Years | 213 (79.2%) | 0 (0.0%) |
| 20 to 24 Years | 93 (66.0%) | 41 (44.1%) |
| 25 to 29 Years | 161 (70.9%) | 40 (24.8%) |
| 30 to 34 Years | 298 (79.9%) | 18 (6.0%) |
| 35 to 44 Years | 411 (69.5%) | 17 (4.1%) |
| 45 to 54 Years | 232 (79.5%) | 0 (0.0%) |
| 55 to 59 Years | 87 (63.0%) | 18 (20.7%) |
| 60 to 64 Years | 111 (49.8%) | 0 (0.0%) |
| 65 to 74 Years | 60 (25.0%) | 0 (0.0%) |
| 75 Years and over | 0 (0.0%) | 0 (0.0%) |
| Total | 1,665 (63.1%) | 133 (8.0%) |
Employment Status by Educational Attainment in Forks
According to labor force statistics for Forks, 70.5% of individuals (1,300) out of the total population between 25 and 64 years of age (1,844) are in the labor force, with 7.2% or 94 of them being unemployed. The group with the highest labor force participation rate are those with the educational attainment of bachelor's degree or higher, with 76.8% or 265 individuals in the labor force. Within the labor force, individuals with bachelor's degree or higher education have the highest percentage of unemployment, with 11.7% or 31 of them being unemployed.
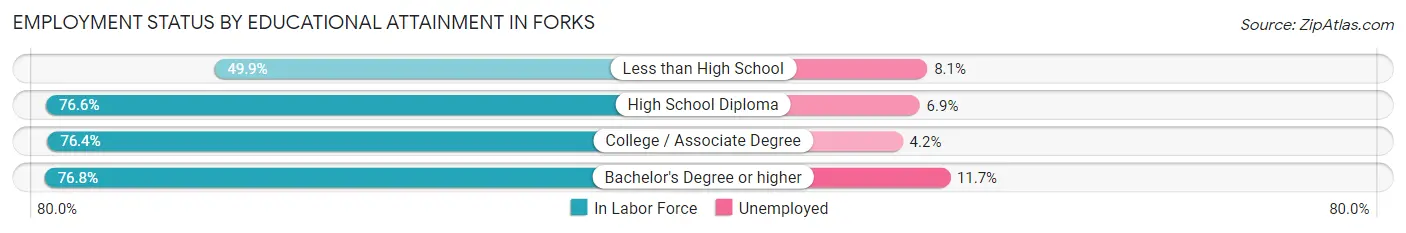
| Educational Attainment | In Labor Force | Unemployed |
| Less than High School | 209 (49.9%) | 34 (8.1%) |
| High School Diploma | 393 (76.6%) | 35 (6.9%) |
| College / Associate Degree | 433 (76.4%) | 24 (4.2%) |
| Bachelor's Degree or higher | 265 (76.8%) | 40 (11.7%) |
| Total | 1,300 (70.5%) | 133 (7.2%) |
Employment Occupations by Sex in Forks
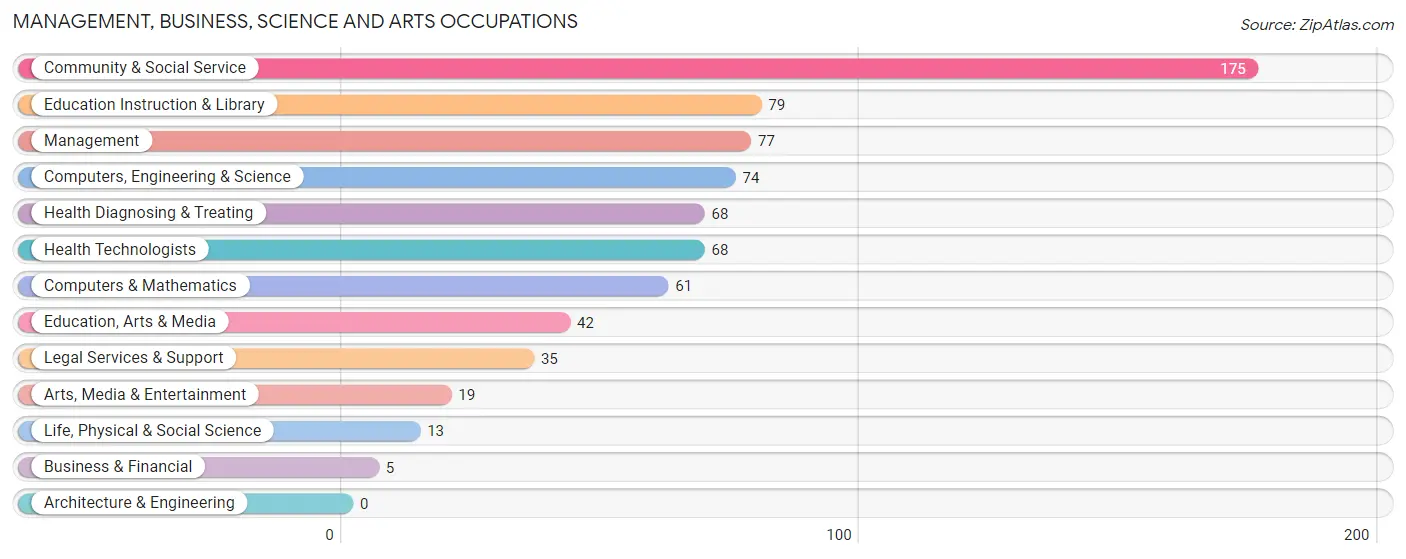
Management, Business, Science and Arts Occupations
The most common Management, Business, Science and Arts occupations in Forks are Community & Social Service (175 | 11.4%), Education Instruction & Library (79 | 5.2%), Management (77 | 5.0%), Computers, Engineering & Science (74 | 4.8%), and Health Diagnosing & Treating (68 | 4.4%).
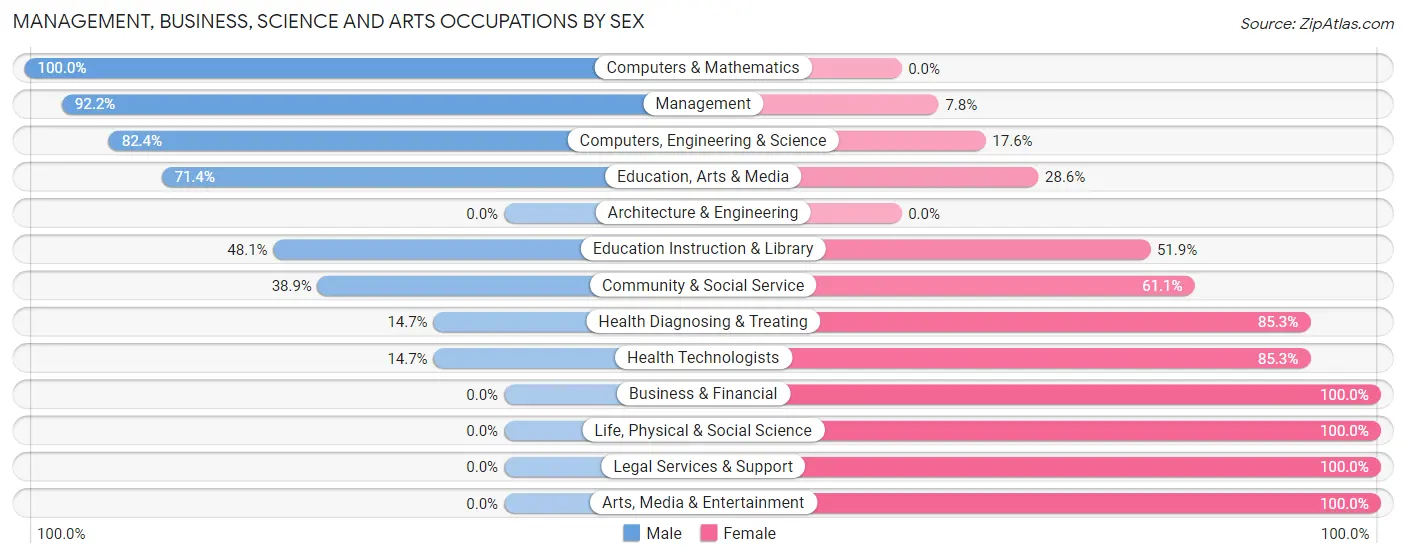
Management, Business, Science and Arts Occupations by Sex
Within the Management, Business, Science and Arts occupations in Forks, the most male-oriented occupations are Computers & Mathematics (100.0%), Management (92.2%), and Computers, Engineering & Science (82.4%), while the most female-oriented occupations are Business & Financial (100.0%), Life, Physical & Social Science (100.0%), and Legal Services & Support (100.0%).
| Occupation | Male | Female |
| Management | 71 (92.2%) | 6 (7.8%) |
| Business & Financial | 0 (0.0%) | 5 (100.0%) |
| Computers, Engineering & Science | 61 (82.4%) | 13 (17.6%) |
| Computers & Mathematics | 61 (100.0%) | 0 (0.0%) |
| Architecture & Engineering | 0 (0.0%) | 0 (0.0%) |
| Life, Physical & Social Science | 0 (0.0%) | 13 (100.0%) |
| Community & Social Service | 68 (38.9%) | 107 (61.1%) |
| Education, Arts & Media | 30 (71.4%) | 12 (28.6%) |
| Legal Services & Support | 0 (0.0%) | 35 (100.0%) |
| Education Instruction & Library | 38 (48.1%) | 41 (51.9%) |
| Arts, Media & Entertainment | 0 (0.0%) | 19 (100.0%) |
| Health Diagnosing & Treating | 10 (14.7%) | 58 (85.3%) |
| Health Technologists | 10 (14.7%) | 58 (85.3%) |
| Total (Category) | 210 (52.6%) | 189 (47.4%) |
| Total (Overall) | 717 (46.8%) | 815 (53.2%) |
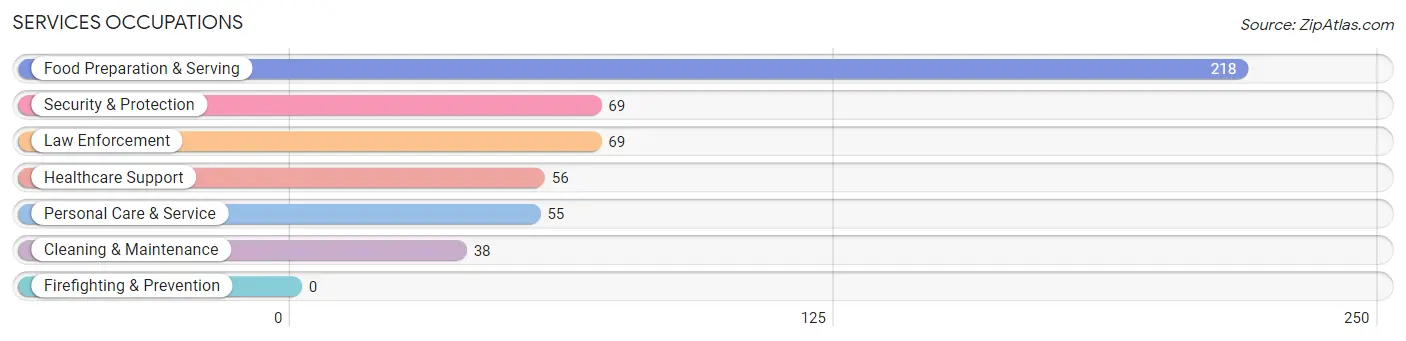
Services Occupations
The most common Services occupations in Forks are Food Preparation & Serving (218 | 14.2%), Security & Protection (69 | 4.5%), Law Enforcement (69 | 4.5%), Healthcare Support (56 | 3.7%), and Personal Care & Service (55 | 3.6%).
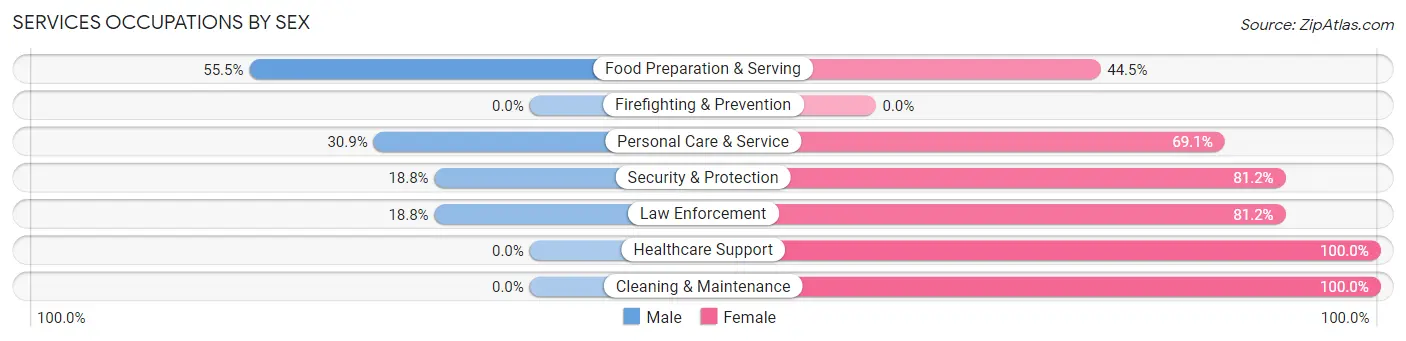
Services Occupations by Sex
Within the Services occupations in Forks, the most male-oriented occupations are Food Preparation & Serving (55.5%), Personal Care & Service (30.9%), and Security & Protection (18.8%), while the most female-oriented occupations are Healthcare Support (100.0%), Cleaning & Maintenance (100.0%), and Security & Protection (81.2%).
| Occupation | Male | Female |
| Healthcare Support | 0 (0.0%) | 56 (100.0%) |
| Security & Protection | 13 (18.8%) | 56 (81.2%) |
| Firefighting & Prevention | 0 (0.0%) | 0 (0.0%) |
| Law Enforcement | 13 (18.8%) | 56 (81.2%) |
| Food Preparation & Serving | 121 (55.5%) | 97 (44.5%) |
| Cleaning & Maintenance | 0 (0.0%) | 38 (100.0%) |
| Personal Care & Service | 17 (30.9%) | 38 (69.1%) |
| Total (Category) | 151 (34.6%) | 285 (65.4%) |
| Total (Overall) | 717 (46.8%) | 815 (53.2%) |
Sales and Office Occupations
The most common Sales and Office occupations in Forks are Sales & Related (206 | 13.5%), and Office & Administration (157 | 10.2%).
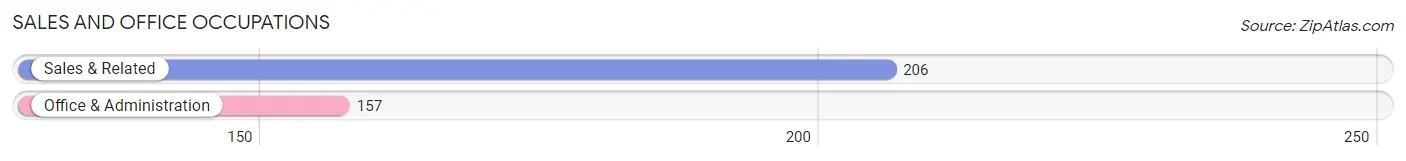
Sales and Office Occupations by Sex
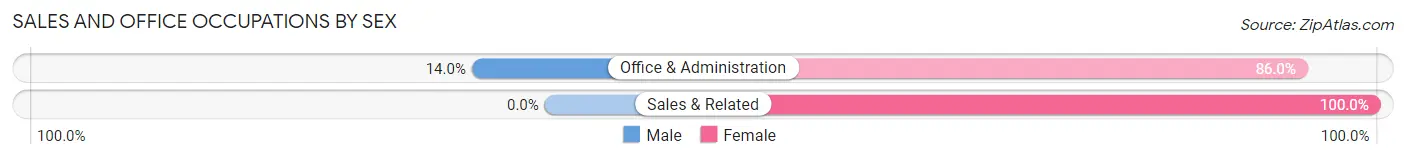
| Occupation | Male | Female |
| Sales & Related | 0 (0.0%) | 206 (100.0%) |
| Office & Administration | 22 (14.0%) | 135 (86.0%) |
| Total (Category) | 22 (6.1%) | 341 (93.9%) |
| Total (Overall) | 717 (46.8%) | 815 (53.2%) |
Natural Resources, Construction and Maintenance Occupations
The most common Natural Resources, Construction and Maintenance occupations in Forks are Farming, Fishing & Forestry (98 | 6.4%), Installation, Maintenance & Repair (73 | 4.8%), and Construction & Extraction (15 | 1.0%).
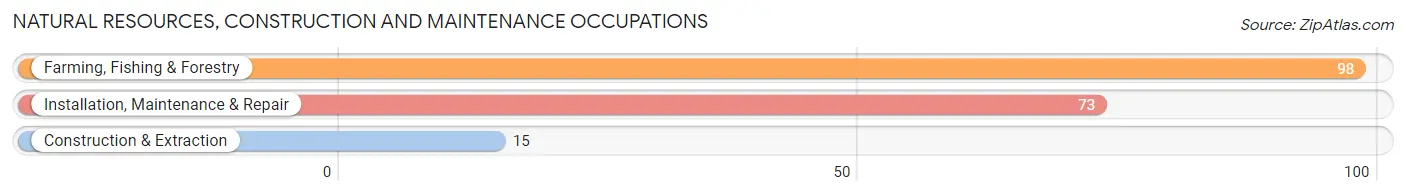
Natural Resources, Construction and Maintenance Occupations by Sex
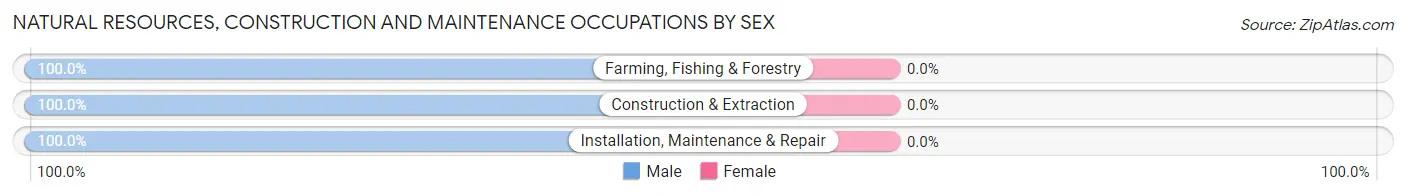
| Occupation | Male | Female |
| Farming, Fishing & Forestry | 98 (100.0%) | 0 (0.0%) |
| Construction & Extraction | 15 (100.0%) | 0 (0.0%) |
| Installation, Maintenance & Repair | 73 (100.0%) | 0 (0.0%) |
| Total (Category) | 186 (100.0%) | 0 (0.0%) |
| Total (Overall) | 717 (46.8%) | 815 (53.2%) |
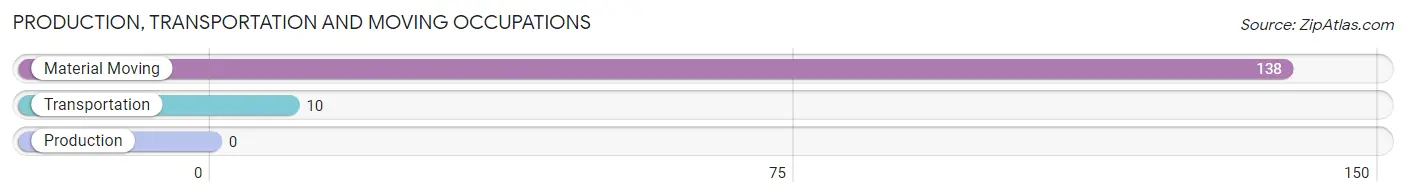
Production, Transportation and Moving Occupations
The most common Production, Transportation and Moving occupations in Forks are Material Moving (138 | 9.0%), and Transportation (10 | 0.6%).
Production, Transportation and Moving Occupations by Sex
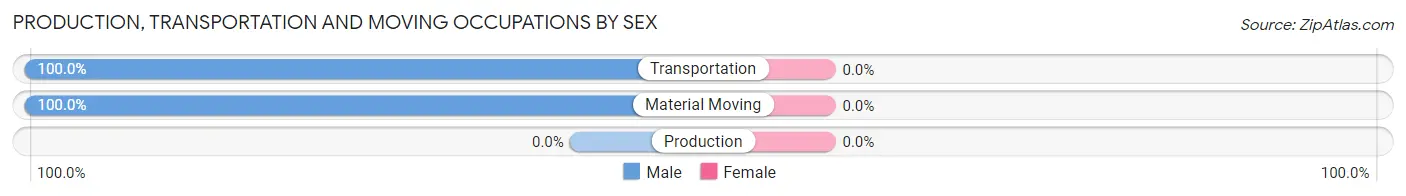
| Occupation | Male | Female |
| Production | 0 (0.0%) | 0 (0.0%) |
| Transportation | 10 (100.0%) | 0 (0.0%) |
| Material Moving | 138 (100.0%) | 0 (0.0%) |
| Total (Category) | 148 (100.0%) | 0 (0.0%) |
| Total (Overall) | 717 (46.8%) | 815 (53.2%) |
Employment Industries by Sex in Forks
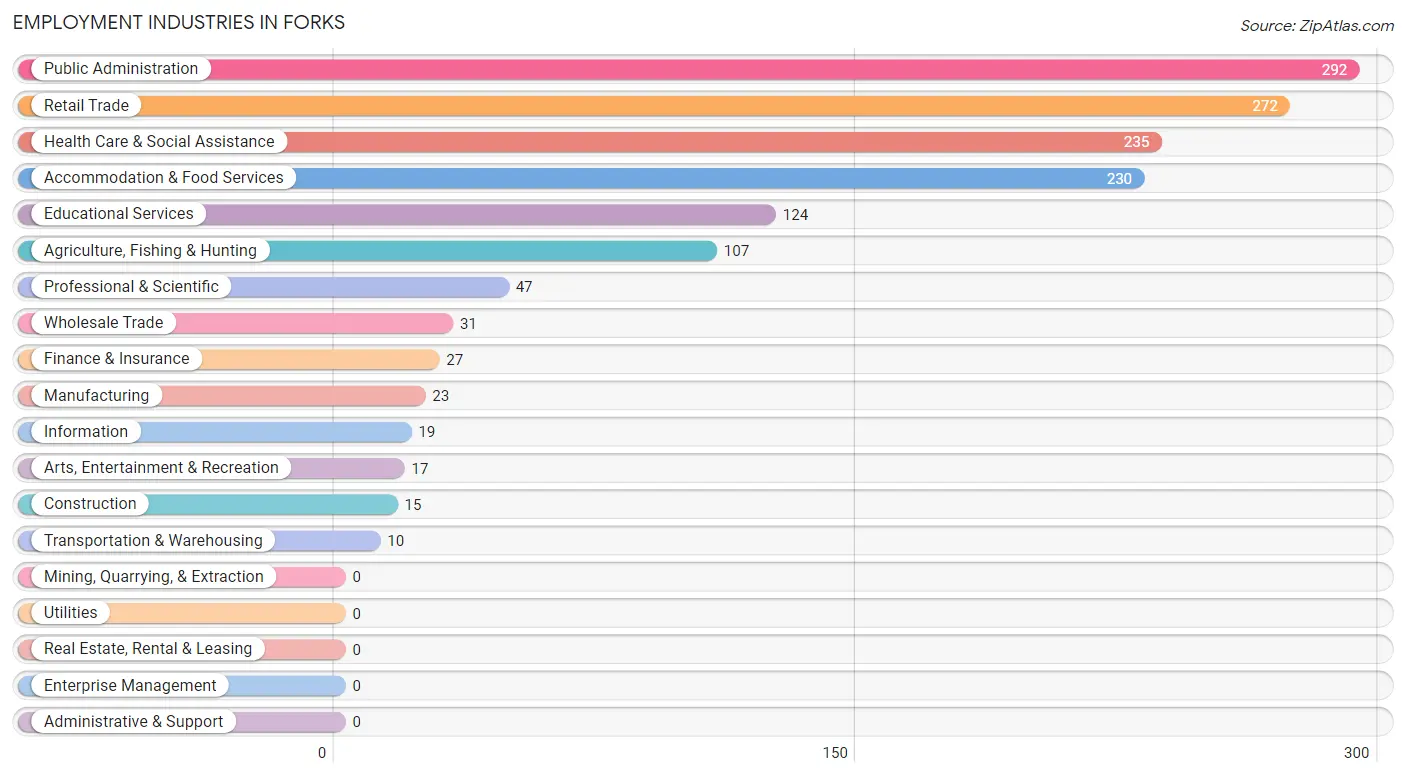
Employment Industries in Forks
The major employment industries in Forks include Public Administration (292 | 19.1%), Retail Trade (272 | 17.7%), Health Care & Social Assistance (235 | 15.3%), Accommodation & Food Services (230 | 15.0%), and Educational Services (124 | 8.1%).
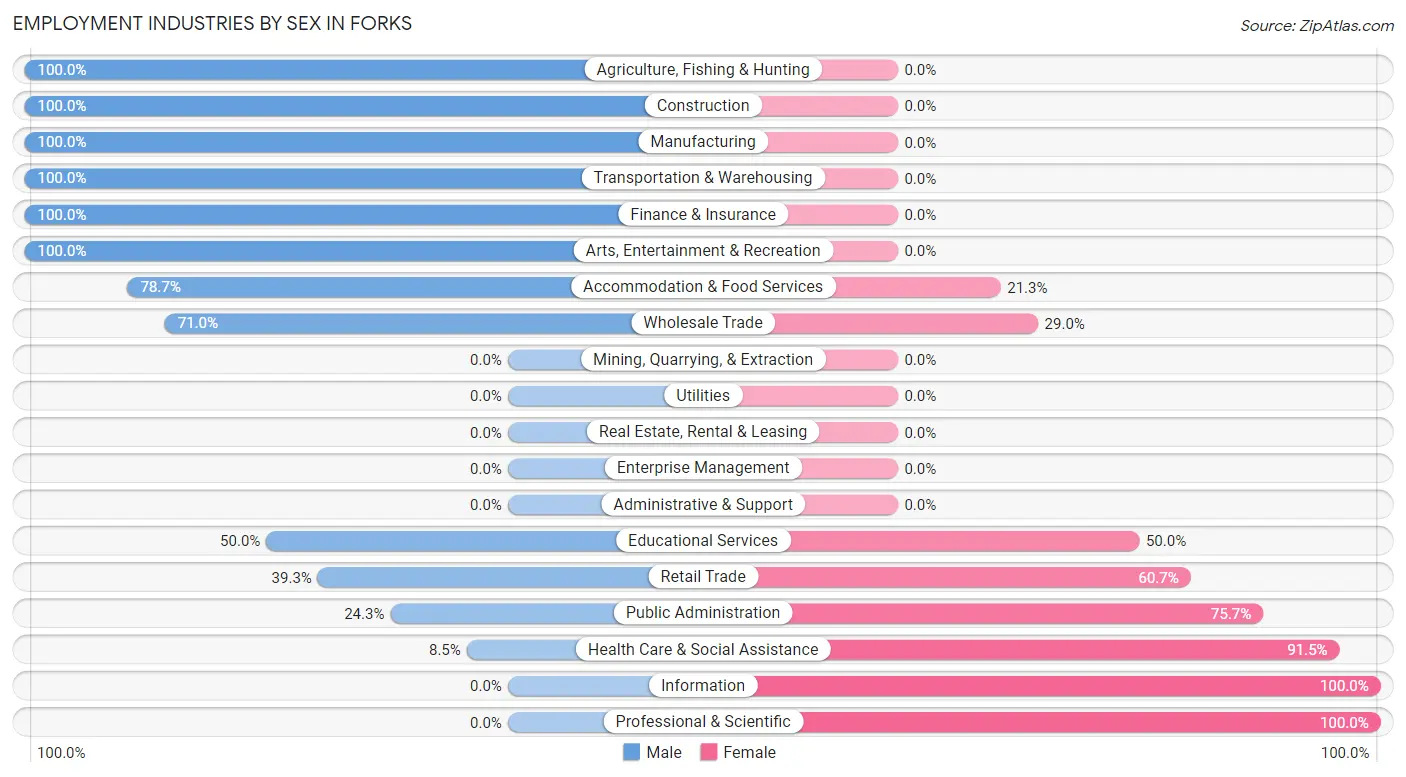
Employment Industries by Sex in Forks
The Forks industries that see more men than women are Agriculture, Fishing & Hunting (100.0%), Construction (100.0%), and Manufacturing (100.0%), whereas the industries that tend to have a higher number of women are Information (100.0%), Professional & Scientific (100.0%), and Health Care & Social Assistance (91.5%).
| Industry | Male | Female |
| Agriculture, Fishing & Hunting | 107 (100.0%) | 0 (0.0%) |
| Mining, Quarrying, & Extraction | 0 (0.0%) | 0 (0.0%) |
| Construction | 15 (100.0%) | 0 (0.0%) |
| Manufacturing | 23 (100.0%) | 0 (0.0%) |
| Wholesale Trade | 22 (71.0%) | 9 (29.0%) |
| Retail Trade | 107 (39.3%) | 165 (60.7%) |
| Transportation & Warehousing | 10 (100.0%) | 0 (0.0%) |
| Utilities | 0 (0.0%) | 0 (0.0%) |
| Information | 0 (0.0%) | 19 (100.0%) |
| Finance & Insurance | 27 (100.0%) | 0 (0.0%) |
| Real Estate, Rental & Leasing | 0 (0.0%) | 0 (0.0%) |
| Professional & Scientific | 0 (0.0%) | 47 (100.0%) |
| Enterprise Management | 0 (0.0%) | 0 (0.0%) |
| Administrative & Support | 0 (0.0%) | 0 (0.0%) |
| Educational Services | 62 (50.0%) | 62 (50.0%) |
| Health Care & Social Assistance | 20 (8.5%) | 215 (91.5%) |
| Arts, Entertainment & Recreation | 17 (100.0%) | 0 (0.0%) |
| Accommodation & Food Services | 181 (78.7%) | 49 (21.3%) |
| Public Administration | 71 (24.3%) | 221 (75.7%) |
| Total | 717 (46.8%) | 815 (53.2%) |
Education in Forks
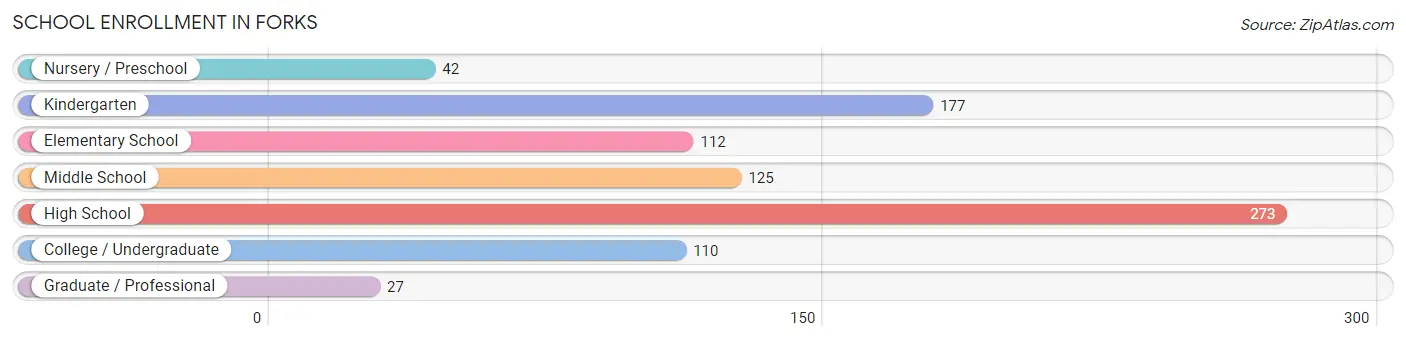
School Enrollment in Forks
The most common levels of schooling among the 866 students in Forks are high school (273 | 31.5%), kindergarten (177 | 20.4%), and middle school (125 | 14.4%).
| School Level | # Students | % Students |
| Nursery / Preschool | 42 | 4.9% |
| Kindergarten | 177 | 20.4% |
| Elementary School | 112 | 12.9% |
| Middle School | 125 | 14.4% |
| High School | 273 | 31.5% |
| College / Undergraduate | 110 | 12.7% |
| Graduate / Professional | 27 | 3.1% |
| Total | 866 | 100.0% |
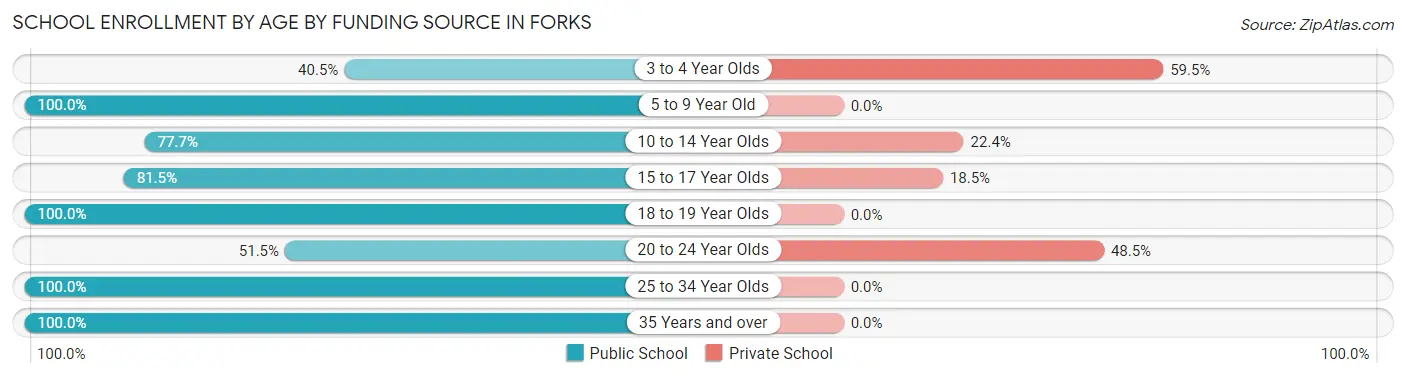
School Enrollment by Age by Funding Source in Forks
Out of a total of 866 students who are enrolled in schools in Forks, 106 (12.2%) attend a private institution, while the remaining 760 (87.8%) are enrolled in public schools. The age group of 3 to 4 year olds has the highest likelihood of being enrolled in private schools, with 25 (59.5% in the age bracket) enrolled. Conversely, the age group of 5 to 9 year old has the lowest likelihood of being enrolled in a private school, with 266 (100.0% in the age bracket) attending a public institution.
| Age Bracket | Public School | Private School |
| 3 to 4 Year Olds | 17 (40.5%) | 25 (59.5%) |
| 5 to 9 Year Old | 266 (100.0%) | 0 (0.0%) |
| 10 to 14 Year Olds | 132 (77.6%) | 38 (22.4%) |
| 15 to 17 Year Olds | 119 (81.5%) | 27 (18.5%) |
| 18 to 19 Year Olds | 58 (100.0%) | 0 (0.0%) |
| 20 to 24 Year Olds | 17 (51.5%) | 16 (48.5%) |
| 25 to 34 Year Olds | 62 (100.0%) | 0 (0.0%) |
| 35 Years and over | 89 (100.0%) | 0 (0.0%) |
| Total | 760 (87.8%) | 106 (12.2%) |
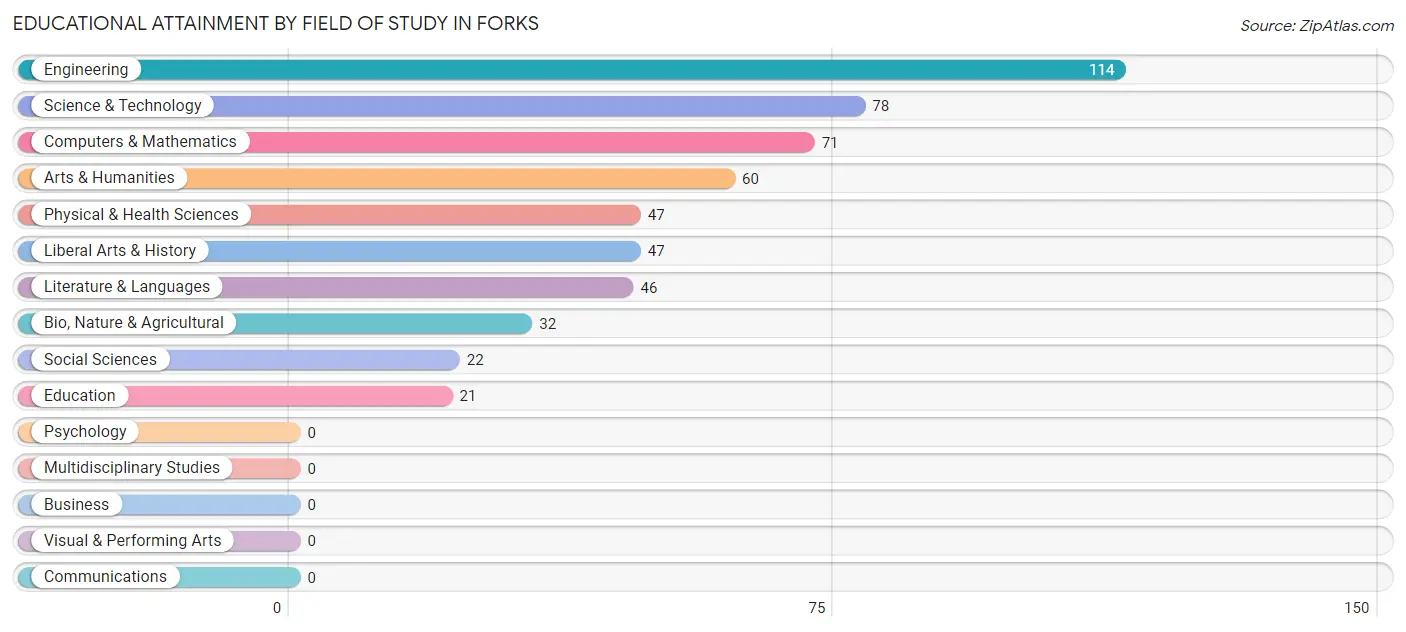
Educational Attainment by Field of Study in Forks
Engineering (114 | 21.2%), science & technology (78 | 14.5%), computers & mathematics (71 | 13.2%), arts & humanities (60 | 11.2%), and physical & health sciences (47 | 8.7%) are the most common fields of study among 538 individuals in Forks who have obtained a bachelor's degree or higher.
| Field of Study | # Graduates | % Graduates |
| Computers & Mathematics | 71 | 13.2% |
| Bio, Nature & Agricultural | 32 | 5.9% |
| Physical & Health Sciences | 47 | 8.7% |
| Psychology | 0 | 0.0% |
| Social Sciences | 22 | 4.1% |
| Engineering | 114 | 21.2% |
| Multidisciplinary Studies | 0 | 0.0% |
| Science & Technology | 78 | 14.5% |
| Business | 0 | 0.0% |
| Education | 21 | 3.9% |
| Literature & Languages | 46 | 8.6% |
| Liberal Arts & History | 47 | 8.7% |
| Visual & Performing Arts | 0 | 0.0% |
| Communications | 0 | 0.0% |
| Arts & Humanities | 60 | 11.2% |
| Total | 538 | 100.0% |
Transportation & Commute in Forks
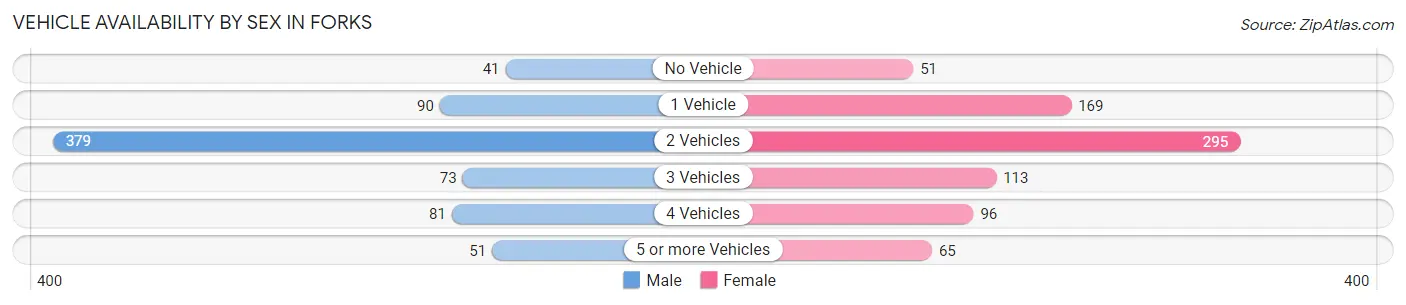
Vehicle Availability by Sex in Forks
The most prevalent vehicle ownership categories in Forks are males with 2 vehicles (379, accounting for 53.0%) and females with 2 vehicles (295, making up 48.0%).
| Vehicles Available | Male | Female |
| No Vehicle | 41 (5.7%) | 51 (6.5%) |
| 1 Vehicle | 90 (12.6%) | 169 (21.4%) |
| 2 Vehicles | 379 (53.0%) | 295 (37.4%) |
| 3 Vehicles | 73 (10.2%) | 113 (14.3%) |
| 4 Vehicles | 81 (11.3%) | 96 (12.2%) |
| 5 or more Vehicles | 51 (7.1%) | 65 (8.2%) |
| Total | 715 (100.0%) | 789 (100.0%) |
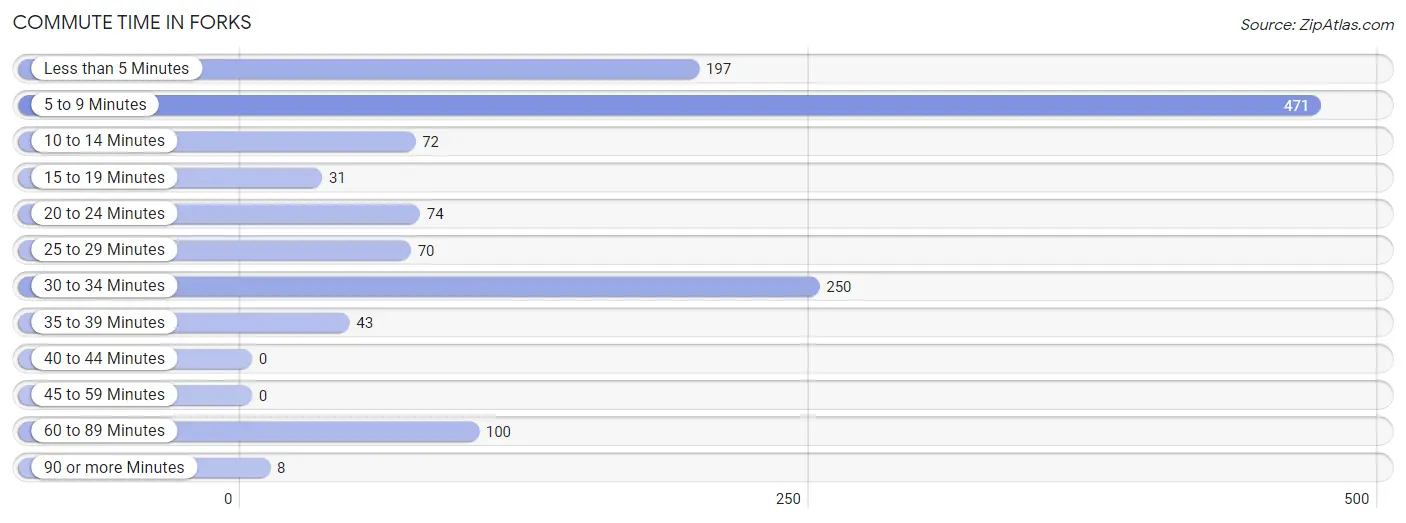
Commute Time in Forks
The most frequently occuring commute durations in Forks are 5 to 9 minutes (471 commuters, 35.8%), 30 to 34 minutes (250 commuters, 19.0%), and less than 5 minutes (197 commuters, 15.0%).
| Commute Time | # Commuters | % Commuters |
| Less than 5 Minutes | 197 | 15.0% |
| 5 to 9 Minutes | 471 | 35.8% |
| 10 to 14 Minutes | 72 | 5.5% |
| 15 to 19 Minutes | 31 | 2.4% |
| 20 to 24 Minutes | 74 | 5.6% |
| 25 to 29 Minutes | 70 | 5.3% |
| 30 to 34 Minutes | 250 | 19.0% |
| 35 to 39 Minutes | 43 | 3.3% |
| 40 to 44 Minutes | 0 | 0.0% |
| 45 to 59 Minutes | 0 | 0.0% |
| 60 to 89 Minutes | 100 | 7.6% |
| 90 or more Minutes | 8 | 0.6% |
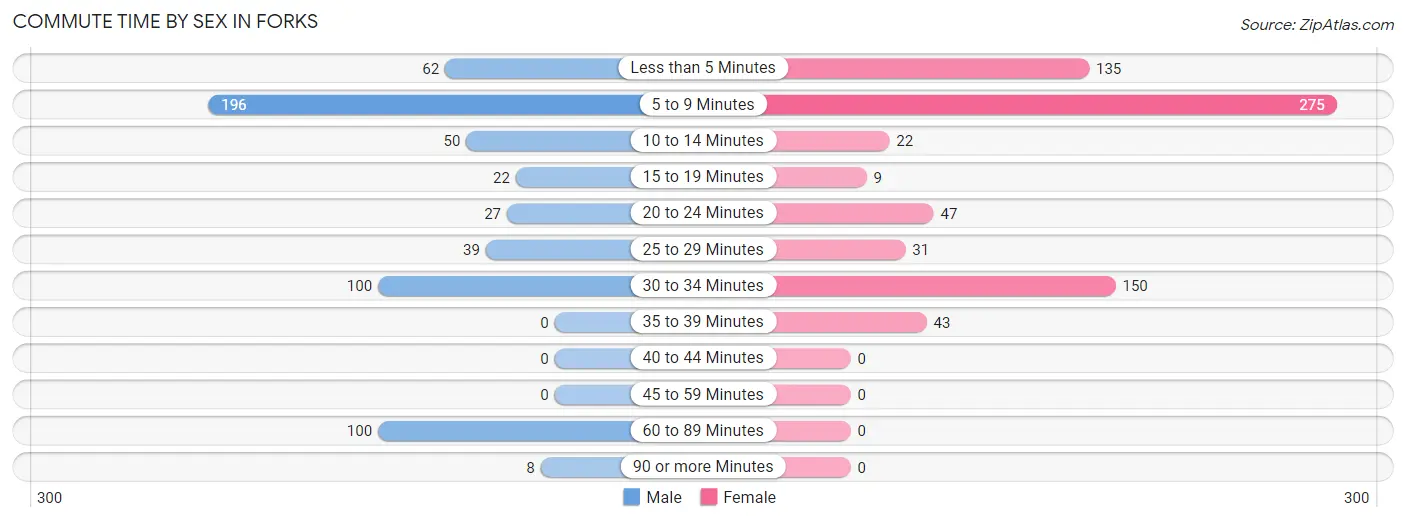
Commute Time by Sex in Forks
The most common commute times in Forks are 5 to 9 minutes (196 commuters, 32.5%) for males and 5 to 9 minutes (275 commuters, 38.6%) for females.
| Commute Time | Male | Female |
| Less than 5 Minutes | 62 (10.3%) | 135 (19.0%) |
| 5 to 9 Minutes | 196 (32.5%) | 275 (38.6%) |
| 10 to 14 Minutes | 50 (8.3%) | 22 (3.1%) |
| 15 to 19 Minutes | 22 (3.6%) | 9 (1.3%) |
| 20 to 24 Minutes | 27 (4.5%) | 47 (6.6%) |
| 25 to 29 Minutes | 39 (6.5%) | 31 (4.3%) |
| 30 to 34 Minutes | 100 (16.6%) | 150 (21.1%) |
| 35 to 39 Minutes | 0 (0.0%) | 43 (6.0%) |
| 40 to 44 Minutes | 0 (0.0%) | 0 (0.0%) |
| 45 to 59 Minutes | 0 (0.0%) | 0 (0.0%) |
| 60 to 89 Minutes | 100 (16.6%) | 0 (0.0%) |
| 90 or more Minutes | 8 (1.3%) | 0 (0.0%) |
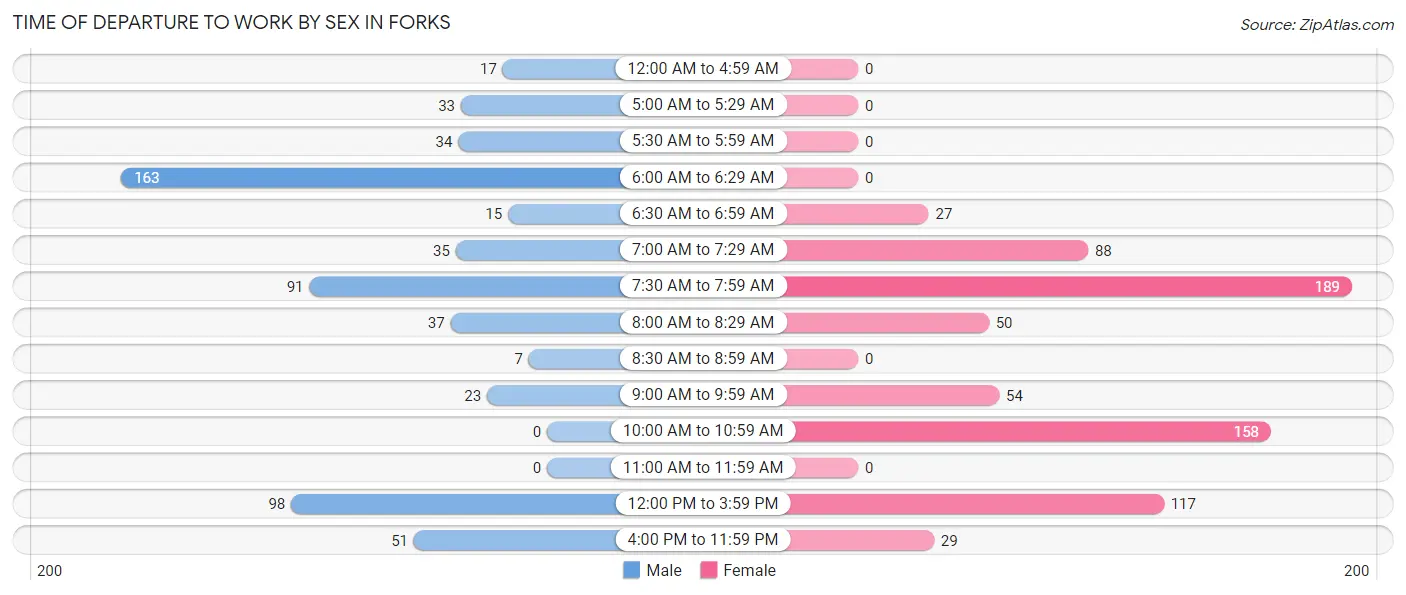
Time of Departure to Work by Sex in Forks
The most frequent times of departure to work in Forks are 6:00 AM to 6:29 AM (163, 27.0%) for males and 7:30 AM to 7:59 AM (189, 26.5%) for females.
| Time of Departure | Male | Female |
| 12:00 AM to 4:59 AM | 17 (2.8%) | 0 (0.0%) |
| 5:00 AM to 5:29 AM | 33 (5.5%) | 0 (0.0%) |
| 5:30 AM to 5:59 AM | 34 (5.6%) | 0 (0.0%) |
| 6:00 AM to 6:29 AM | 163 (27.0%) | 0 (0.0%) |
| 6:30 AM to 6:59 AM | 15 (2.5%) | 27 (3.8%) |
| 7:00 AM to 7:29 AM | 35 (5.8%) | 88 (12.4%) |
| 7:30 AM to 7:59 AM | 91 (15.1%) | 189 (26.5%) |
| 8:00 AM to 8:29 AM | 37 (6.1%) | 50 (7.0%) |
| 8:30 AM to 8:59 AM | 7 (1.2%) | 0 (0.0%) |
| 9:00 AM to 9:59 AM | 23 (3.8%) | 54 (7.6%) |
| 10:00 AM to 10:59 AM | 0 (0.0%) | 158 (22.2%) |
| 11:00 AM to 11:59 AM | 0 (0.0%) | 0 (0.0%) |
| 12:00 PM to 3:59 PM | 98 (16.2%) | 117 (16.4%) |
| 4:00 PM to 11:59 PM | 51 (8.4%) | 29 (4.1%) |
| Total | 604 (100.0%) | 712 (100.0%) |
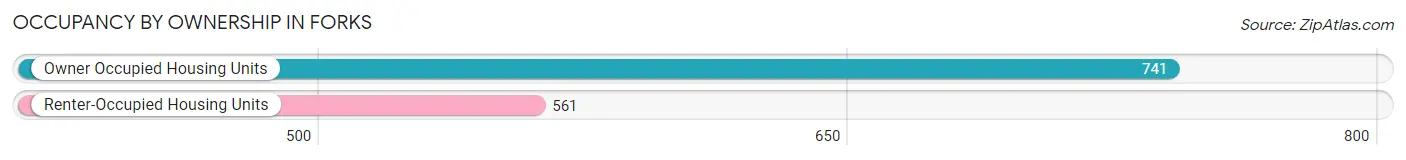
Housing Occupancy in Forks
Occupancy by Ownership in Forks
Of the total 1,302 dwellings in Forks, owner-occupied units account for 741 (56.9%), while renter-occupied units make up 561 (43.1%).
| Occupancy | # Housing Units | % Housing Units |
| Owner Occupied Housing Units | 741 | 56.9% |
| Renter-Occupied Housing Units | 561 | 43.1% |
| Total Occupied Housing Units | 1,302 | 100.0% |
Occupancy by Household Size in Forks
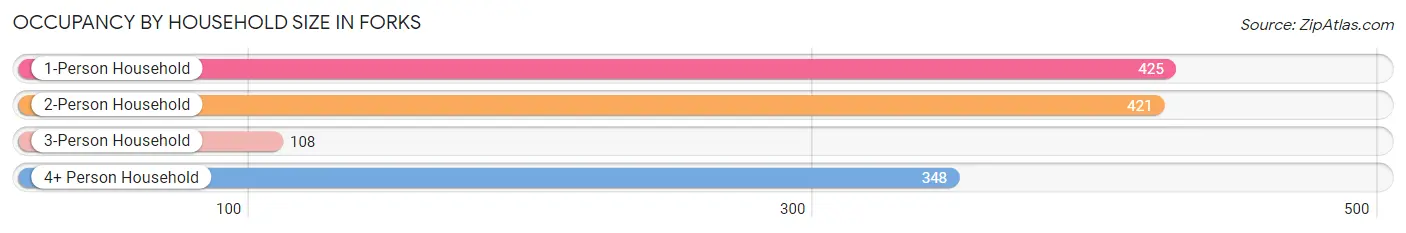
| Household Size | # Housing Units | % Housing Units |
| 1-Person Household | 425 | 32.6% |
| 2-Person Household | 421 | 32.3% |
| 3-Person Household | 108 | 8.3% |
| 4+ Person Household | 348 | 26.7% |
| Total Housing Units | 1,302 | 100.0% |
Occupancy by Ownership by Household Size in Forks
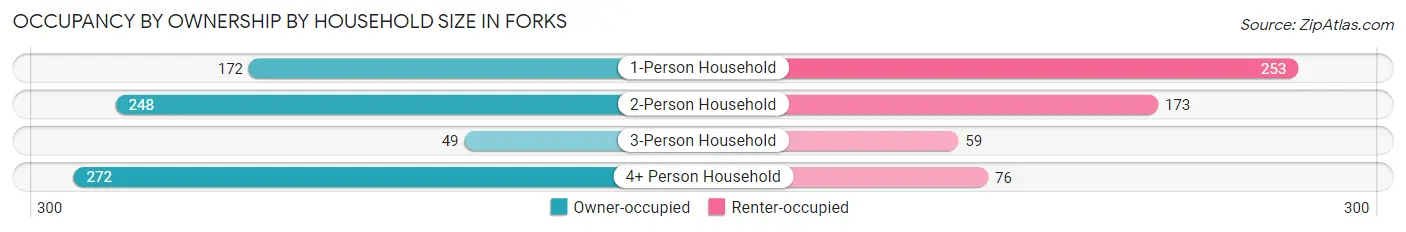
| Household Size | Owner-occupied | Renter-occupied |
| 1-Person Household | 172 (40.5%) | 253 (59.5%) |
| 2-Person Household | 248 (58.9%) | 173 (41.1%) |
| 3-Person Household | 49 (45.4%) | 59 (54.6%) |
| 4+ Person Household | 272 (78.2%) | 76 (21.8%) |
| Total Housing Units | 741 (56.9%) | 561 (43.1%) |
Occupancy by Educational Attainment in Forks
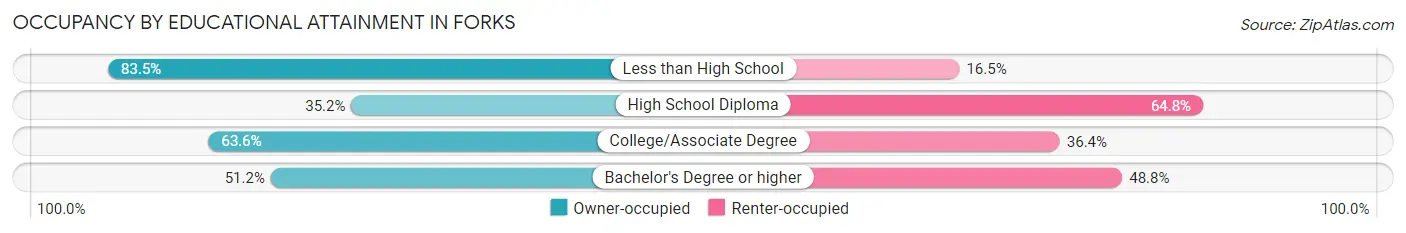
| Household Size | Owner-occupied | Renter-occupied |
| Less than High School | 187 (83.5%) | 37 (16.5%) |
| High School Diploma | 131 (35.2%) | 241 (64.8%) |
| College/Associate Degree | 316 (63.6%) | 181 (36.4%) |
| Bachelor's Degree or higher | 107 (51.2%) | 102 (48.8%) |
Occupancy by Age of Householder in Forks
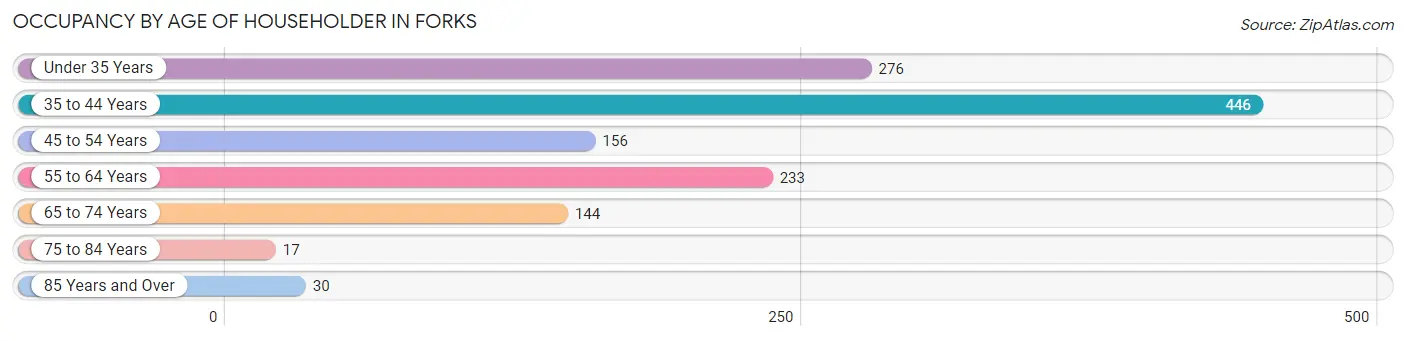
| Age Bracket | # Households | % Households |
| Under 35 Years | 276 | 21.2% |
| 35 to 44 Years | 446 | 34.3% |
| 45 to 54 Years | 156 | 12.0% |
| 55 to 64 Years | 233 | 17.9% |
| 65 to 74 Years | 144 | 11.1% |
| 75 to 84 Years | 17 | 1.3% |
| 85 Years and Over | 30 | 2.3% |
| Total | 1,302 | 100.0% |
Housing Finances in Forks
Median Income by Occupancy in Forks
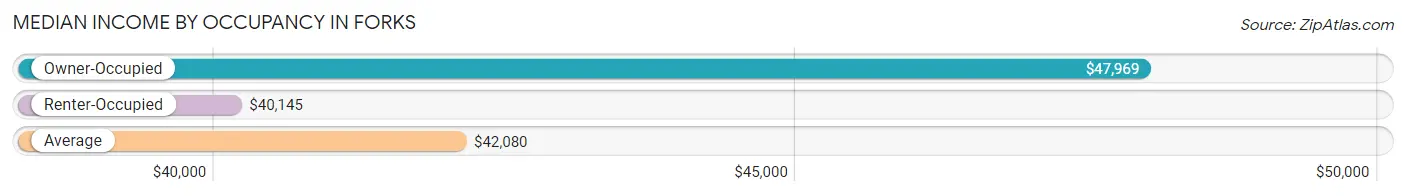
| Occupancy Type | # Households | Median Income |
| Owner-Occupied | 741 (56.9%) | $47,969 |
| Renter-Occupied | 561 (43.1%) | $40,145 |
| Average | 1,302 (100.0%) | $42,080 |
Occupancy by Householder Income Bracket in Forks
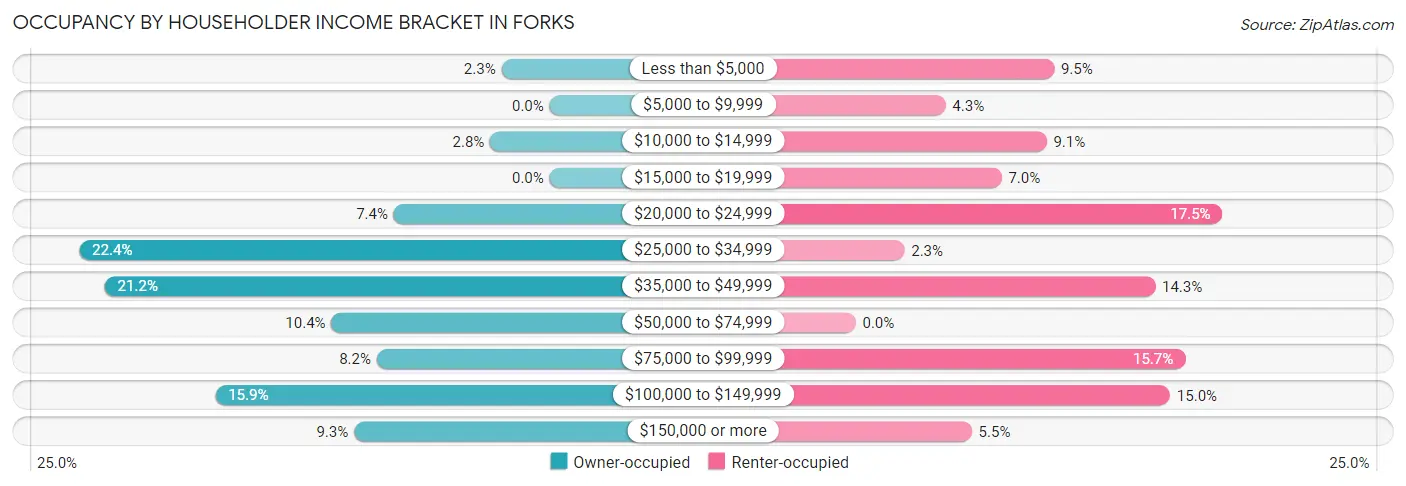
| Income Bracket | Owner-occupied | Renter-occupied |
| Less than $5,000 | 17 (2.3%) | 53 (9.5%) |
| $5,000 to $9,999 | 0 (0.0%) | 24 (4.3%) |
| $10,000 to $14,999 | 21 (2.8%) | 51 (9.1%) |
| $15,000 to $19,999 | 0 (0.0%) | 39 (7.0%) |
| $20,000 to $24,999 | 55 (7.4%) | 98 (17.5%) |
| $25,000 to $34,999 | 166 (22.4%) | 13 (2.3%) |
| $35,000 to $49,999 | 157 (21.2%) | 80 (14.3%) |
| $50,000 to $74,999 | 77 (10.4%) | 0 (0.0%) |
| $75,000 to $99,999 | 61 (8.2%) | 88 (15.7%) |
| $100,000 to $149,999 | 118 (15.9%) | 84 (15.0%) |
| $150,000 or more | 69 (9.3%) | 31 (5.5%) |
| Total | 741 (100.0%) | 561 (100.0%) |
Monthly Housing Cost Tiers in Forks
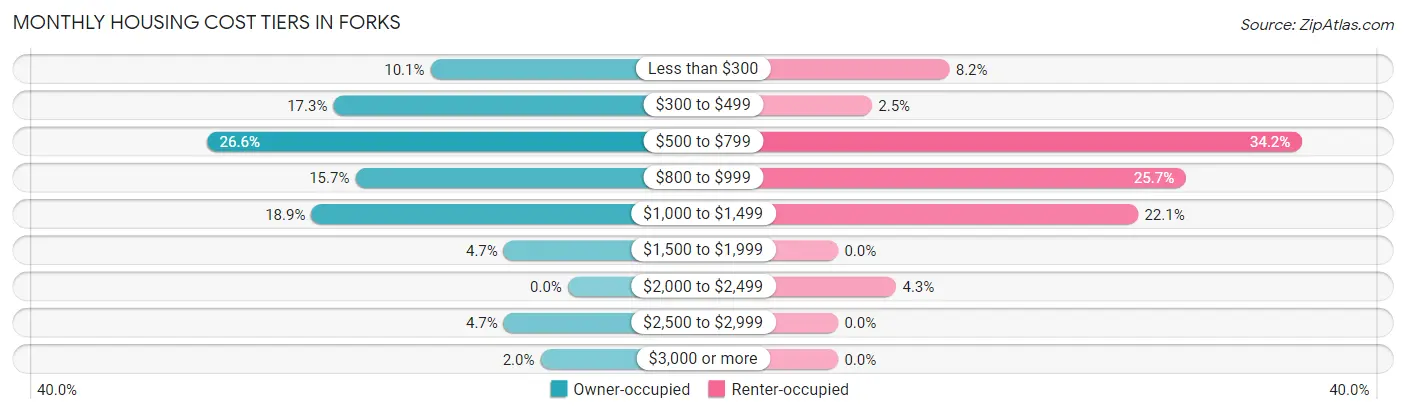
| Monthly Cost | Owner-occupied | Renter-occupied |
| Less than $300 | 75 (10.1%) | 46 (8.2%) |
| $300 to $499 | 128 (17.3%) | 14 (2.5%) |
| $500 to $799 | 197 (26.6%) | 192 (34.2%) |
| $800 to $999 | 116 (15.7%) | 144 (25.7%) |
| $1,000 to $1,499 | 140 (18.9%) | 124 (22.1%) |
| $1,500 to $1,999 | 35 (4.7%) | 0 (0.0%) |
| $2,000 to $2,499 | 0 (0.0%) | 24 (4.3%) |
| $2,500 to $2,999 | 35 (4.7%) | 0 (0.0%) |
| $3,000 or more | 15 (2.0%) | 0 (0.0%) |
| Total | 741 (100.0%) | 561 (100.0%) |
Physical Housing Characteristics in Forks
Housing Structures in Forks
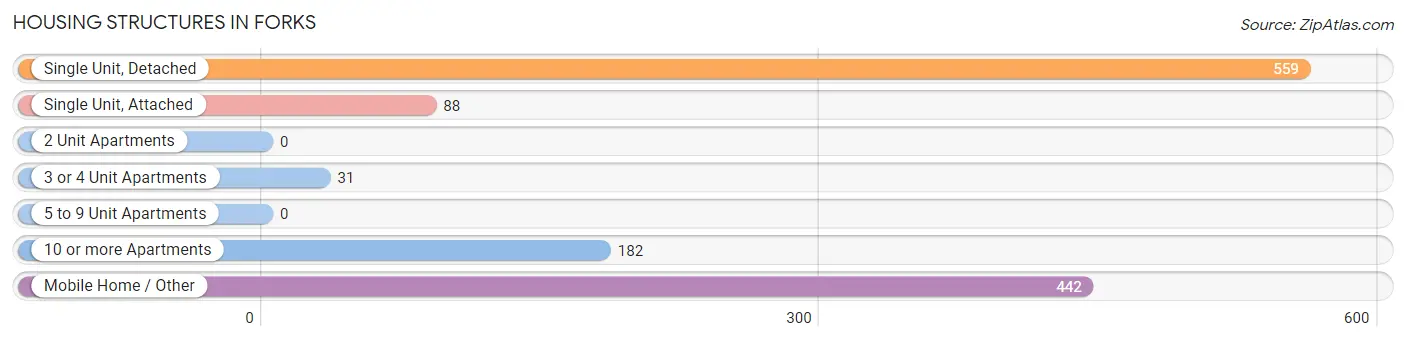
| Structure Type | # Housing Units | % Housing Units |
| Single Unit, Detached | 559 | 42.9% |
| Single Unit, Attached | 88 | 6.8% |
| 2 Unit Apartments | 0 | 0.0% |
| 3 or 4 Unit Apartments | 31 | 2.4% |
| 5 to 9 Unit Apartments | 0 | 0.0% |
| 10 or more Apartments | 182 | 14.0% |
| Mobile Home / Other | 442 | 34.0% |
| Total | 1,302 | 100.0% |
Housing Structures by Occupancy in Forks
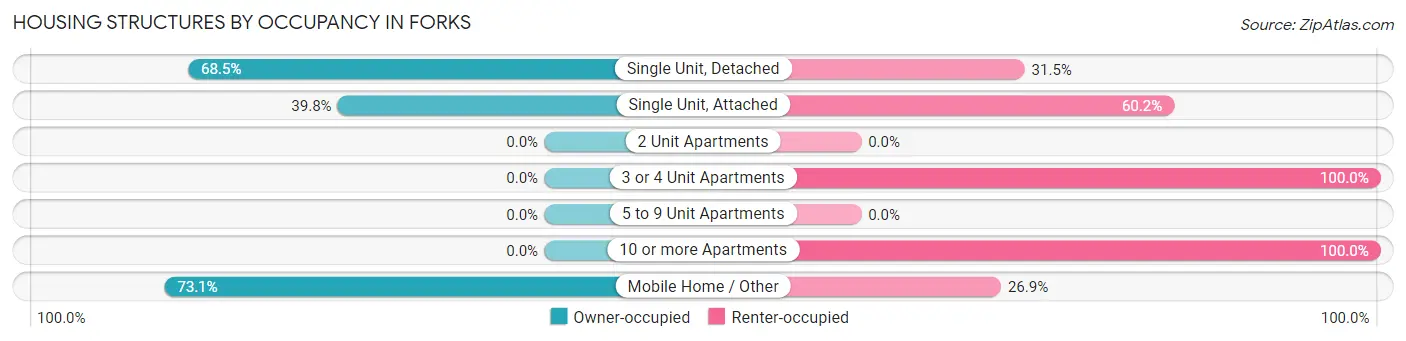
| Structure Type | Owner-occupied | Renter-occupied |
| Single Unit, Detached | 383 (68.5%) | 176 (31.5%) |
| Single Unit, Attached | 35 (39.8%) | 53 (60.2%) |
| 2 Unit Apartments | 0 (0.0%) | 0 (0.0%) |
| 3 or 4 Unit Apartments | 0 (0.0%) | 31 (100.0%) |
| 5 to 9 Unit Apartments | 0 (0.0%) | 0 (0.0%) |
| 10 or more Apartments | 0 (0.0%) | 182 (100.0%) |
| Mobile Home / Other | 323 (73.1%) | 119 (26.9%) |
| Total | 741 (56.9%) | 561 (43.1%) |
Housing Structures by Number of Rooms in Forks
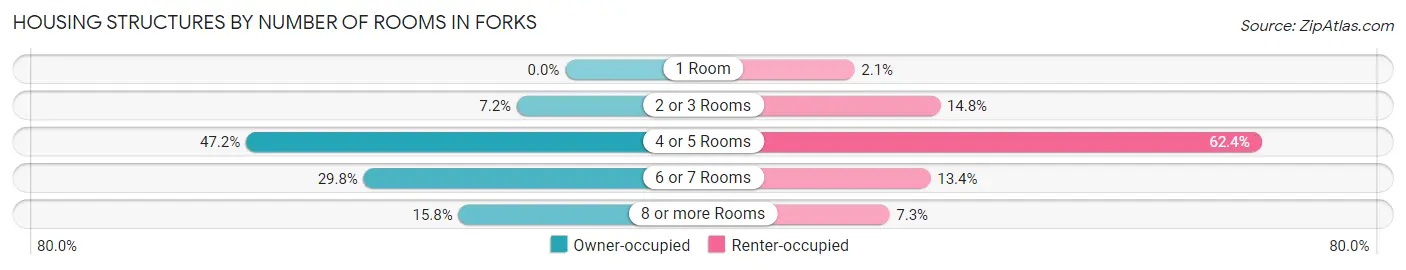
| Number of Rooms | Owner-occupied | Renter-occupied |
| 1 Room | 0 (0.0%) | 12 (2.1%) |
| 2 or 3 Rooms | 53 (7.1%) | 83 (14.8%) |
| 4 or 5 Rooms | 350 (47.2%) | 350 (62.4%) |
| 6 or 7 Rooms | 221 (29.8%) | 75 (13.4%) |
| 8 or more Rooms | 117 (15.8%) | 41 (7.3%) |
| Total | 741 (100.0%) | 561 (100.0%) |
Housing Structure by Heating Type in Forks
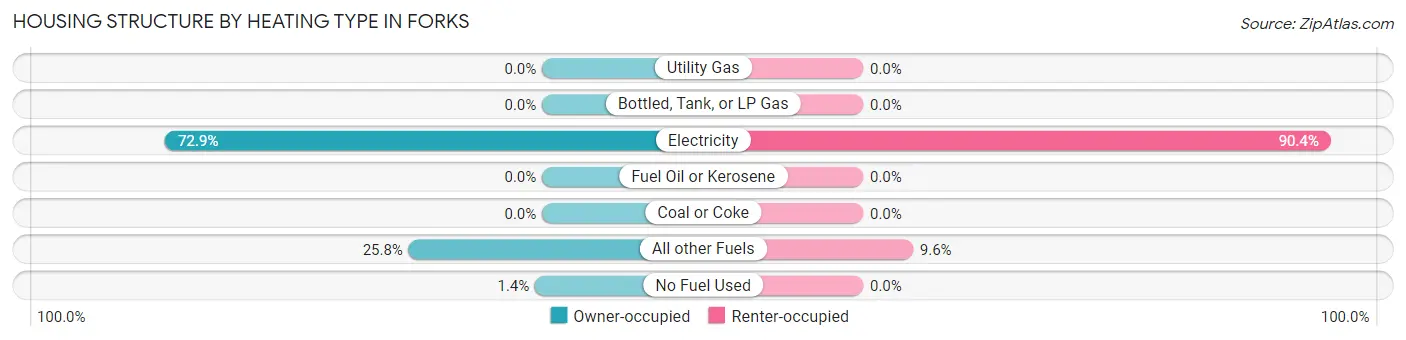
| Heating Type | Owner-occupied | Renter-occupied |
| Utility Gas | 0 (0.0%) | 0 (0.0%) |
| Bottled, Tank, or LP Gas | 0 (0.0%) | 0 (0.0%) |
| Electricity | 540 (72.9%) | 507 (90.4%) |
| Fuel Oil or Kerosene | 0 (0.0%) | 0 (0.0%) |
| Coal or Coke | 0 (0.0%) | 0 (0.0%) |
| All other Fuels | 191 (25.8%) | 54 (9.6%) |
| No Fuel Used | 10 (1.3%) | 0 (0.0%) |
| Total | 741 (100.0%) | 561 (100.0%) |
Household Vehicle Usage in Forks
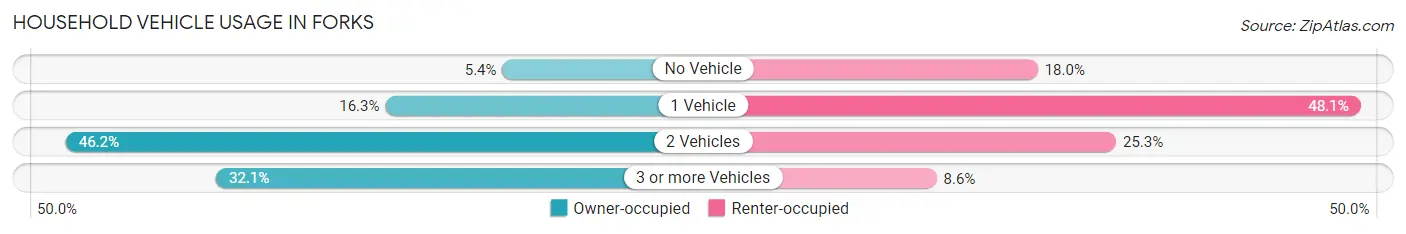
| Vehicles per Household | Owner-occupied | Renter-occupied |
| No Vehicle | 40 (5.4%) | 101 (18.0%) |
| 1 Vehicle | 121 (16.3%) | 270 (48.1%) |
| 2 Vehicles | 342 (46.2%) | 142 (25.3%) |
| 3 or more Vehicles | 238 (32.1%) | 48 (8.6%) |
| Total | 741 (100.0%) | 561 (100.0%) |
Real Estate & Mortgages in Forks
Real Estate and Mortgage Overview in Forks
| Characteristic | Without Mortgage | With Mortgage |
| Housing Units | 488 | 253 |
| Median Property Value | - | - |
| Median Household Income | $40,771 | $48 |
| Monthly Housing Costs | $579 | $15 |
| Real Estate Taxes | $208 | $0 |
Property Value by Mortgage Status in Forks
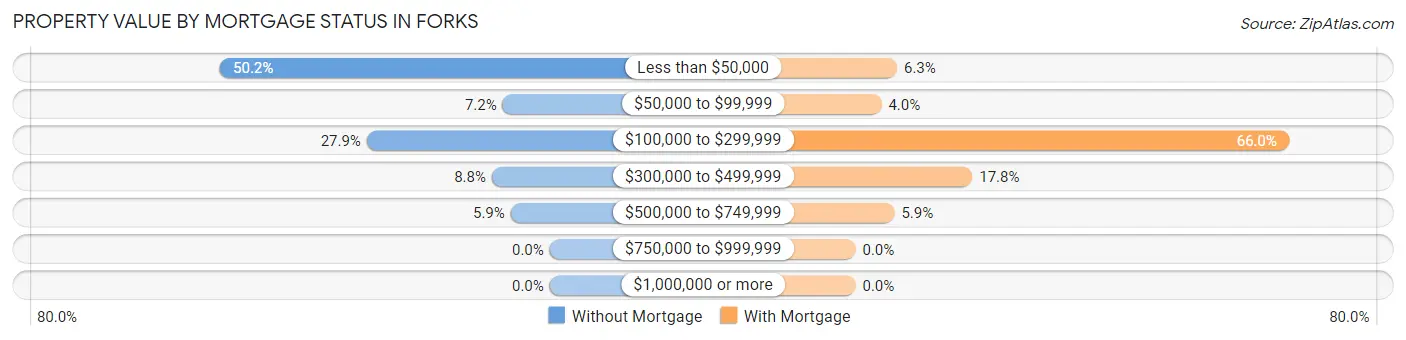
| Property Value | Without Mortgage | With Mortgage |
| Less than $50,000 | 245 (50.2%) | 16 (6.3%) |
| $50,000 to $99,999 | 35 (7.2%) | 10 (4.0%) |
| $100,000 to $299,999 | 136 (27.9%) | 167 (66.0%) |
| $300,000 to $499,999 | 43 (8.8%) | 45 (17.8%) |
| $500,000 to $749,999 | 29 (5.9%) | 15 (5.9%) |
| $750,000 to $999,999 | 0 (0.0%) | 0 (0.0%) |
| $1,000,000 or more | 0 (0.0%) | 0 (0.0%) |
| Total | 488 (100.0%) | 253 (100.0%) |
Household Income by Mortgage Status in Forks
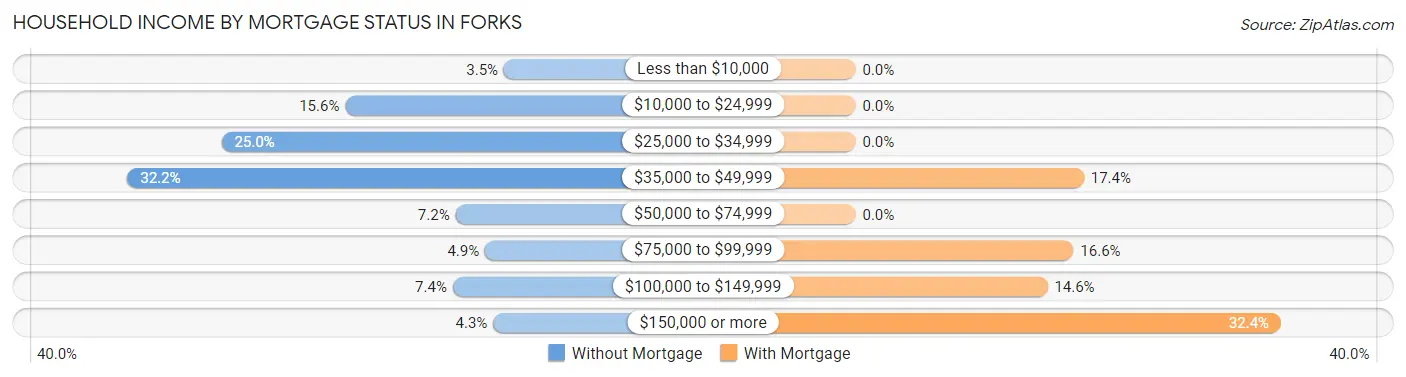
| Household Income | Without Mortgage | With Mortgage |
| Less than $10,000 | 17 (3.5%) | 0 (0.0%) |
| $10,000 to $24,999 | 76 (15.6%) | 0 (0.0%) |
| $25,000 to $34,999 | 122 (25.0%) | 0 (0.0%) |
| $35,000 to $49,999 | 157 (32.2%) | 44 (17.4%) |
| $50,000 to $74,999 | 35 (7.2%) | 0 (0.0%) |
| $75,000 to $99,999 | 24 (4.9%) | 42 (16.6%) |
| $100,000 to $149,999 | 36 (7.4%) | 37 (14.6%) |
| $150,000 or more | 21 (4.3%) | 82 (32.4%) |
| Total | 488 (100.0%) | 253 (100.0%) |
Property Value to Household Income Ratio in Forks
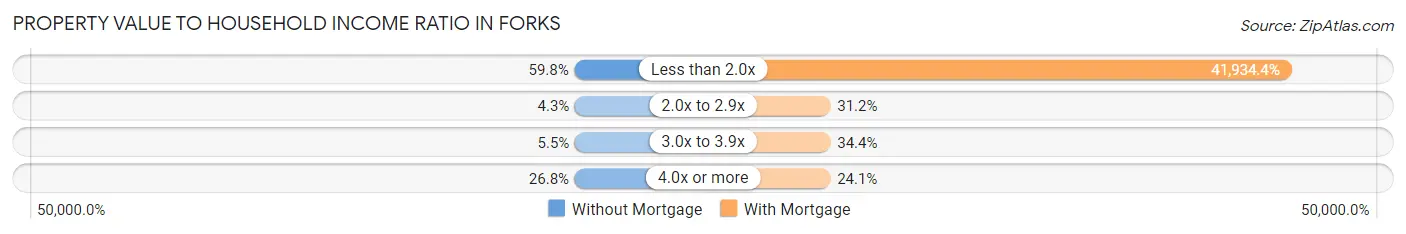
| Value-to-Income Ratio | Without Mortgage | With Mortgage |
| Less than 2.0x | 292 (59.8%) | 106,094 (41,934.4%) |
| 2.0x to 2.9x | 21 (4.3%) | 79 (31.2%) |
| 3.0x to 3.9x | 27 (5.5%) | 87 (34.4%) |
| 4.0x or more | 131 (26.8%) | 61 (24.1%) |
| Total | 488 (100.0%) | 253 (100.0%) |
Real Estate Taxes by Mortgage Status in Forks
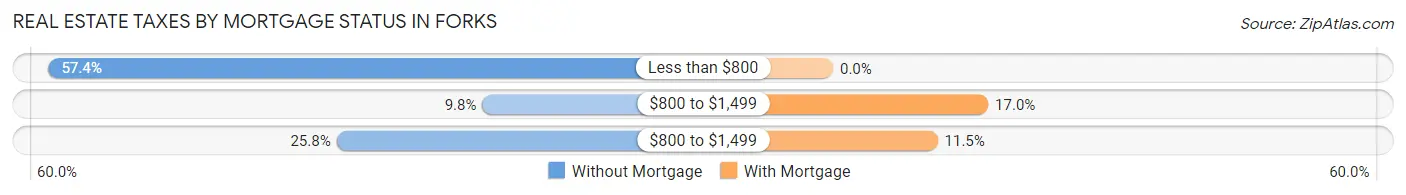
| Property Taxes | Without Mortgage | With Mortgage |
| Less than $800 | 280 (57.4%) | 0 (0.0%) |
| $800 to $1,499 | 48 (9.8%) | 43 (17.0%) |
| $800 to $1,499 | 126 (25.8%) | 29 (11.5%) |
| Total | 488 (100.0%) | 253 (100.0%) |
Health & Disability in Forks
Health Insurance Coverage by Age in Forks
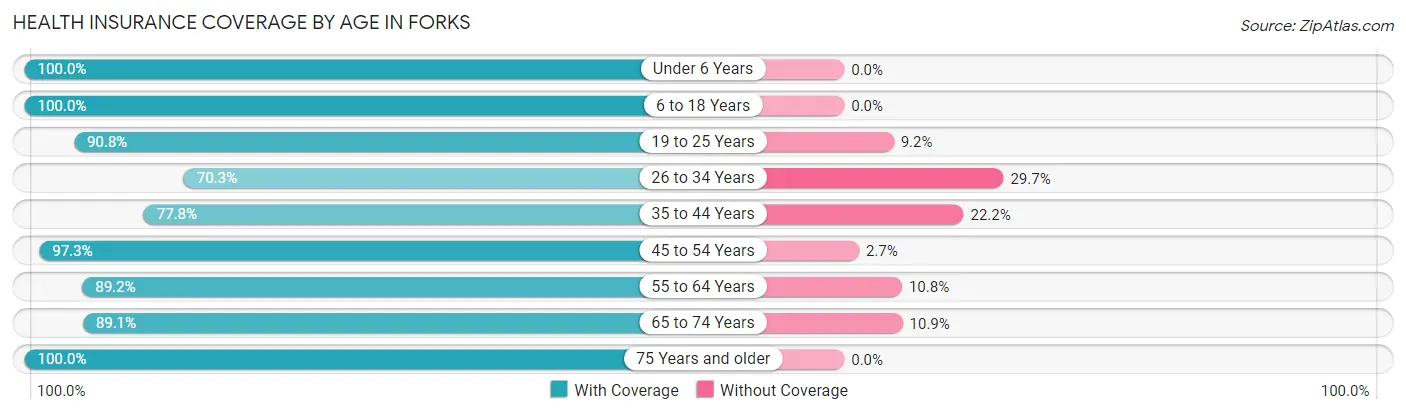
| Age Bracket | With Coverage | Without Coverage |
| Under 6 Years | 396 (100.0%) | 0 (0.0%) |
| 6 to 18 Years | 591 (100.0%) | 0 (0.0%) |
| 19 to 25 Years | 207 (90.8%) | 21 (9.2%) |
| 26 to 34 Years | 367 (70.3%) | 155 (29.7%) |
| 35 to 44 Years | 444 (77.8%) | 127 (22.2%) |
| 45 to 54 Years | 284 (97.3%) | 8 (2.7%) |
| 55 to 64 Years | 307 (89.2%) | 37 (10.8%) |
| 65 to 74 Years | 205 (89.1%) | 25 (10.9%) |
| 75 Years and older | 123 (100.0%) | 0 (0.0%) |
| Total | 2,924 (88.7%) | 373 (11.3%) |
Health Insurance Coverage by Citizenship Status in Forks
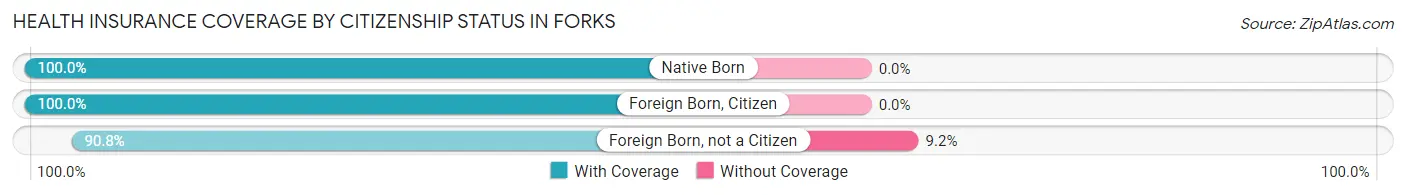
| Citizenship Status | With Coverage | Without Coverage |
| Native Born | 396 (100.0%) | 0 (0.0%) |
| Foreign Born, Citizen | 591 (100.0%) | 0 (0.0%) |
| Foreign Born, not a Citizen | 207 (90.8%) | 21 (9.2%) |
Health Insurance Coverage by Household Income in Forks
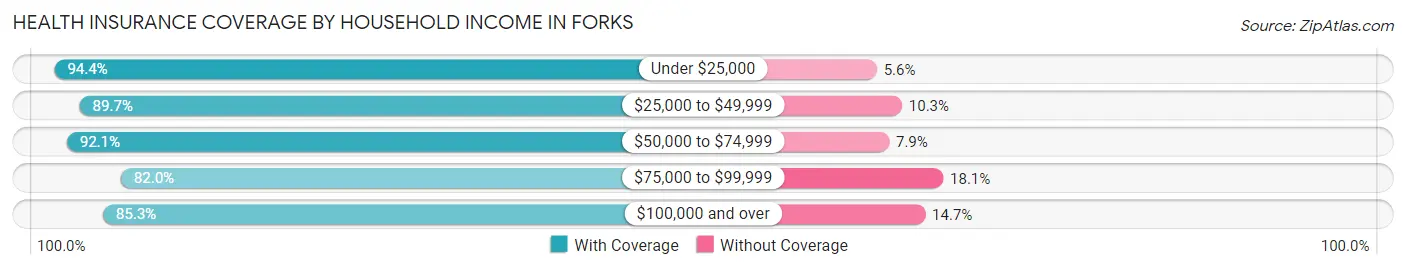
| Household Income | With Coverage | Without Coverage |
| Under $25,000 | 438 (94.4%) | 26 (5.6%) |
| $25,000 to $49,999 | 1,208 (89.7%) | 139 (10.3%) |
| $50,000 to $74,999 | 233 (92.1%) | 20 (7.9%) |
| $75,000 to $99,999 | 277 (82.0%) | 61 (18.0%) |
| $100,000 and over | 738 (85.3%) | 127 (14.7%) |
Public vs Private Health Insurance Coverage by Age in Forks
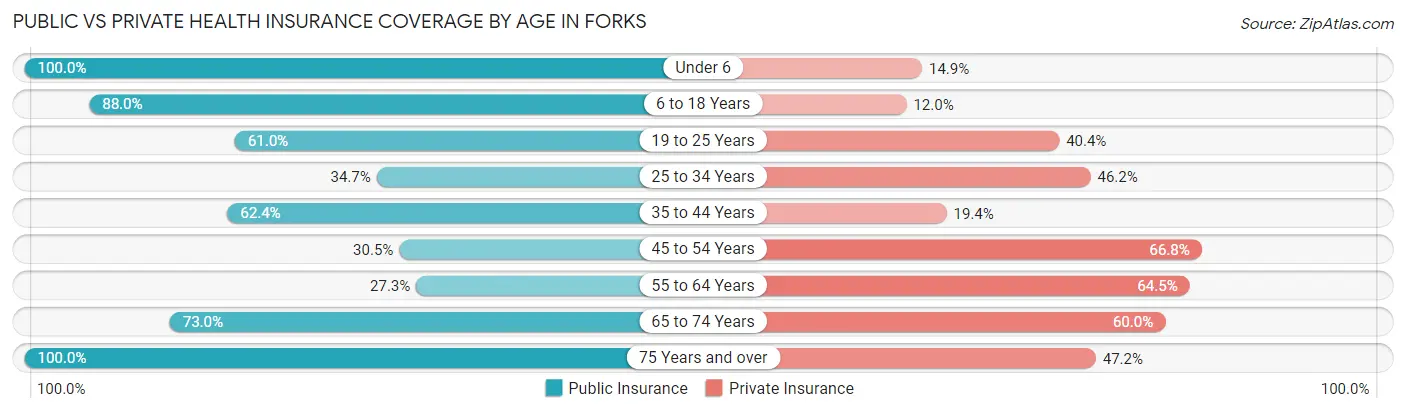
| Age Bracket | Public Insurance | Private Insurance |
| Under 6 | 396 (100.0%) | 59 (14.9%) |
| 6 to 18 Years | 520 (88.0%) | 71 (12.0%) |
| 19 to 25 Years | 139 (61.0%) | 92 (40.4%) |
| 25 to 34 Years | 181 (34.7%) | 241 (46.2%) |
| 35 to 44 Years | 356 (62.4%) | 111 (19.4%) |
| 45 to 54 Years | 89 (30.5%) | 195 (66.8%) |
| 55 to 64 Years | 94 (27.3%) | 222 (64.5%) |
| 65 to 74 Years | 168 (73.0%) | 138 (60.0%) |
| 75 Years and over | 123 (100.0%) | 58 (47.1%) |
| Total | 2,066 (62.7%) | 1,187 (36.0%) |
Disability Status by Sex by Age in Forks
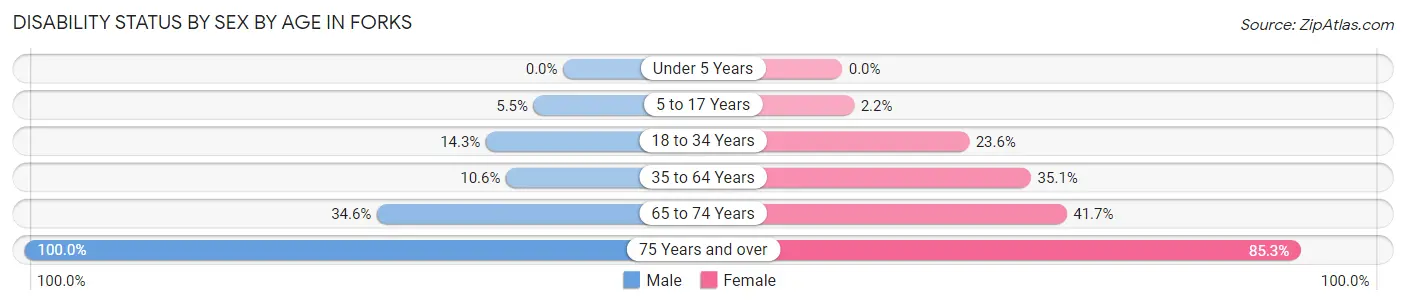
| Age Bracket | Male | Female |
| Under 5 Years | 0 (0.0%) | 0 (0.0%) |
| 5 to 17 Years | 15 (5.5%) | 7 (2.2%) |
| 18 to 34 Years | 57 (14.3%) | 110 (23.5%) |
| 35 to 64 Years | 52 (10.6%) | 251 (35.1%) |
| 65 to 74 Years | 38 (34.5%) | 50 (41.7%) |
| 75 Years and over | 62 (100.0%) | 52 (85.3%) |
Disability Class by Sex by Age in Forks
Disability Class: Hearing Difficulty
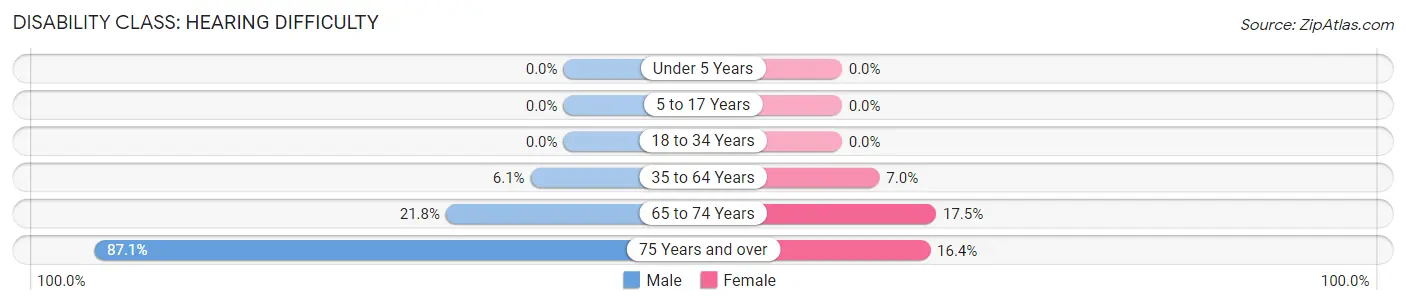
| Age Bracket | Male | Female |
| Under 5 Years | 0 (0.0%) | 0 (0.0%) |
| 5 to 17 Years | 0 (0.0%) | 0 (0.0%) |
| 18 to 34 Years | 0 (0.0%) | 0 (0.0%) |
| 35 to 64 Years | 30 (6.1%) | 50 (7.0%) |
| 65 to 74 Years | 24 (21.8%) | 21 (17.5%) |
| 75 Years and over | 54 (87.1%) | 10 (16.4%) |
Disability Class: Vision Difficulty
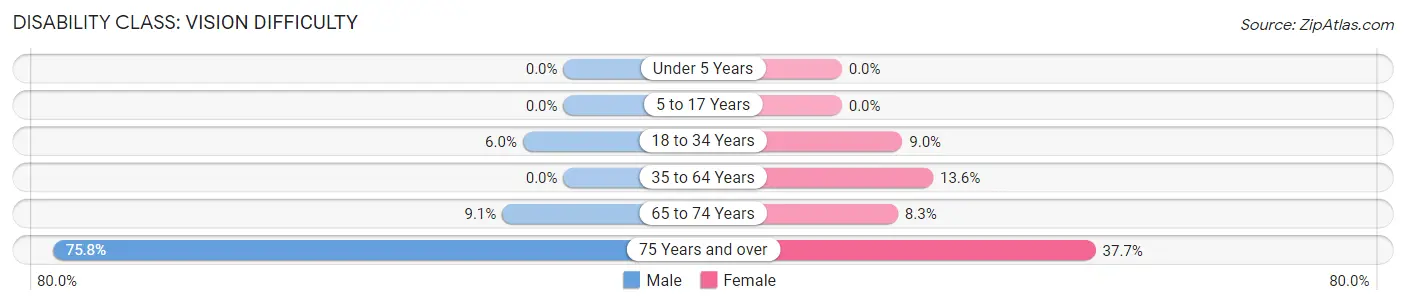
| Age Bracket | Male | Female |
| Under 5 Years | 0 (0.0%) | 0 (0.0%) |
| 5 to 17 Years | 0 (0.0%) | 0 (0.0%) |
| 18 to 34 Years | 24 (6.0%) | 42 (9.0%) |
| 35 to 64 Years | 0 (0.0%) | 97 (13.6%) |
| 65 to 74 Years | 10 (9.1%) | 10 (8.3%) |
| 75 Years and over | 47 (75.8%) | 23 (37.7%) |
Disability Class: Cognitive Difficulty
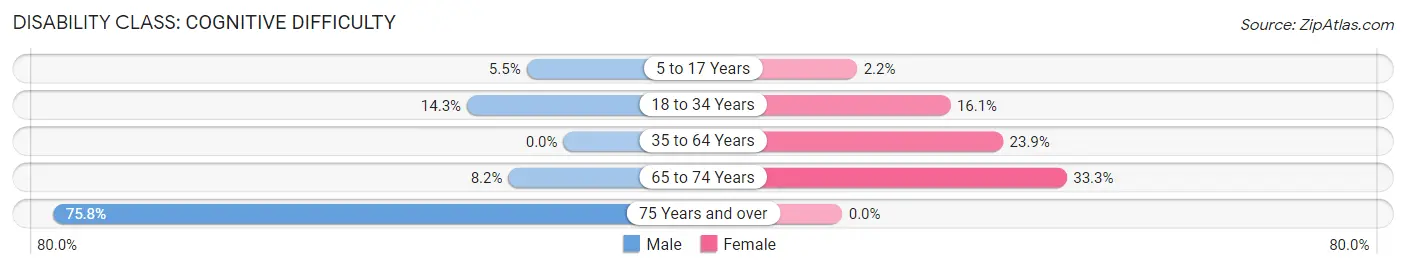
| Age Bracket | Male | Female |
| 5 to 17 Years | 15 (5.5%) | 7 (2.2%) |
| 18 to 34 Years | 57 (14.3%) | 75 (16.1%) |
| 35 to 64 Years | 0 (0.0%) | 171 (23.9%) |
| 65 to 74 Years | 9 (8.2%) | 40 (33.3%) |
| 75 Years and over | 47 (75.8%) | 0 (0.0%) |
Disability Class: Ambulatory Difficulty
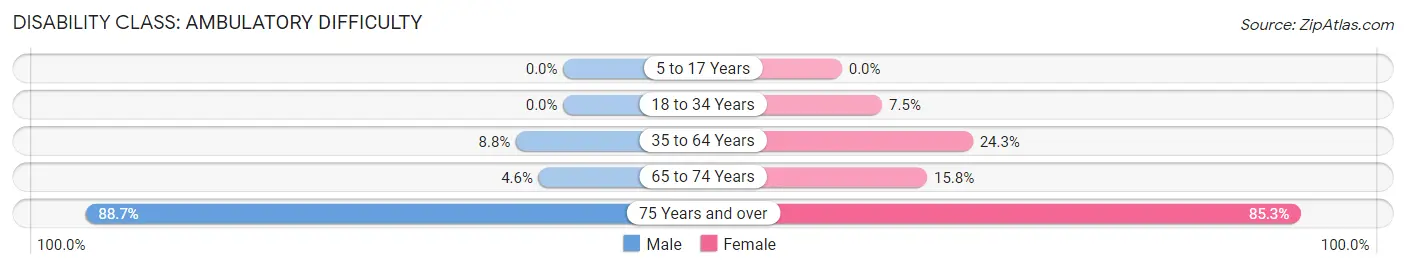
| Age Bracket | Male | Female |
| 5 to 17 Years | 0 (0.0%) | 0 (0.0%) |
| 18 to 34 Years | 0 (0.0%) | 35 (7.5%) |
| 35 to 64 Years | 43 (8.8%) | 174 (24.3%) |
| 65 to 74 Years | 5 (4.5%) | 19 (15.8%) |
| 75 Years and over | 55 (88.7%) | 52 (85.3%) |
Disability Class: Self-Care Difficulty
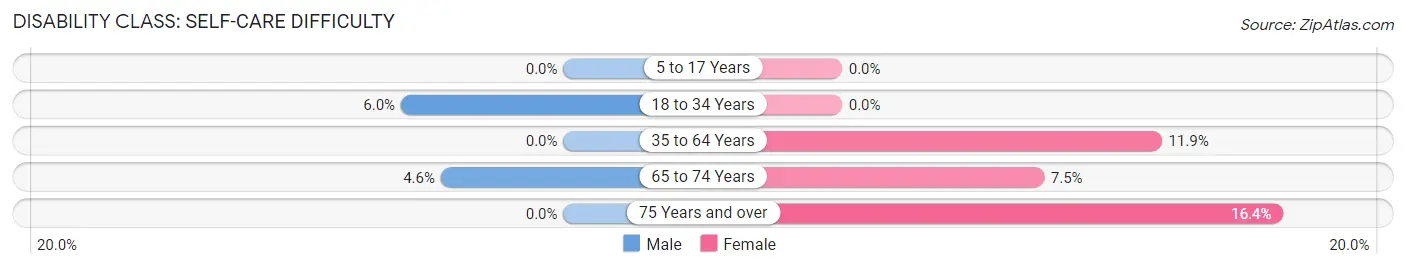
| Age Bracket | Male | Female |
| 5 to 17 Years | 0 (0.0%) | 0 (0.0%) |
| 18 to 34 Years | 24 (6.0%) | 0 (0.0%) |
| 35 to 64 Years | 0 (0.0%) | 85 (11.9%) |
| 65 to 74 Years | 5 (4.5%) | 9 (7.5%) |
| 75 Years and over | 0 (0.0%) | 10 (16.4%) |
Technology Access in Forks
Computing Device Access in Forks
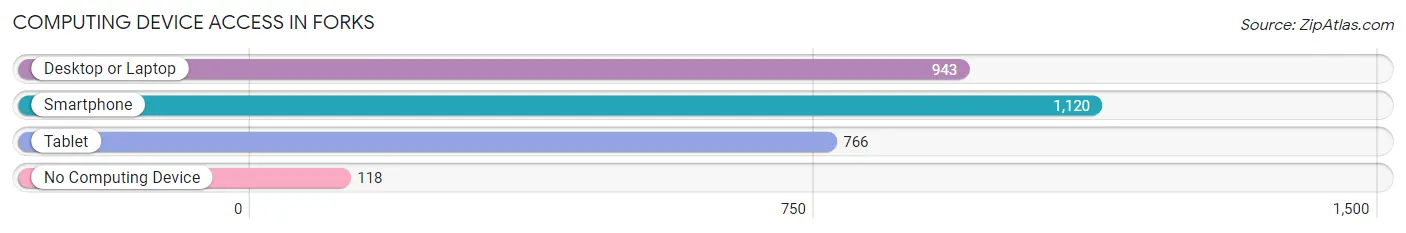
| Device Type | # Households | % Households |
| Desktop or Laptop | 943 | 72.4% |
| Smartphone | 1,120 | 86.0% |
| Tablet | 766 | 58.8% |
| No Computing Device | 118 | 9.1% |
| Total | 1,302 | 100.0% |
Internet Access in Forks
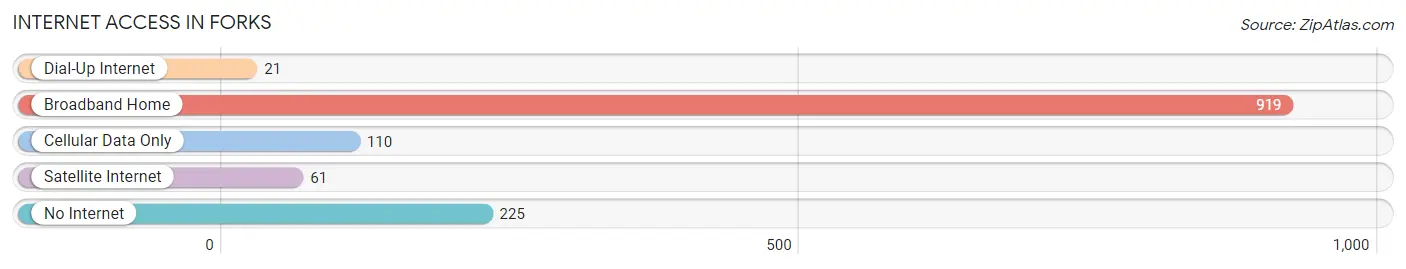
| Internet Type | # Households | % Households |
| Dial-Up Internet | 21 | 1.6% |
| Broadband Home | 919 | 70.6% |
| Cellular Data Only | 110 | 8.5% |
| Satellite Internet | 61 | 4.7% |
| No Internet | 225 | 17.3% |
| Total | 1,302 | 100.0% |
Forks Summary
Forks, Washington is a small city located in the northwest corner of the state, in Clallam County. It is situated on the banks of the Sol Duc River, and is surrounded by the Olympic National Forest. The city is known for its temperate rainforest climate, and its proximity to the Pacific Ocean.
History
Forks was first settled in the late 19th century by a group of loggers and homesteaders. The city was officially incorporated in 1945, and was named after the nearby forks of the Sol Duc River. The city was initially a logging town, and the timber industry was the main source of employment for many years. In the 1950s, the city began to diversify its economy, and tourism began to play an increasingly important role.
Geography
Forks is located in the northwest corner of Washington State, in Clallam County. It is situated on the banks of the Sol Duc River, and is surrounded by the Olympic National Forest. The city is located at the junction of US Highway 101 and State Route 110. The city has a total area of 4.2 square miles, and is located at an elevation of approximately 500 feet.
Climate
Forks has a temperate rainforest climate, with mild temperatures year-round. The average high temperature in the summer is around 70 degrees Fahrenheit, and the average low temperature in the winter is around 40 degrees Fahrenheit. The city receives an average of 80 inches of precipitation per year, with most of it falling in the winter months.
Economy
Forks has a diverse economy, with the timber industry, tourism, and retail being the main sources of employment. The timber industry is still an important part of the local economy, and the city is home to several sawmills and lumber companies. Tourism is also an important part of the local economy, with visitors coming to the area to enjoy the temperate rainforest climate and the nearby Olympic National Park. Retail is also an important part of the local economy, with several stores and restaurants located in the city.
Demographics
As of the 2010 census, the population of Forks was 3,532. The population is predominantly white (90.2%), with a small Hispanic population (4.2%). The median household income is $37,917, and the median age is 41. The city has a high rate of poverty, with 22.2% of the population living below the poverty line.
Conclusion
Forks, Washington is a small city located in the northwest corner of the state, in Clallam County. It is known for its temperate rainforest climate, and its proximity to the Pacific Ocean. The city has a diverse economy, with the timber industry, tourism, and retail being the main sources of employment. The population is predominantly white, with a small Hispanic population. The median household income is $37,917, and the median age is 41. The city has a high rate of poverty, with 22.2% of the population living below the poverty line.
Common Questions
What is Per Capita Income in Forks?
Per Capita income in Forks is $25,564.
What is the Median Family Income in Forks?
Median Family Income in Forks is $48,549.
What is the Median Household income in Forks?
Median Household Income in Forks is $42,080.
What is Income or Wage Gap in Forks?
Income or Wage Gap in Forks is 38.7%.
Women in Forks earn 61.3 cents for every dollar earned by a man.
What is Inequality or Gini Index in Forks?
Inequality or Gini Index in Forks is 0.45.
What is the Total Population of Forks?
Total Population of Forks is 3,380.
What is the Total Male Population of Forks?
Total Male Population of Forks is 1,516.
What is the Total Female Population of Forks?
Total Female Population of Forks is 1,864.
What is the Ratio of Males per 100 Females in Forks?
There are 81.33 Males per 100 Females in Forks.
What is the Ratio of Females per 100 Males in Forks?
There are 122.96 Females per 100 Males in Forks.
What is the Median Population Age in Forks?
Median Population Age in Forks is 33.9 Years.
What is the Average Family Size in Forks
Average Family Size in Forks is 3.2 People.
What is the Average Household Size in Forks
Average Household Size in Forks is 2.5 People.
How Large is the Labor Force in Forks?
There are 1,665 People in the Labor Forcein in Forks.
What is the Percentage of People in the Labor Force in Forks?
63.1% of People are in the Labor Force in Forks.
What is the Unemployment Rate in Forks?
Unemployment Rate in Forks is 8.0%.