Ocean Park, WA Map & Demographics
Ocean Park Map
Ocean Park Overview
$37,221
PER CAPITA INCOME
$92,672
AVG FAMILY INCOME
$48,945
AVG HOUSEHOLD INCOME
7.7%
WAGE / INCOME GAP [ % ]
92.3¢/ $1
WAGE / INCOME GAP [ $ ]
0.46
INEQUALITY / GINI INDEX
1,906
TOTAL POPULATION
1,015
MALE POPULATION
891
FEMALE POPULATION
113.92
MALES / 100 FEMALES
87.78
FEMALES / 100 MALES
64.0
MEDIAN AGE
2.3
AVG FAMILY SIZE
1.9
AVG HOUSEHOLD SIZE
656
LABOR FORCE [ PEOPLE ]
36.3%
PERCENT IN LABOR FORCE
8.2%
UNEMPLOYMENT RATE
Ocean Park Zip Codes
Ocean Park Area Codes
Income in Ocean Park
Income Overview in Ocean Park
Per Capita Income in Ocean Park is $37,221, while median incomes of families and households are $92,672 and $48,945 respectively.
| Characteristic | Number | Measure |
| Per Capita Income | 1,906 | $37,221 |
| Median Family Income | 605 | $92,672 |
| Mean Family Income | 605 | $80,275 |
| Median Household Income | 1,019 | $48,945 |
| Mean Household Income | 1,019 | $69,474 |
| Income Deficit | 605 | $0 |
| Wage / Income Gap (%) | 1,906 | 7.73% |
| Wage / Income Gap ($) | 1,906 | 92.27¢ per $1 |
| Gini / Inequality Index | 1,906 | 0.46 |
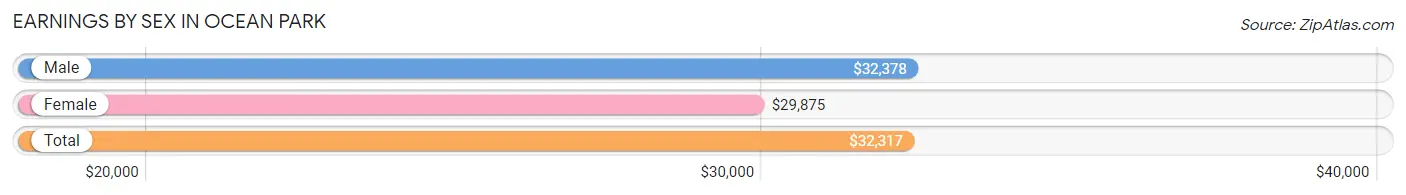
Earnings by Sex in Ocean Park
Average Earnings in Ocean Park are $32,317, $32,378 for men and $29,875 for women, a difference of 7.7%.
| Sex | Number | Average Earnings |
| Male | 456 (60.3%) | $32,378 |
| Female | 300 (39.7%) | $29,875 |
| Total | 756 (100.0%) | $32,317 |
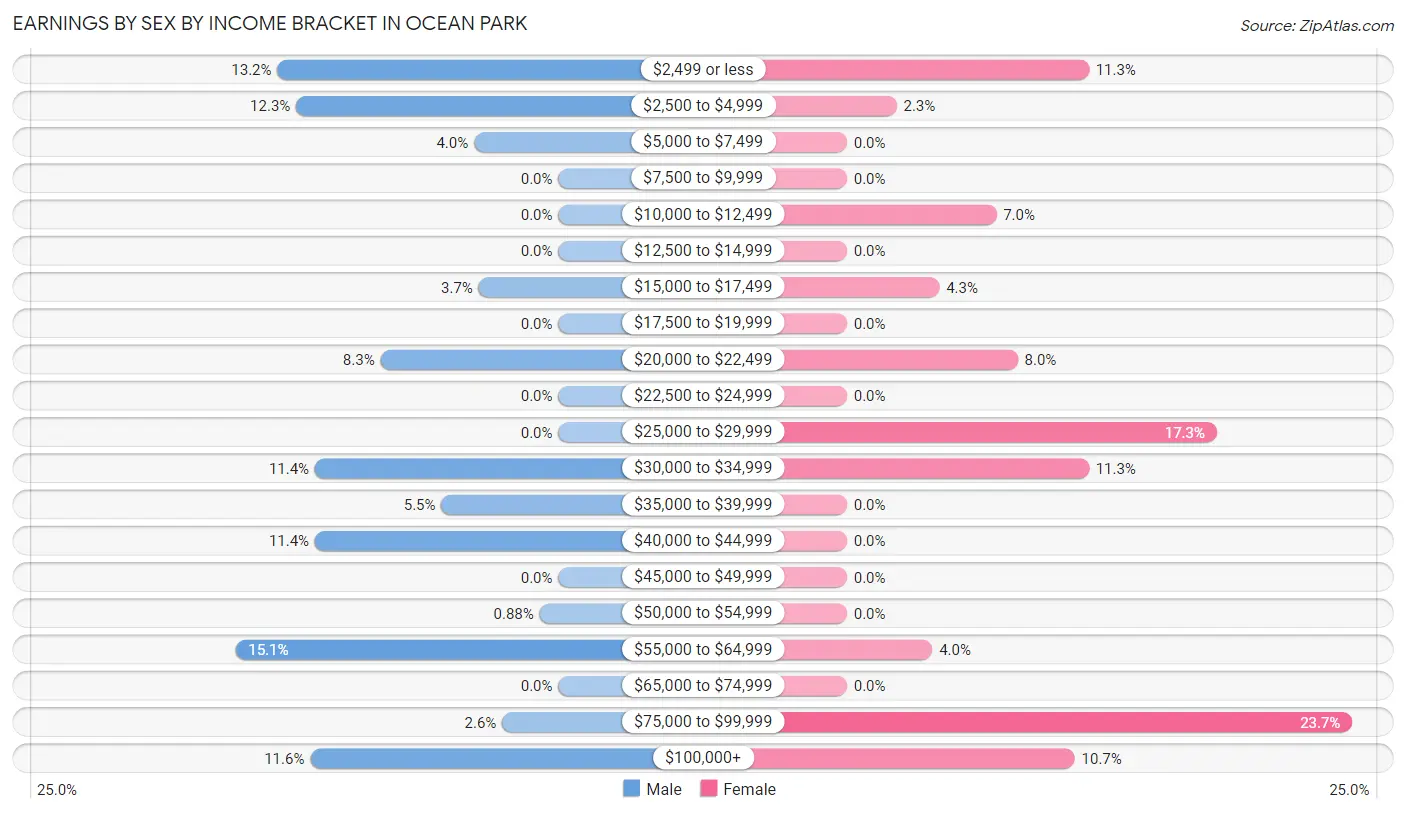
Earnings by Sex by Income Bracket in Ocean Park
The most common earnings brackets in Ocean Park are $55,000 to $64,999 for men (69 | 15.1%) and $75,000 to $99,999 for women (71 | 23.7%).
| Income | Male | Female |
| $2,499 or less | 60 (13.2%) | 34 (11.3%) |
| $2,500 to $4,999 | 56 (12.3%) | 7 (2.3%) |
| $5,000 to $7,499 | 18 (4.0%) | 0 (0.0%) |
| $7,500 to $9,999 | 0 (0.0%) | 0 (0.0%) |
| $10,000 to $12,499 | 0 (0.0%) | 21 (7.0%) |
| $12,500 to $14,999 | 0 (0.0%) | 0 (0.0%) |
| $15,000 to $17,499 | 17 (3.7%) | 13 (4.3%) |
| $17,500 to $19,999 | 0 (0.0%) | 0 (0.0%) |
| $20,000 to $22,499 | 38 (8.3%) | 24 (8.0%) |
| $22,500 to $24,999 | 0 (0.0%) | 0 (0.0%) |
| $25,000 to $29,999 | 0 (0.0%) | 52 (17.3%) |
| $30,000 to $34,999 | 52 (11.4%) | 34 (11.3%) |
| $35,000 to $39,999 | 25 (5.5%) | 0 (0.0%) |
| $40,000 to $44,999 | 52 (11.4%) | 0 (0.0%) |
| $45,000 to $49,999 | 0 (0.0%) | 0 (0.0%) |
| $50,000 to $54,999 | 4 (0.9%) | 0 (0.0%) |
| $55,000 to $64,999 | 69 (15.1%) | 12 (4.0%) |
| $65,000 to $74,999 | 0 (0.0%) | 0 (0.0%) |
| $75,000 to $99,999 | 12 (2.6%) | 71 (23.7%) |
| $100,000+ | 53 (11.6%) | 32 (10.7%) |
| Total | 456 (100.0%) | 300 (100.0%) |
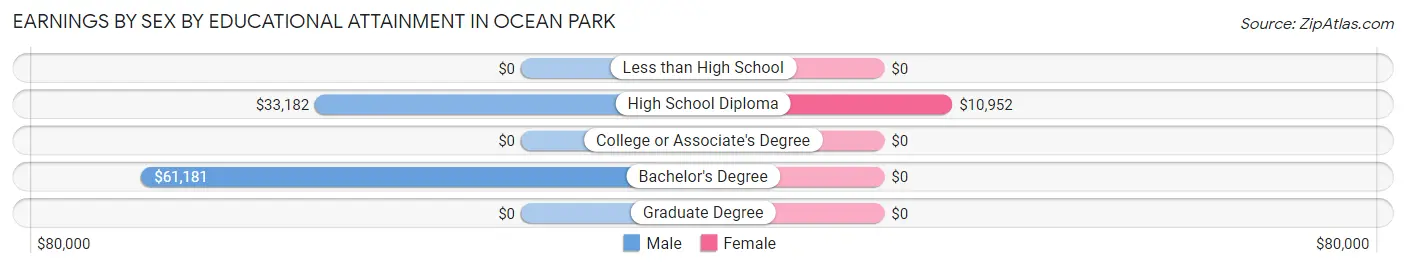
Earnings by Sex by Educational Attainment in Ocean Park
Average earnings in Ocean Park are $36,700 for men and $32,831 for women, a difference of 10.5%. Men with an educational attainment of bachelor's degree enjoy the highest average annual earnings of $61,181, while those with high school diploma education earn the least with $33,182. Women with an educational attainment of high school diploma earn the most with the average annual earnings of $10,952, while those with high school diploma education have the smallest earnings of $10,952.
| Educational Attainment | Male Income | Female Income |
| Less than High School | - | - |
| High School Diploma | $33,182 | $10,952 |
| College or Associate's Degree | - | - |
| Bachelor's Degree | $61,181 | $0 |
| Graduate Degree | - | - |
| Total | $36,700 | $32,831 |
Family Income in Ocean Park
Family Income Brackets in Ocean Park
According to the Ocean Park family income data, there are 246 families falling into the $100,000 to $149,999 income range, which is the most common income bracket and makes up 40.7% of all families.
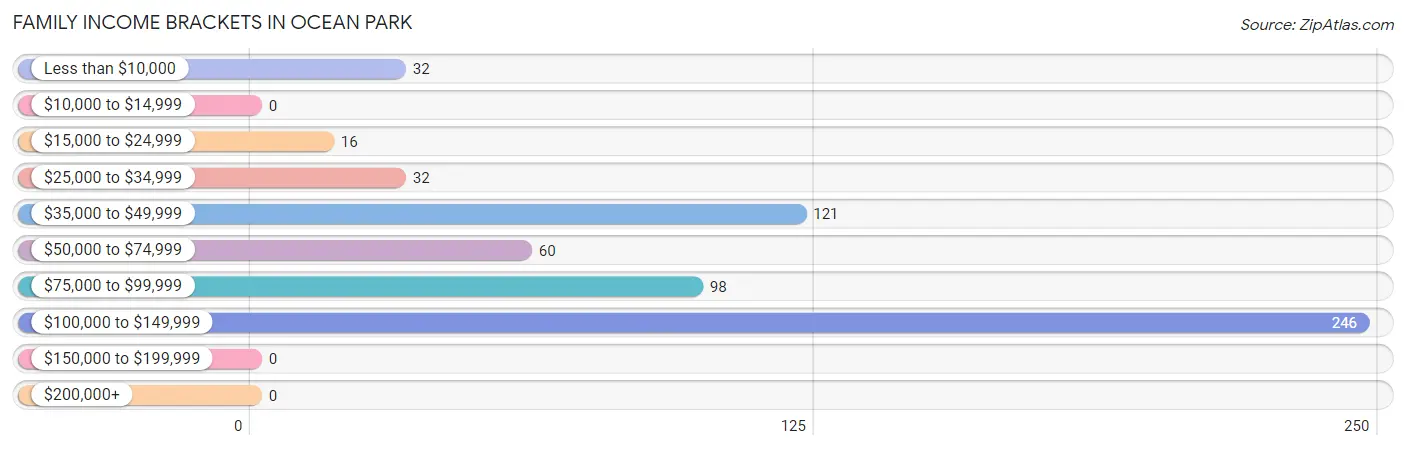
| Income Bracket | # Families | % Families |
| Less than $10,000 | 32 | 5.3% |
| $10,000 to $14,999 | 0 | 0.0% |
| $15,000 to $24,999 | 16 | 2.6% |
| $25,000 to $34,999 | 32 | 5.3% |
| $35,000 to $49,999 | 121 | 20.0% |
| $50,000 to $74,999 | 60 | 9.9% |
| $75,000 to $99,999 | 98 | 16.2% |
| $100,000 to $149,999 | 246 | 40.7% |
| $150,000 to $199,999 | 0 | 0.0% |
| $200,000+ | 0 | 0.0% |
Family Income by Famaliy Size in Ocean Park
3-person families (60 | 9.9%) account for the highest median family income in Ocean Park with $117,188 per family, while 3-person families (60 | 9.9%) have the highest median income of $39,063 per family member.
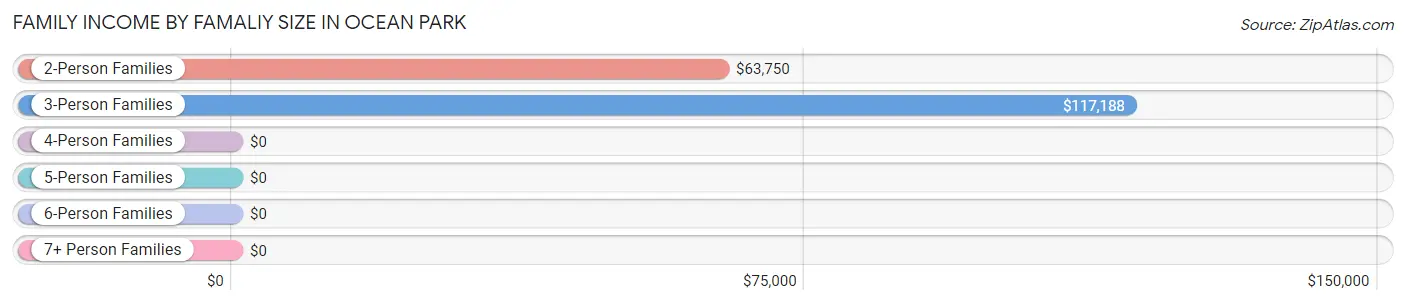
| Income Bracket | # Families | Median Income |
| 2-Person Families | 488 (80.7%) | $63,750 |
| 3-Person Families | 60 (9.9%) | $117,188 |
| 4-Person Families | 0 (0.0%) | $0 |
| 5-Person Families | 6 (1.0%) | $0 |
| 6-Person Families | 51 (8.4%) | $0 |
| 7+ Person Families | 0 (0.0%) | $0 |
| Total | 605 (100.0%) | $92,672 |
Family Income by Number of Earners in Ocean Park
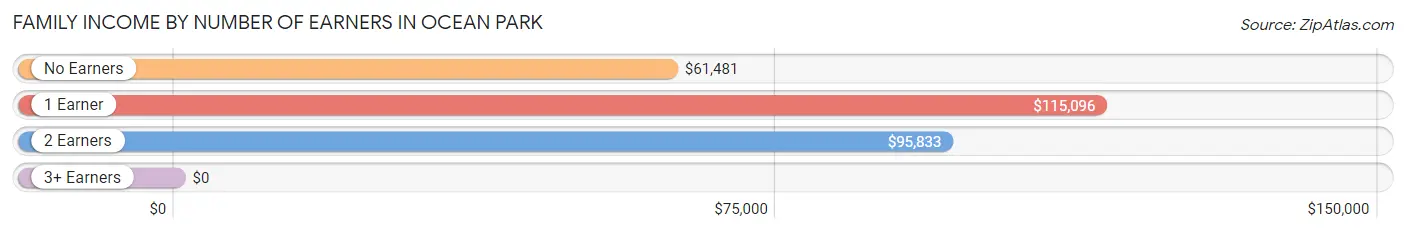
| Number of Earners | # Families | Median Income |
| No Earners | 200 (33.1%) | $61,481 |
| 1 Earner | 246 (40.7%) | $115,096 |
| 2 Earners | 108 (17.8%) | $95,833 |
| 3+ Earners | 51 (8.4%) | $0 |
| Total | 605 (100.0%) | $92,672 |
Household Income in Ocean Park
Household Income Brackets in Ocean Park
With 251 households falling in the category, the $100,000 to $149,999 income range is the most frequent in Ocean Park, accounting for 24.6% of all households.
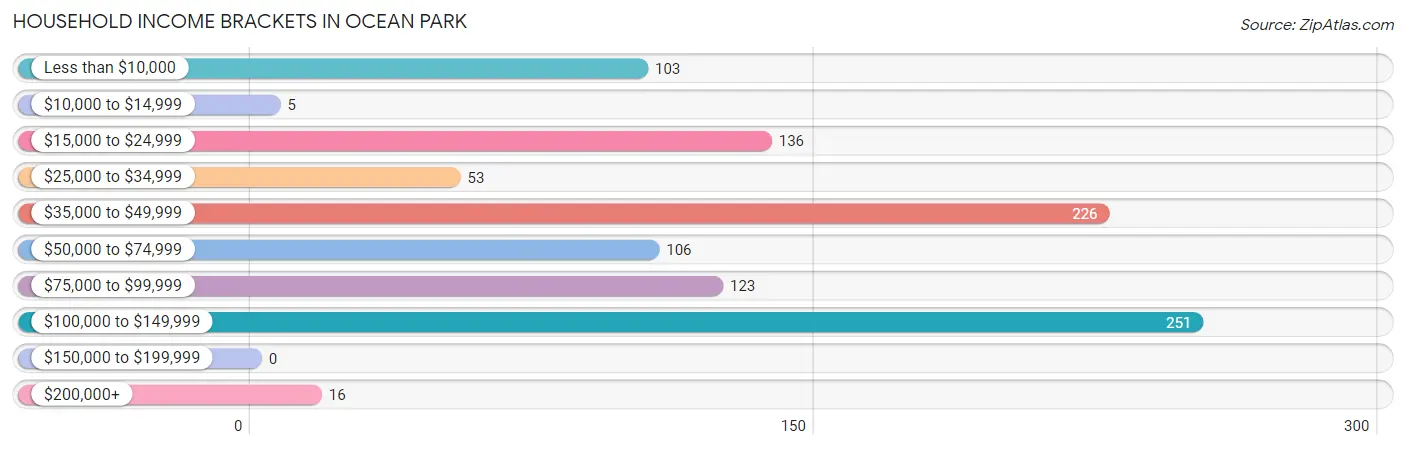
| Income Bracket | # Households | % Households |
| Less than $10,000 | 103 | 10.1% |
| $10,000 to $14,999 | 5 | 0.5% |
| $15,000 to $24,999 | 136 | 13.3% |
| $25,000 to $34,999 | 53 | 5.2% |
| $35,000 to $49,999 | 226 | 22.2% |
| $50,000 to $74,999 | 106 | 10.4% |
| $75,000 to $99,999 | 123 | 12.1% |
| $100,000 to $149,999 | 251 | 24.6% |
| $150,000 to $199,999 | 0 | 0.0% |
| $200,000+ | 16 | 1.6% |
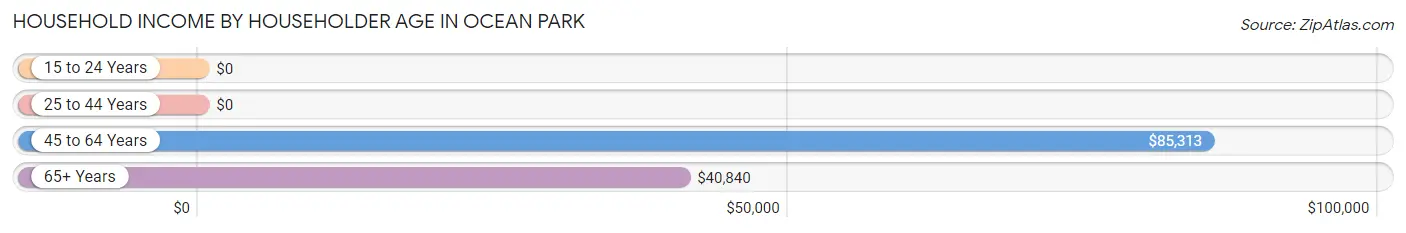
Household Income by Householder Age in Ocean Park
The median household income in Ocean Park is $48,945, with the highest median household income of $85,313 found in the 45 to 64 years age bracket for the primary householder. A total of 379 households (37.2%) fall into this category. Meanwhile, the 15 to 24 years age bracket for the primary householder has the lowest median household income of $0, with 28 households (2.8%) in this group.
| Income Bracket | # Households | Median Income |
| 15 to 24 Years | 28 (2.8%) | $0 |
| 25 to 44 Years | 71 (7.0%) | $0 |
| 45 to 64 Years | 379 (37.2%) | $85,313 |
| 65+ Years | 541 (53.1%) | $40,840 |
| Total | 1,019 (100.0%) | $48,945 |
Poverty in Ocean Park
Income Below Poverty by Sex and Age in Ocean Park
With 11.4% poverty level for males and 10.0% for females among the residents of Ocean Park, 18 to 24 year old males and 75 year old and over females are the most vulnerable to poverty, with 28 males (46.7%) and 43 females (37.1%) in their respective age groups living below the poverty level.
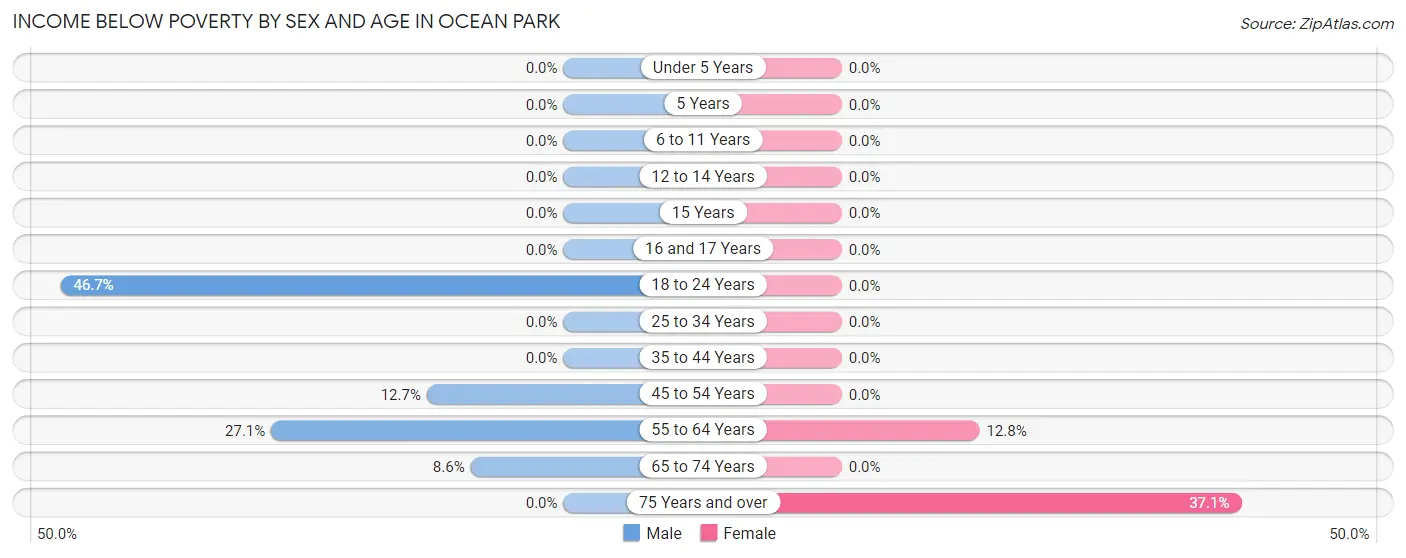
| Age Bracket | Male | Female |
| Under 5 Years | 0 (0.0%) | 0 (0.0%) |
| 5 Years | 0 (0.0%) | 0 (0.0%) |
| 6 to 11 Years | 0 (0.0%) | 0 (0.0%) |
| 12 to 14 Years | 0 (0.0%) | 0 (0.0%) |
| 15 Years | 0 (0.0%) | 0 (0.0%) |
| 16 and 17 Years | 0 (0.0%) | 0 (0.0%) |
| 18 to 24 Years | 28 (46.7%) | 0 (0.0%) |
| 25 to 34 Years | 0 (0.0%) | 0 (0.0%) |
| 35 to 44 Years | 0 (0.0%) | 0 (0.0%) |
| 45 to 54 Years | 18 (12.7%) | 0 (0.0%) |
| 55 to 64 Years | 32 (27.1%) | 46 (12.8%) |
| 65 to 74 Years | 38 (8.6%) | 0 (0.0%) |
| 75 Years and over | 0 (0.0%) | 43 (37.1%) |
| Total | 116 (11.4%) | 89 (10.0%) |
Income Above Poverty by Sex and Age in Ocean Park
According to the poverty statistics in Ocean Park, males aged 6 to 11 years and females aged under 5 years are the age groups that are most secure financially, with 100.0% of males and 100.0% of females in these age groups living above the poverty line.
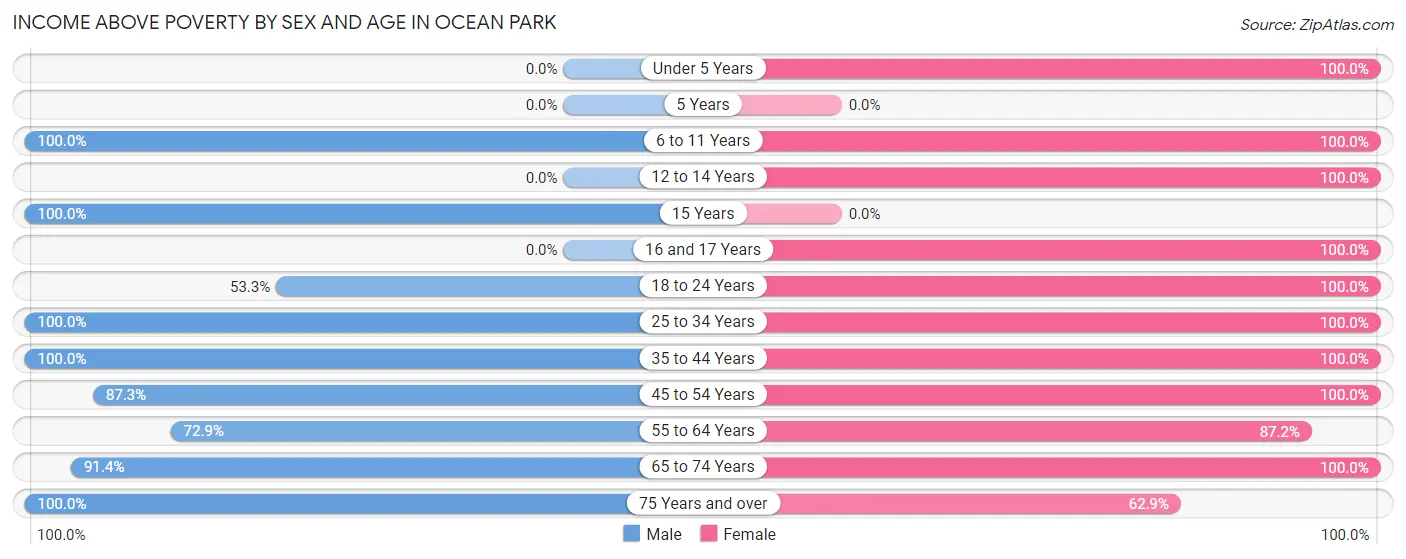
| Age Bracket | Male | Female |
| Under 5 Years | 0 (0.0%) | 9 (100.0%) |
| 5 Years | 0 (0.0%) | 0 (0.0%) |
| 6 to 11 Years | 15 (100.0%) | 20 (100.0%) |
| 12 to 14 Years | 0 (0.0%) | 34 (100.0%) |
| 15 Years | 22 (100.0%) | 0 (0.0%) |
| 16 and 17 Years | 0 (0.0%) | 8 (100.0%) |
| 18 to 24 Years | 32 (53.3%) | 18 (100.0%) |
| 25 to 34 Years | 74 (100.0%) | 11 (100.0%) |
| 35 to 44 Years | 30 (100.0%) | 67 (100.0%) |
| 45 to 54 Years | 124 (87.3%) | 61 (100.0%) |
| 55 to 64 Years | 86 (72.9%) | 314 (87.2%) |
| 65 to 74 Years | 403 (91.4%) | 187 (100.0%) |
| 75 Years and over | 113 (100.0%) | 73 (62.9%) |
| Total | 899 (88.6%) | 802 (90.0%) |
Income Below Poverty Among Married-Couple Families in Ocean Park
The poverty statistics for married-couple families in Ocean Park show that 8.8% or 48 of the total 546 families live below the poverty line. Families with no children have the highest poverty rate of 10.3%, comprising of 48 families. On the other hand, families with 1 or 2 children have the lowest poverty rate of 0.0%, which includes 0 families.
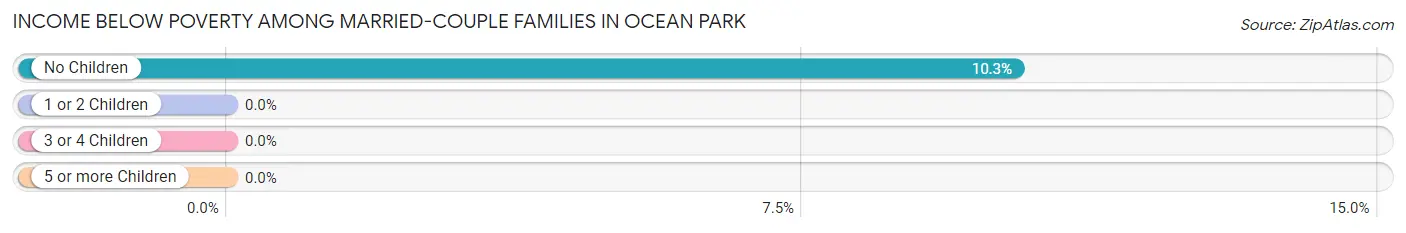
| Children | Above Poverty | Below Poverty |
| No Children | 420 (89.7%) | 48 (10.3%) |
| 1 or 2 Children | 78 (100.0%) | 0 (0.0%) |
| 3 or 4 Children | 0 (0.0%) | 0 (0.0%) |
| 5 or more Children | 0 (0.0%) | 0 (0.0%) |
| Total | 498 (91.2%) | 48 (8.8%) |
Income Below Poverty Among Single-Parent Households in Ocean Park
| Children | Single Father | Single Mother |
| No Children | 0 (0.0%) | 0 (0.0%) |
| 1 or 2 Children | 0 (0.0%) | 0 (0.0%) |
| 3 or 4 Children | 0 (0.0%) | 0 (0.0%) |
| 5 or more Children | 0 (0.0%) | 0 (0.0%) |
| Total | 0 (0.0%) | 0 (0.0%) |
Income Below Poverty Among Married-Couple vs Single-Parent Households in Ocean Park
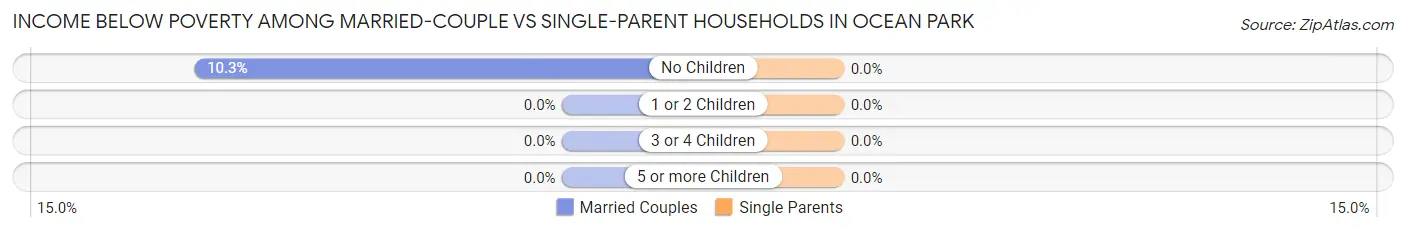
| Children | Married-Couple Families | Single-Parent Households |
| No Children | 48 (10.3%) | 0 (0.0%) |
| 1 or 2 Children | 0 (0.0%) | 0 (0.0%) |
| 3 or 4 Children | 0 (0.0%) | 0 (0.0%) |
| 5 or more Children | 0 (0.0%) | 0 (0.0%) |
| Total | 48 (8.8%) | 0 (0.0%) |
Race in Ocean Park
The most populous races in Ocean Park are White / Caucasian (1,550 | 81.3%), Hispanic or Latino (217 | 11.4%), and Some other Race (199 | 10.4%).
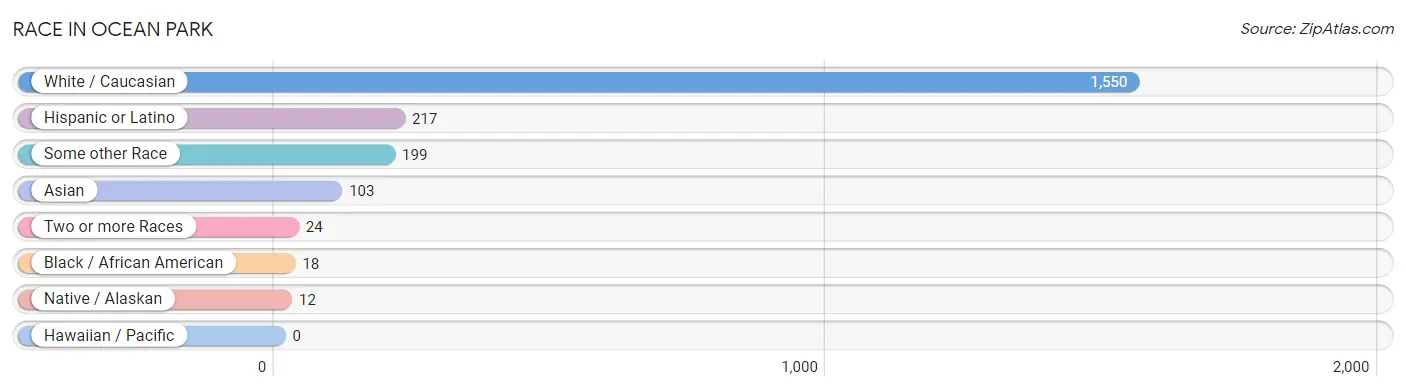
| Race | # Population | % Population |
| Asian | 103 | 5.4% |
| Black / African American | 18 | 0.9% |
| Hawaiian / Pacific | 0 | 0.0% |
| Hispanic or Latino | 217 | 11.4% |
| Native / Alaskan | 12 | 0.6% |
| White / Caucasian | 1,550 | 81.3% |
| Two or more Races | 24 | 1.3% |
| Some other Race | 199 | 10.4% |
| Total | 1,906 | 100.0% |
Ancestry in Ocean Park
The most populous ancestries reported in Ocean Park are German (483 | 25.3%), English (267 | 14.0%), Mexican (199 | 10.4%), Irish (159 | 8.3%), and Norwegian (133 | 7.0%), together accounting for 65.1% of all Ocean Park residents.
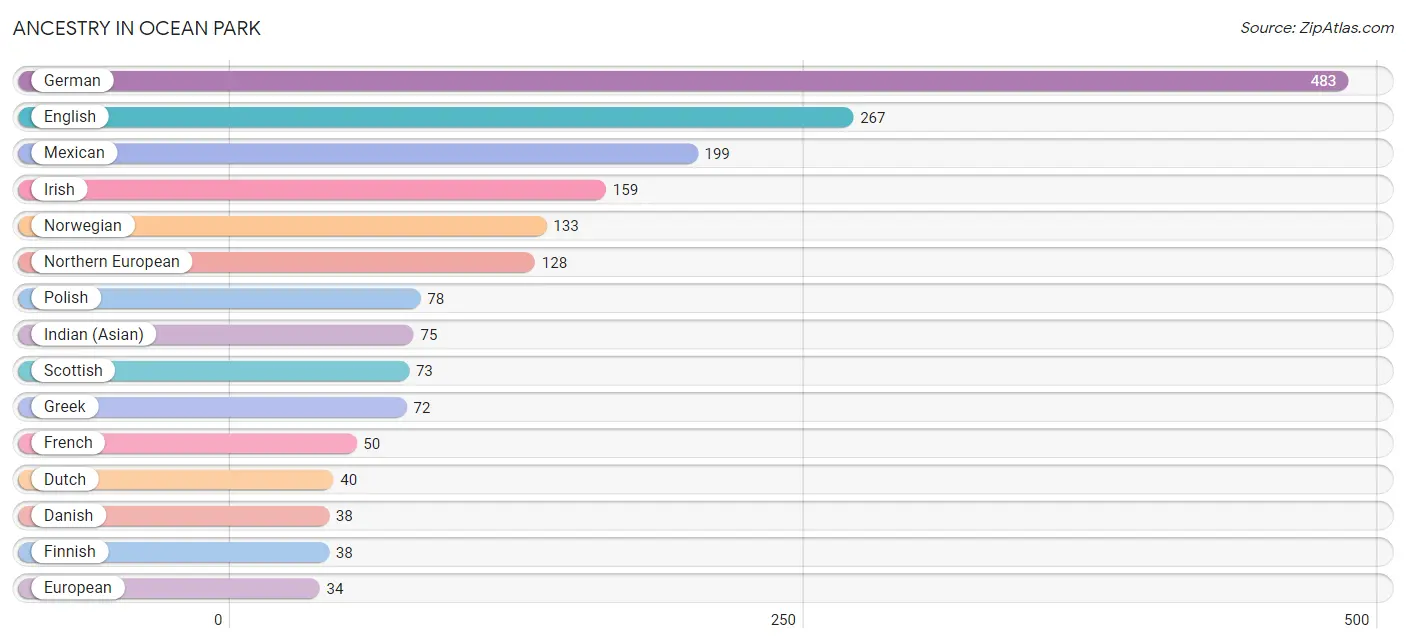
| Ancestry | # Population | % Population |
| Bhutanese | 19 | 1.0% |
| British | 20 | 1.1% |
| Choctaw | 11 | 0.6% |
| Danish | 38 | 2.0% |
| Dutch | 40 | 2.1% |
| English | 267 | 14.0% |
| European | 34 | 1.8% |
| Finnish | 38 | 2.0% |
| French | 50 | 2.6% |
| German | 483 | 25.3% |
| Greek | 72 | 3.8% |
| Indian (Asian) | 75 | 3.9% |
| Irish | 159 | 8.3% |
| Italian | 22 | 1.1% |
| Lithuanian | 33 | 1.7% |
| Mexican | 199 | 10.4% |
| Northern European | 128 | 6.7% |
| Norwegian | 133 | 7.0% |
| Polish | 78 | 4.1% |
| Puerto Rican | 18 | 0.9% |
| Scotch-Irish | 17 | 0.9% |
| Scottish | 73 | 3.8% |
| Swedish | 17 | 0.9% |
| Swiss | 12 | 0.6% |
| Thai | 28 | 1.5% | View All 25 Rows |
Immigrants in Ocean Park
The most numerous immigrant groups reported in Ocean Park came from Central America (160 | 8.4%), Latin America (160 | 8.4%), Mexico (160 | 8.4%), Asia (103 | 5.4%), and China (75 | 3.9%), together accounting for 34.5% of all Ocean Park residents.
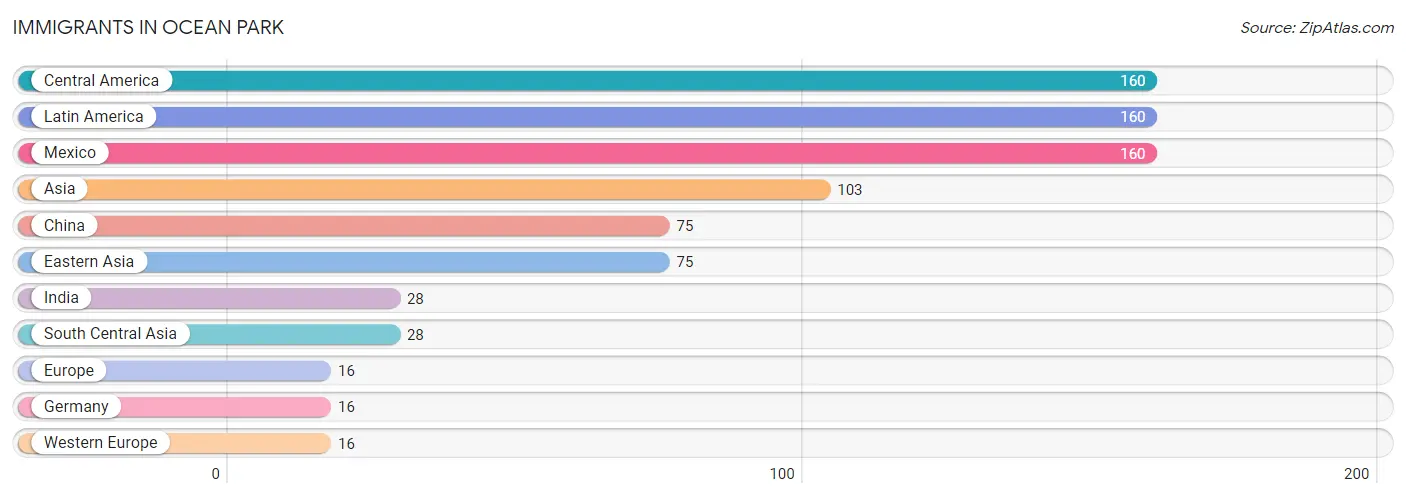
| Immigration Origin | # Population | % Population |
| Asia | 103 | 5.4% |
| Central America | 160 | 8.4% |
| China | 75 | 3.9% |
| Eastern Asia | 75 | 3.9% |
| Europe | 16 | 0.8% |
| Germany | 16 | 0.8% |
| India | 28 | 1.5% |
| Latin America | 160 | 8.4% |
| Mexico | 160 | 8.4% |
| South Central Asia | 28 | 1.5% |
| Western Europe | 16 | 0.8% | View All 11 Rows |
Sex and Age in Ocean Park
Sex and Age in Ocean Park
The most populous age groups in Ocean Park are 65 to 69 Years (271 | 26.7%) for men and 60 to 64 Years (186 | 20.9%) for women.
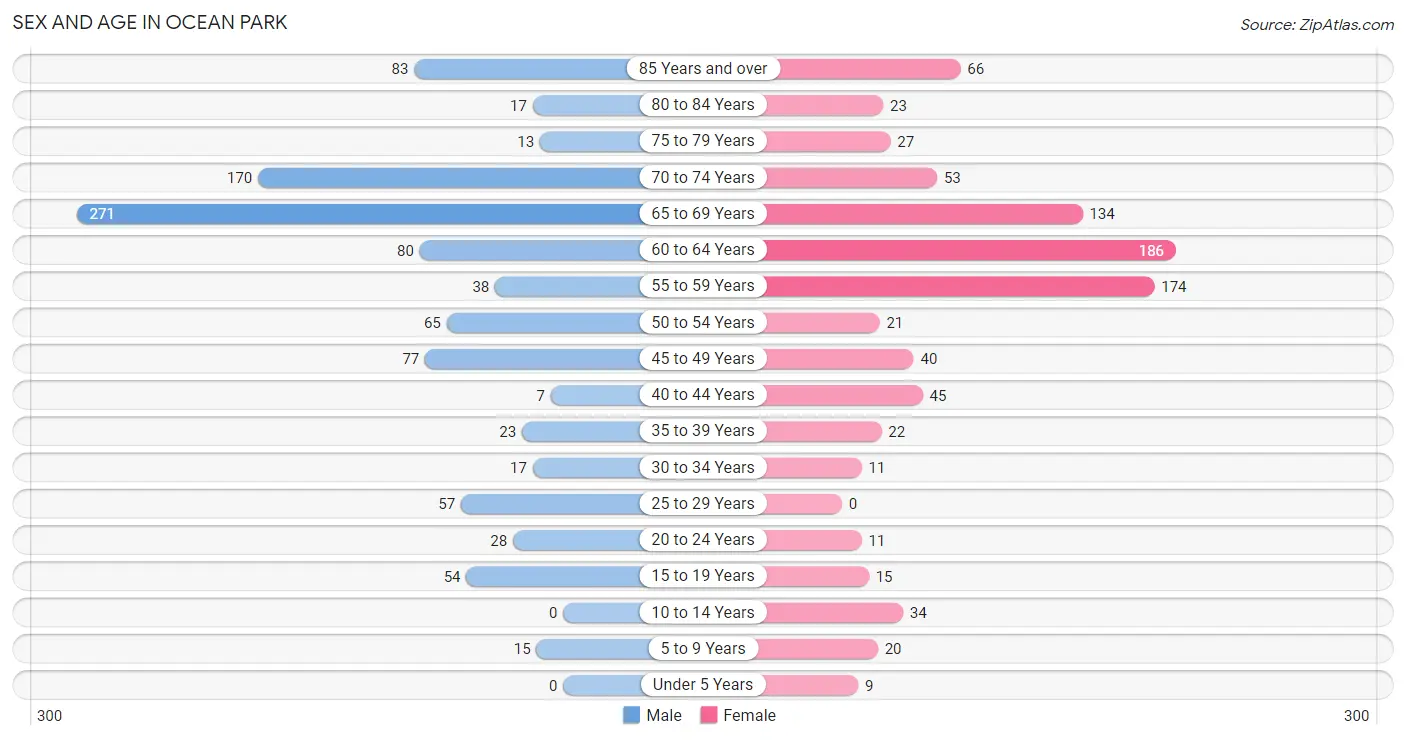
| Age Bracket | Male | Female |
| Under 5 Years | 0 (0.0%) | 9 (1.0%) |
| 5 to 9 Years | 15 (1.5%) | 20 (2.2%) |
| 10 to 14 Years | 0 (0.0%) | 34 (3.8%) |
| 15 to 19 Years | 54 (5.3%) | 15 (1.7%) |
| 20 to 24 Years | 28 (2.8%) | 11 (1.2%) |
| 25 to 29 Years | 57 (5.6%) | 0 (0.0%) |
| 30 to 34 Years | 17 (1.7%) | 11 (1.2%) |
| 35 to 39 Years | 23 (2.3%) | 22 (2.5%) |
| 40 to 44 Years | 7 (0.7%) | 45 (5.1%) |
| 45 to 49 Years | 77 (7.6%) | 40 (4.5%) |
| 50 to 54 Years | 65 (6.4%) | 21 (2.4%) |
| 55 to 59 Years | 38 (3.7%) | 174 (19.5%) |
| 60 to 64 Years | 80 (7.9%) | 186 (20.9%) |
| 65 to 69 Years | 271 (26.7%) | 134 (15.0%) |
| 70 to 74 Years | 170 (16.8%) | 53 (5.9%) |
| 75 to 79 Years | 13 (1.3%) | 27 (3.0%) |
| 80 to 84 Years | 17 (1.7%) | 23 (2.6%) |
| 85 Years and over | 83 (8.2%) | 66 (7.4%) |
| Total | 1,015 (100.0%) | 891 (100.0%) |
Families and Households in Ocean Park
Median Family Size in Ocean Park
The median family size in Ocean Park is 2.32 persons per family, with single male/father families (24 | 4.0%) accounting for the largest median family size of 2.54 persons per family. On the other hand, married-couple families (546 | 90.2%) represent the smallest median family size with 2.30 persons per family.
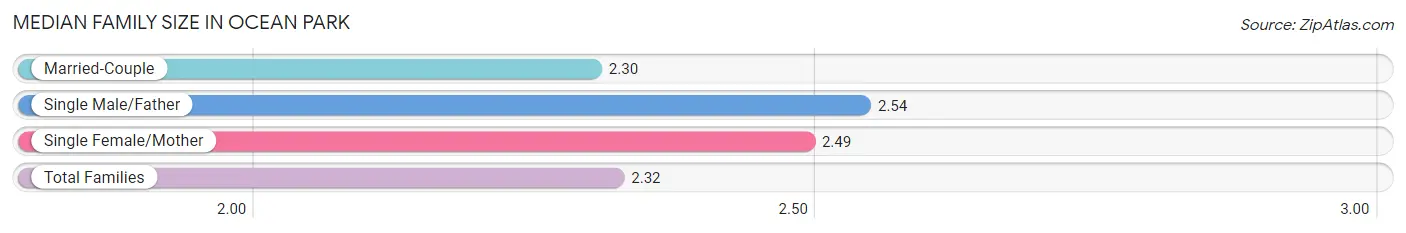
| Family Type | # Families | Family Size |
| Married-Couple | 546 (90.2%) | 2.30 |
| Single Male/Father | 24 (4.0%) | 2.54 |
| Single Female/Mother | 35 (5.8%) | 2.49 |
| Total Families | 605 (100.0%) | 2.32 |
Median Household Size in Ocean Park
The median household size in Ocean Park is 1.87 persons per household, with single female/mother households (35 | 3.4%) accounting for the largest median household size of 3 persons per household. non-family households (414 | 40.6%) represent the smallest median household size with 1.16 persons per household.
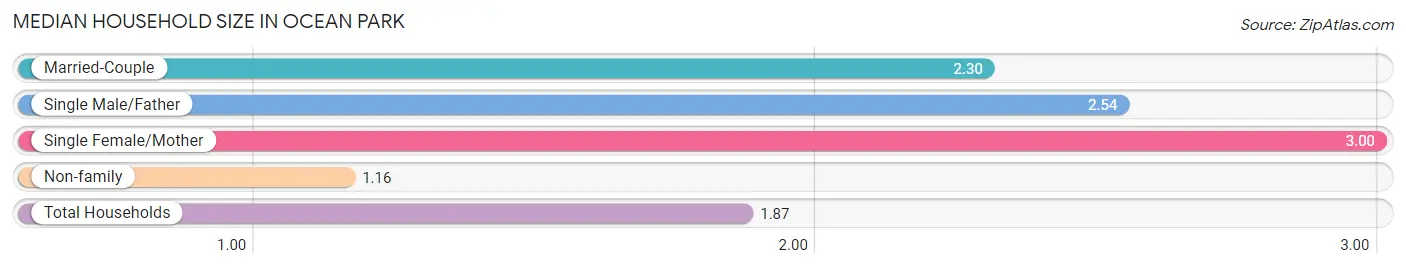
| Household Type | # Households | Household Size |
| Married-Couple | 546 (53.6%) | 2.30 |
| Single Male/Father | 24 (2.4%) | 2.54 |
| Single Female/Mother | 35 (3.4%) | 3.00 |
| Non-family | 414 (40.6%) | 1.16 |
| Total Households | 1,019 (100.0%) | 1.87 |
Household Size by Marriage Status in Ocean Park
Out of a total of 1,019 households in Ocean Park, 605 (59.4%) are family households, while 414 (40.6%) are nonfamily households. The most numerous type of family households are 2-person households, comprising 479, and the most common type of nonfamily households are 1-person households, comprising 367.
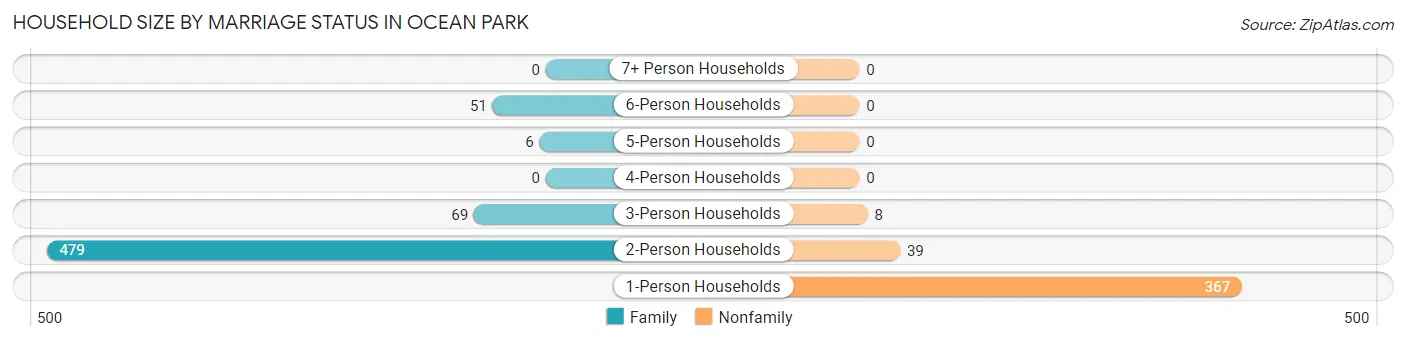
| Household Size | Family Households | Nonfamily Households |
| 1-Person Households | - | 367 (36.0%) |
| 2-Person Households | 479 (47.0%) | 39 (3.8%) |
| 3-Person Households | 69 (6.8%) | 8 (0.8%) |
| 4-Person Households | 0 (0.0%) | 0 (0.0%) |
| 5-Person Households | 6 (0.6%) | 0 (0.0%) |
| 6-Person Households | 51 (5.0%) | 0 (0.0%) |
| 7+ Person Households | 0 (0.0%) | 0 (0.0%) |
| Total | 605 (59.4%) | 414 (40.6%) |
Female Fertility in Ocean Park
Fertility by Age in Ocean Park
| Age Bracket | Women with Births | Births / 1,000 Women |
| 15 to 19 years | 0 (0.0%) | 0.0 |
| 20 to 34 years | 0 (0.0%) | 0.0 |
| 35 to 50 years | 0 (0.0%) | 0.0 |
| Total | 0 (0.0%) | 0.0 |
Fertility by Age by Marriage Status in Ocean Park
| Age Bracket | Married | Unmarried |
| 15 to 19 years | 0 (0.0%) | 0 (0.0%) |
| 20 to 34 years | 0 (0.0%) | 0 (0.0%) |
| 35 to 50 years | 0 (0.0%) | 0 (0.0%) |
| Total | 0 (0.0%) | 0 (0.0%) |
Fertility by Education in Ocean Park
| Educational Attainment | Women with Births | Births / 1,000 Women |
| Less than High School | 0 (0.0%) | 0.0 |
| High School Diploma | 0 (0.0%) | 0.0 |
| College or Associate's Degree | 0 (0.0%) | 0.0 |
| Bachelor's Degree | 0 (0.0%) | 0.0 |
| Graduate Degree | 0 (0.0%) | 0.0 |
| Total | 0 (0.0%) | 0.0 |
Fertility by Education by Marriage Status in Ocean Park
| Educational Attainment | Married | Unmarried |
| Less than High School | 0 (0.0%) | 0 (0.0%) |
| High School Diploma | 0 (0.0%) | 0 (0.0%) |
| College or Associate's Degree | 0 (0.0%) | 0 (0.0%) |
| Bachelor's Degree | 0 (0.0%) | 0 (0.0%) |
| Graduate Degree | 0 (0.0%) | 0 (0.0%) |
| Total | 0 (0.0%) | 0 (0.0%) |
Employment Characteristics in Ocean Park
Employment by Class of Employer in Ocean Park
Among the 585 employed individuals in Ocean Park, private company employees (407 | 69.6%), not-for-profit organizations (67 | 11.5%), and state government employees (46 | 7.9%) make up the most common classes of employment.
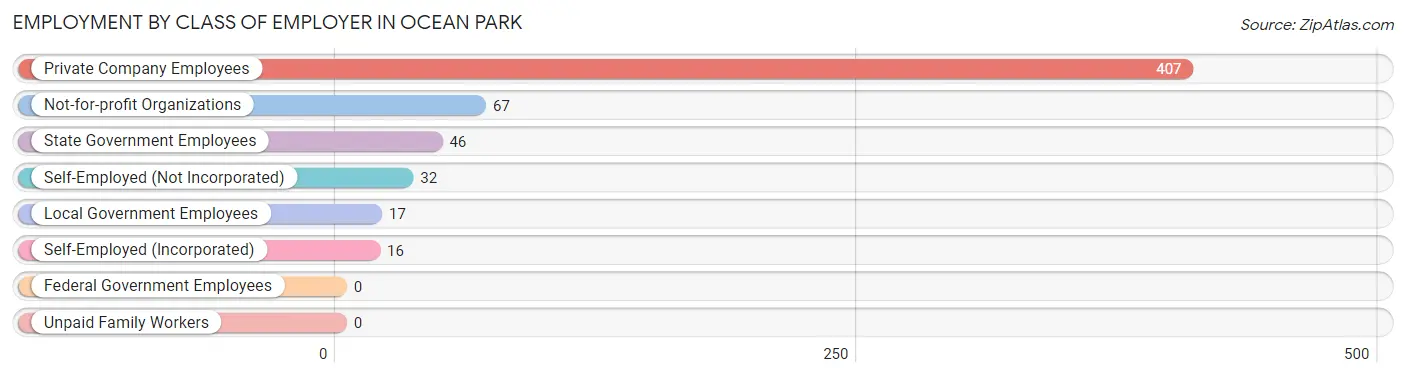
| Employer Class | # Employees | % Employees |
| Private Company Employees | 407 | 69.6% |
| Self-Employed (Incorporated) | 16 | 2.7% |
| Self-Employed (Not Incorporated) | 32 | 5.5% |
| Not-for-profit Organizations | 67 | 11.5% |
| Local Government Employees | 17 | 2.9% |
| State Government Employees | 46 | 7.9% |
| Federal Government Employees | 0 | 0.0% |
| Unpaid Family Workers | 0 | 0.0% |
| Total | 585 | 100.0% |
Employment Status by Age in Ocean Park
According to the labor force statistics for Ocean Park, out of the total population over 16 years of age (1,806), 36.3% or 656 individuals are in the labor force, with 8.2% or 54 of them unemployed. The age group with the highest labor force participation rate is 25 to 29 years, with 100.0% or 57 individuals in the labor force. Within the labor force, the 16 to 19 years age range has the highest percentage of unemployed individuals, with 100.0% or 32 of them being unemployed.
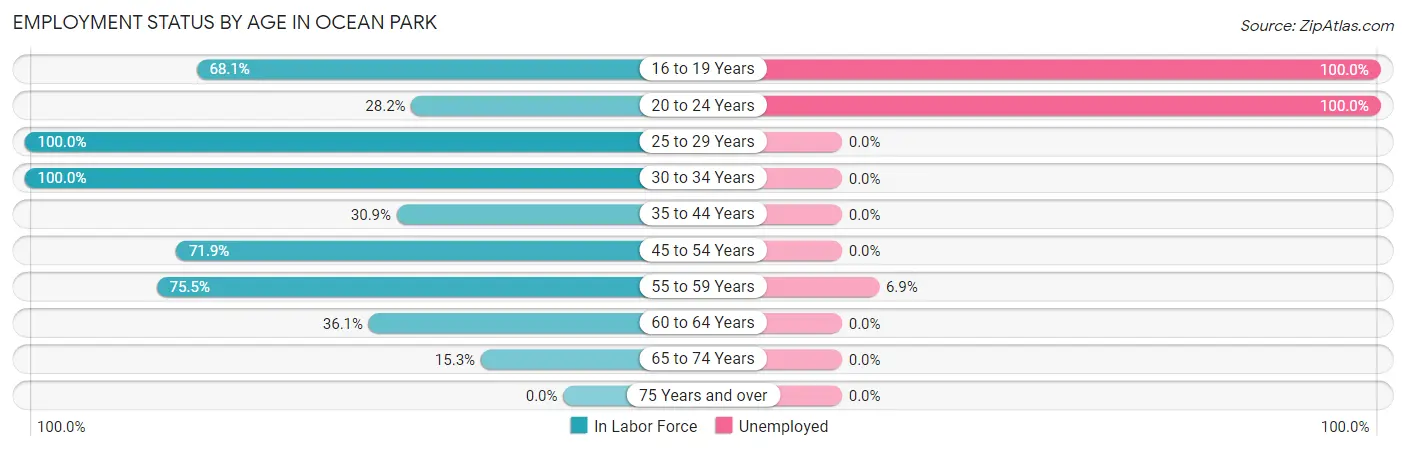
| Age Bracket | In Labor Force | Unemployed |
| 16 to 19 Years | 32 (68.1%) | 32 (100.0%) |
| 20 to 24 Years | 11 (28.2%) | 11 (100.0%) |
| 25 to 29 Years | 57 (100.0%) | 0 (0.0%) |
| 30 to 34 Years | 28 (100.0%) | 0 (0.0%) |
| 35 to 44 Years | 30 (30.9%) | 0 (0.0%) |
| 45 to 54 Years | 146 (71.9%) | 0 (0.0%) |
| 55 to 59 Years | 160 (75.5%) | 11 (6.9%) |
| 60 to 64 Years | 96 (36.1%) | 0 (0.0%) |
| 65 to 74 Years | 96 (15.3%) | 0 (0.0%) |
| 75 Years and over | 0 (0.0%) | 0 (0.0%) |
| Total | 656 (36.3%) | 54 (8.2%) |
Employment Status by Educational Attainment in Ocean Park
According to labor force statistics for Ocean Park, 59.9% of individuals (517) out of the total population between 25 and 64 years of age (863) are in the labor force, with 2.1% or 11 of them being unemployed. The group with the highest labor force participation rate are those with the educational attainment of high school diploma, with 77.8% or 144 individuals in the labor force. Within the labor force, individuals with college / associate degree education have the highest percentage of unemployment, with 3.9% or 11 of them being unemployed.
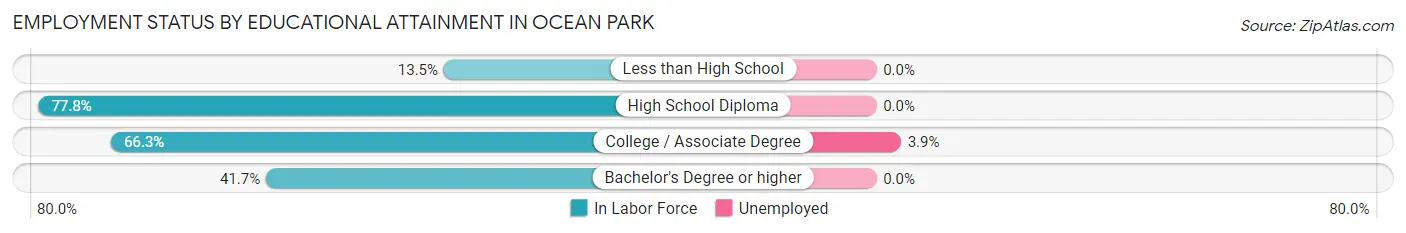
| Educational Attainment | In Labor Force | Unemployed |
| Less than High School | 7 (13.5%) | 0 (0.0%) |
| High School Diploma | 144 (77.8%) | 0 (0.0%) |
| College / Associate Degree | 283 (66.3%) | 17 (3.9%) |
| Bachelor's Degree or higher | 83 (41.7%) | 0 (0.0%) |
| Total | 517 (59.9%) | 18 (2.1%) |
Employment Occupations by Sex in Ocean Park
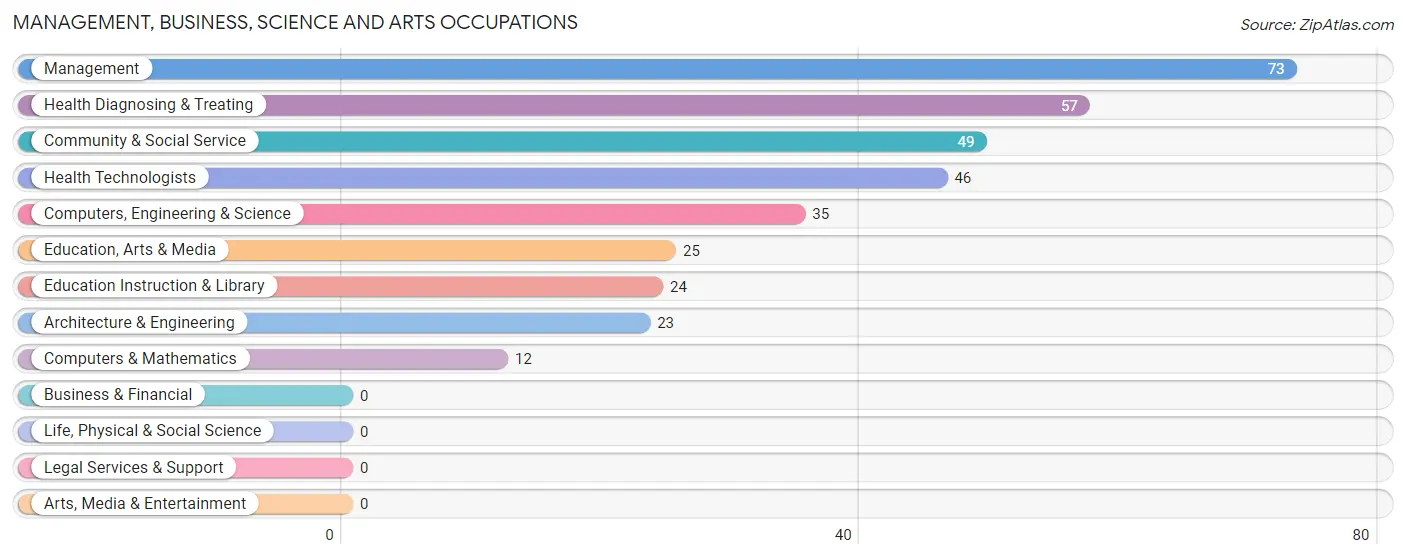
Management, Business, Science and Arts Occupations
The most common Management, Business, Science and Arts occupations in Ocean Park are Management (73 | 12.1%), Health Diagnosing & Treating (57 | 9.5%), Community & Social Service (49 | 8.1%), Health Technologists (46 | 7.6%), and Computers, Engineering & Science (35 | 5.8%).
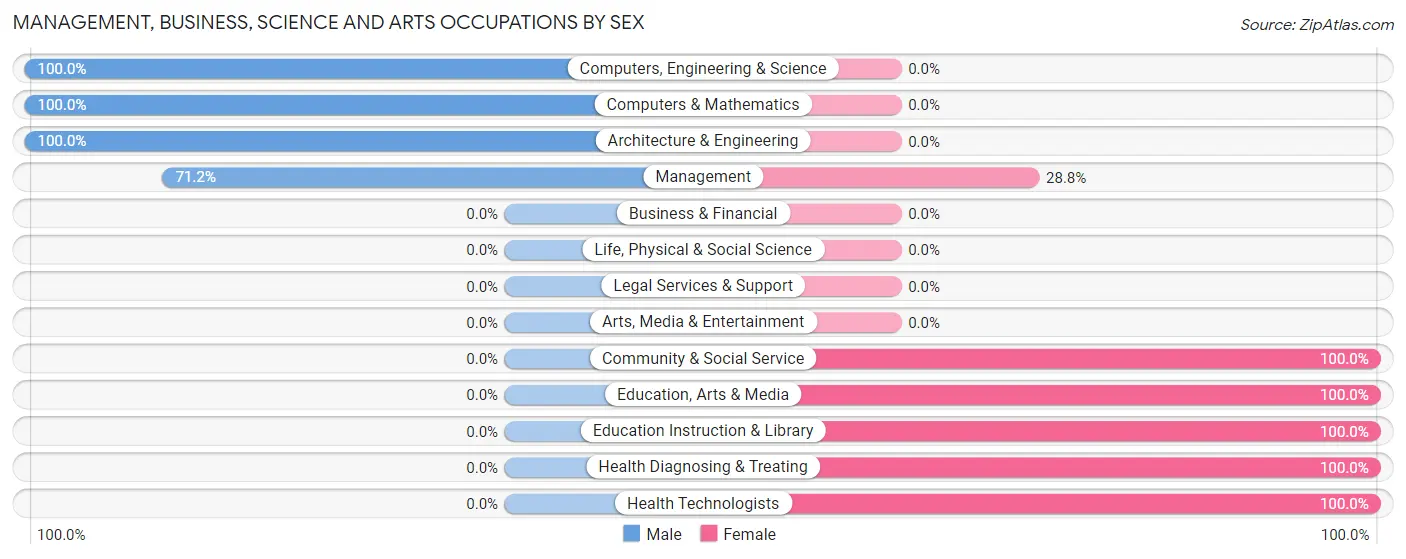
Management, Business, Science and Arts Occupations by Sex
Within the Management, Business, Science and Arts occupations in Ocean Park, the most male-oriented occupations are Computers, Engineering & Science (100.0%), Computers & Mathematics (100.0%), and Architecture & Engineering (100.0%), while the most female-oriented occupations are Community & Social Service (100.0%), Education, Arts & Media (100.0%), and Education Instruction & Library (100.0%).
| Occupation | Male | Female |
| Management | 52 (71.2%) | 21 (28.8%) |
| Business & Financial | 0 (0.0%) | 0 (0.0%) |
| Computers, Engineering & Science | 35 (100.0%) | 0 (0.0%) |
| Computers & Mathematics | 12 (100.0%) | 0 (0.0%) |
| Architecture & Engineering | 23 (100.0%) | 0 (0.0%) |
| Life, Physical & Social Science | 0 (0.0%) | 0 (0.0%) |
| Community & Social Service | 0 (0.0%) | 49 (100.0%) |
| Education, Arts & Media | 0 (0.0%) | 25 (100.0%) |
| Legal Services & Support | 0 (0.0%) | 0 (0.0%) |
| Education Instruction & Library | 0 (0.0%) | 24 (100.0%) |
| Arts, Media & Entertainment | 0 (0.0%) | 0 (0.0%) |
| Health Diagnosing & Treating | 0 (0.0%) | 57 (100.0%) |
| Health Technologists | 0 (0.0%) | 46 (100.0%) |
| Total (Category) | 87 (40.6%) | 127 (59.4%) |
| Total (Overall) | 340 (56.5%) | 262 (43.5%) |
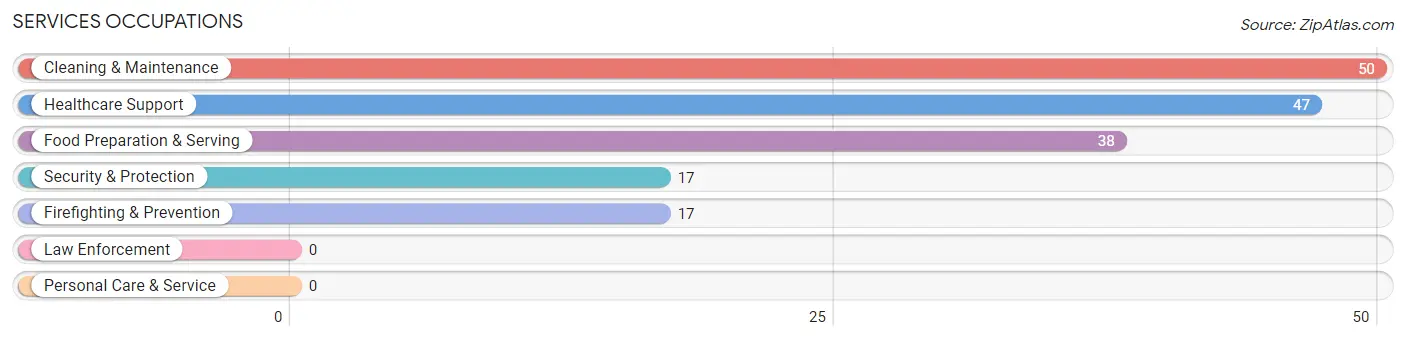
Services Occupations
The most common Services occupations in Ocean Park are Cleaning & Maintenance (50 | 8.3%), Healthcare Support (47 | 7.8%), Food Preparation & Serving (38 | 6.3%), Security & Protection (17 | 2.8%), and Firefighting & Prevention (17 | 2.8%).
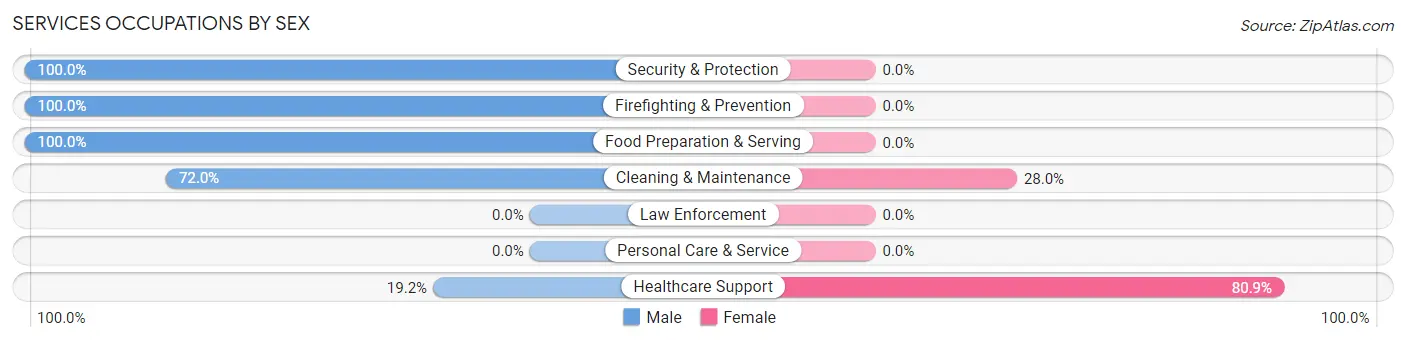
Services Occupations by Sex
Within the Services occupations in Ocean Park, the most male-oriented occupations are Security & Protection (100.0%), Firefighting & Prevention (100.0%), and Food Preparation & Serving (100.0%), while the most female-oriented occupations are Healthcare Support (80.8%), and Cleaning & Maintenance (28.0%).
| Occupation | Male | Female |
| Healthcare Support | 9 (19.2%) | 38 (80.8%) |
| Security & Protection | 17 (100.0%) | 0 (0.0%) |
| Firefighting & Prevention | 17 (100.0%) | 0 (0.0%) |
| Law Enforcement | 0 (0.0%) | 0 (0.0%) |
| Food Preparation & Serving | 38 (100.0%) | 0 (0.0%) |
| Cleaning & Maintenance | 36 (72.0%) | 14 (28.0%) |
| Personal Care & Service | 0 (0.0%) | 0 (0.0%) |
| Total (Category) | 100 (65.8%) | 52 (34.2%) |
| Total (Overall) | 340 (56.5%) | 262 (43.5%) |
Sales and Office Occupations
The most common Sales and Office occupations in Ocean Park are Office & Administration (51 | 8.5%), and Sales & Related (32 | 5.3%).
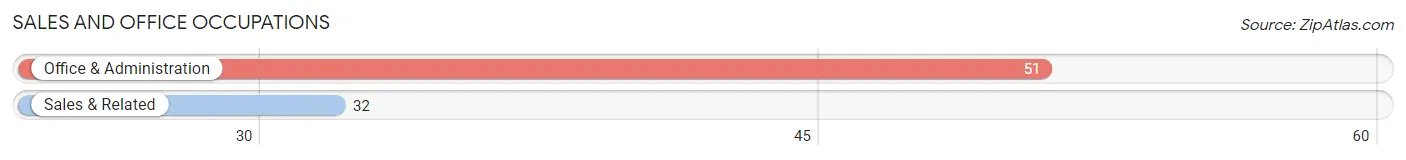
Sales and Office Occupations by Sex
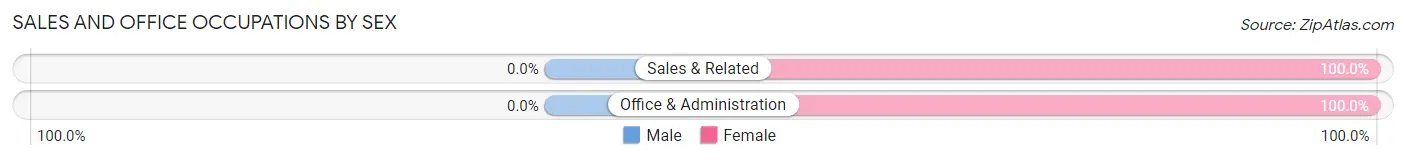
| Occupation | Male | Female |
| Sales & Related | 0 (0.0%) | 32 (100.0%) |
| Office & Administration | 0 (0.0%) | 51 (100.0%) |
| Total (Category) | 0 (0.0%) | 83 (100.0%) |
| Total (Overall) | 340 (56.5%) | 262 (43.5%) |
Natural Resources, Construction and Maintenance Occupations
The most common Natural Resources, Construction and Maintenance occupations in Ocean Park are , and Farming, Fishing & Forestry (83 | 13.8%).
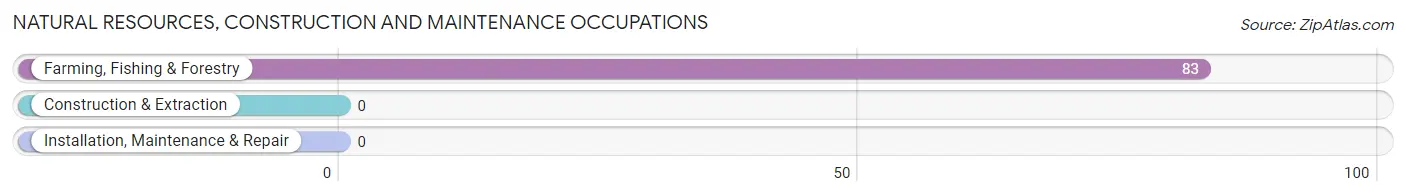
Natural Resources, Construction and Maintenance Occupations by Sex
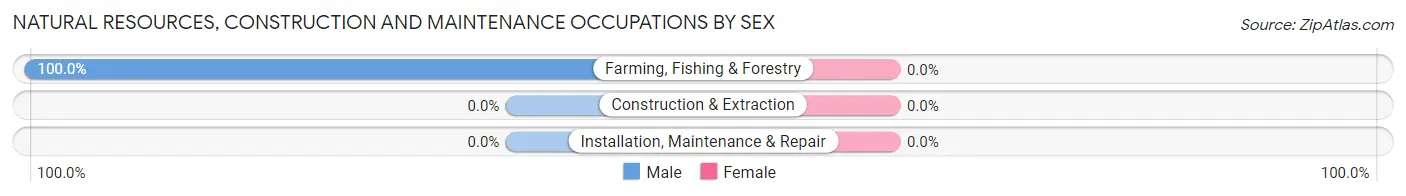
| Occupation | Male | Female |
| Farming, Fishing & Forestry | 83 (100.0%) | 0 (0.0%) |
| Construction & Extraction | 0 (0.0%) | 0 (0.0%) |
| Installation, Maintenance & Repair | 0 (0.0%) | 0 (0.0%) |
| Total (Category) | 83 (100.0%) | 0 (0.0%) |
| Total (Overall) | 340 (56.5%) | 262 (43.5%) |
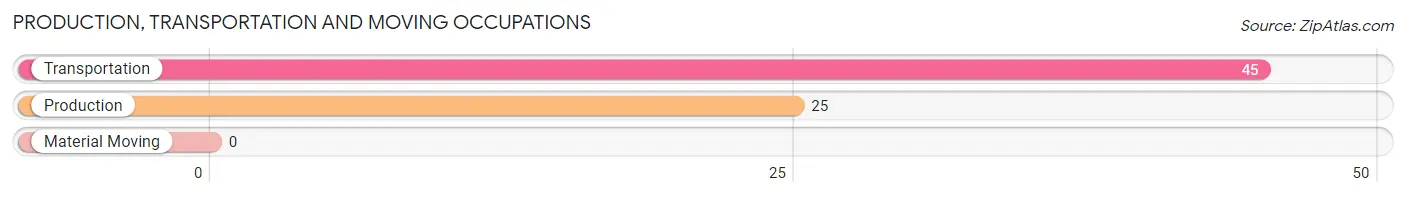
Production, Transportation and Moving Occupations
The most common Production, Transportation and Moving occupations in Ocean Park are Transportation (45 | 7.5%), and Production (25 | 4.2%).
Production, Transportation and Moving Occupations by Sex
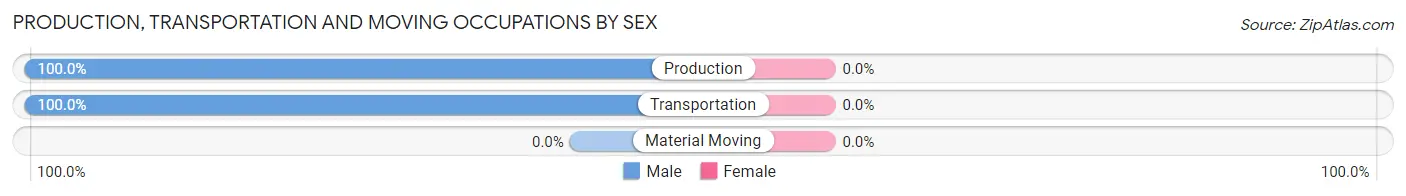
| Occupation | Male | Female |
| Production | 25 (100.0%) | 0 (0.0%) |
| Transportation | 45 (100.0%) | 0 (0.0%) |
| Material Moving | 0 (0.0%) | 0 (0.0%) |
| Total (Category) | 70 (100.0%) | 0 (0.0%) |
| Total (Overall) | 340 (56.5%) | 262 (43.5%) |
Employment Industries by Sex in Ocean Park
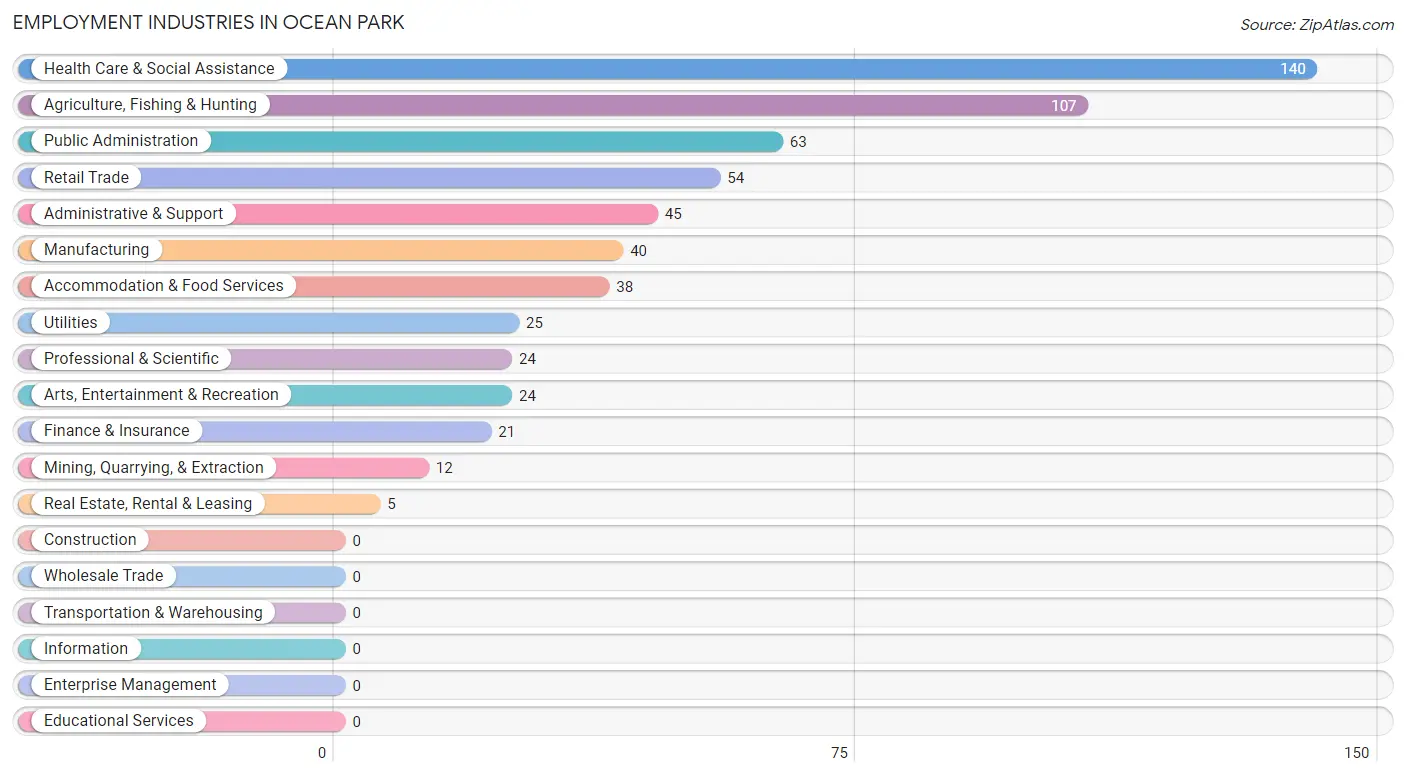
Employment Industries in Ocean Park
The major employment industries in Ocean Park include Health Care & Social Assistance (140 | 23.3%), Agriculture, Fishing & Hunting (107 | 17.8%), Public Administration (63 | 10.5%), Retail Trade (54 | 9.0%), and Administrative & Support (45 | 7.5%).
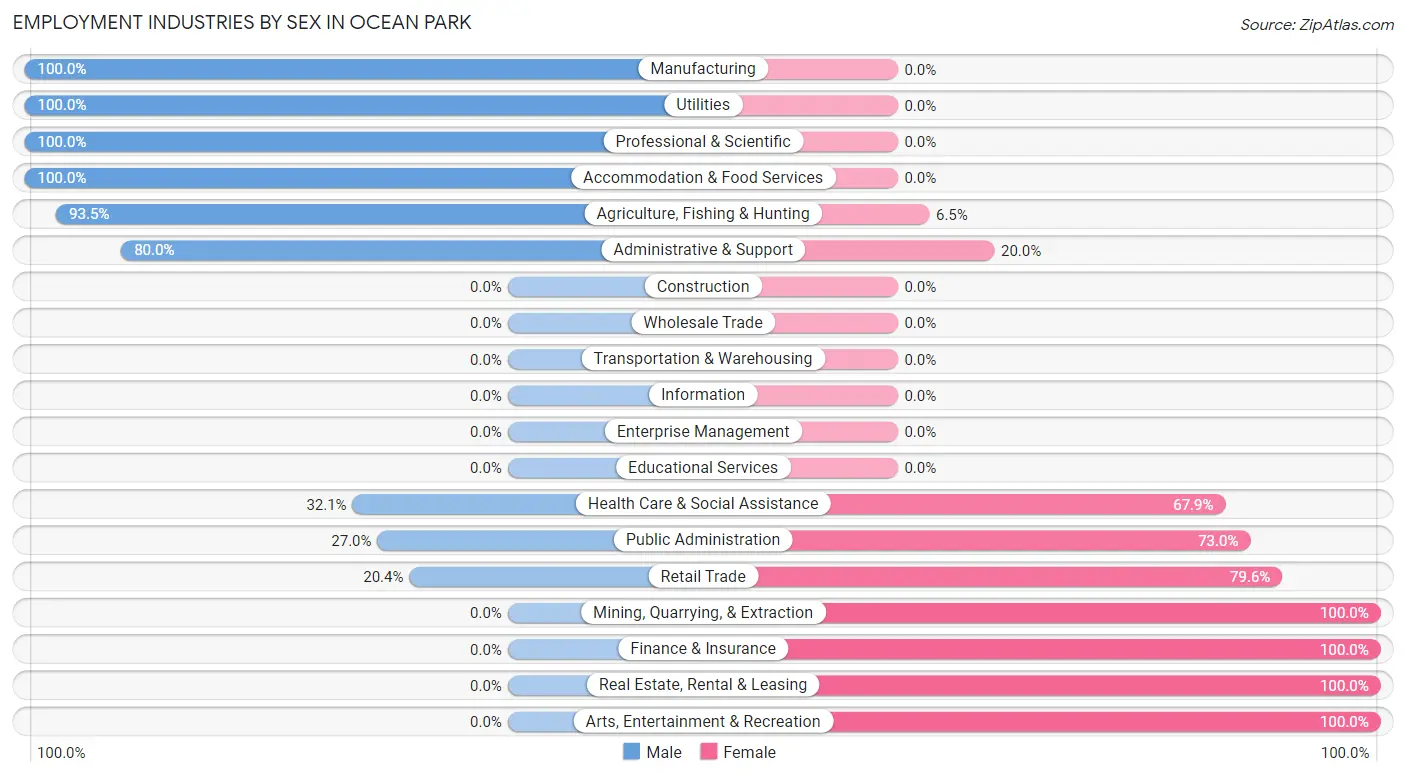
Employment Industries by Sex in Ocean Park
The Ocean Park industries that see more men than women are Manufacturing (100.0%), Utilities (100.0%), and Professional & Scientific (100.0%), whereas the industries that tend to have a higher number of women are Mining, Quarrying, & Extraction (100.0%), Finance & Insurance (100.0%), and Real Estate, Rental & Leasing (100.0%).
| Industry | Male | Female |
| Agriculture, Fishing & Hunting | 100 (93.5%) | 7 (6.5%) |
| Mining, Quarrying, & Extraction | 0 (0.0%) | 12 (100.0%) |
| Construction | 0 (0.0%) | 0 (0.0%) |
| Manufacturing | 40 (100.0%) | 0 (0.0%) |
| Wholesale Trade | 0 (0.0%) | 0 (0.0%) |
| Retail Trade | 11 (20.4%) | 43 (79.6%) |
| Transportation & Warehousing | 0 (0.0%) | 0 (0.0%) |
| Utilities | 25 (100.0%) | 0 (0.0%) |
| Information | 0 (0.0%) | 0 (0.0%) |
| Finance & Insurance | 0 (0.0%) | 21 (100.0%) |
| Real Estate, Rental & Leasing | 0 (0.0%) | 5 (100.0%) |
| Professional & Scientific | 24 (100.0%) | 0 (0.0%) |
| Enterprise Management | 0 (0.0%) | 0 (0.0%) |
| Administrative & Support | 36 (80.0%) | 9 (20.0%) |
| Educational Services | 0 (0.0%) | 0 (0.0%) |
| Health Care & Social Assistance | 45 (32.1%) | 95 (67.9%) |
| Arts, Entertainment & Recreation | 0 (0.0%) | 24 (100.0%) |
| Accommodation & Food Services | 38 (100.0%) | 0 (0.0%) |
| Public Administration | 17 (27.0%) | 46 (73.0%) |
| Total | 340 (56.5%) | 262 (43.5%) |
Education in Ocean Park
School Enrollment in Ocean Park
The most common levels of schooling among the 166 students in Ocean Park are college / undergraduate (60 | 36.1%), high school (37 | 22.3%), and middle school (34 | 20.5%).
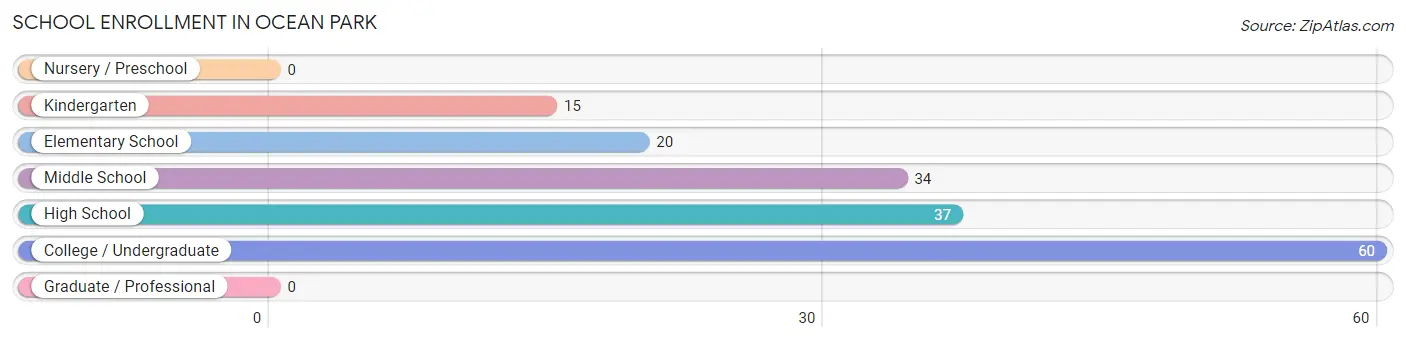
| School Level | # Students | % Students |
| Nursery / Preschool | 0 | 0.0% |
| Kindergarten | 15 | 9.0% |
| Elementary School | 20 | 12.0% |
| Middle School | 34 | 20.5% |
| High School | 37 | 22.3% |
| College / Undergraduate | 60 | 36.1% |
| Graduate / Professional | 0 | 0.0% |
| Total | 166 | 100.0% |
School Enrollment by Age by Funding Source in Ocean Park
Out of a total of 166 students who are enrolled in schools in Ocean Park, 19 (11.4%) attend a private institution, while the remaining 147 (88.6%) are enrolled in public schools. The age group of 15 to 17 year olds has the highest likelihood of being enrolled in private schools, with 8 (26.7% in the age bracket) enrolled. Conversely, the age group of 5 to 9 year old has the lowest likelihood of being enrolled in a private school, with 35 (100.0% in the age bracket) attending a public institution.
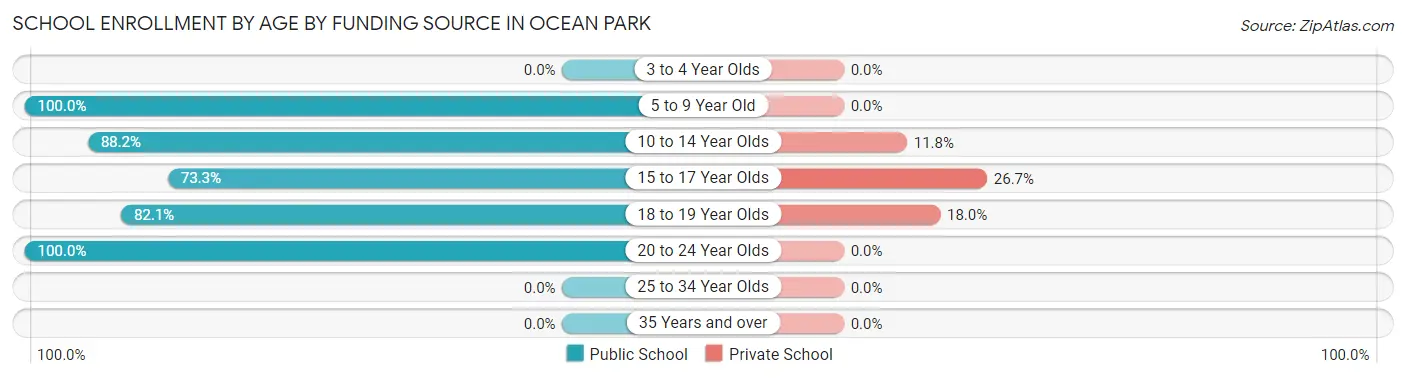
| Age Bracket | Public School | Private School |
| 3 to 4 Year Olds | 0 (0.0%) | 0 (0.0%) |
| 5 to 9 Year Old | 35 (100.0%) | 0 (0.0%) |
| 10 to 14 Year Olds | 30 (88.2%) | 4 (11.8%) |
| 15 to 17 Year Olds | 22 (73.3%) | 8 (26.7%) |
| 18 to 19 Year Olds | 32 (82.1%) | 7 (17.9%) |
| 20 to 24 Year Olds | 28 (100.0%) | 0 (0.0%) |
| 25 to 34 Year Olds | 0 (0.0%) | 0 (0.0%) |
| 35 Years and over | 0 (0.0%) | 0 (0.0%) |
| Total | 147 (88.6%) | 19 (11.4%) |
Educational Attainment by Field of Study in Ocean Park
Business (148 | 36.2%), visual & performing arts (84 | 20.5%), computers & mathematics (39 | 9.5%), physical & health sciences (29 | 7.1%), and science & technology (25 | 6.1%) are the most common fields of study among 409 individuals in Ocean Park who have obtained a bachelor's degree or higher.
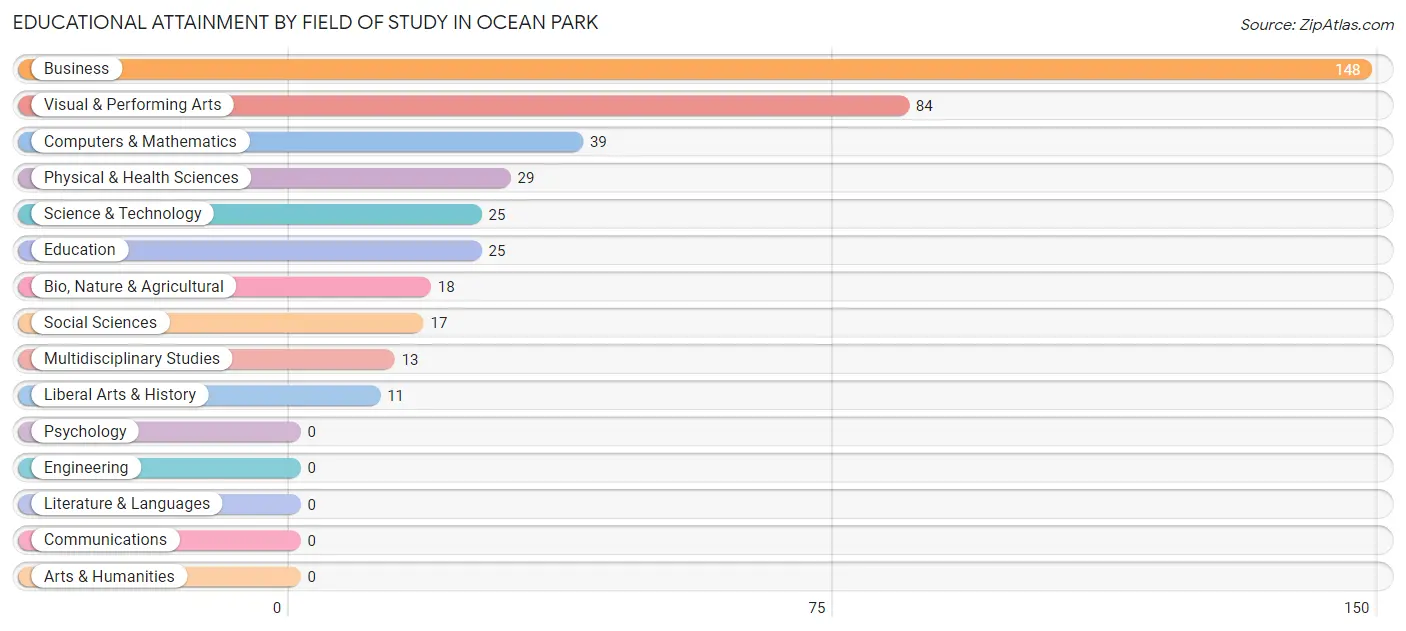
| Field of Study | # Graduates | % Graduates |
| Computers & Mathematics | 39 | 9.5% |
| Bio, Nature & Agricultural | 18 | 4.4% |
| Physical & Health Sciences | 29 | 7.1% |
| Psychology | 0 | 0.0% |
| Social Sciences | 17 | 4.2% |
| Engineering | 0 | 0.0% |
| Multidisciplinary Studies | 13 | 3.2% |
| Science & Technology | 25 | 6.1% |
| Business | 148 | 36.2% |
| Education | 25 | 6.1% |
| Literature & Languages | 0 | 0.0% |
| Liberal Arts & History | 11 | 2.7% |
| Visual & Performing Arts | 84 | 20.5% |
| Communications | 0 | 0.0% |
| Arts & Humanities | 0 | 0.0% |
| Total | 409 | 100.0% |
Transportation & Commute in Ocean Park
Vehicle Availability by Sex in Ocean Park
The most prevalent vehicle ownership categories in Ocean Park are males with 3 vehicles (127, accounting for 39.3%) and females with 3 vehicles (88, making up 48.5%).
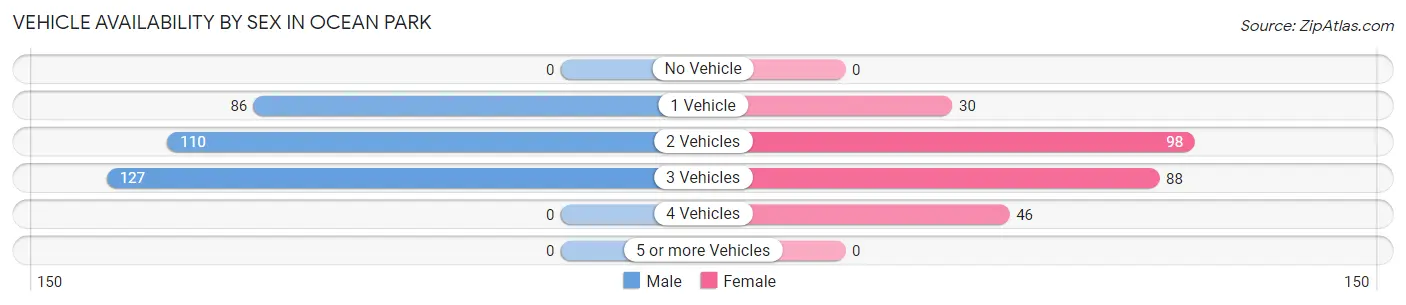
| Vehicles Available | Male | Female |
| No Vehicle | 0 (0.0%) | 0 (0.0%) |
| 1 Vehicle | 86 (26.6%) | 30 (11.5%) |
| 2 Vehicles | 110 (34.1%) | 98 (37.4%) |
| 3 Vehicles | 127 (39.3%) | 88 (33.6%) |
| 4 Vehicles | 0 (0.0%) | 46 (17.6%) |
| 5 or more Vehicles | 0 (0.0%) | 0 (0.0%) |
| Total | 323 (100.0%) | 262 (100.0%) |
Commute Time in Ocean Park
The most frequently occuring commute durations in Ocean Park are 10 to 14 minutes (142 commuters, 28.2%), 45 to 59 minutes (80 commuters, 15.9%), and 5 to 9 minutes (64 commuters, 12.7%).
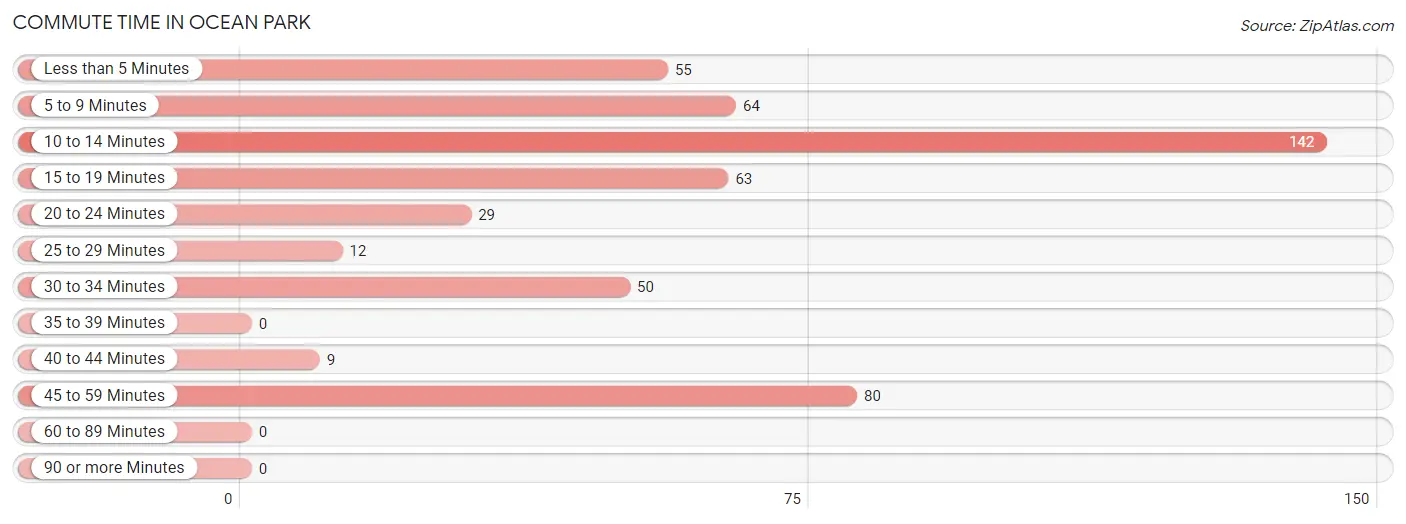
| Commute Time | # Commuters | % Commuters |
| Less than 5 Minutes | 55 | 10.9% |
| 5 to 9 Minutes | 64 | 12.7% |
| 10 to 14 Minutes | 142 | 28.2% |
| 15 to 19 Minutes | 63 | 12.5% |
| 20 to 24 Minutes | 29 | 5.8% |
| 25 to 29 Minutes | 12 | 2.4% |
| 30 to 34 Minutes | 50 | 9.9% |
| 35 to 39 Minutes | 0 | 0.0% |
| 40 to 44 Minutes | 9 | 1.8% |
| 45 to 59 Minutes | 80 | 15.9% |
| 60 to 89 Minutes | 0 | 0.0% |
| 90 or more Minutes | 0 | 0.0% |
Commute Time by Sex in Ocean Park
The most common commute times in Ocean Park are 10 to 14 minutes (125 commuters, 43.5%) for males and 45 to 59 minutes (58 commuters, 26.7%) for females.
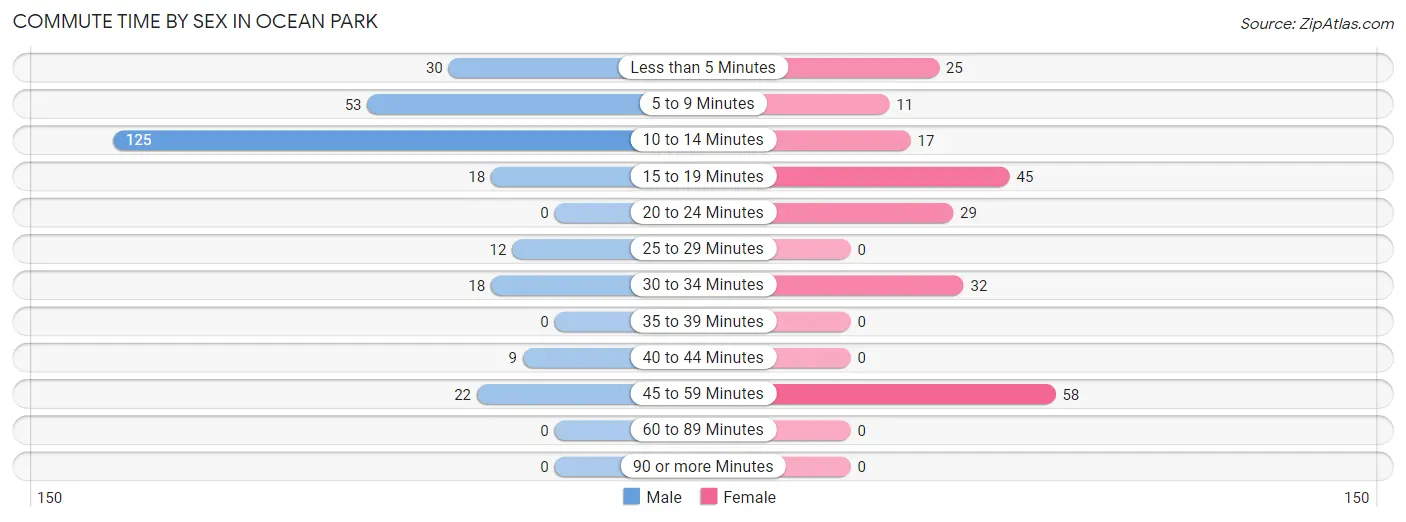
| Commute Time | Male | Female |
| Less than 5 Minutes | 30 (10.4%) | 25 (11.5%) |
| 5 to 9 Minutes | 53 (18.5%) | 11 (5.1%) |
| 10 to 14 Minutes | 125 (43.5%) | 17 (7.8%) |
| 15 to 19 Minutes | 18 (6.3%) | 45 (20.7%) |
| 20 to 24 Minutes | 0 (0.0%) | 29 (13.4%) |
| 25 to 29 Minutes | 12 (4.2%) | 0 (0.0%) |
| 30 to 34 Minutes | 18 (6.3%) | 32 (14.7%) |
| 35 to 39 Minutes | 0 (0.0%) | 0 (0.0%) |
| 40 to 44 Minutes | 9 (3.1%) | 0 (0.0%) |
| 45 to 59 Minutes | 22 (7.7%) | 58 (26.7%) |
| 60 to 89 Minutes | 0 (0.0%) | 0 (0.0%) |
| 90 or more Minutes | 0 (0.0%) | 0 (0.0%) |
Time of Departure to Work by Sex in Ocean Park
The most frequent times of departure to work in Ocean Park are 12:00 AM to 4:59 AM (83, 28.9%) for males and 9:00 AM to 9:59 AM (48, 22.1%) for females.
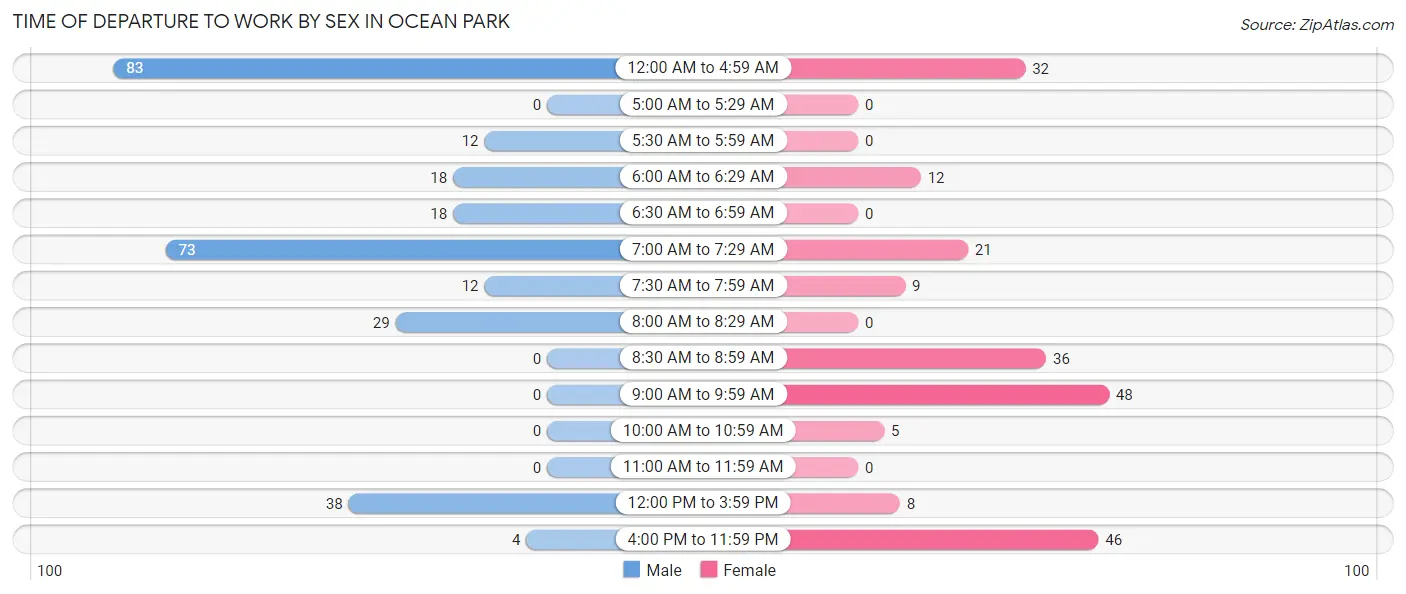
| Time of Departure | Male | Female |
| 12:00 AM to 4:59 AM | 83 (28.9%) | 32 (14.7%) |
| 5:00 AM to 5:29 AM | 0 (0.0%) | 0 (0.0%) |
| 5:30 AM to 5:59 AM | 12 (4.2%) | 0 (0.0%) |
| 6:00 AM to 6:29 AM | 18 (6.3%) | 12 (5.5%) |
| 6:30 AM to 6:59 AM | 18 (6.3%) | 0 (0.0%) |
| 7:00 AM to 7:29 AM | 73 (25.4%) | 21 (9.7%) |
| 7:30 AM to 7:59 AM | 12 (4.2%) | 9 (4.2%) |
| 8:00 AM to 8:29 AM | 29 (10.1%) | 0 (0.0%) |
| 8:30 AM to 8:59 AM | 0 (0.0%) | 36 (16.6%) |
| 9:00 AM to 9:59 AM | 0 (0.0%) | 48 (22.1%) |
| 10:00 AM to 10:59 AM | 0 (0.0%) | 5 (2.3%) |
| 11:00 AM to 11:59 AM | 0 (0.0%) | 0 (0.0%) |
| 12:00 PM to 3:59 PM | 38 (13.2%) | 8 (3.7%) |
| 4:00 PM to 11:59 PM | 4 (1.4%) | 46 (21.2%) |
| Total | 287 (100.0%) | 217 (100.0%) |
Housing Occupancy in Ocean Park
Occupancy by Ownership in Ocean Park
Of the total 1,019 dwellings in Ocean Park, owner-occupied units account for 849 (83.3%), while renter-occupied units make up 170 (16.7%).
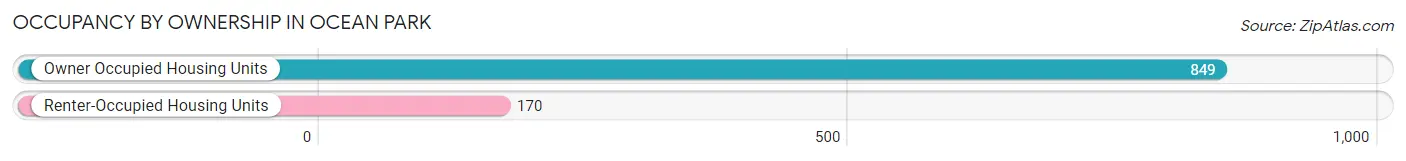
| Occupancy | # Housing Units | % Housing Units |
| Owner Occupied Housing Units | 849 | 83.3% |
| Renter-Occupied Housing Units | 170 | 16.7% |
| Total Occupied Housing Units | 1,019 | 100.0% |
Occupancy by Household Size in Ocean Park
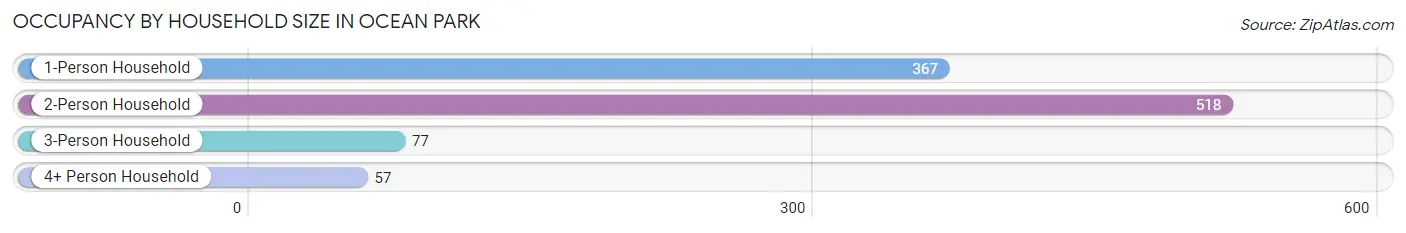
| Household Size | # Housing Units | % Housing Units |
| 1-Person Household | 367 | 36.0% |
| 2-Person Household | 518 | 50.8% |
| 3-Person Household | 77 | 7.6% |
| 4+ Person Household | 57 | 5.6% |
| Total Housing Units | 1,019 | 100.0% |
Occupancy by Ownership by Household Size in Ocean Park
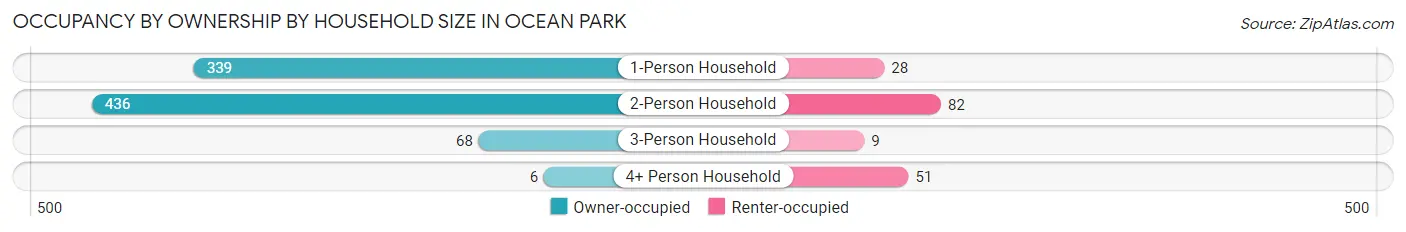
| Household Size | Owner-occupied | Renter-occupied |
| 1-Person Household | 339 (92.4%) | 28 (7.6%) |
| 2-Person Household | 436 (84.2%) | 82 (15.8%) |
| 3-Person Household | 68 (88.3%) | 9 (11.7%) |
| 4+ Person Household | 6 (10.5%) | 51 (89.5%) |
| Total Housing Units | 849 (83.3%) | 170 (16.7%) |
Occupancy by Educational Attainment in Ocean Park
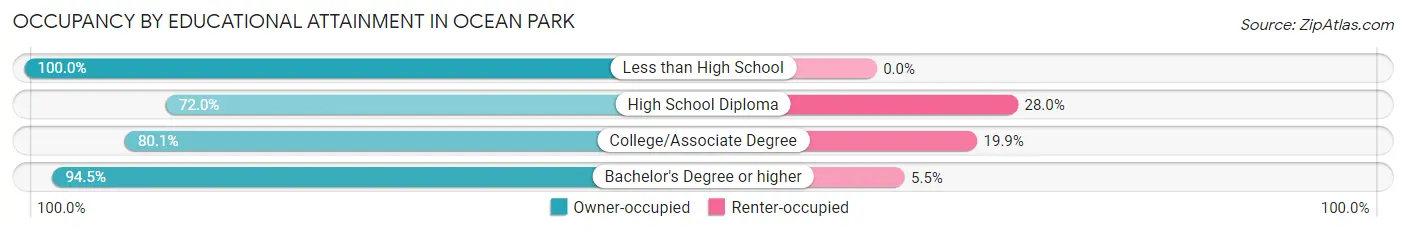
| Household Size | Owner-occupied | Renter-occupied |
| Less than High School | 106 (100.0%) | 0 (0.0%) |
| High School Diploma | 172 (72.0%) | 67 (28.0%) |
| College/Associate Degree | 366 (80.1%) | 91 (19.9%) |
| Bachelor's Degree or higher | 205 (94.5%) | 12 (5.5%) |
Occupancy by Age of Householder in Ocean Park
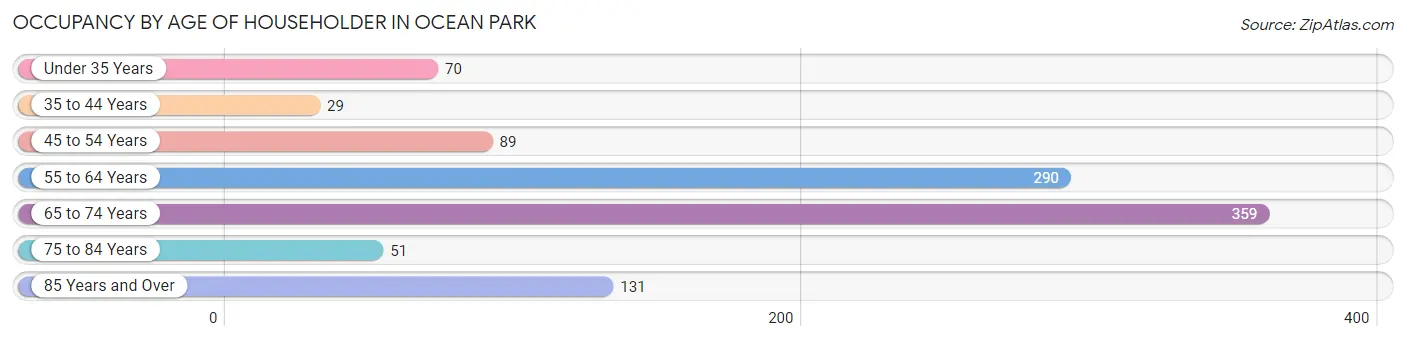
| Age Bracket | # Households | % Households |
| Under 35 Years | 70 | 6.9% |
| 35 to 44 Years | 29 | 2.9% |
| 45 to 54 Years | 89 | 8.7% |
| 55 to 64 Years | 290 | 28.5% |
| 65 to 74 Years | 359 | 35.2% |
| 75 to 84 Years | 51 | 5.0% |
| 85 Years and Over | 131 | 12.9% |
| Total | 1,019 | 100.0% |
Housing Finances in Ocean Park
Median Income by Occupancy in Ocean Park
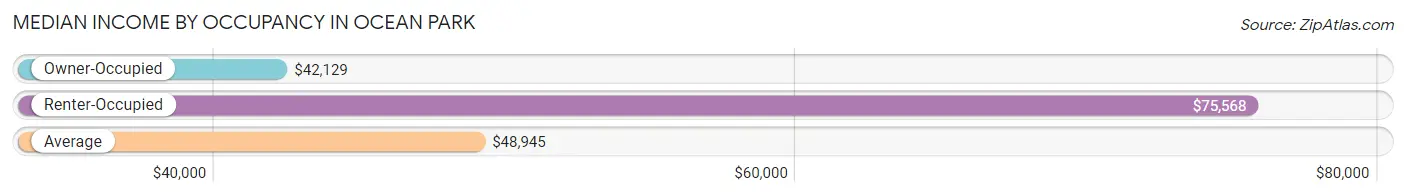
| Occupancy Type | # Households | Median Income |
| Owner-Occupied | 849 (83.3%) | $42,129 |
| Renter-Occupied | 170 (16.7%) | $75,568 |
| Average | 1,019 (100.0%) | $48,945 |
Occupancy by Householder Income Bracket in Ocean Park
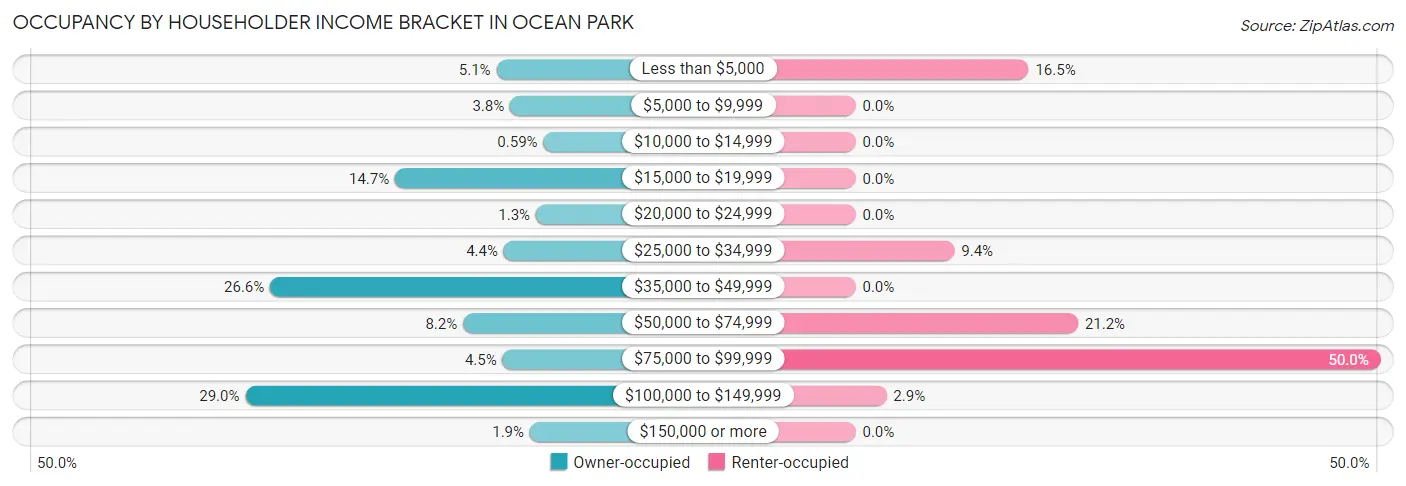
| Income Bracket | Owner-occupied | Renter-occupied |
| Less than $5,000 | 43 (5.1%) | 28 (16.5%) |
| $5,000 to $9,999 | 32 (3.8%) | 0 (0.0%) |
| $10,000 to $14,999 | 5 (0.6%) | 0 (0.0%) |
| $15,000 to $19,999 | 125 (14.7%) | 0 (0.0%) |
| $20,000 to $24,999 | 11 (1.3%) | 0 (0.0%) |
| $25,000 to $34,999 | 37 (4.4%) | 16 (9.4%) |
| $35,000 to $49,999 | 226 (26.6%) | 0 (0.0%) |
| $50,000 to $74,999 | 70 (8.2%) | 36 (21.2%) |
| $75,000 to $99,999 | 38 (4.5%) | 85 (50.0%) |
| $100,000 to $149,999 | 246 (29.0%) | 5 (2.9%) |
| $150,000 or more | 16 (1.9%) | 0 (0.0%) |
| Total | 849 (100.0%) | 170 (100.0%) |
Monthly Housing Cost Tiers in Ocean Park
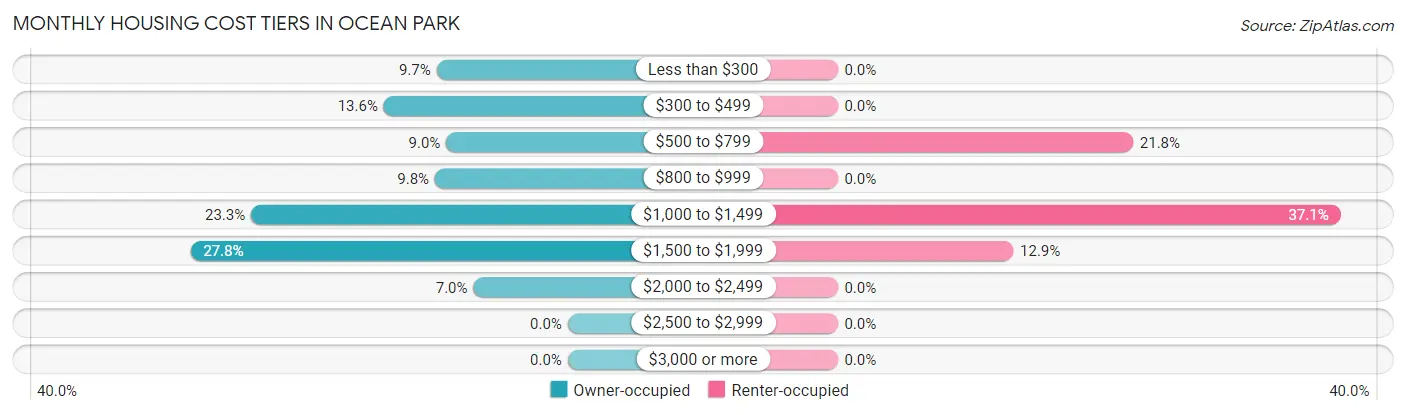
| Monthly Cost | Owner-occupied | Renter-occupied |
| Less than $300 | 82 (9.7%) | 0 (0.0%) |
| $300 to $499 | 115 (13.6%) | 0 (0.0%) |
| $500 to $799 | 76 (8.9%) | 37 (21.8%) |
| $800 to $999 | 83 (9.8%) | 0 (0.0%) |
| $1,000 to $1,499 | 198 (23.3%) | 63 (37.1%) |
| $1,500 to $1,999 | 236 (27.8%) | 22 (12.9%) |
| $2,000 to $2,499 | 59 (7.0%) | 0 (0.0%) |
| $2,500 to $2,999 | 0 (0.0%) | 0 (0.0%) |
| $3,000 or more | 0 (0.0%) | 0 (0.0%) |
| Total | 849 (100.0%) | 170 (100.0%) |
Physical Housing Characteristics in Ocean Park
Housing Structures in Ocean Park
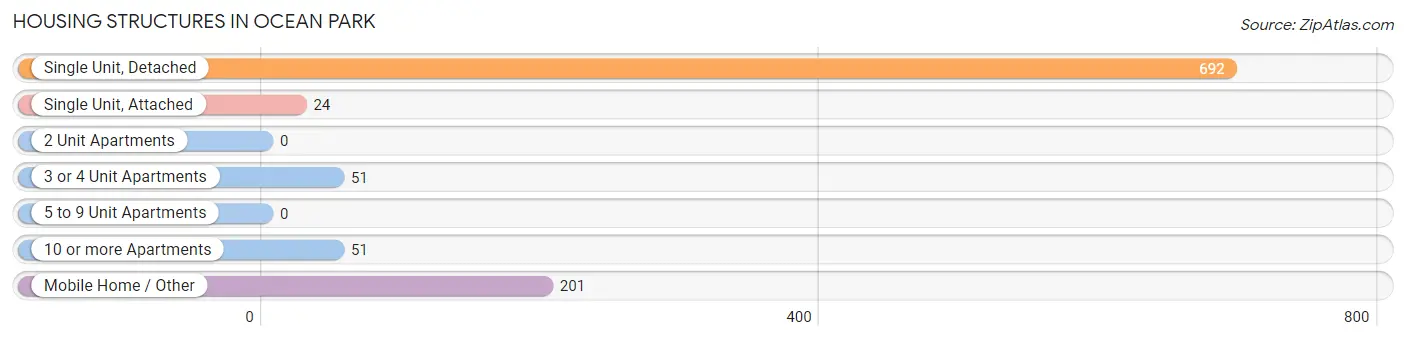
| Structure Type | # Housing Units | % Housing Units |
| Single Unit, Detached | 692 | 67.9% |
| Single Unit, Attached | 24 | 2.4% |
| 2 Unit Apartments | 0 | 0.0% |
| 3 or 4 Unit Apartments | 51 | 5.0% |
| 5 to 9 Unit Apartments | 0 | 0.0% |
| 10 or more Apartments | 51 | 5.0% |
| Mobile Home / Other | 201 | 19.7% |
| Total | 1,019 | 100.0% |
Housing Structures by Occupancy in Ocean Park
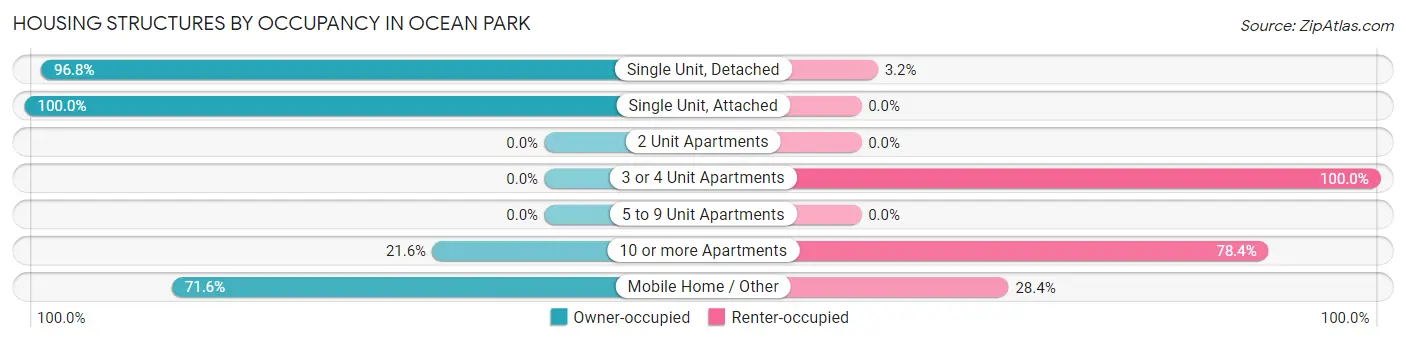
| Structure Type | Owner-occupied | Renter-occupied |
| Single Unit, Detached | 670 (96.8%) | 22 (3.2%) |
| Single Unit, Attached | 24 (100.0%) | 0 (0.0%) |
| 2 Unit Apartments | 0 (0.0%) | 0 (0.0%) |
| 3 or 4 Unit Apartments | 0 (0.0%) | 51 (100.0%) |
| 5 to 9 Unit Apartments | 0 (0.0%) | 0 (0.0%) |
| 10 or more Apartments | 11 (21.6%) | 40 (78.4%) |
| Mobile Home / Other | 144 (71.6%) | 57 (28.4%) |
| Total | 849 (83.3%) | 170 (16.7%) |
Housing Structures by Number of Rooms in Ocean Park
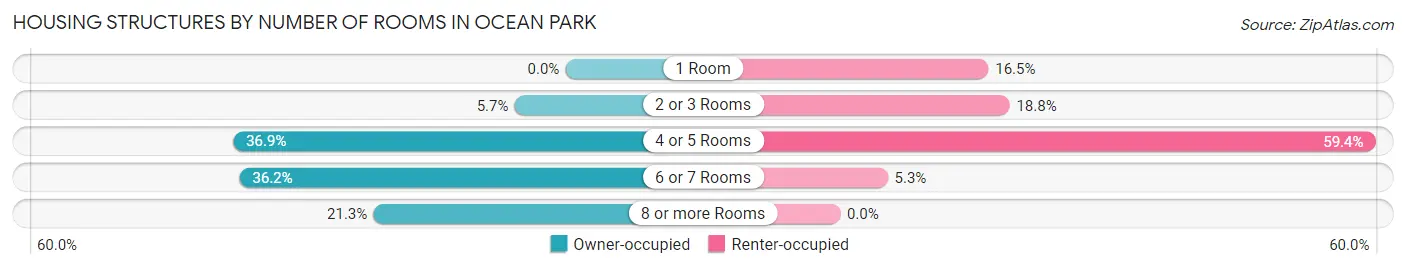
| Number of Rooms | Owner-occupied | Renter-occupied |
| 1 Room | 0 (0.0%) | 28 (16.5%) |
| 2 or 3 Rooms | 48 (5.7%) | 32 (18.8%) |
| 4 or 5 Rooms | 313 (36.9%) | 101 (59.4%) |
| 6 or 7 Rooms | 307 (36.2%) | 9 (5.3%) |
| 8 or more Rooms | 181 (21.3%) | 0 (0.0%) |
| Total | 849 (100.0%) | 170 (100.0%) |
Housing Structure by Heating Type in Ocean Park
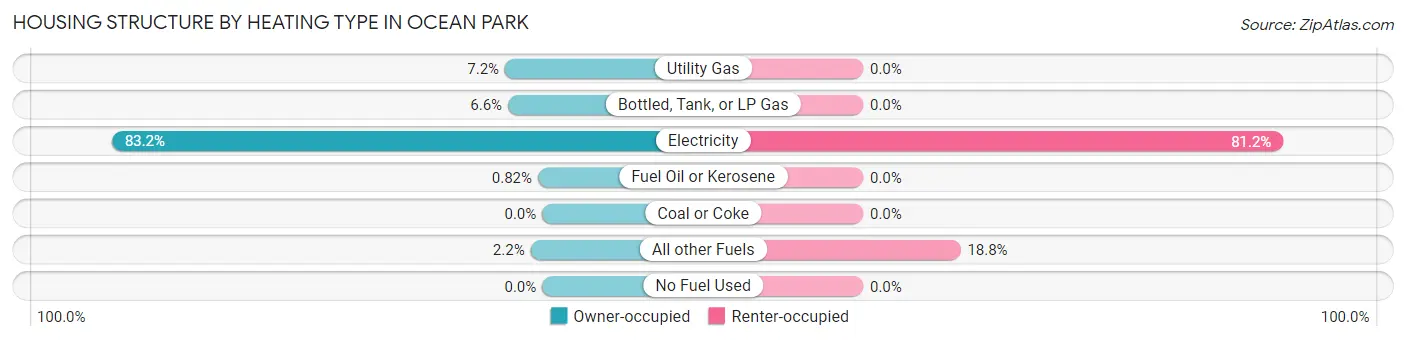
| Heating Type | Owner-occupied | Renter-occupied |
| Utility Gas | 61 (7.2%) | 0 (0.0%) |
| Bottled, Tank, or LP Gas | 56 (6.6%) | 0 (0.0%) |
| Electricity | 706 (83.2%) | 138 (81.2%) |
| Fuel Oil or Kerosene | 7 (0.8%) | 0 (0.0%) |
| Coal or Coke | 0 (0.0%) | 0 (0.0%) |
| All other Fuels | 19 (2.2%) | 32 (18.8%) |
| No Fuel Used | 0 (0.0%) | 0 (0.0%) |
| Total | 849 (100.0%) | 170 (100.0%) |
Household Vehicle Usage in Ocean Park
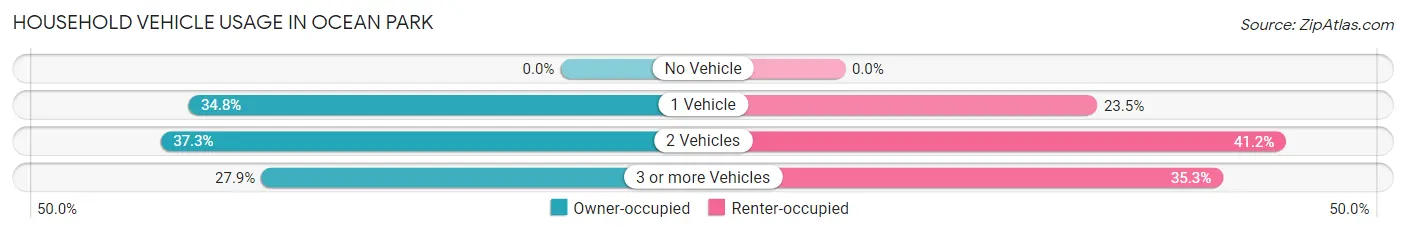
| Vehicles per Household | Owner-occupied | Renter-occupied |
| No Vehicle | 0 (0.0%) | 0 (0.0%) |
| 1 Vehicle | 295 (34.7%) | 40 (23.5%) |
| 2 Vehicles | 317 (37.3%) | 70 (41.2%) |
| 3 or more Vehicles | 237 (27.9%) | 60 (35.3%) |
| Total | 849 (100.0%) | 170 (100.0%) |
Real Estate & Mortgages in Ocean Park
Real Estate and Mortgage Overview in Ocean Park
| Characteristic | Without Mortgage | With Mortgage |
| Housing Units | 321 | 528 |
| Median Property Value | $275,000 | $256,000 |
| Median Household Income | $35,919 | $0 |
| Monthly Housing Costs | $473 | $0 |
| Real Estate Taxes | $2,000 | $0 |
Property Value by Mortgage Status in Ocean Park
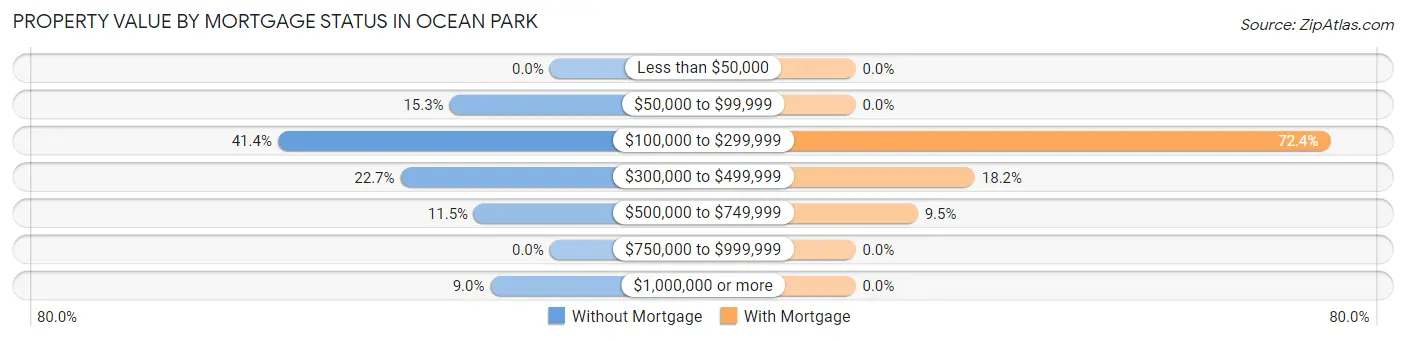
| Property Value | Without Mortgage | With Mortgage |
| Less than $50,000 | 0 (0.0%) | 0 (0.0%) |
| $50,000 to $99,999 | 49 (15.3%) | 0 (0.0%) |
| $100,000 to $299,999 | 133 (41.4%) | 382 (72.4%) |
| $300,000 to $499,999 | 73 (22.7%) | 96 (18.2%) |
| $500,000 to $749,999 | 37 (11.5%) | 50 (9.5%) |
| $750,000 to $999,999 | 0 (0.0%) | 0 (0.0%) |
| $1,000,000 or more | 29 (9.0%) | 0 (0.0%) |
| Total | 321 (100.0%) | 528 (100.0%) |
Household Income by Mortgage Status in Ocean Park
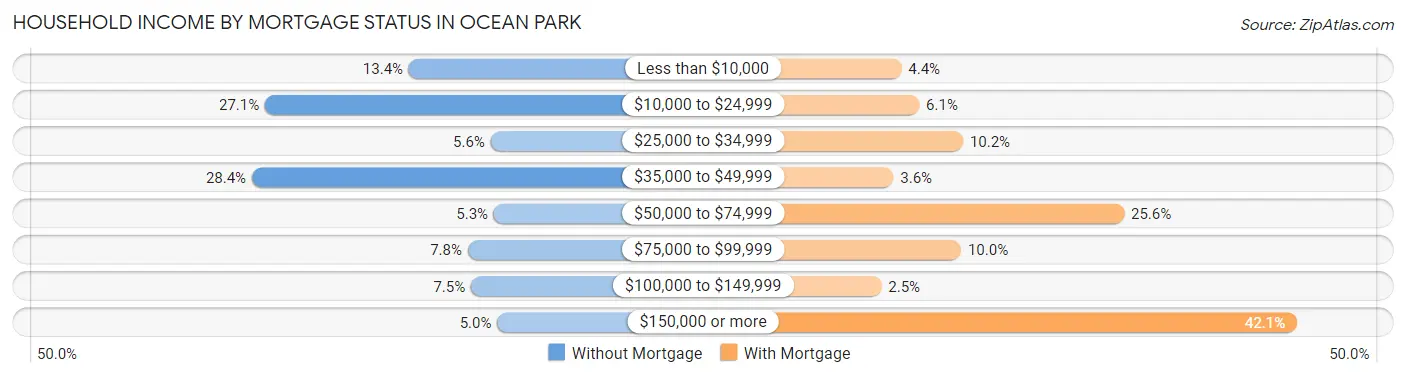
| Household Income | Without Mortgage | With Mortgage |
| Less than $10,000 | 43 (13.4%) | 23 (4.4%) |
| $10,000 to $24,999 | 87 (27.1%) | 32 (6.1%) |
| $25,000 to $34,999 | 18 (5.6%) | 54 (10.2%) |
| $35,000 to $49,999 | 91 (28.3%) | 19 (3.6%) |
| $50,000 to $74,999 | 17 (5.3%) | 135 (25.6%) |
| $75,000 to $99,999 | 25 (7.8%) | 53 (10.0%) |
| $100,000 to $149,999 | 24 (7.5%) | 13 (2.5%) |
| $150,000 or more | 16 (5.0%) | 222 (42.0%) |
| Total | 321 (100.0%) | 528 (100.0%) |
Property Value to Household Income Ratio in Ocean Park
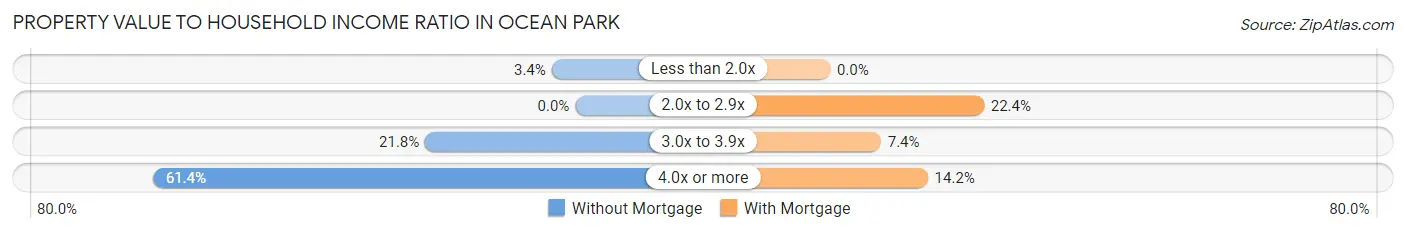
| Value-to-Income Ratio | Without Mortgage | With Mortgage |
| Less than 2.0x | 11 (3.4%) | 0 (0.0%) |
| 2.0x to 2.9x | 0 (0.0%) | 118 (22.4%) |
| 3.0x to 3.9x | 70 (21.8%) | 39 (7.4%) |
| 4.0x or more | 197 (61.4%) | 75 (14.2%) |
| Total | 321 (100.0%) | 528 (100.0%) |
Real Estate Taxes by Mortgage Status in Ocean Park
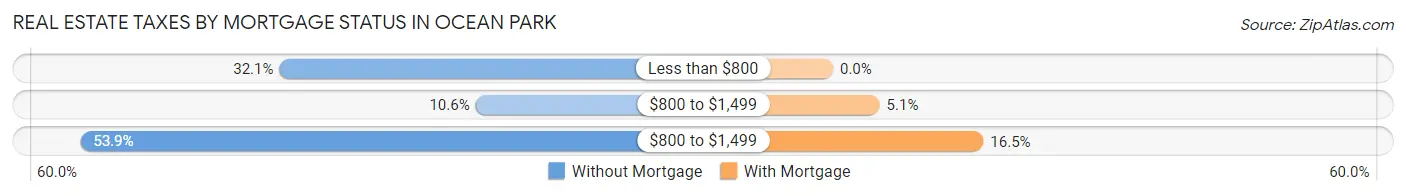
| Property Taxes | Without Mortgage | With Mortgage |
| Less than $800 | 103 (32.1%) | 0 (0.0%) |
| $800 to $1,499 | 34 (10.6%) | 27 (5.1%) |
| $800 to $1,499 | 173 (53.9%) | 87 (16.5%) |
| Total | 321 (100.0%) | 528 (100.0%) |
Health & Disability in Ocean Park
Health Insurance Coverage by Age in Ocean Park
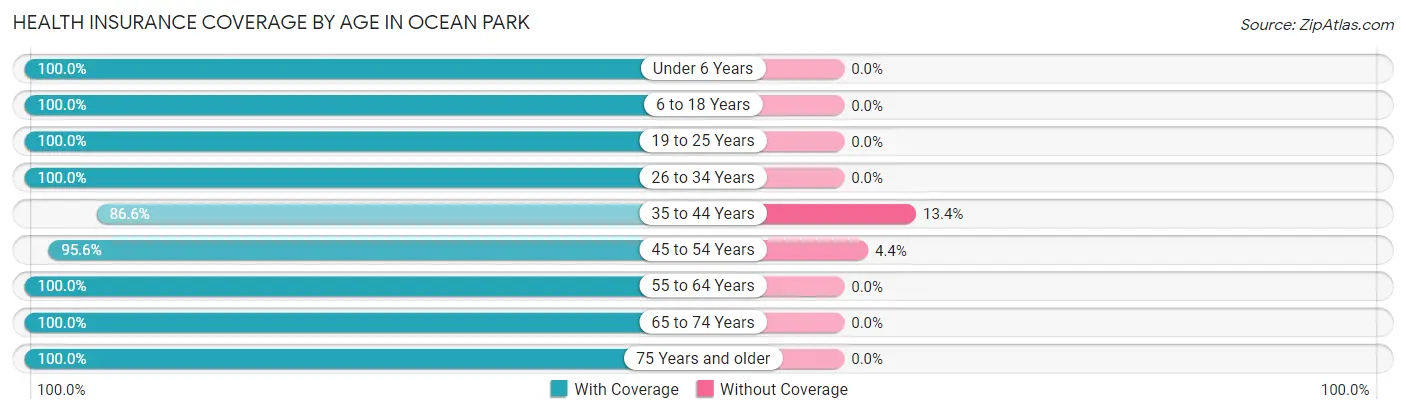
| Age Bracket | With Coverage | Without Coverage |
| Under 6 Years | 9 (100.0%) | 0 (0.0%) |
| 6 to 18 Years | 138 (100.0%) | 0 (0.0%) |
| 19 to 25 Years | 39 (100.0%) | 0 (0.0%) |
| 26 to 34 Years | 85 (100.0%) | 0 (0.0%) |
| 35 to 44 Years | 84 (86.6%) | 13 (13.4%) |
| 45 to 54 Years | 194 (95.6%) | 9 (4.4%) |
| 55 to 64 Years | 478 (100.0%) | 0 (0.0%) |
| 65 to 74 Years | 628 (100.0%) | 0 (0.0%) |
| 75 Years and older | 229 (100.0%) | 0 (0.0%) |
| Total | 1,884 (98.9%) | 22 (1.1%) |
Health Insurance Coverage by Citizenship Status in Ocean Park
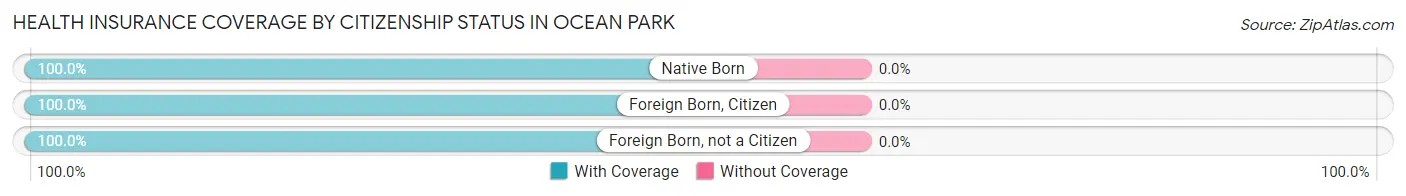
| Citizenship Status | With Coverage | Without Coverage |
| Native Born | 9 (100.0%) | 0 (0.0%) |
| Foreign Born, Citizen | 138 (100.0%) | 0 (0.0%) |
| Foreign Born, not a Citizen | 39 (100.0%) | 0 (0.0%) |
Health Insurance Coverage by Household Income in Ocean Park
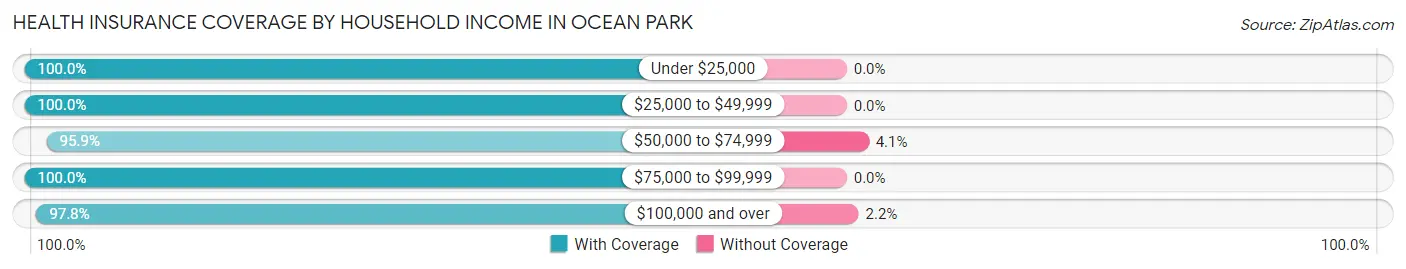
| Household Income | With Coverage | Without Coverage |
| Under $25,000 | 287 (100.0%) | 0 (0.0%) |
| $25,000 to $49,999 | 480 (100.0%) | 0 (0.0%) |
| $50,000 to $74,999 | 210 (95.9%) | 9 (4.1%) |
| $75,000 to $99,999 | 332 (100.0%) | 0 (0.0%) |
| $100,000 and over | 575 (97.8%) | 13 (2.2%) |
Public vs Private Health Insurance Coverage by Age in Ocean Park
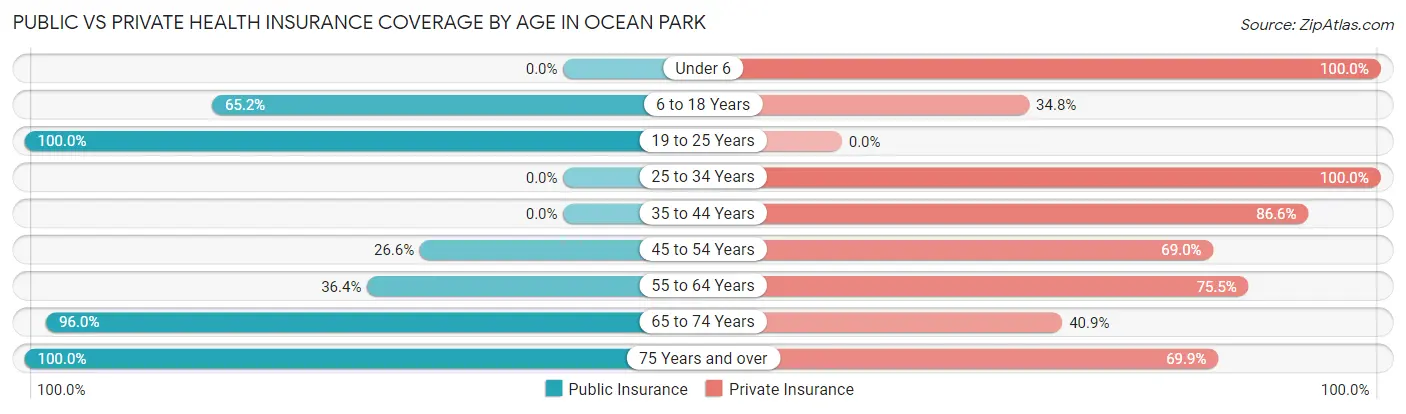
| Age Bracket | Public Insurance | Private Insurance |
| Under 6 | 0 (0.0%) | 9 (100.0%) |
| 6 to 18 Years | 90 (65.2%) | 48 (34.8%) |
| 19 to 25 Years | 39 (100.0%) | 0 (0.0%) |
| 25 to 34 Years | 0 (0.0%) | 85 (100.0%) |
| 35 to 44 Years | 0 (0.0%) | 84 (86.6%) |
| 45 to 54 Years | 54 (26.6%) | 140 (69.0%) |
| 55 to 64 Years | 174 (36.4%) | 361 (75.5%) |
| 65 to 74 Years | 603 (96.0%) | 257 (40.9%) |
| 75 Years and over | 229 (100.0%) | 160 (69.9%) |
| Total | 1,189 (62.4%) | 1,144 (60.0%) |
Disability Status by Sex by Age in Ocean Park
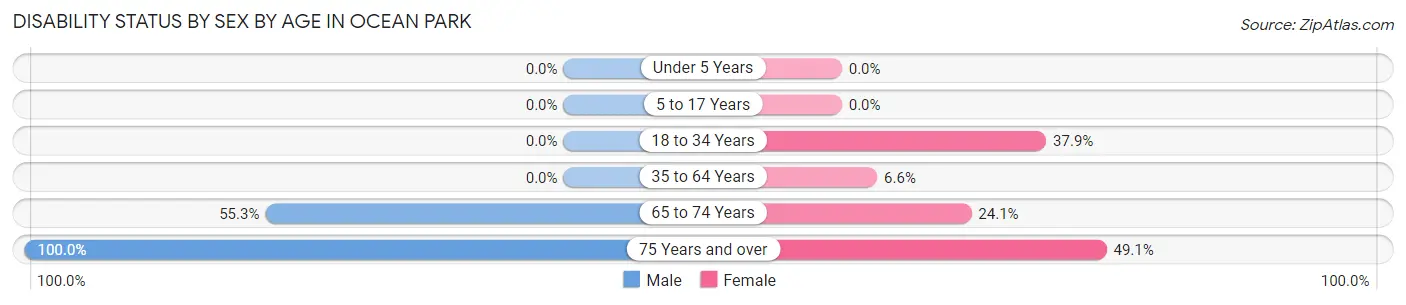
| Age Bracket | Male | Female |
| Under 5 Years | 0 (0.0%) | 0 (0.0%) |
| 5 to 17 Years | 0 (0.0%) | 0 (0.0%) |
| 18 to 34 Years | 0 (0.0%) | 11 (37.9%) |
| 35 to 64 Years | 0 (0.0%) | 32 (6.6%) |
| 65 to 74 Years | 244 (55.3%) | 45 (24.1%) |
| 75 Years and over | 113 (100.0%) | 57 (49.1%) |
Disability Class by Sex by Age in Ocean Park
Disability Class: Hearing Difficulty
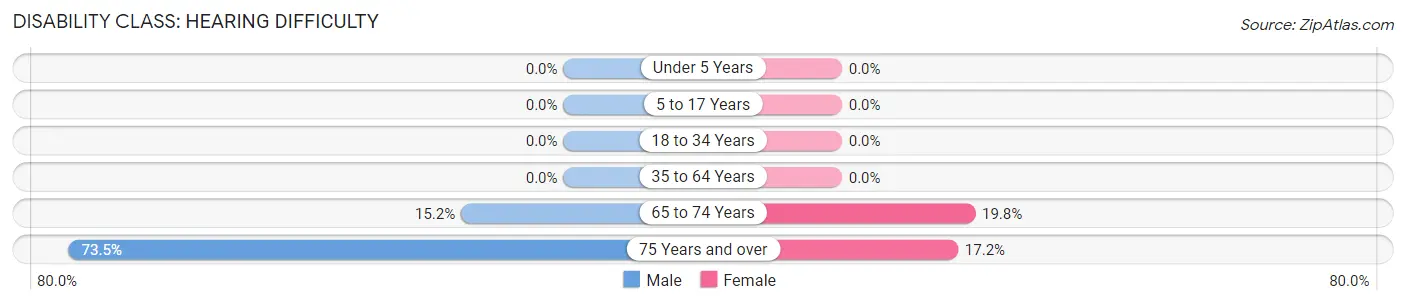
| Age Bracket | Male | Female |
| Under 5 Years | 0 (0.0%) | 0 (0.0%) |
| 5 to 17 Years | 0 (0.0%) | 0 (0.0%) |
| 18 to 34 Years | 0 (0.0%) | 0 (0.0%) |
| 35 to 64 Years | 0 (0.0%) | 0 (0.0%) |
| 65 to 74 Years | 67 (15.2%) | 37 (19.8%) |
| 75 Years and over | 83 (73.5%) | 20 (17.2%) |
Disability Class: Vision Difficulty
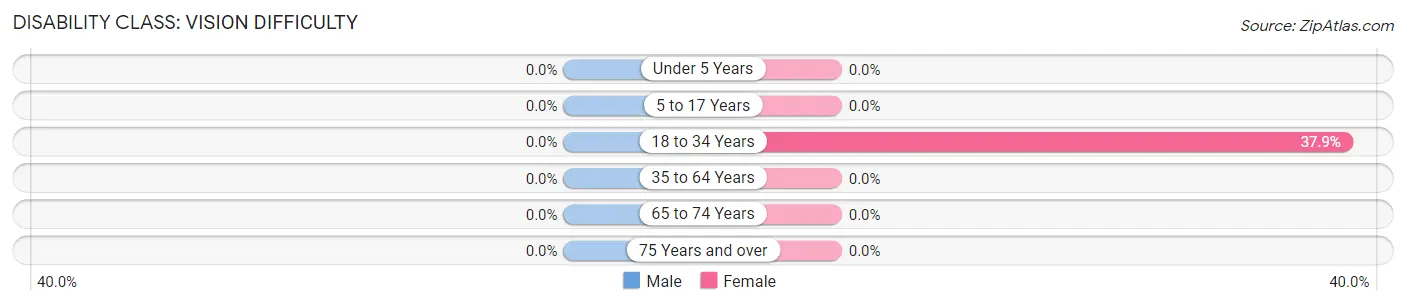
| Age Bracket | Male | Female |
| Under 5 Years | 0 (0.0%) | 0 (0.0%) |
| 5 to 17 Years | 0 (0.0%) | 0 (0.0%) |
| 18 to 34 Years | 0 (0.0%) | 11 (37.9%) |
| 35 to 64 Years | 0 (0.0%) | 0 (0.0%) |
| 65 to 74 Years | 0 (0.0%) | 0 (0.0%) |
| 75 Years and over | 0 (0.0%) | 0 (0.0%) |
Disability Class: Cognitive Difficulty
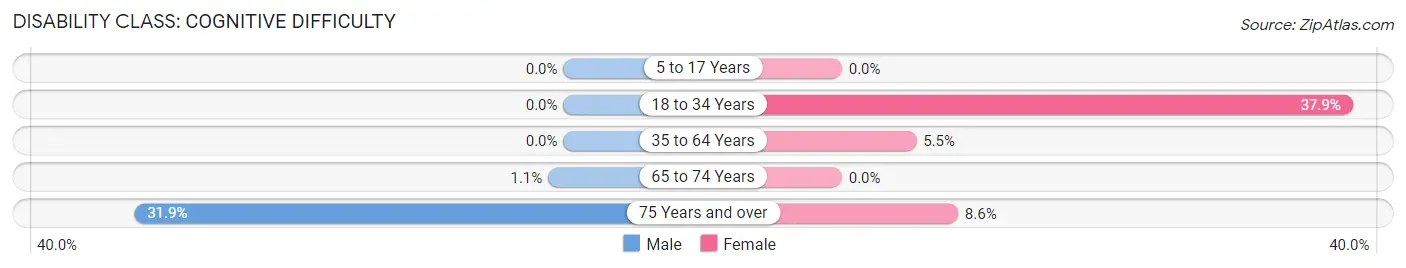
| Age Bracket | Male | Female |
| 5 to 17 Years | 0 (0.0%) | 0 (0.0%) |
| 18 to 34 Years | 0 (0.0%) | 11 (37.9%) |
| 35 to 64 Years | 0 (0.0%) | 27 (5.5%) |
| 65 to 74 Years | 5 (1.1%) | 0 (0.0%) |
| 75 Years and over | 36 (31.9%) | 10 (8.6%) |
Disability Class: Ambulatory Difficulty
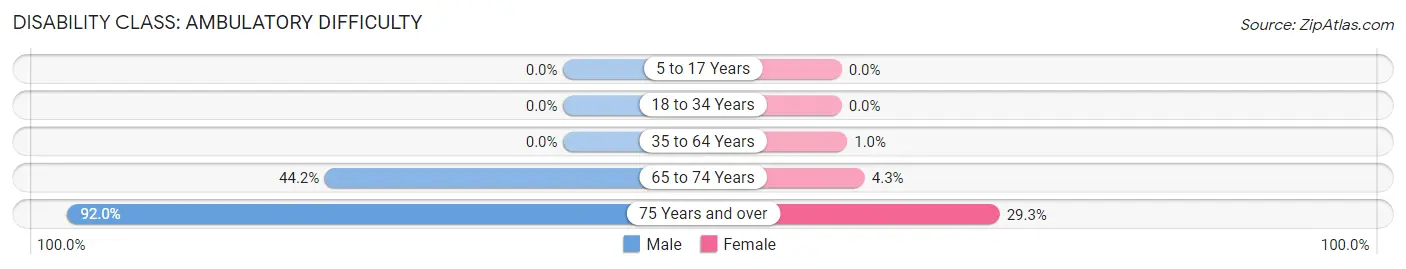
| Age Bracket | Male | Female |
| 5 to 17 Years | 0 (0.0%) | 0 (0.0%) |
| 18 to 34 Years | 0 (0.0%) | 0 (0.0%) |
| 35 to 64 Years | 0 (0.0%) | 5 (1.0%) |
| 65 to 74 Years | 195 (44.2%) | 8 (4.3%) |
| 75 Years and over | 104 (92.0%) | 34 (29.3%) |
Disability Class: Self-Care Difficulty
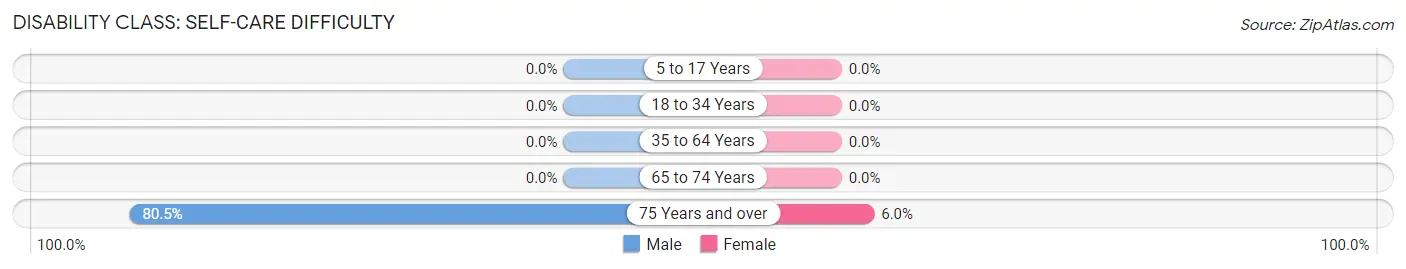
| Age Bracket | Male | Female |
| 5 to 17 Years | 0 (0.0%) | 0 (0.0%) |
| 18 to 34 Years | 0 (0.0%) | 0 (0.0%) |
| 35 to 64 Years | 0 (0.0%) | 0 (0.0%) |
| 65 to 74 Years | 0 (0.0%) | 0 (0.0%) |
| 75 Years and over | 91 (80.5%) | 7 (6.0%) |
Technology Access in Ocean Park
Computing Device Access in Ocean Park
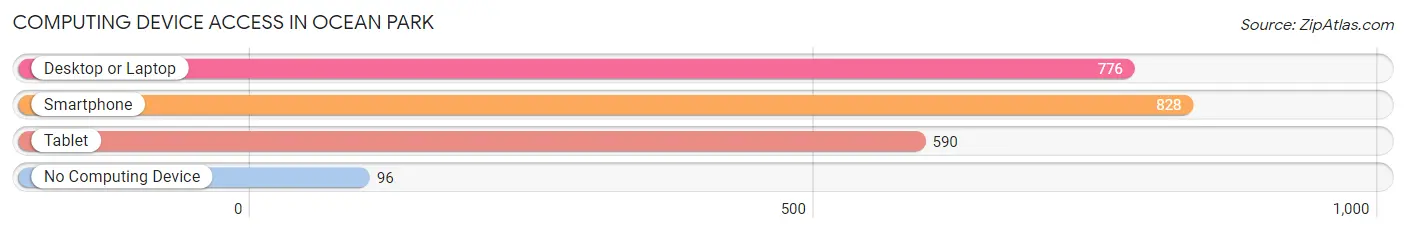
| Device Type | # Households | % Households |
| Desktop or Laptop | 776 | 76.1% |
| Smartphone | 828 | 81.3% |
| Tablet | 590 | 57.9% |
| No Computing Device | 96 | 9.4% |
| Total | 1,019 | 100.0% |
Internet Access in Ocean Park
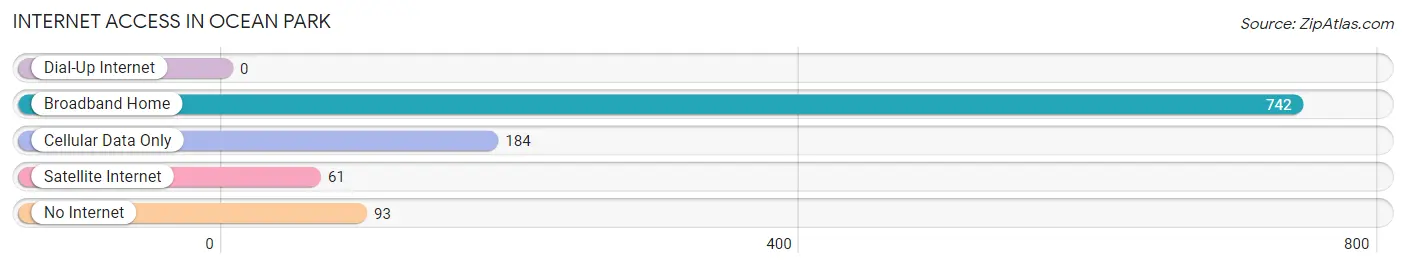
| Internet Type | # Households | % Households |
| Dial-Up Internet | 0 | 0.0% |
| Broadband Home | 742 | 72.8% |
| Cellular Data Only | 184 | 18.1% |
| Satellite Internet | 61 | 6.0% |
| No Internet | 93 | 9.1% |
| Total | 1,019 | 100.0% |
Ocean Park Summary
Park Overview
Located in the Pacific Northwest, Ocean Park is a small unincorporated community in Pacific County, Washington. It is situated on the Long Beach Peninsula, a 28-mile stretch of land that separates the Pacific Ocean from Willapa Bay. The town is home to a population of approximately 1,000 people and is a popular tourist destination due to its beautiful beaches, unique shops, and abundance of outdoor activities.
History
The area that is now Ocean Park was first inhabited by the Chinook Indians, who lived in the area for thousands of years before the arrival of European settlers. The first European settlers arrived in the area in the late 1800s, and the town was officially established in 1891. The town was named after the nearby Ocean Park Hotel, which was built in 1891 and was the first hotel in the area.
In the early 1900s, the town began to grow as more people moved to the area to take advantage of the abundant fishing and logging opportunities. The town was also a popular tourist destination, and many people came to enjoy the beautiful beaches and outdoor activities.
In the 1950s, the town began to decline as the logging industry began to decline and the fishing industry began to suffer from overfishing. The town was also hit hard by the Great Depression, and many people left the area in search of better opportunities.
In the 1970s, the town began to experience a resurgence as more people moved to the area to take advantage of the area’s natural beauty and outdoor activities. The town has since become a popular tourist destination, and many people come to enjoy the beaches, unique shops, and outdoor activities.
Geography
Ocean Park is located on the Long Beach Peninsula, a 28-mile stretch of land that separates the Pacific Ocean from Willapa Bay. The town is situated on the western side of the peninsula, and is bordered by the Pacific Ocean to the west and Willapa Bay to the east. The town is located approximately 80 miles southwest of Seattle and is accessible by car via US Highway 101.
The town is situated on a flat, sandy plain, and is surrounded by lush forests and rolling hills. The area is known for its mild climate, with temperatures rarely dropping below freezing in the winter and rarely rising above 85 degrees in the summer.
Economy
The economy of Ocean Park is largely based on tourism, with many people coming to the area to enjoy the beaches, unique shops, and outdoor activities. The town is also home to a number of small businesses, including restaurants, shops, and art galleries.
The town is also home to a number of fishing and logging operations, which provide employment for many of the town’s residents. The town is also home to a number of seafood processing plants, which process and package seafood for sale in the local area and beyond.
Demographics
As of the 2010 census, the population of Ocean Park was 1,000 people. The town is predominantly white, with approximately 95% of the population identifying as white. The town is also home to a small Hispanic population, with approximately 4% of the population identifying as Hispanic or Latino. The median household income in the town is approximately $45,000, and the median home value is approximately $200,000.
Common Questions
What is Per Capita Income in Ocean Park?
Per Capita income in Ocean Park is $37,221.
What is the Median Family Income in Ocean Park?
Median Family Income in Ocean Park is $92,672.
What is the Median Household income in Ocean Park?
Median Household Income in Ocean Park is $48,945.
What is Income or Wage Gap in Ocean Park?
Income or Wage Gap in Ocean Park is 7.7%.
Women in Ocean Park earn 92.3 cents for every dollar earned by a man.
What is Inequality or Gini Index in Ocean Park?
Inequality or Gini Index in Ocean Park is 0.46.
What is the Total Population of Ocean Park?
Total Population of Ocean Park is 1,906.
What is the Total Male Population of Ocean Park?
Total Male Population of Ocean Park is 1,015.
What is the Total Female Population of Ocean Park?
Total Female Population of Ocean Park is 891.
What is the Ratio of Males per 100 Females in Ocean Park?
There are 113.92 Males per 100 Females in Ocean Park.
What is the Ratio of Females per 100 Males in Ocean Park?
There are 87.78 Females per 100 Males in Ocean Park.
What is the Median Population Age in Ocean Park?
Median Population Age in Ocean Park is 64.0 Years.
What is the Average Family Size in Ocean Park
Average Family Size in Ocean Park is 2.3 People.
What is the Average Household Size in Ocean Park
Average Household Size in Ocean Park is 1.9 People.
How Large is the Labor Force in Ocean Park?
There are 656 People in the Labor Forcein in Ocean Park.
What is the Percentage of People in the Labor Force in Ocean Park?
36.3% of People are in the Labor Force in Ocean Park.
What is the Unemployment Rate in Ocean Park?
Unemployment Rate in Ocean Park is 8.2%.