Zip Codes with the Highest Percentage of Population Employed in Farming, Fishing & Forestry in Snohomish, WA
RELATED REPORTS & OPTIONS
Farming, Fishing & Forestry
Snohomish
Compare Zip Codes
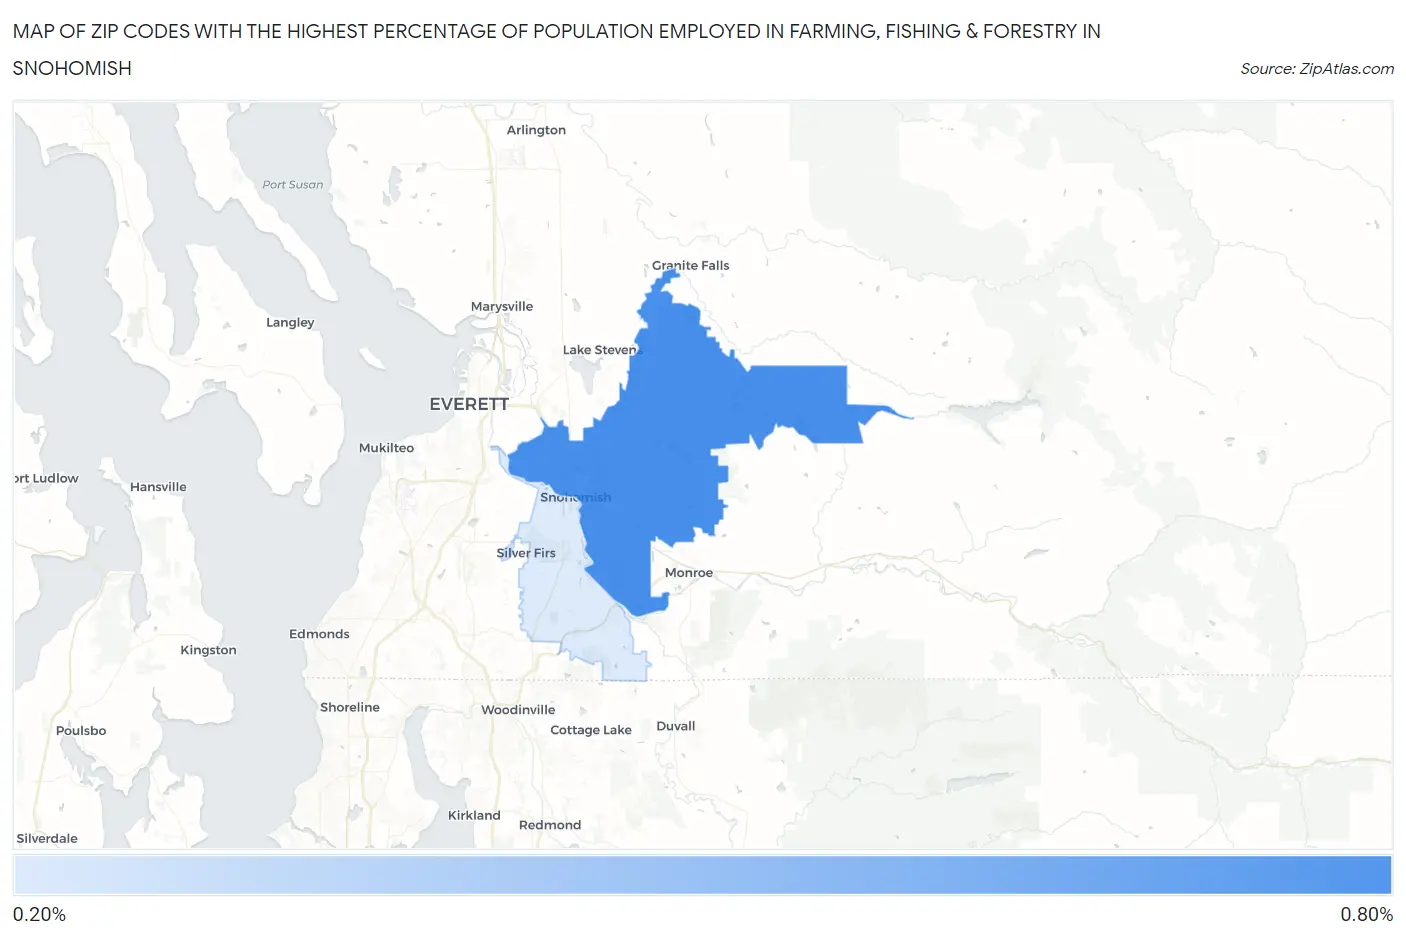
Map of Zip Codes with the Highest Percentage of Population Employed in Farming, Fishing & Forestry in Snohomish
0.22%
0.76%
Zip Codes with the Highest Percentage of Population Employed in Farming, Fishing & Forestry in Snohomish, WA
| Zip Code | % Employed | vs State | vs National | |
| 1. | 98290 | 0.76% | 1.5%(-0.753)#267 | 0.61%(+0.152)#11,034 |
| 2. | 98296 | 0.22% | 1.5%(-1.29)#371 | 0.61%(-0.386)#15,847 |
1
Common Questions
What are the Top Zip Codes with the Highest Percentage of Population Employed in Farming, Fishing & Forestry in Snohomish, WA?
Top Zip Codes with the Highest Percentage of Population Employed in Farming, Fishing & Forestry in Snohomish, WA are:
What zip code has the Highest Percentage of Population Employed in Farming, Fishing & Forestry in Snohomish, WA?
98290 has the Highest Percentage of Population Employed in Farming, Fishing & Forestry in Snohomish, WA with 0.76%.
What is the Percentage of Population Employed in Farming, Fishing & Forestry in Snohomish, WA?
Percentage of Population Employed in Farming, Fishing & Forestry in Snohomish is 1.2%.
What is the Percentage of Population Employed in Farming, Fishing & Forestry in Washington?
Percentage of Population Employed in Farming, Fishing & Forestry in Washington is 1.5%.
What is the Percentage of Population Employed in Farming, Fishing & Forestry in the United States?
Percentage of Population Employed in Farming, Fishing & Forestry in the United States is 0.61%.