Granger, WA Map & Demographics
Granger Map
Granger Overview
$16,568
PER CAPITA INCOME
$52,262
AVG FAMILY INCOME
$54,167
AVG HOUSEHOLD INCOME
43.1%
WAGE / INCOME GAP [ % ]
56.9¢/ $1
WAGE / INCOME GAP [ $ ]
$12,579
FAMILY INCOME DEFICIT
0.40
INEQUALITY / GINI INDEX
3,632
TOTAL POPULATION
1,914
MALE POPULATION
1,718
FEMALE POPULATION
111.41
MALES / 100 FEMALES
89.76
FEMALES / 100 MALES
21.9
MEDIAN AGE
4.5
AVG FAMILY SIZE
4.3
AVG HOUSEHOLD SIZE
1,646
LABOR FORCE [ PEOPLE ]
69.0%
PERCENT IN LABOR FORCE
16.7%
UNEMPLOYMENT RATE
Granger Zip Codes
Granger Area Codes
Income in Granger
Income Overview in Granger
Per Capita Income in Granger is $16,568, while median incomes of families and households are $52,262 and $54,167 respectively.
| Characteristic | Number | Measure |
| Per Capita Income | 3,632 | $16,568 |
| Median Family Income | 718 | $52,262 |
| Mean Family Income | 718 | $62,120 |
| Median Household Income | 842 | $54,167 |
| Mean Household Income | 842 | $68,181 |
| Income Deficit | 718 | $12,579 |
| Wage / Income Gap (%) | 3,632 | 43.07% |
| Wage / Income Gap ($) | 3,632 | 56.93¢ per $1 |
| Gini / Inequality Index | 3,632 | 0.40 |
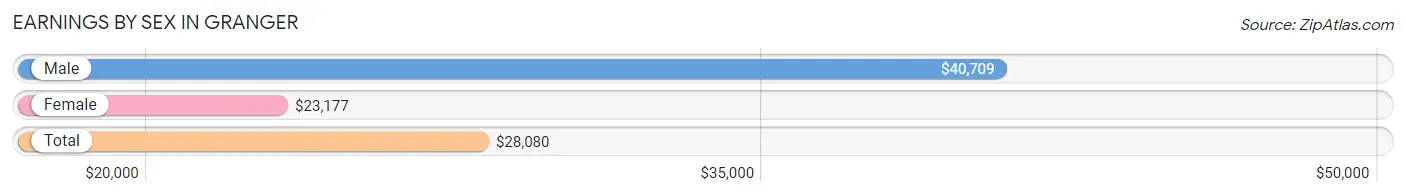
Earnings by Sex in Granger
Average Earnings in Granger are $28,080, $40,709 for men and $23,177 for women, a difference of 43.1%.
| Sex | Number | Average Earnings |
| Male | 836 (51.5%) | $40,709 |
| Female | 786 (48.5%) | $23,177 |
| Total | 1,622 (100.0%) | $28,080 |
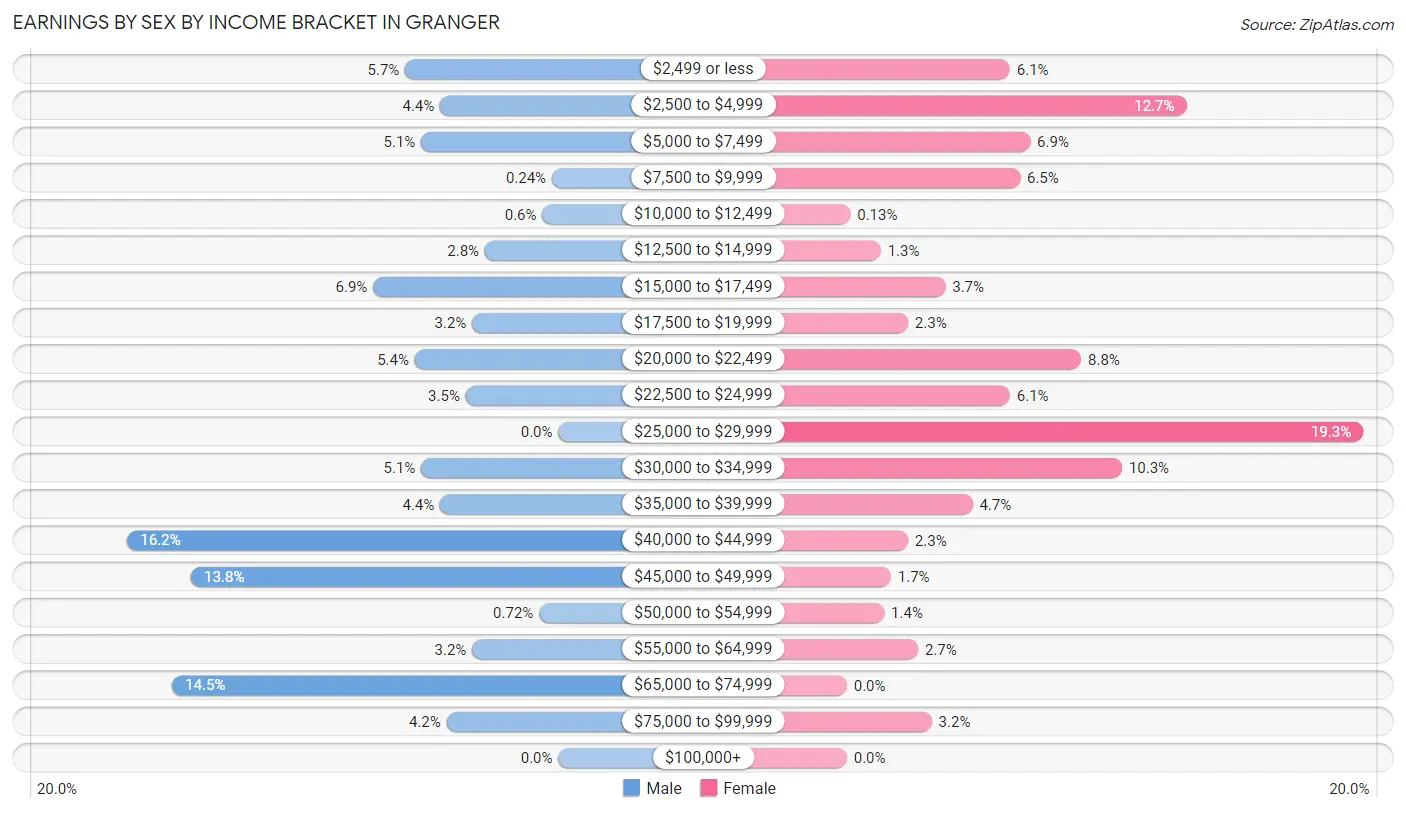
Earnings by Sex by Income Bracket in Granger
The most common earnings brackets in Granger are $40,000 to $44,999 for men (135 | 16.2%) and $25,000 to $29,999 for women (152 | 19.3%).
| Income | Male | Female |
| $2,499 or less | 48 (5.7%) | 48 (6.1%) |
| $2,500 to $4,999 | 37 (4.4%) | 100 (12.7%) |
| $5,000 to $7,499 | 43 (5.1%) | 54 (6.9%) |
| $7,500 to $9,999 | 2 (0.2%) | 51 (6.5%) |
| $10,000 to $12,499 | 5 (0.6%) | 1 (0.1%) |
| $12,500 to $14,999 | 23 (2.8%) | 10 (1.3%) |
| $15,000 to $17,499 | 58 (6.9%) | 29 (3.7%) |
| $17,500 to $19,999 | 27 (3.2%) | 18 (2.3%) |
| $20,000 to $22,499 | 45 (5.4%) | 69 (8.8%) |
| $22,500 to $24,999 | 29 (3.5%) | 48 (6.1%) |
| $25,000 to $29,999 | 0 (0.0%) | 152 (19.3%) |
| $30,000 to $34,999 | 43 (5.1%) | 81 (10.3%) |
| $35,000 to $39,999 | 37 (4.4%) | 37 (4.7%) |
| $40,000 to $44,999 | 135 (16.2%) | 18 (2.3%) |
| $45,000 to $49,999 | 115 (13.8%) | 13 (1.7%) |
| $50,000 to $54,999 | 6 (0.7%) | 11 (1.4%) |
| $55,000 to $64,999 | 27 (3.2%) | 21 (2.7%) |
| $65,000 to $74,999 | 121 (14.5%) | 0 (0.0%) |
| $75,000 to $99,999 | 35 (4.2%) | 25 (3.2%) |
| $100,000+ | 0 (0.0%) | 0 (0.0%) |
| Total | 836 (100.0%) | 786 (100.0%) |
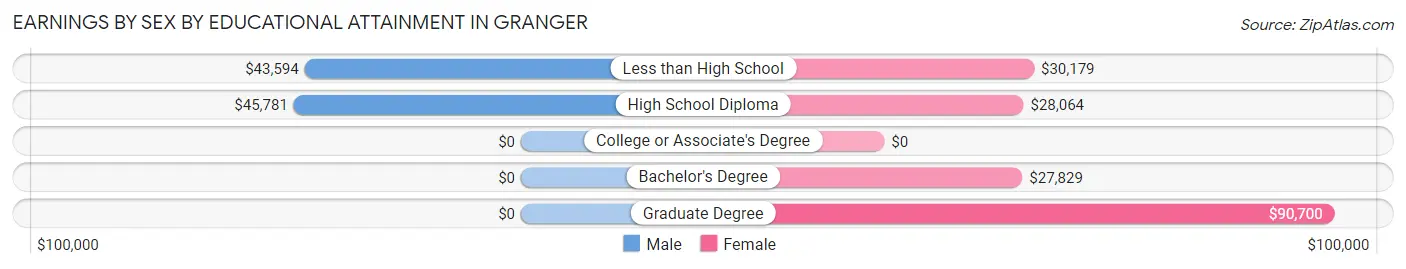
Earnings by Sex by Educational Attainment in Granger
Average earnings in Granger are $43,776 for men and $28,047 for women, a difference of 35.9%. Men with an educational attainment of high school diploma enjoy the highest average annual earnings of $45,781, while those with less than high school education earn the least with $43,594. Women with an educational attainment of graduate degree earn the most with the average annual earnings of $90,700, while those with bachelor's degree education have the smallest earnings of $27,829.
| Educational Attainment | Male Income | Female Income |
| Less than High School | $43,594 | $30,179 |
| High School Diploma | $45,781 | $28,064 |
| College or Associate's Degree | - | - |
| Bachelor's Degree | - | - |
| Graduate Degree | - | - |
| Total | $43,776 | $28,047 |
Family Income in Granger
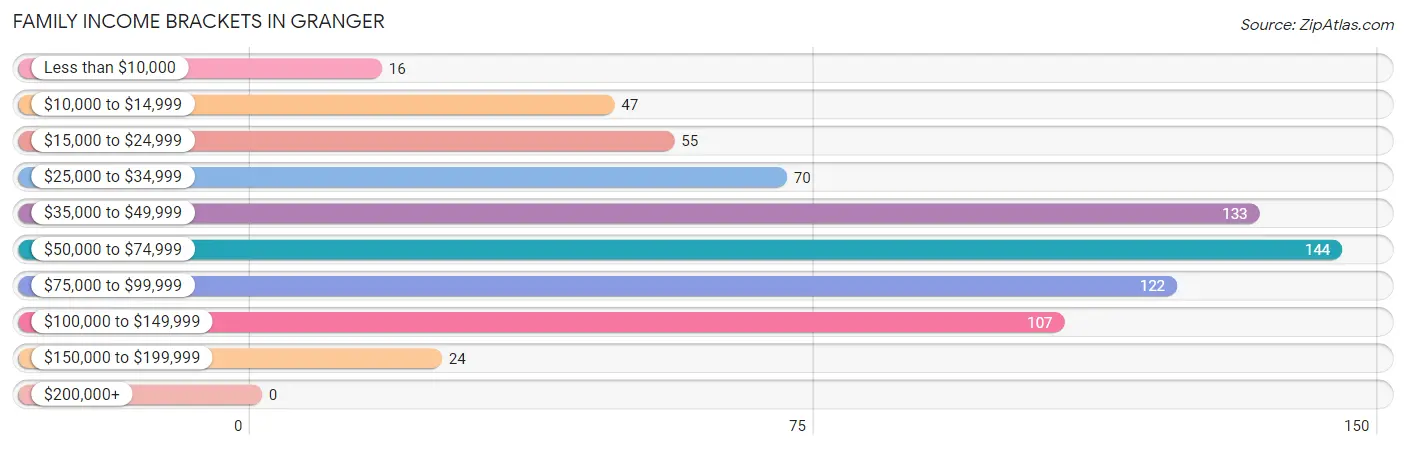
Family Income Brackets in Granger
According to the Granger family income data, there are 144 families falling into the $50,000 to $74,999 income range, which is the most common income bracket and makes up 20.1% of all families.
| Income Bracket | # Families | % Families |
| Less than $10,000 | 16 | 2.2% |
| $10,000 to $14,999 | 47 | 6.5% |
| $15,000 to $24,999 | 55 | 7.7% |
| $25,000 to $34,999 | 70 | 9.7% |
| $35,000 to $49,999 | 133 | 18.5% |
| $50,000 to $74,999 | 144 | 20.1% |
| $75,000 to $99,999 | 122 | 17.0% |
| $100,000 to $149,999 | 107 | 14.9% |
| $150,000 to $199,999 | 24 | 3.3% |
| $200,000+ | 0 | 0.0% |
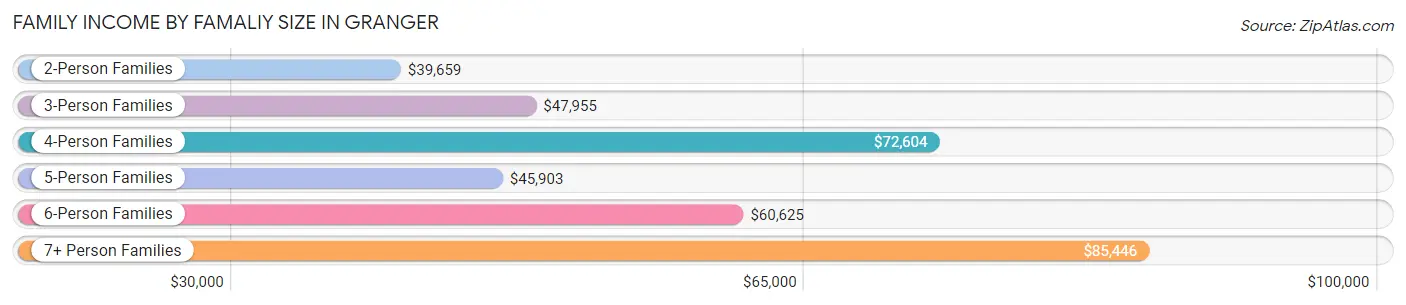
Family Income by Famaliy Size in Granger
7+ person families (69 | 9.6%) account for the highest median family income in Granger with $85,446 per family, while 2-person families (100 | 13.9%) have the highest median income of $19,830 per family member.
| Income Bracket | # Families | Median Income |
| 2-Person Families | 100 (13.9%) | $39,659 |
| 3-Person Families | 134 (18.7%) | $47,955 |
| 4-Person Families | 211 (29.4%) | $72,604 |
| 5-Person Families | 138 (19.2%) | $45,903 |
| 6-Person Families | 66 (9.2%) | $60,625 |
| 7+ Person Families | 69 (9.6%) | $85,446 |
| Total | 718 (100.0%) | $52,262 |
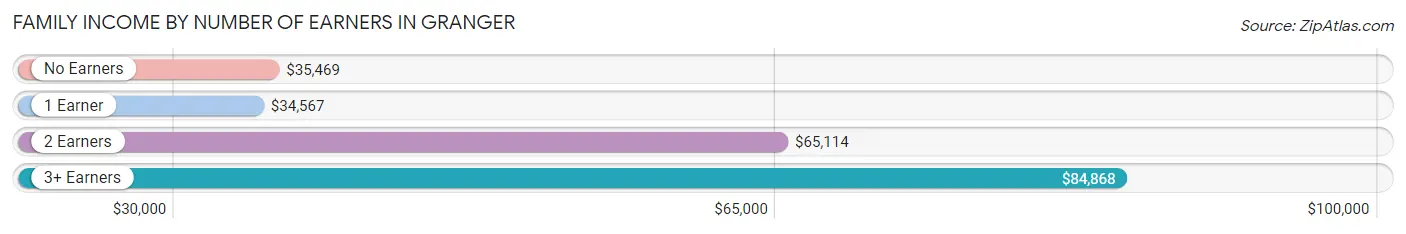
Family Income by Number of Earners in Granger
The median family income in Granger is $52,262, with families comprising 3+ earners (162) having the highest median family income of $84,868, while families with 1 earner (209) have the lowest median family income of $34,567, accounting for 22.6% and 29.1% of families, respectively.
| Number of Earners | # Families | Median Income |
| No Earners | 42 (5.9%) | $35,469 |
| 1 Earner | 209 (29.1%) | $34,567 |
| 2 Earners | 305 (42.5%) | $65,114 |
| 3+ Earners | 162 (22.6%) | $84,868 |
| Total | 718 (100.0%) | $52,262 |
Household Income in Granger
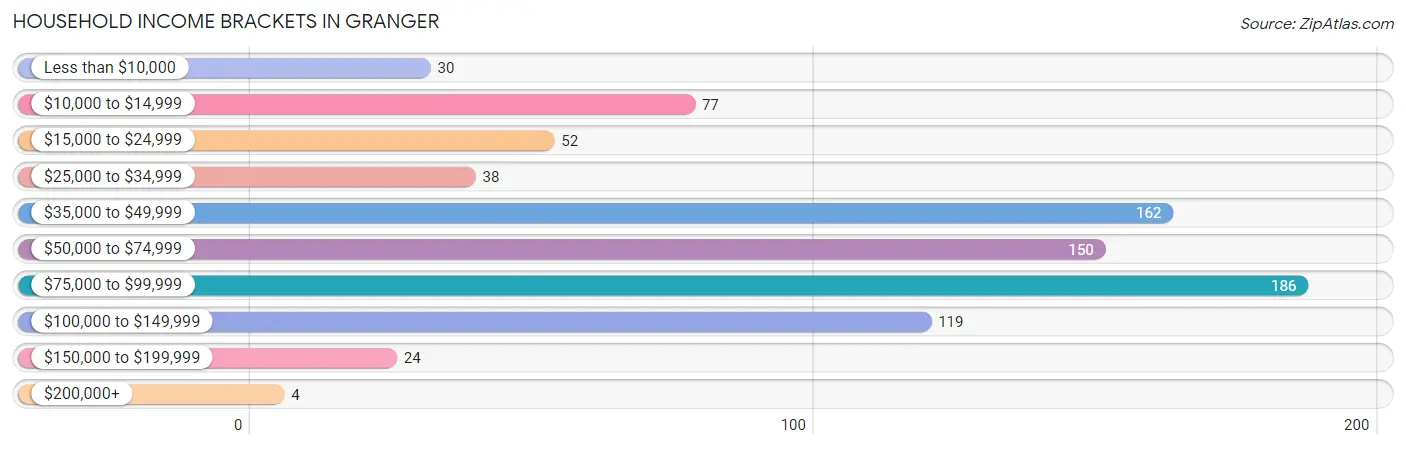
Household Income Brackets in Granger
With 186 households falling in the category, the $75,000 to $99,999 income range is the most frequent in Granger, accounting for 22.1% of all households. In contrast, only 4 households (0.5%) fall into the $200,000+ income bracket, making it the least populous group.
| Income Bracket | # Households | % Households |
| Less than $10,000 | 30 | 3.6% |
| $10,000 to $14,999 | 77 | 9.1% |
| $15,000 to $24,999 | 52 | 6.2% |
| $25,000 to $34,999 | 38 | 4.5% |
| $35,000 to $49,999 | 162 | 19.2% |
| $50,000 to $74,999 | 150 | 17.8% |
| $75,000 to $99,999 | 186 | 22.1% |
| $100,000 to $149,999 | 119 | 14.1% |
| $150,000 to $199,999 | 24 | 2.9% |
| $200,000+ | 4 | 0.5% |
Household Income by Householder Age in Granger
The median household income in Granger is $54,167, with the highest median household income of $65,455 found in the 45 to 64 years age bracket for the primary householder. A total of 248 households (29.4%) fall into this category. Meanwhile, the 65+ years age bracket for the primary householder has the lowest median household income of $36,328, with 143 households (17.0%) in this group.
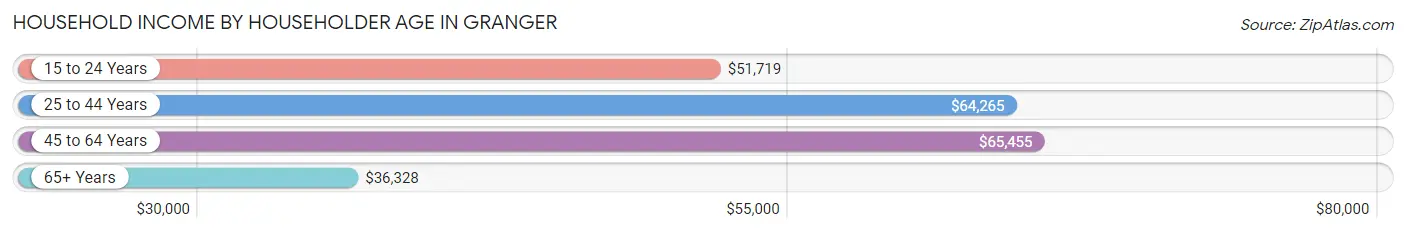
| Income Bracket | # Households | Median Income |
| 15 to 24 Years | 87 (10.3%) | $51,719 |
| 25 to 44 Years | 364 (43.2%) | $64,265 |
| 45 to 64 Years | 248 (29.4%) | $65,455 |
| 65+ Years | 143 (17.0%) | $36,328 |
| Total | 842 (100.0%) | $54,167 |
Poverty in Granger
Income Below Poverty by Sex and Age in Granger
With 14.6% poverty level for males and 28.2% for females among the residents of Granger, 5 year old males and 75 year old and over females are the most vulnerable to poverty, with 11 males (50.0%) and 6 females (66.7%) in their respective age groups living below the poverty level.
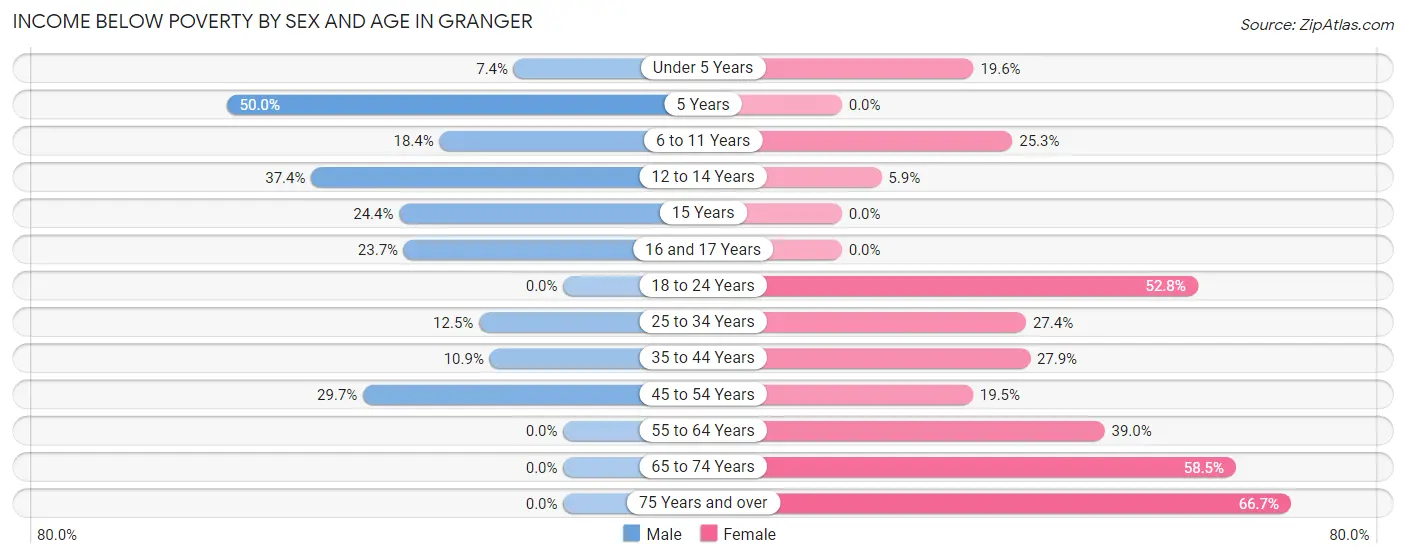
| Age Bracket | Male | Female |
| Under 5 Years | 5 (7.3%) | 35 (19.6%) |
| 5 Years | 11 (50.0%) | 0 (0.0%) |
| 6 to 11 Years | 57 (18.4%) | 60 (25.3%) |
| 12 to 14 Years | 70 (37.4%) | 6 (5.9%) |
| 15 Years | 19 (24.4%) | 0 (0.0%) |
| 16 and 17 Years | 36 (23.7%) | 0 (0.0%) |
| 18 to 24 Years | 0 (0.0%) | 140 (52.8%) |
| 25 to 34 Years | 21 (12.5%) | 61 (27.4%) |
| 35 to 44 Years | 27 (10.9%) | 69 (27.9%) |
| 45 to 54 Years | 33 (29.7%) | 36 (19.5%) |
| 55 to 64 Years | 0 (0.0%) | 16 (39.0%) |
| 65 to 74 Years | 0 (0.0%) | 55 (58.5%) |
| 75 Years and over | 0 (0.0%) | 6 (66.7%) |
| Total | 279 (14.6%) | 484 (28.2%) |
Income Above Poverty by Sex and Age in Granger
According to the poverty statistics in Granger, males aged 18 to 24 years and females aged 5 years are the age groups that are most secure financially, with 100.0% of males and 100.0% of females in these age groups living above the poverty line.
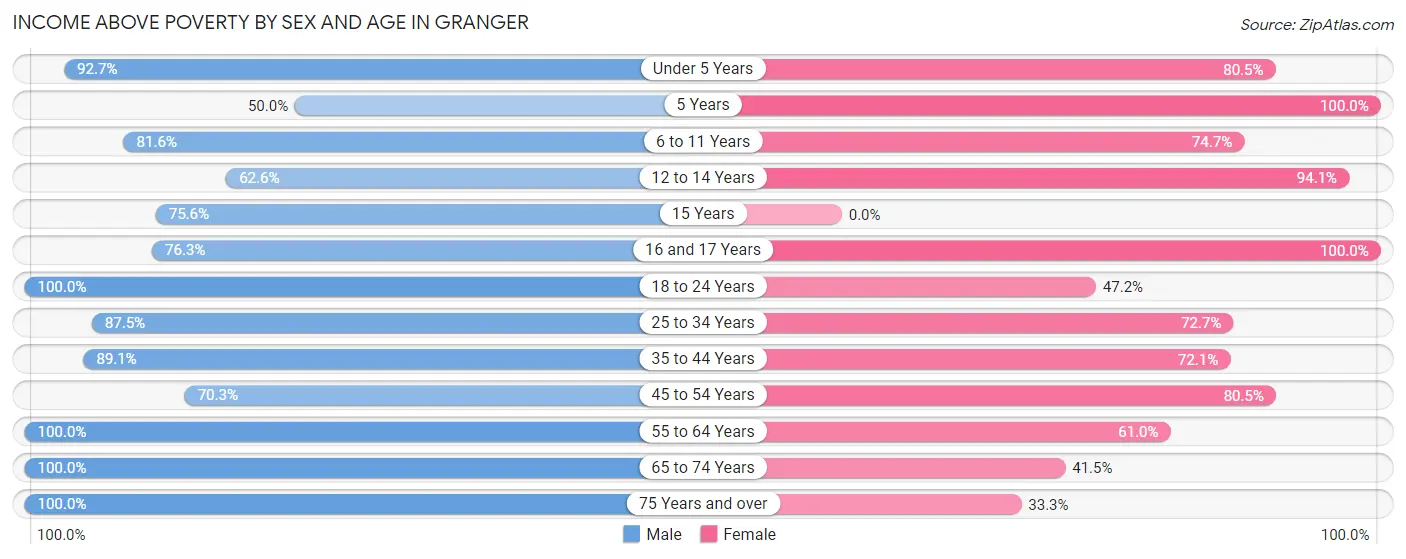
| Age Bracket | Male | Female |
| Under 5 Years | 63 (92.6%) | 144 (80.4%) |
| 5 Years | 11 (50.0%) | 63 (100.0%) |
| 6 to 11 Years | 253 (81.6%) | 177 (74.7%) |
| 12 to 14 Years | 117 (62.6%) | 96 (94.1%) |
| 15 Years | 59 (75.6%) | 0 (0.0%) |
| 16 and 17 Years | 116 (76.3%) | 73 (100.0%) |
| 18 to 24 Years | 359 (100.0%) | 125 (47.2%) |
| 25 to 34 Years | 147 (87.5%) | 162 (72.7%) |
| 35 to 44 Years | 220 (89.1%) | 178 (72.1%) |
| 45 to 54 Years | 78 (70.3%) | 149 (80.5%) |
| 55 to 64 Years | 64 (100.0%) | 25 (61.0%) |
| 65 to 74 Years | 119 (100.0%) | 39 (41.5%) |
| 75 Years and over | 29 (100.0%) | 3 (33.3%) |
| Total | 1,635 (85.4%) | 1,234 (71.8%) |
Income Below Poverty Among Married-Couple Families in Granger
The poverty statistics for married-couple families in Granger show that 8.0% or 32 of the total 400 families live below the poverty line. Families with 1 or 2 children have the highest poverty rate of 13.4%, comprising of 26 families. On the other hand, families with no children have the lowest poverty rate of 0.0%, which includes 0 families.
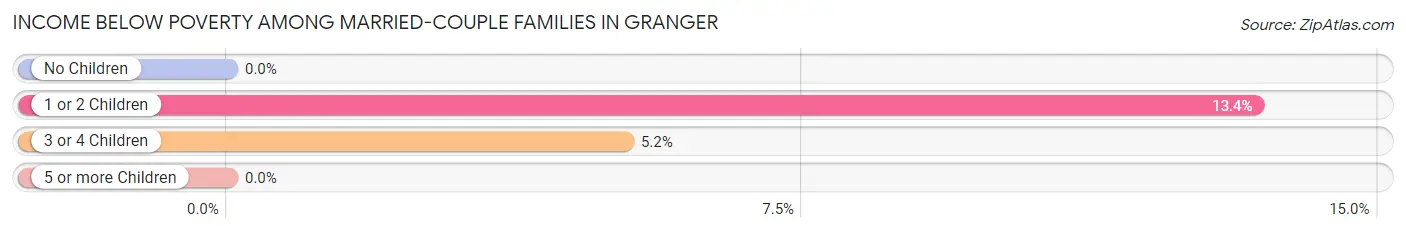
| Children | Above Poverty | Below Poverty |
| No Children | 73 (100.0%) | 0 (0.0%) |
| 1 or 2 Children | 168 (86.6%) | 26 (13.4%) |
| 3 or 4 Children | 110 (94.8%) | 6 (5.2%) |
| 5 or more Children | 17 (100.0%) | 0 (0.0%) |
| Total | 368 (92.0%) | 32 (8.0%) |
Income Below Poverty Among Single-Parent Households in Granger
According to the poverty data in Granger, 18.3% or 21 single-father households and 45.8% or 93 single-mother households are living below the poverty line. Among single-father households, those with 1 or 2 children have the highest poverty rate, with 12 households (26.7%) experiencing poverty. Likewise, among single-mother households, those with 1 or 2 children have the highest poverty rate, with 72 households (58.5%) falling below the poverty line.
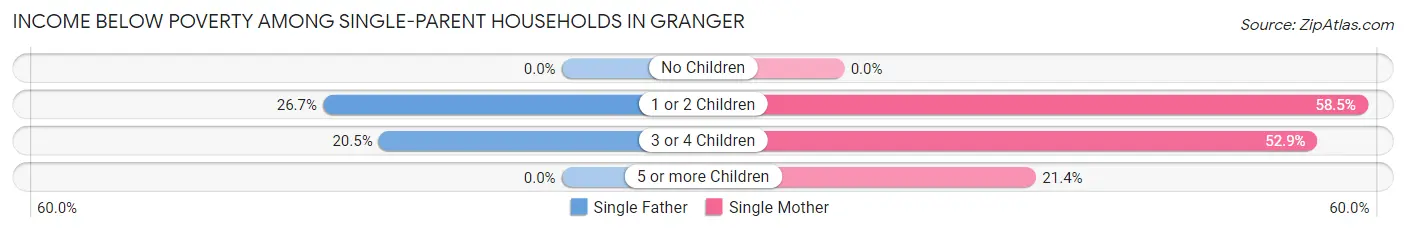
| Children | Single Father | Single Mother |
| No Children | 0 (0.0%) | 0 (0.0%) |
| 1 or 2 Children | 12 (26.7%) | 72 (58.5%) |
| 3 or 4 Children | 9 (20.4%) | 18 (52.9%) |
| 5 or more Children | 0 (0.0%) | 3 (21.4%) |
| Total | 21 (18.3%) | 93 (45.8%) |
Income Below Poverty Among Married-Couple vs Single-Parent Households in Granger
The poverty data for Granger shows that 32 of the married-couple family households (8.0%) and 114 of the single-parent households (35.8%) are living below the poverty level. Within the married-couple family households, those with 1 or 2 children have the highest poverty rate, with 26 households (13.4%) falling below the poverty line. Among the single-parent households, those with 1 or 2 children have the highest poverty rate, with 84 household (50.0%) living below poverty.
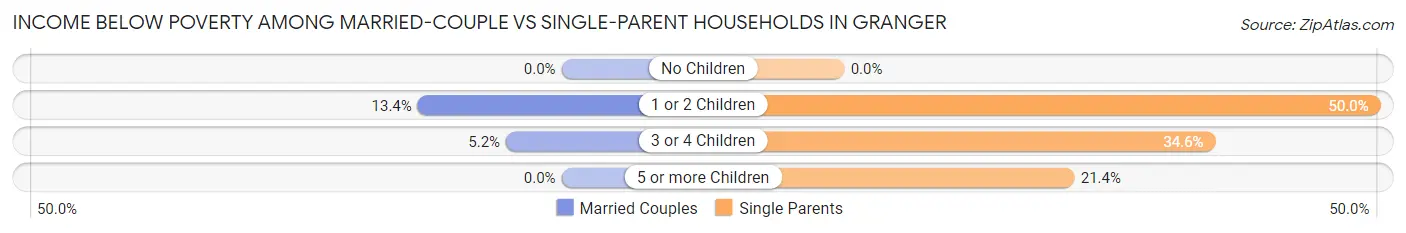
| Children | Married-Couple Families | Single-Parent Households |
| No Children | 0 (0.0%) | 0 (0.0%) |
| 1 or 2 Children | 26 (13.4%) | 84 (50.0%) |
| 3 or 4 Children | 6 (5.2%) | 27 (34.6%) |
| 5 or more Children | 0 (0.0%) | 3 (21.4%) |
| Total | 32 (8.0%) | 114 (35.8%) |
Race in Granger
The most populous races in Granger are Hispanic or Latino (3,400 | 93.6%), White / Caucasian (1,690 | 46.5%), and Two or more Races (1,214 | 33.4%).
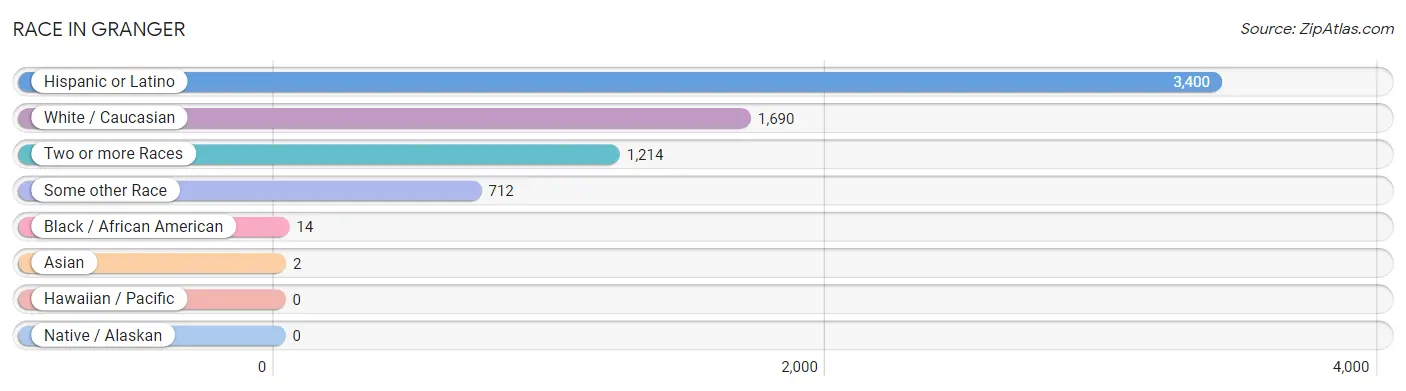
| Race | # Population | % Population |
| Asian | 2 | 0.1% |
| Black / African American | 14 | 0.4% |
| Hawaiian / Pacific | 0 | 0.0% |
| Hispanic or Latino | 3,400 | 93.6% |
| Native / Alaskan | 0 | 0.0% |
| White / Caucasian | 1,690 | 46.5% |
| Two or more Races | 1,214 | 33.4% |
| Some other Race | 712 | 19.6% |
| Total | 3,632 | 100.0% |
Ancestry in Granger
The most populous ancestries reported in Granger are Mexican (3,349 | 92.2%), European (79 | 2.2%), German (51 | 1.4%), English (48 | 1.3%), and Irish (39 | 1.1%), together accounting for 98.2% of all Granger residents.
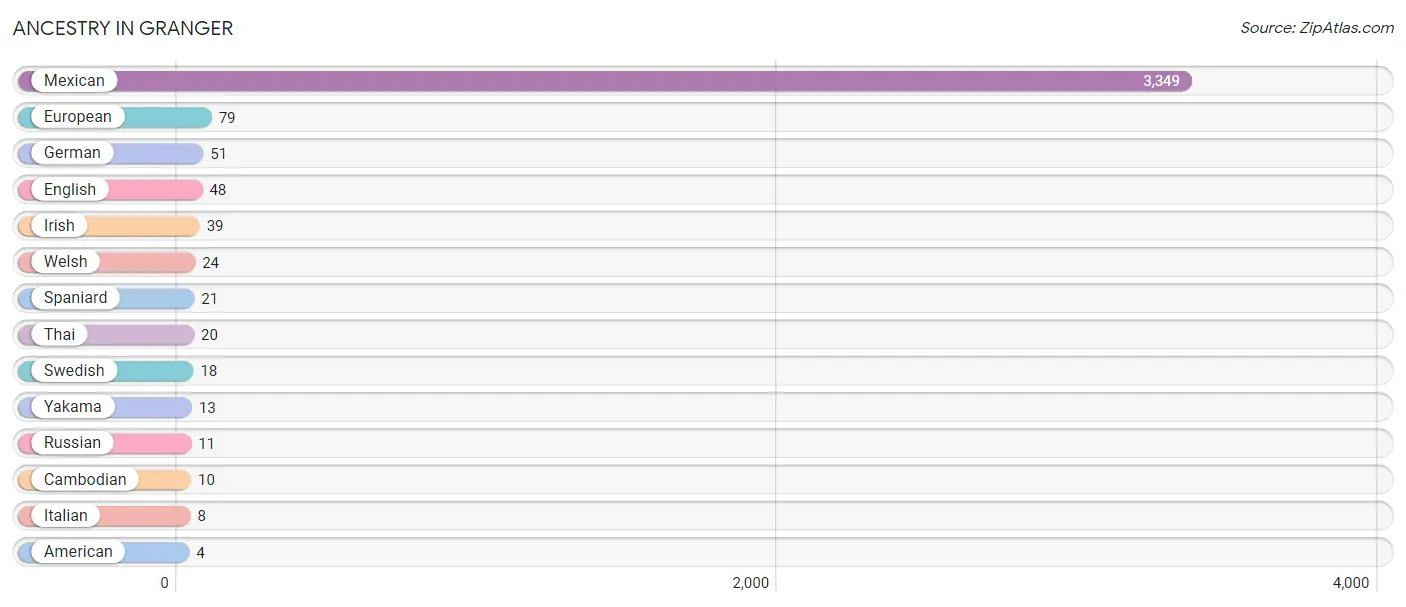
| Ancestry | # Population | % Population |
| American | 4 | 0.1% |
| Cambodian | 10 | 0.3% |
| English | 48 | 1.3% |
| European | 79 | 2.2% |
| German | 51 | 1.4% |
| Irish | 39 | 1.1% |
| Italian | 8 | 0.2% |
| Mexican | 3,349 | 92.2% |
| Russian | 11 | 0.3% |
| Spaniard | 21 | 0.6% |
| Swedish | 18 | 0.5% |
| Thai | 20 | 0.5% |
| Welsh | 24 | 0.7% |
| Yakama | 13 | 0.4% | View All 14 Rows |
Immigrants in Granger
The most numerous immigrant groups reported in Granger came from Central America (897 | 24.7%), Latin America (897 | 24.7%), Mexico (897 | 24.7%), Asia (2 | 0.1%), and India (2 | 0.1%), together accounting for 74.2% of all Granger residents.
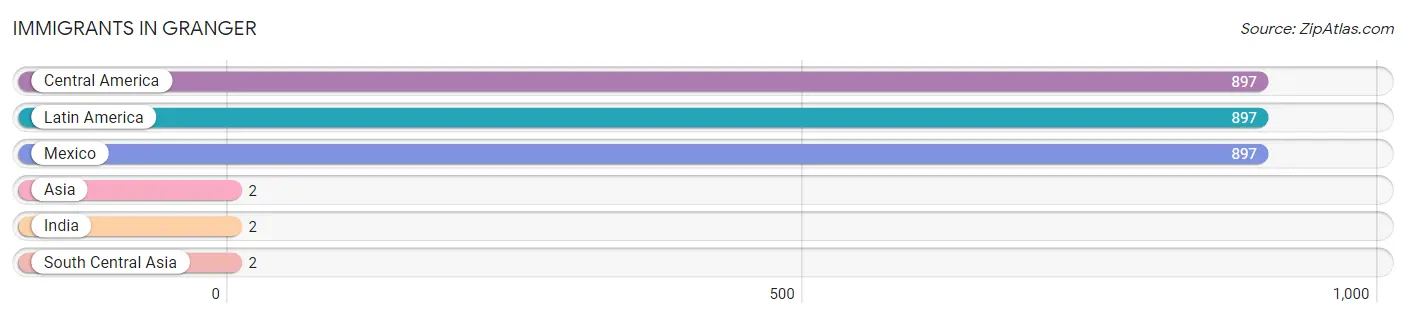
| Immigration Origin | # Population | % Population |
| Asia | 2 | 0.1% |
| Central America | 897 | 24.7% |
| India | 2 | 0.1% |
| Latin America | 897 | 24.7% |
| Mexico | 897 | 24.7% |
| South Central Asia | 2 | 0.1% | View All 6 Rows |
Sex and Age in Granger
Sex and Age in Granger
The most populous age groups in Granger are 15 to 19 Years (339 | 17.7%) for men and 5 to 9 Years (254 | 14.8%) for women.
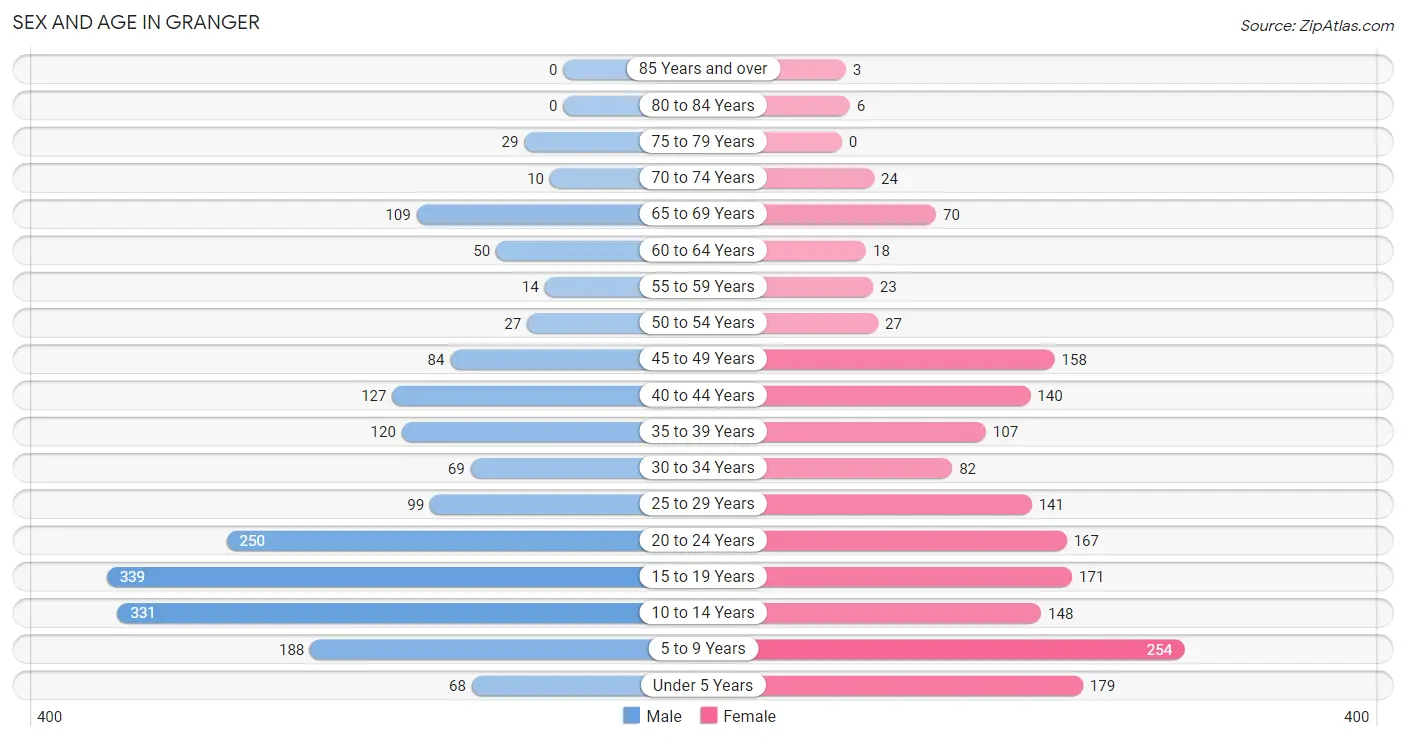
| Age Bracket | Male | Female |
| Under 5 Years | 68 (3.5%) | 179 (10.4%) |
| 5 to 9 Years | 188 (9.8%) | 254 (14.8%) |
| 10 to 14 Years | 331 (17.3%) | 148 (8.6%) |
| 15 to 19 Years | 339 (17.7%) | 171 (10.0%) |
| 20 to 24 Years | 250 (13.1%) | 167 (9.7%) |
| 25 to 29 Years | 99 (5.2%) | 141 (8.2%) |
| 30 to 34 Years | 69 (3.6%) | 82 (4.8%) |
| 35 to 39 Years | 120 (6.3%) | 107 (6.2%) |
| 40 to 44 Years | 127 (6.6%) | 140 (8.2%) |
| 45 to 49 Years | 84 (4.4%) | 158 (9.2%) |
| 50 to 54 Years | 27 (1.4%) | 27 (1.6%) |
| 55 to 59 Years | 14 (0.7%) | 23 (1.3%) |
| 60 to 64 Years | 50 (2.6%) | 18 (1.1%) |
| 65 to 69 Years | 109 (5.7%) | 70 (4.1%) |
| 70 to 74 Years | 10 (0.5%) | 24 (1.4%) |
| 75 to 79 Years | 29 (1.5%) | 0 (0.0%) |
| 80 to 84 Years | 0 (0.0%) | 6 (0.4%) |
| 85 Years and over | 0 (0.0%) | 3 (0.2%) |
| Total | 1,914 (100.0%) | 1,718 (100.0%) |
Families and Households in Granger
Median Family Size in Granger
The median family size in Granger is 4.51 persons per family, with married-couple families (400 | 55.7%) accounting for the largest median family size of 4.96 persons per family. On the other hand, single female/mother families (203 | 28.3%) represent the smallest median family size with 3.95 persons per family.
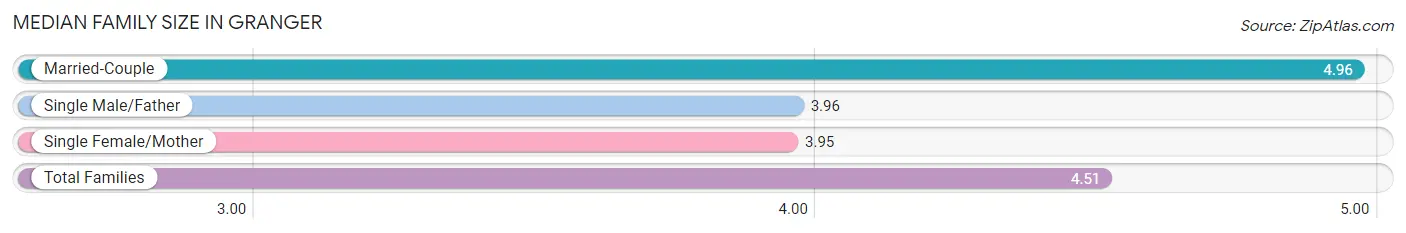
| Family Type | # Families | Family Size |
| Married-Couple | 400 (55.7%) | 4.96 |
| Single Male/Father | 115 (16.0%) | 3.96 |
| Single Female/Mother | 203 (28.3%) | 3.95 |
| Total Families | 718 (100.0%) | 4.51 |
Median Household Size in Granger
The median household size in Granger is 4.29 persons per household, with married-couple households (400 | 47.5%) accounting for the largest median household size of 4.99 persons per household. non-family households (124 | 14.7%) represent the smallest median household size with 1.51 persons per household.
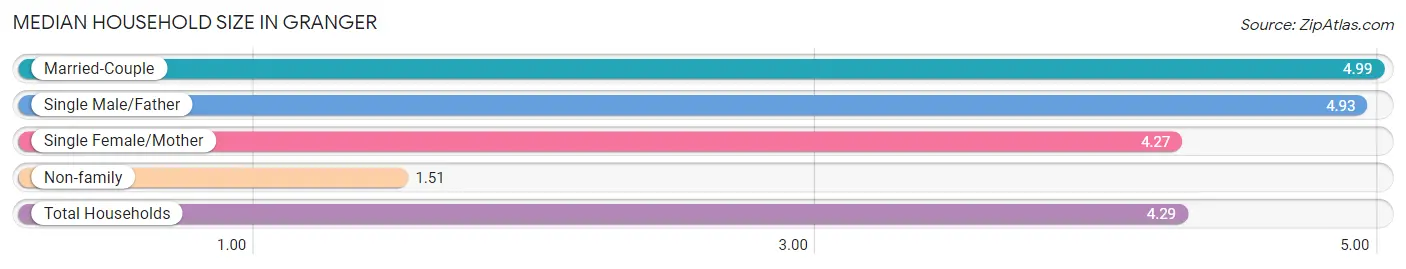
| Household Type | # Households | Household Size |
| Married-Couple | 400 (47.5%) | 4.99 |
| Single Male/Father | 115 (13.7%) | 4.93 |
| Single Female/Mother | 203 (24.1%) | 4.27 |
| Non-family | 124 (14.7%) | 1.51 |
| Total Households | 842 (100.0%) | 4.29 |
Household Size by Marriage Status in Granger
Out of a total of 842 households in Granger, 718 (85.3%) are family households, while 124 (14.7%) are nonfamily households. The most numerous type of family households are 4-person households, comprising 205, and the most common type of nonfamily households are 1-person households, comprising 63.
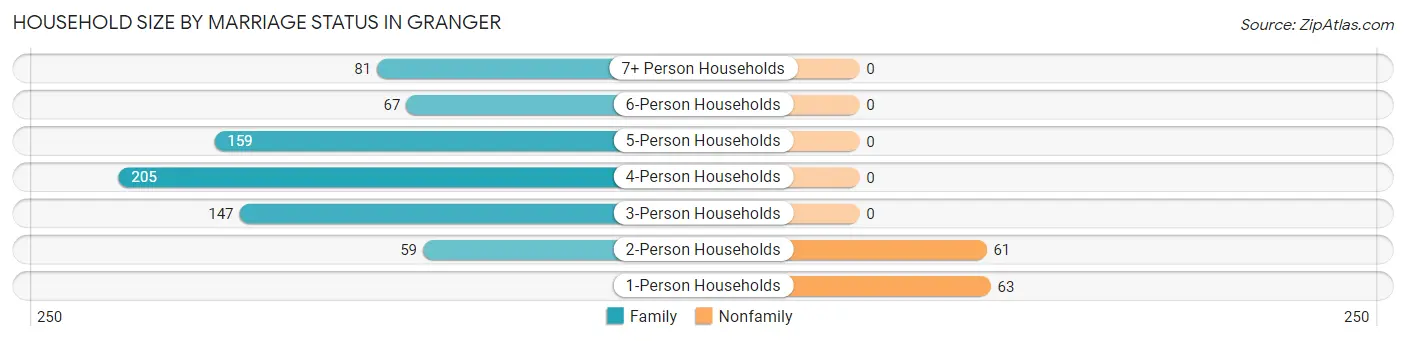
| Household Size | Family Households | Nonfamily Households |
| 1-Person Households | - | 63 (7.5%) |
| 2-Person Households | 59 (7.0%) | 61 (7.2%) |
| 3-Person Households | 147 (17.5%) | 0 (0.0%) |
| 4-Person Households | 205 (24.3%) | 0 (0.0%) |
| 5-Person Households | 159 (18.9%) | 0 (0.0%) |
| 6-Person Households | 67 (8.0%) | 0 (0.0%) |
| 7+ Person Households | 81 (9.6%) | 0 (0.0%) |
| Total | 718 (85.3%) | 124 (14.7%) |
Female Fertility in Granger
Fertility by Age in Granger
Average fertility rate in Granger is 67.0 births per 1,000 women. Women in the age bracket of 20 to 34 years have the highest fertility rate with 159.0 births per 1,000 women. Women in the age bracket of 20 to 34 years acount for 93.9% of all women with births.
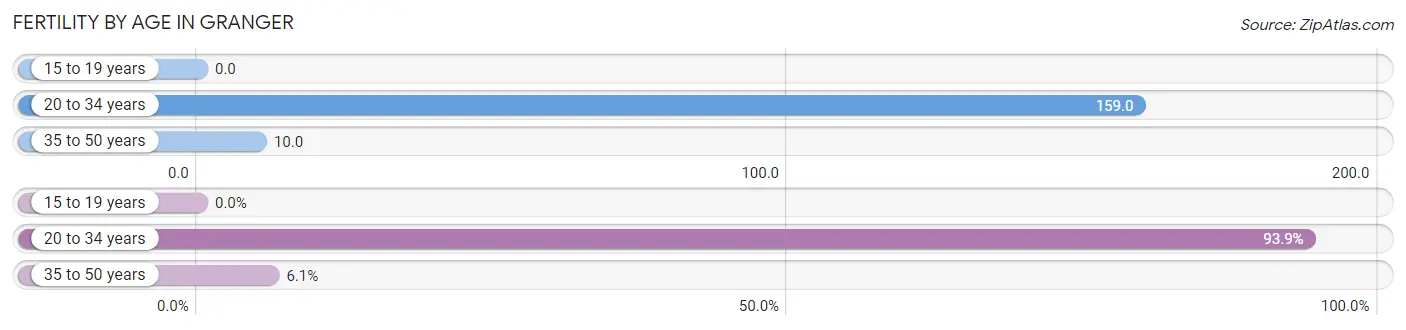
| Age Bracket | Women with Births | Births / 1,000 Women |
| 15 to 19 years | 0 (0.0%) | 0.0 |
| 20 to 34 years | 62 (93.9%) | 159.0 |
| 35 to 50 years | 4 (6.1%) | 10.0 |
| Total | 66 (100.0%) | 67.0 |
Fertility by Age by Marriage Status in Granger
19.7% of women with births (66) in Granger are married. The highest percentage of unmarried women with births falls into 35 to 50 years age bracket with 100.0% of them unmarried at the time of birth, while the lowest percentage of unmarried women with births belong to 20 to 34 years age bracket with 79.0% of them unmarried.
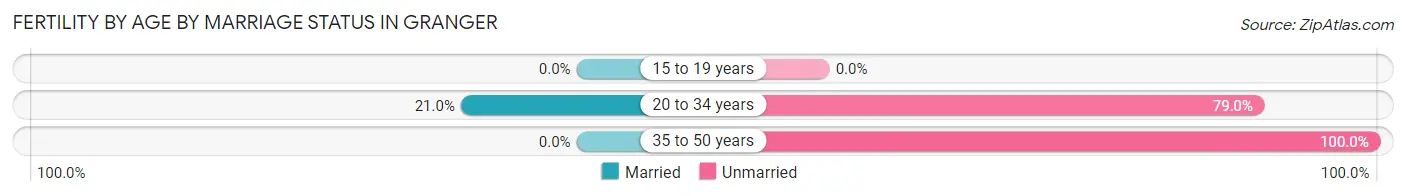
| Age Bracket | Married | Unmarried |
| 15 to 19 years | 0 (0.0%) | 0 (0.0%) |
| 20 to 34 years | 13 (21.0%) | 49 (79.0%) |
| 35 to 50 years | 0 (0.0%) | 4 (100.0%) |
| Total | 13 (19.7%) | 53 (80.3%) |
Fertility by Education in Granger
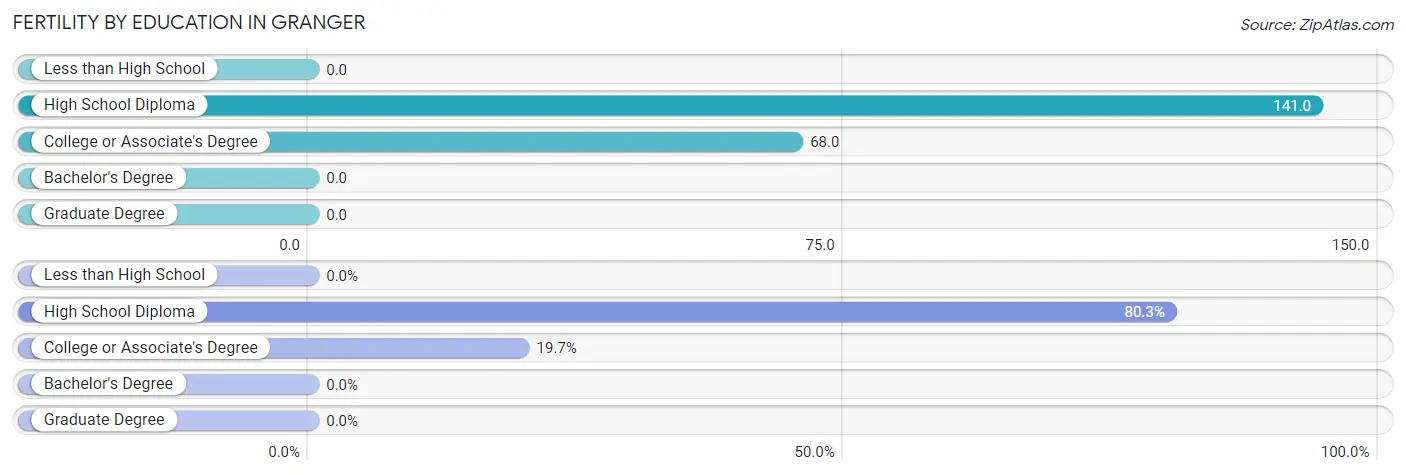
| Educational Attainment | Women with Births | Births / 1,000 Women |
| Less than High School | 0 (0.0%) | 0.0 |
| High School Diploma | 53 (80.3%) | 141.0 |
| College or Associate's Degree | 13 (19.7%) | 68.0 |
| Bachelor's Degree | 0 (0.0%) | 0.0 |
| Graduate Degree | 0 (0.0%) | 0.0 |
| Total | 66 (100.0%) | 67.0 |
Fertility by Education by Marriage Status in Granger
80.3% of women with births in Granger are unmarried. Women with the educational attainment of college or associate's degree are most likely to be married with 100.0% of them married at childbirth, while women with the educational attainment of high school diploma are least likely to be married with 100.0% of them unmarried at childbirth.
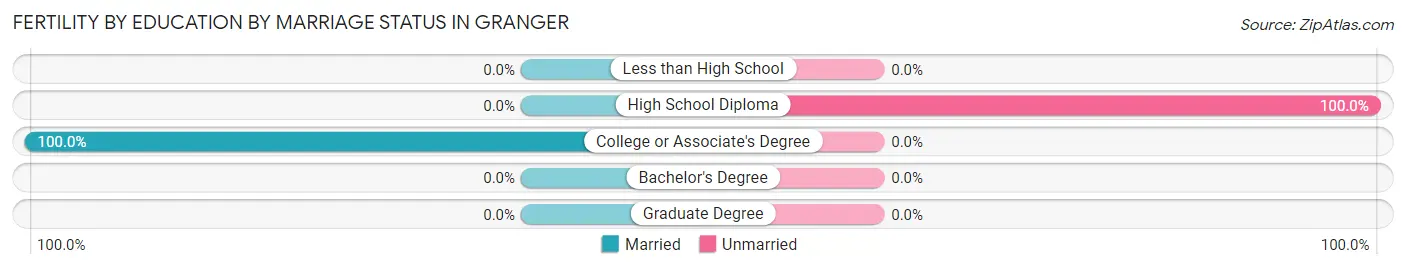
| Educational Attainment | Married | Unmarried |
| Less than High School | 0 (0.0%) | 0 (0.0%) |
| High School Diploma | 0 (0.0%) | 53 (100.0%) |
| College or Associate's Degree | 13 (100.0%) | 0 (0.0%) |
| Bachelor's Degree | 0 (0.0%) | 0 (0.0%) |
| Graduate Degree | 0 (0.0%) | 0 (0.0%) |
| Total | 13 (19.7%) | 53 (80.3%) |
Employment Characteristics in Granger
Employment by Class of Employer in Granger
Among the 1,317 employed individuals in Granger, private company employees (986 | 74.9%), not-for-profit organizations (124 | 9.4%), and local government employees (103 | 7.8%) make up the most common classes of employment.
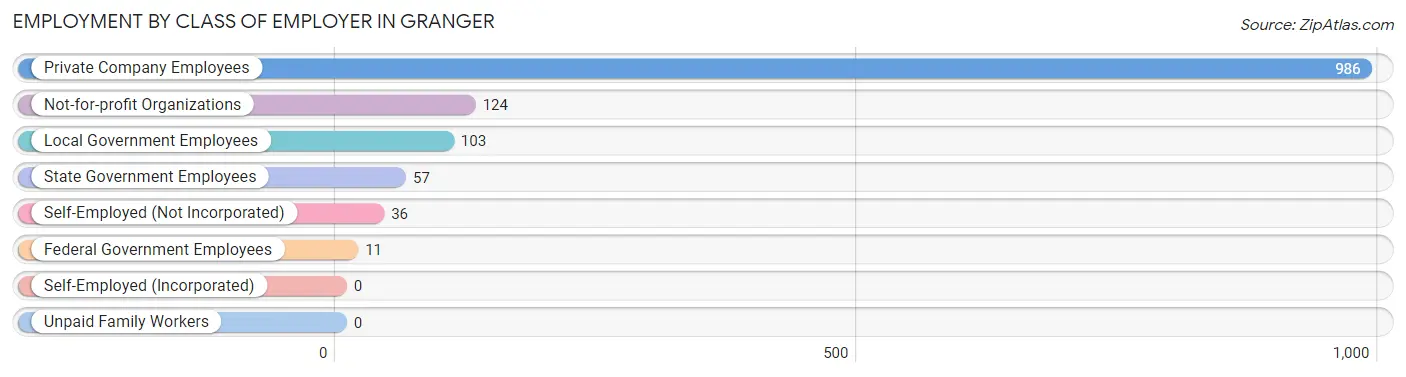
| Employer Class | # Employees | % Employees |
| Private Company Employees | 986 | 74.9% |
| Self-Employed (Incorporated) | 0 | 0.0% |
| Self-Employed (Not Incorporated) | 36 | 2.7% |
| Not-for-profit Organizations | 124 | 9.4% |
| Local Government Employees | 103 | 7.8% |
| State Government Employees | 57 | 4.3% |
| Federal Government Employees | 11 | 0.8% |
| Unpaid Family Workers | 0 | 0.0% |
| Total | 1,317 | 100.0% |
Employment Status by Age in Granger
According to the labor force statistics for Granger, out of the total population over 16 years of age (2,386), 69.0% or 1,646 individuals are in the labor force, with 16.7% or 275 of them unemployed. The age group with the highest labor force participation rate is 45 to 54 years, with 90.9% or 269 individuals in the labor force. Within the labor force, the 16 to 19 years age range has the highest percentage of unemployed individuals, with 49.8% or 132 of them being unemployed.
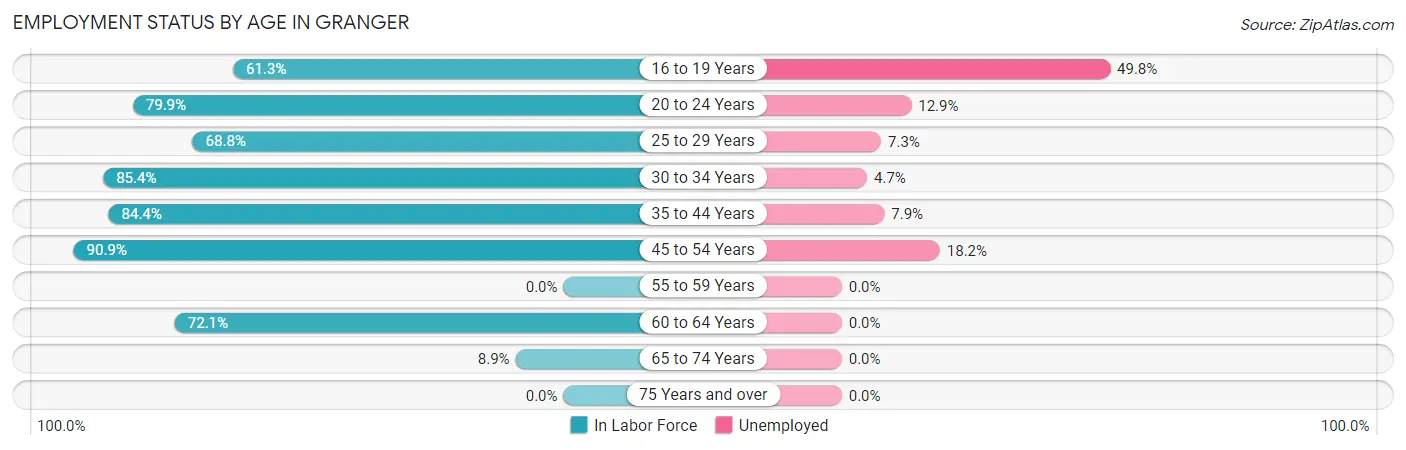
| Age Bracket | In Labor Force | Unemployed |
| 16 to 19 Years | 265 (61.3%) | 132 (49.8%) |
| 20 to 24 Years | 333 (79.9%) | 43 (12.9%) |
| 25 to 29 Years | 165 (68.8%) | 12 (7.3%) |
| 30 to 34 Years | 129 (85.4%) | 6 (4.7%) |
| 35 to 44 Years | 417 (84.4%) | 33 (7.9%) |
| 45 to 54 Years | 269 (90.9%) | 49 (18.2%) |
| 55 to 59 Years | 0 (0.0%) | 0 (0.0%) |
| 60 to 64 Years | 49 (72.1%) | 0 (0.0%) |
| 65 to 74 Years | 19 (8.9%) | 0 (0.0%) |
| 75 Years and over | 0 (0.0%) | 0 (0.0%) |
| Total | 1,646 (69.0%) | 275 (16.7%) |
Employment Status by Educational Attainment in Granger
According to labor force statistics for Granger, 80.0% of individuals (1,029) out of the total population between 25 and 64 years of age (1,286) are in the labor force, with 9.7% or 100 of them being unemployed. The group with the highest labor force participation rate are those with the educational attainment of bachelor's degree or higher, with 96.0% or 120 individuals in the labor force. Within the labor force, individuals with college / associate degree education have the highest percentage of unemployment, with 47.1% or 49 of them being unemployed.
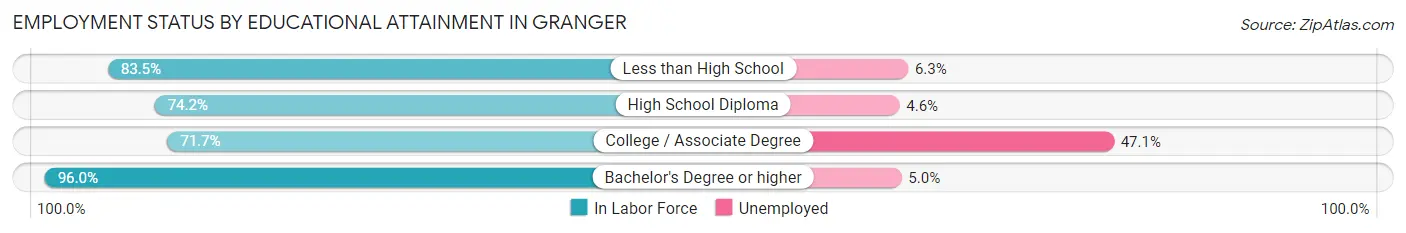
| Educational Attainment | In Labor Force | Unemployed |
| Less than High School | 459 (83.5%) | 35 (6.3%) |
| High School Diploma | 346 (74.2%) | 21 (4.6%) |
| College / Associate Degree | 104 (71.7%) | 68 (47.1%) |
| Bachelor's Degree or higher | 120 (96.0%) | 6 (5.0%) |
| Total | 1,029 (80.0%) | 125 (9.7%) |
Employment Occupations by Sex in Granger
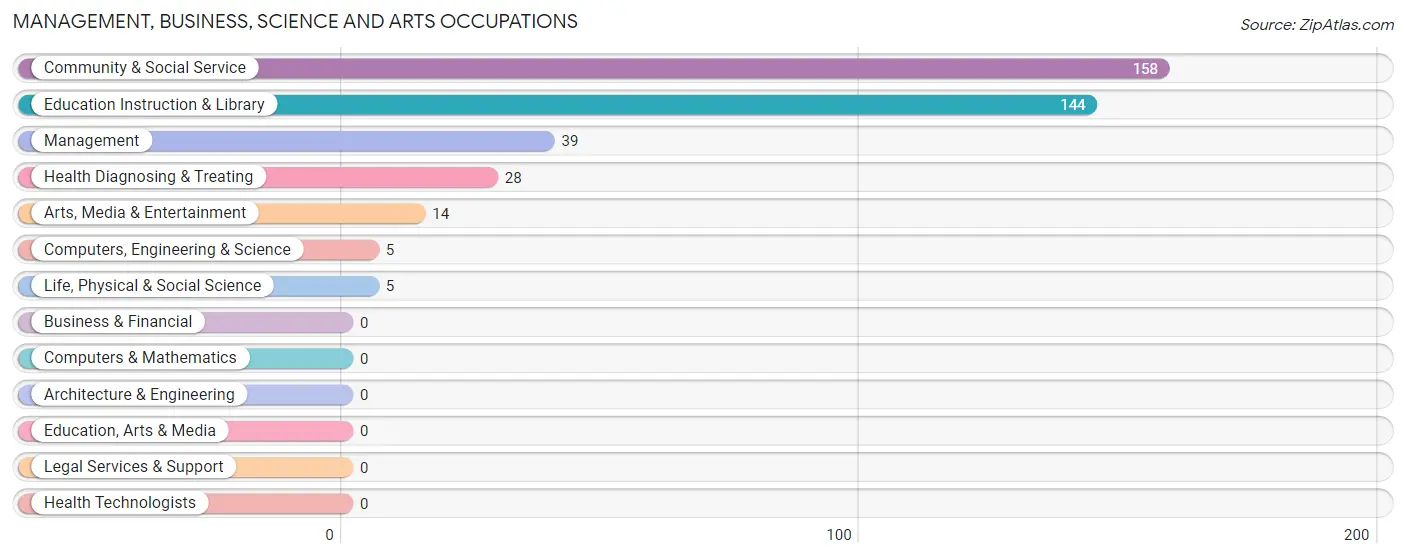
Management, Business, Science and Arts Occupations
The most common Management, Business, Science and Arts occupations in Granger are Community & Social Service (158 | 11.5%), Education Instruction & Library (144 | 10.5%), Management (39 | 2.8%), Health Diagnosing & Treating (28 | 2.0%), and Arts, Media & Entertainment (14 | 1.0%).
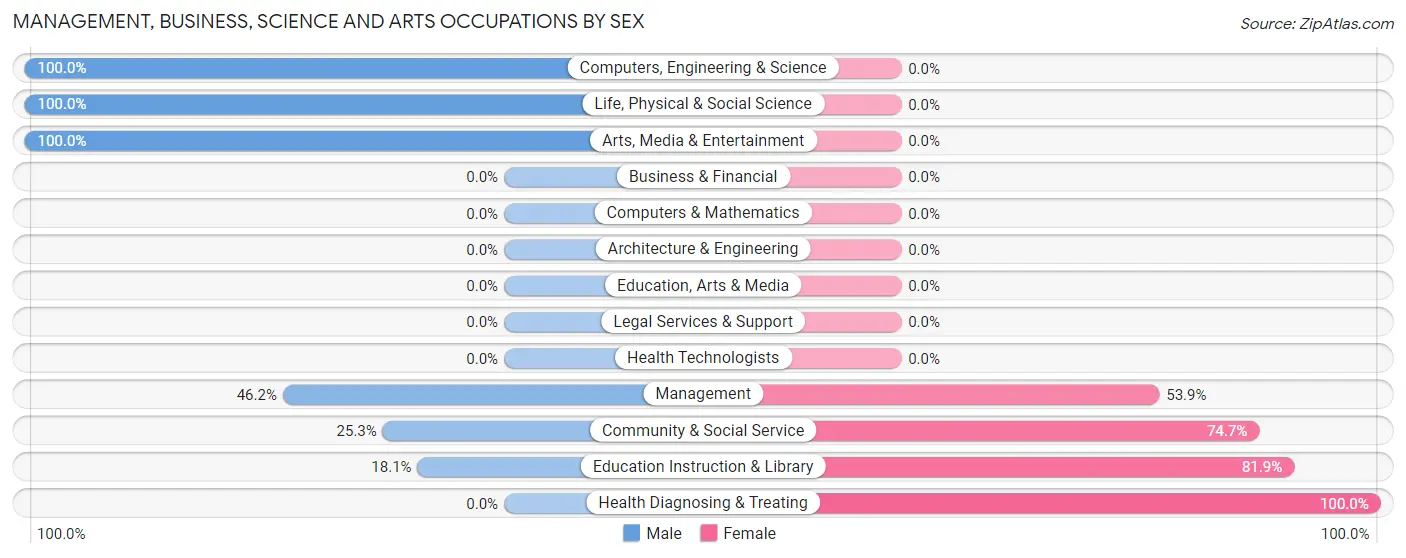
Management, Business, Science and Arts Occupations by Sex
Within the Management, Business, Science and Arts occupations in Granger, the most male-oriented occupations are Computers, Engineering & Science (100.0%), Life, Physical & Social Science (100.0%), and Arts, Media & Entertainment (100.0%), while the most female-oriented occupations are Health Diagnosing & Treating (100.0%), Education Instruction & Library (81.9%), and Community & Social Service (74.7%).
| Occupation | Male | Female |
| Management | 18 (46.2%) | 21 (53.8%) |
| Business & Financial | 0 (0.0%) | 0 (0.0%) |
| Computers, Engineering & Science | 5 (100.0%) | 0 (0.0%) |
| Computers & Mathematics | 0 (0.0%) | 0 (0.0%) |
| Architecture & Engineering | 0 (0.0%) | 0 (0.0%) |
| Life, Physical & Social Science | 5 (100.0%) | 0 (0.0%) |
| Community & Social Service | 40 (25.3%) | 118 (74.7%) |
| Education, Arts & Media | 0 (0.0%) | 0 (0.0%) |
| Legal Services & Support | 0 (0.0%) | 0 (0.0%) |
| Education Instruction & Library | 26 (18.1%) | 118 (81.9%) |
| Arts, Media & Entertainment | 14 (100.0%) | 0 (0.0%) |
| Health Diagnosing & Treating | 0 (0.0%) | 28 (100.0%) |
| Health Technologists | 0 (0.0%) | 0 (0.0%) |
| Total (Category) | 63 (27.4%) | 167 (72.6%) |
| Total (Overall) | 789 (57.6%) | 582 (42.4%) |
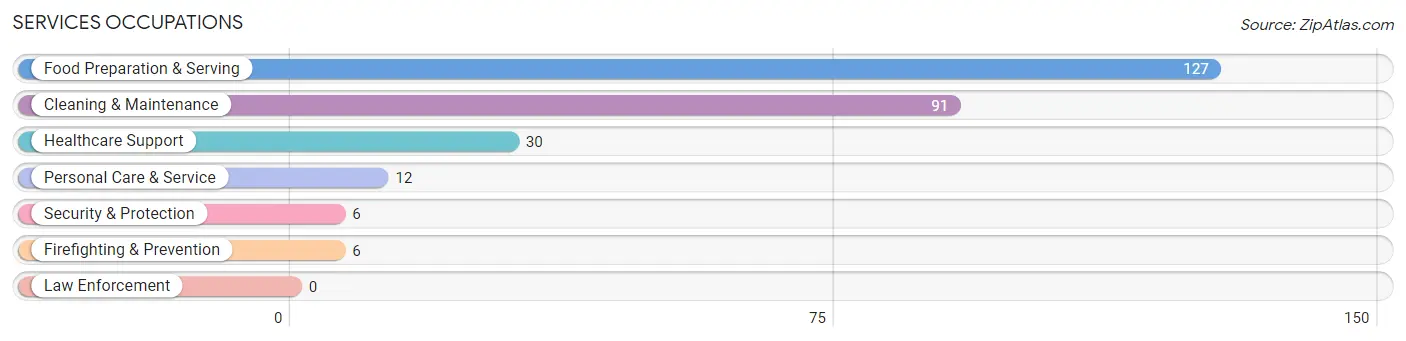
Services Occupations
The most common Services occupations in Granger are Food Preparation & Serving (127 | 9.3%), Cleaning & Maintenance (91 | 6.6%), Healthcare Support (30 | 2.2%), Personal Care & Service (12 | 0.9%), and Security & Protection (6 | 0.4%).
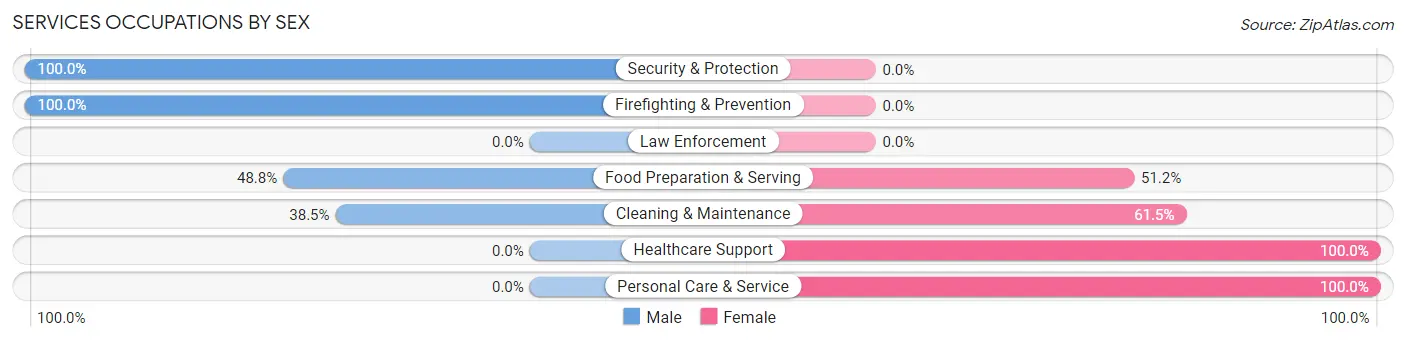
Services Occupations by Sex
Within the Services occupations in Granger, the most male-oriented occupations are Security & Protection (100.0%), Firefighting & Prevention (100.0%), and Food Preparation & Serving (48.8%), while the most female-oriented occupations are Healthcare Support (100.0%), Personal Care & Service (100.0%), and Cleaning & Maintenance (61.5%).
| Occupation | Male | Female |
| Healthcare Support | 0 (0.0%) | 30 (100.0%) |
| Security & Protection | 6 (100.0%) | 0 (0.0%) |
| Firefighting & Prevention | 6 (100.0%) | 0 (0.0%) |
| Law Enforcement | 0 (0.0%) | 0 (0.0%) |
| Food Preparation & Serving | 62 (48.8%) | 65 (51.2%) |
| Cleaning & Maintenance | 35 (38.5%) | 56 (61.5%) |
| Personal Care & Service | 0 (0.0%) | 12 (100.0%) |
| Total (Category) | 103 (38.7%) | 163 (61.3%) |
| Total (Overall) | 789 (57.6%) | 582 (42.4%) |
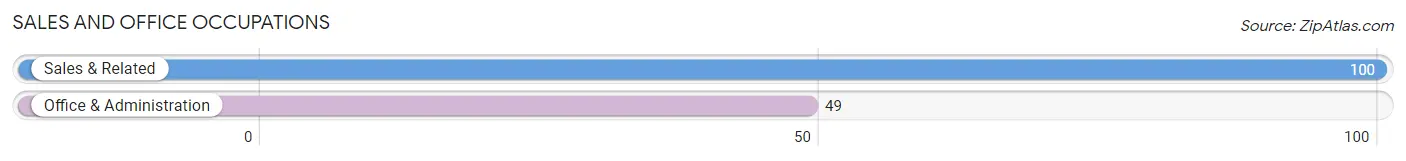
Sales and Office Occupations
The most common Sales and Office occupations in Granger are Sales & Related (100 | 7.3%), and Office & Administration (49 | 3.6%).
Sales and Office Occupations by Sex
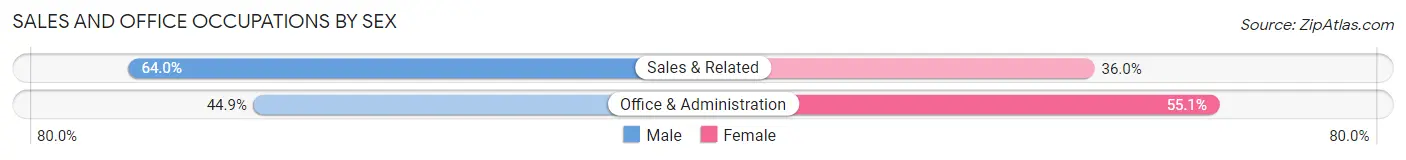
| Occupation | Male | Female |
| Sales & Related | 64 (64.0%) | 36 (36.0%) |
| Office & Administration | 22 (44.9%) | 27 (55.1%) |
| Total (Category) | 86 (57.7%) | 63 (42.3%) |
| Total (Overall) | 789 (57.6%) | 582 (42.4%) |
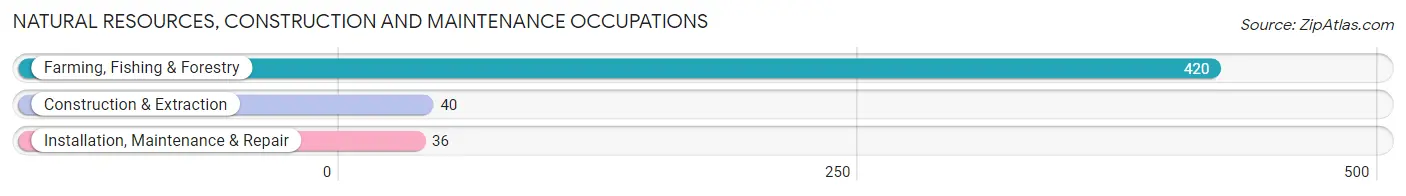
Natural Resources, Construction and Maintenance Occupations
The most common Natural Resources, Construction and Maintenance occupations in Granger are Farming, Fishing & Forestry (420 | 30.6%), Construction & Extraction (40 | 2.9%), and Installation, Maintenance & Repair (36 | 2.6%).
Natural Resources, Construction and Maintenance Occupations by Sex
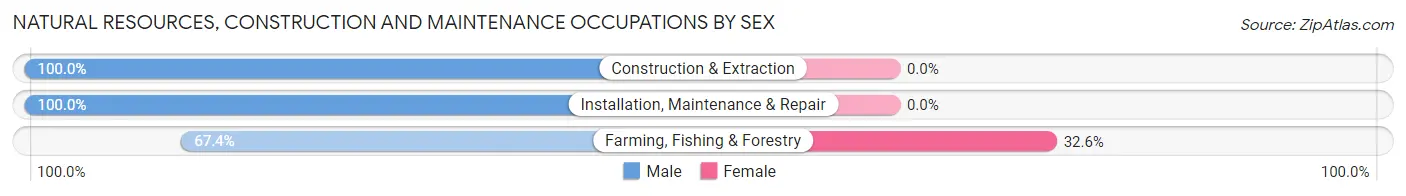
| Occupation | Male | Female |
| Farming, Fishing & Forestry | 283 (67.4%) | 137 (32.6%) |
| Construction & Extraction | 40 (100.0%) | 0 (0.0%) |
| Installation, Maintenance & Repair | 36 (100.0%) | 0 (0.0%) |
| Total (Category) | 359 (72.4%) | 137 (27.6%) |
| Total (Overall) | 789 (57.6%) | 582 (42.4%) |
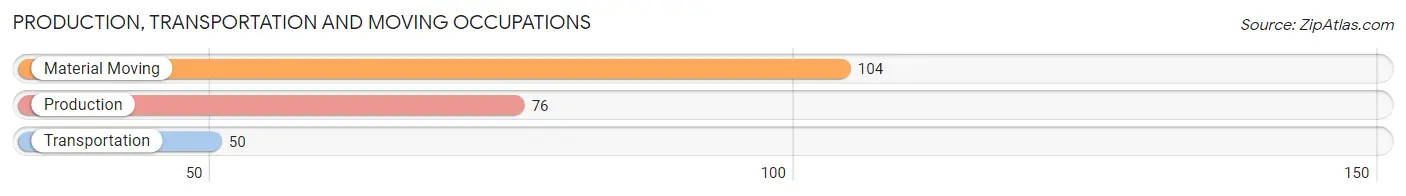
Production, Transportation and Moving Occupations
The most common Production, Transportation and Moving occupations in Granger are Material Moving (104 | 7.6%), Production (76 | 5.5%), and Transportation (50 | 3.6%).
Production, Transportation and Moving Occupations by Sex
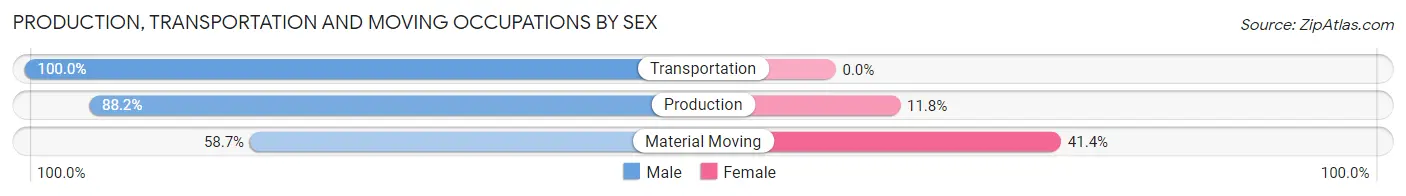
| Occupation | Male | Female |
| Production | 67 (88.2%) | 9 (11.8%) |
| Transportation | 50 (100.0%) | 0 (0.0%) |
| Material Moving | 61 (58.7%) | 43 (41.3%) |
| Total (Category) | 178 (77.4%) | 52 (22.6%) |
| Total (Overall) | 789 (57.6%) | 582 (42.4%) |
Employment Industries by Sex in Granger
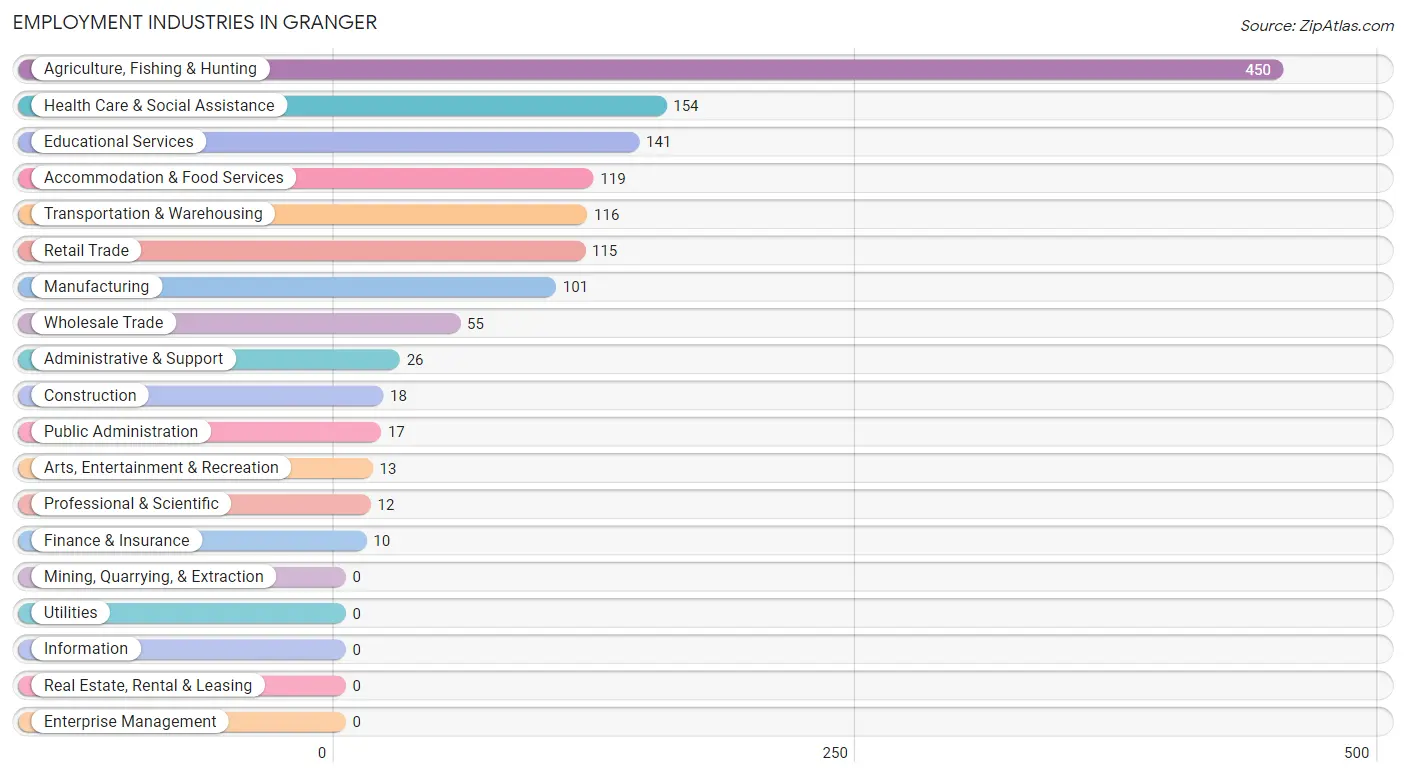
Employment Industries in Granger
The major employment industries in Granger include Agriculture, Fishing & Hunting (450 | 32.8%), Health Care & Social Assistance (154 | 11.2%), Educational Services (141 | 10.3%), Accommodation & Food Services (119 | 8.7%), and Transportation & Warehousing (116 | 8.5%).
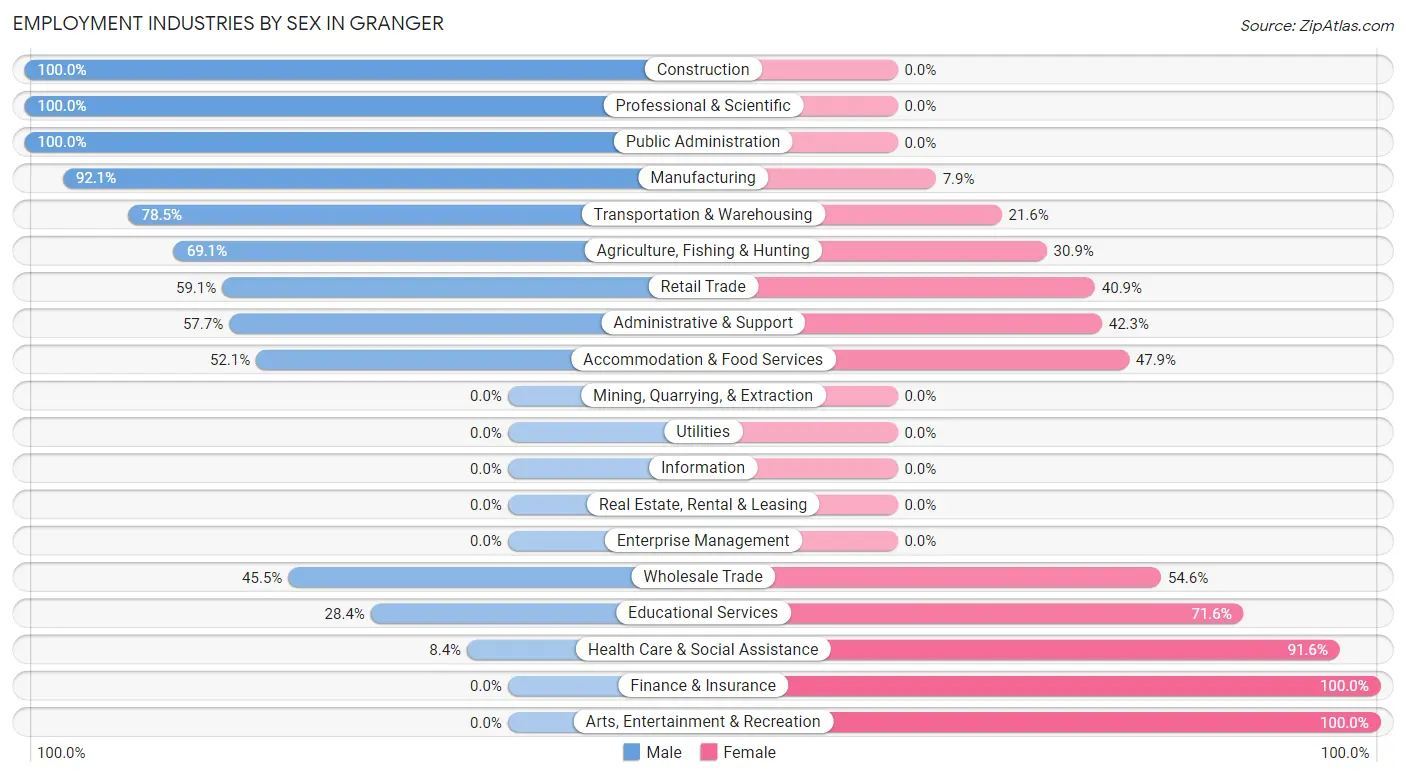
Employment Industries by Sex in Granger
The Granger industries that see more men than women are Construction (100.0%), Professional & Scientific (100.0%), and Public Administration (100.0%), whereas the industries that tend to have a higher number of women are Finance & Insurance (100.0%), Arts, Entertainment & Recreation (100.0%), and Health Care & Social Assistance (91.6%).
| Industry | Male | Female |
| Agriculture, Fishing & Hunting | 311 (69.1%) | 139 (30.9%) |
| Mining, Quarrying, & Extraction | 0 (0.0%) | 0 (0.0%) |
| Construction | 18 (100.0%) | 0 (0.0%) |
| Manufacturing | 93 (92.1%) | 8 (7.9%) |
| Wholesale Trade | 25 (45.5%) | 30 (54.5%) |
| Retail Trade | 68 (59.1%) | 47 (40.9%) |
| Transportation & Warehousing | 91 (78.4%) | 25 (21.5%) |
| Utilities | 0 (0.0%) | 0 (0.0%) |
| Information | 0 (0.0%) | 0 (0.0%) |
| Finance & Insurance | 0 (0.0%) | 10 (100.0%) |
| Real Estate, Rental & Leasing | 0 (0.0%) | 0 (0.0%) |
| Professional & Scientific | 12 (100.0%) | 0 (0.0%) |
| Enterprise Management | 0 (0.0%) | 0 (0.0%) |
| Administrative & Support | 15 (57.7%) | 11 (42.3%) |
| Educational Services | 40 (28.4%) | 101 (71.6%) |
| Health Care & Social Assistance | 13 (8.4%) | 141 (91.6%) |
| Arts, Entertainment & Recreation | 0 (0.0%) | 13 (100.0%) |
| Accommodation & Food Services | 62 (52.1%) | 57 (47.9%) |
| Public Administration | 17 (100.0%) | 0 (0.0%) |
| Total | 789 (57.6%) | 582 (42.4%) |
Education in Granger
School Enrollment in Granger
The most common levels of schooling among the 1,393 students in Granger are high school (468 | 33.6%), middle school (330 | 23.7%), and elementary school (298 | 21.4%).
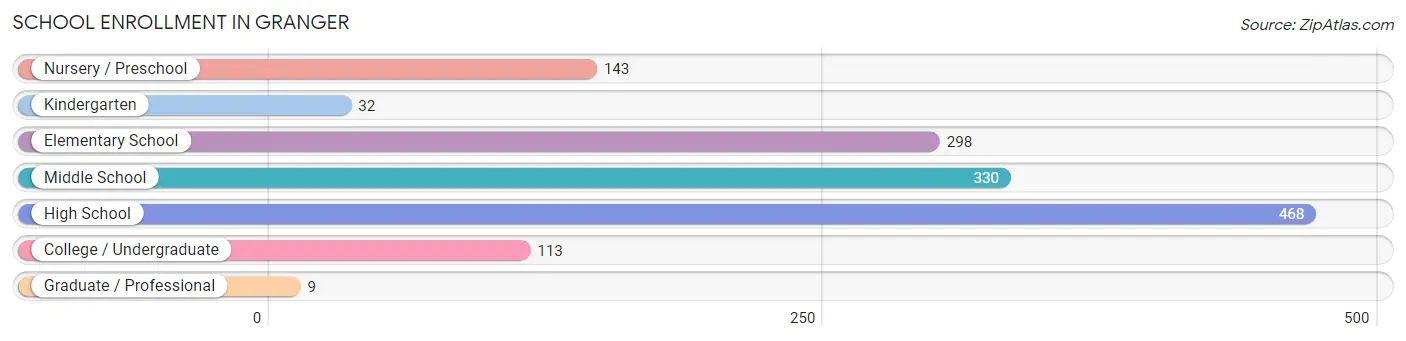
| School Level | # Students | % Students |
| Nursery / Preschool | 143 | 10.3% |
| Kindergarten | 32 | 2.3% |
| Elementary School | 298 | 21.4% |
| Middle School | 330 | 23.7% |
| High School | 468 | 33.6% |
| College / Undergraduate | 113 | 8.1% |
| Graduate / Professional | 9 | 0.6% |
| Total | 1,393 | 100.0% |
School Enrollment by Age by Funding Source in Granger
Out of a total of 1,393 students who are enrolled in schools in Granger, 8 (0.6%) attend a private institution, while the remaining 1,385 (99.4%) are enrolled in public schools. The age group of 25 to 34 year olds has the highest likelihood of being enrolled in private schools, with 9 (13.9% in the age bracket) enrolled. Conversely, the age group of 3 to 4 year olds has the lowest likelihood of being enrolled in a private school, with 70 (100.0% in the age bracket) attending a public institution.
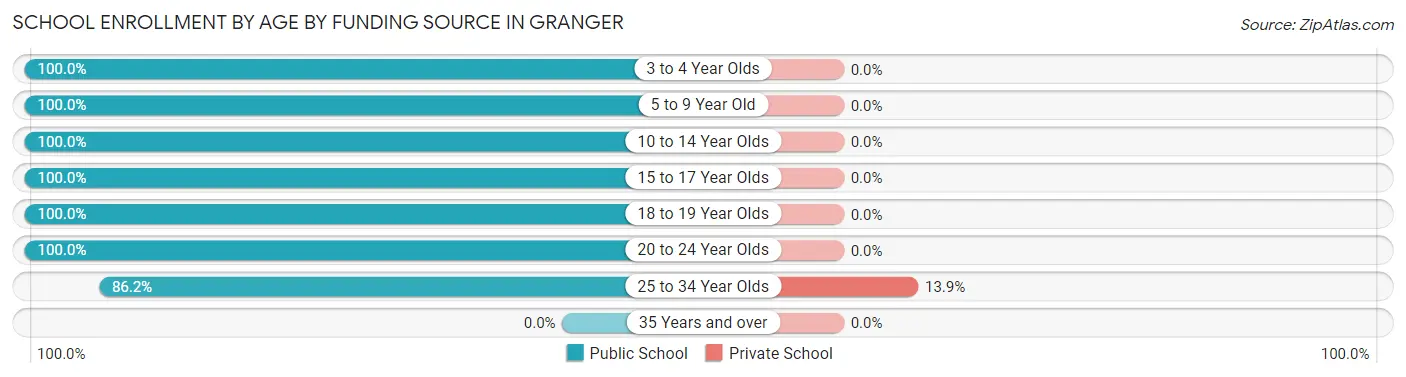
| Age Bracket | Public School | Private School |
| 3 to 4 Year Olds | 70 (100.0%) | 0 (0.0%) |
| 5 to 9 Year Old | 339 (100.0%) | 0 (0.0%) |
| 10 to 14 Year Olds | 444 (100.0%) | 0 (0.0%) |
| 15 to 17 Year Olds | 287 (100.0%) | 0 (0.0%) |
| 18 to 19 Year Olds | 117 (100.0%) | 0 (0.0%) |
| 20 to 24 Year Olds | 71 (100.0%) | 0 (0.0%) |
| 25 to 34 Year Olds | 56 (86.2%) | 9 (13.9%) |
| 35 Years and over | 0 (0.0%) | 0 (0.0%) |
| Total | 1,385 (99.4%) | 8 (0.6%) |
Educational Attainment by Field of Study in Granger
Education (55 | 40.7%), business (38 | 28.1%), literature & languages (14 | 10.4%), bio, nature & agricultural (10 | 7.4%), and liberal arts & history (7 | 5.2%) are the most common fields of study among 135 individuals in Granger who have obtained a bachelor's degree or higher.
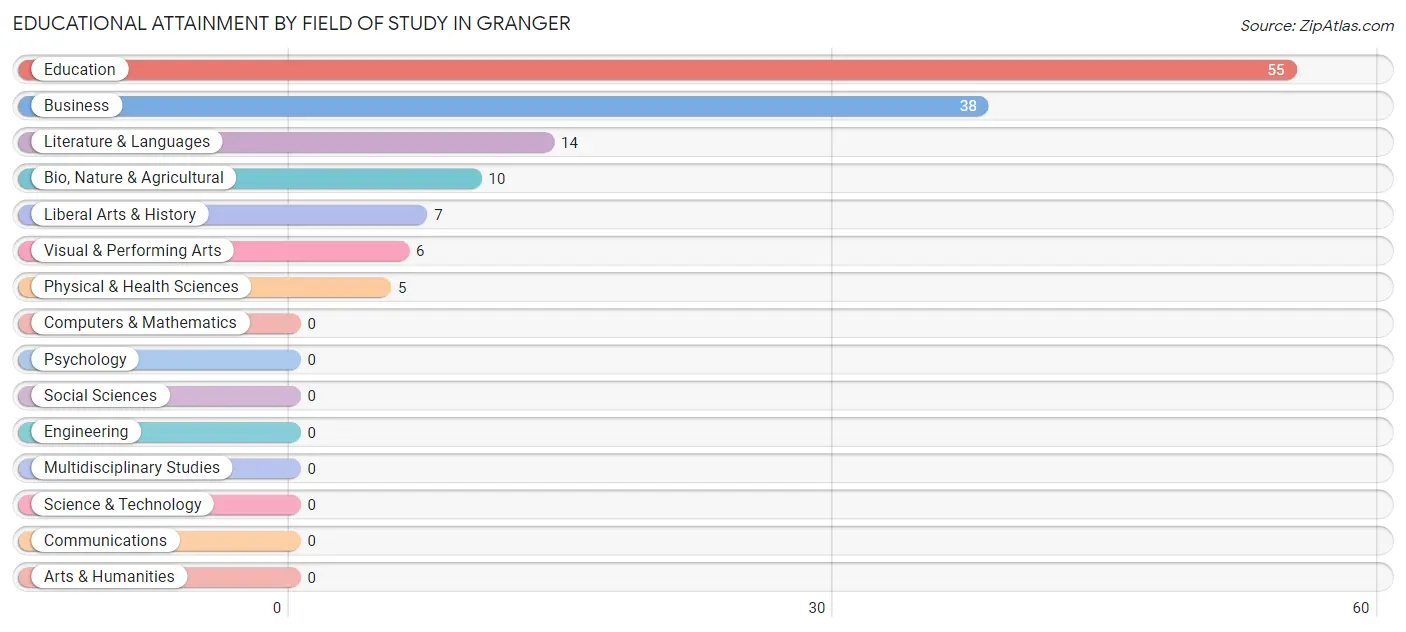
| Field of Study | # Graduates | % Graduates |
| Computers & Mathematics | 0 | 0.0% |
| Bio, Nature & Agricultural | 10 | 7.4% |
| Physical & Health Sciences | 5 | 3.7% |
| Psychology | 0 | 0.0% |
| Social Sciences | 0 | 0.0% |
| Engineering | 0 | 0.0% |
| Multidisciplinary Studies | 0 | 0.0% |
| Science & Technology | 0 | 0.0% |
| Business | 38 | 28.1% |
| Education | 55 | 40.7% |
| Literature & Languages | 14 | 10.4% |
| Liberal Arts & History | 7 | 5.2% |
| Visual & Performing Arts | 6 | 4.4% |
| Communications | 0 | 0.0% |
| Arts & Humanities | 0 | 0.0% |
| Total | 135 | 100.0% |
Transportation & Commute in Granger
Vehicle Availability by Sex in Granger
The most prevalent vehicle ownership categories in Granger are males with 2 vehicles (271, accounting for 35.0%) and females with 2 vehicles (204, making up 51.4%).
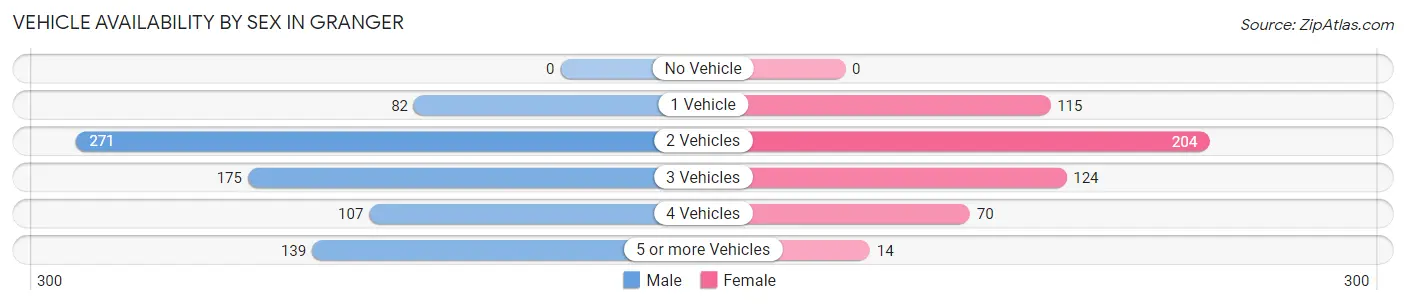
| Vehicles Available | Male | Female |
| No Vehicle | 0 (0.0%) | 0 (0.0%) |
| 1 Vehicle | 82 (10.6%) | 115 (21.8%) |
| 2 Vehicles | 271 (35.0%) | 204 (38.7%) |
| 3 Vehicles | 175 (22.6%) | 124 (23.5%) |
| 4 Vehicles | 107 (13.8%) | 70 (13.3%) |
| 5 or more Vehicles | 139 (18.0%) | 14 (2.7%) |
| Total | 774 (100.0%) | 527 (100.0%) |
Commute Time in Granger
The most frequently occuring commute durations in Granger are 20 to 24 minutes (331 commuters, 25.1%), 25 to 29 minutes (214 commuters, 16.3%), and 15 to 19 minutes (188 commuters, 14.3%).
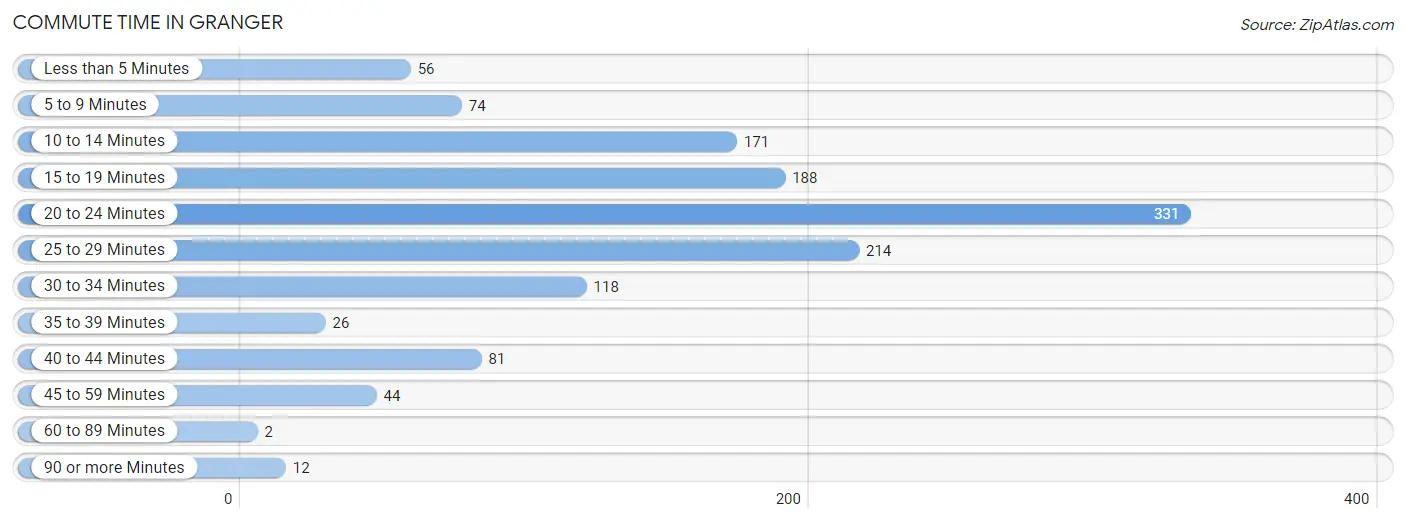
| Commute Time | # Commuters | % Commuters |
| Less than 5 Minutes | 56 | 4.3% |
| 5 to 9 Minutes | 74 | 5.6% |
| 10 to 14 Minutes | 171 | 13.0% |
| 15 to 19 Minutes | 188 | 14.3% |
| 20 to 24 Minutes | 331 | 25.1% |
| 25 to 29 Minutes | 214 | 16.3% |
| 30 to 34 Minutes | 118 | 9.0% |
| 35 to 39 Minutes | 26 | 2.0% |
| 40 to 44 Minutes | 81 | 6.1% |
| 45 to 59 Minutes | 44 | 3.3% |
| 60 to 89 Minutes | 2 | 0.2% |
| 90 or more Minutes | 12 | 0.9% |
Commute Time by Sex in Granger
The most common commute times in Granger are 20 to 24 minutes (237 commuters, 30.6%) for males and 10 to 14 minutes (117 commuters, 21.5%) for females.
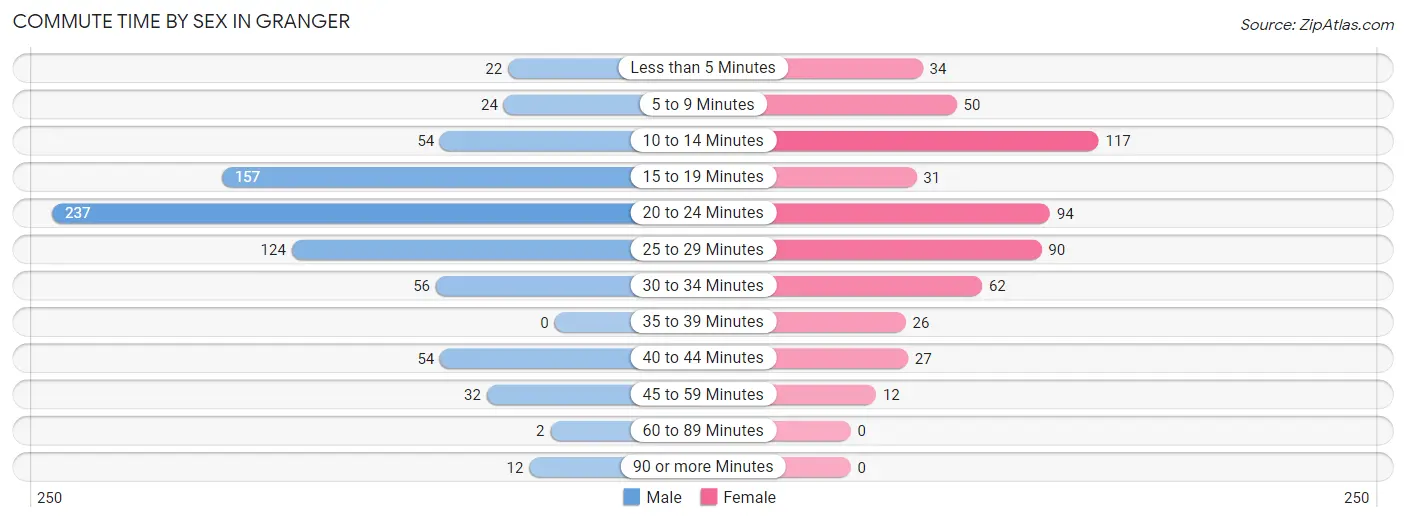
| Commute Time | Male | Female |
| Less than 5 Minutes | 22 (2.8%) | 34 (6.3%) |
| 5 to 9 Minutes | 24 (3.1%) | 50 (9.2%) |
| 10 to 14 Minutes | 54 (7.0%) | 117 (21.5%) |
| 15 to 19 Minutes | 157 (20.3%) | 31 (5.7%) |
| 20 to 24 Minutes | 237 (30.6%) | 94 (17.3%) |
| 25 to 29 Minutes | 124 (16.0%) | 90 (16.6%) |
| 30 to 34 Minutes | 56 (7.2%) | 62 (11.4%) |
| 35 to 39 Minutes | 0 (0.0%) | 26 (4.8%) |
| 40 to 44 Minutes | 54 (7.0%) | 27 (5.0%) |
| 45 to 59 Minutes | 32 (4.1%) | 12 (2.2%) |
| 60 to 89 Minutes | 2 (0.3%) | 0 (0.0%) |
| 90 or more Minutes | 12 (1.5%) | 0 (0.0%) |
Time of Departure to Work by Sex in Granger
The most frequent times of departure to work in Granger are 5:30 AM to 5:59 AM (147, 19.0%) for males and 6:30 AM to 6:59 AM (136, 25.1%) for females.
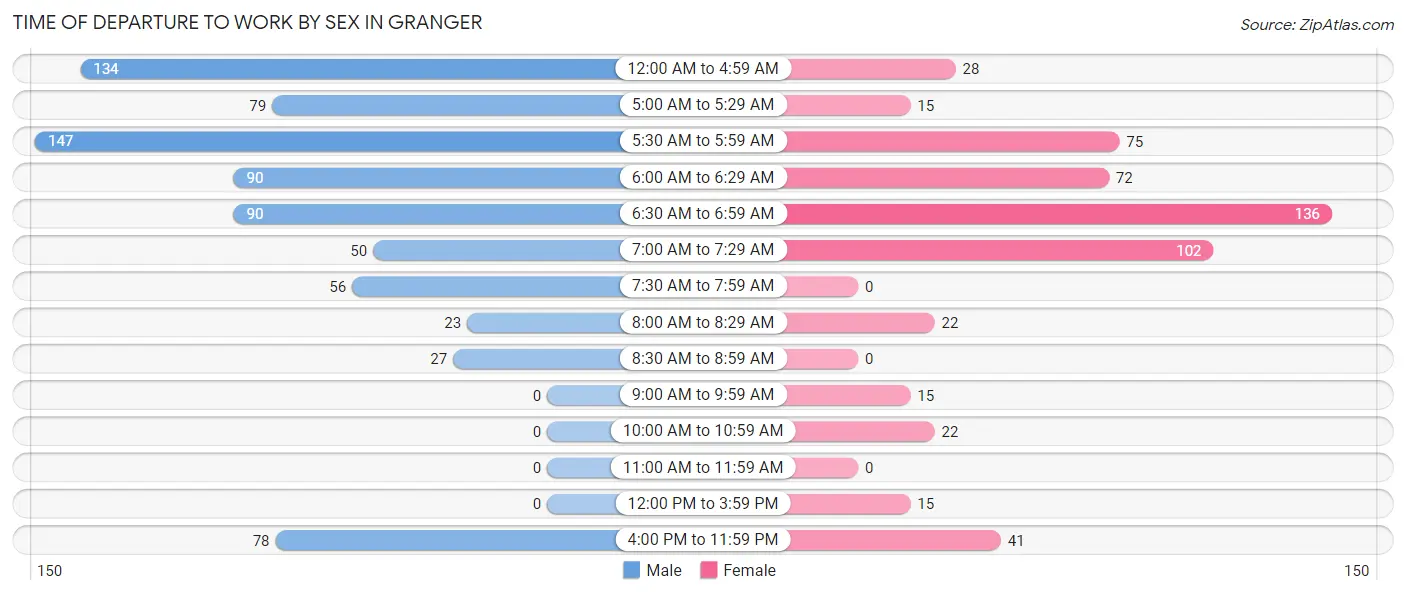
| Time of Departure | Male | Female |
| 12:00 AM to 4:59 AM | 134 (17.3%) | 28 (5.2%) |
| 5:00 AM to 5:29 AM | 79 (10.2%) | 15 (2.8%) |
| 5:30 AM to 5:59 AM | 147 (19.0%) | 75 (13.8%) |
| 6:00 AM to 6:29 AM | 90 (11.6%) | 72 (13.3%) |
| 6:30 AM to 6:59 AM | 90 (11.6%) | 136 (25.1%) |
| 7:00 AM to 7:29 AM | 50 (6.5%) | 102 (18.8%) |
| 7:30 AM to 7:59 AM | 56 (7.2%) | 0 (0.0%) |
| 8:00 AM to 8:29 AM | 23 (3.0%) | 22 (4.1%) |
| 8:30 AM to 8:59 AM | 27 (3.5%) | 0 (0.0%) |
| 9:00 AM to 9:59 AM | 0 (0.0%) | 15 (2.8%) |
| 10:00 AM to 10:59 AM | 0 (0.0%) | 22 (4.1%) |
| 11:00 AM to 11:59 AM | 0 (0.0%) | 0 (0.0%) |
| 12:00 PM to 3:59 PM | 0 (0.0%) | 15 (2.8%) |
| 4:00 PM to 11:59 PM | 78 (10.1%) | 41 (7.5%) |
| Total | 774 (100.0%) | 543 (100.0%) |
Housing Occupancy in Granger
Occupancy by Ownership in Granger
Of the total 842 dwellings in Granger, owner-occupied units account for 456 (54.2%), while renter-occupied units make up 386 (45.8%).
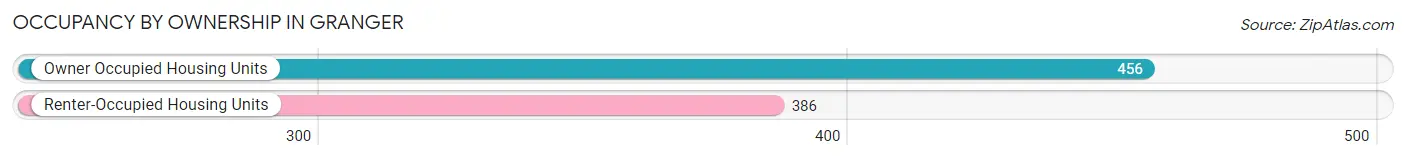
| Occupancy | # Housing Units | % Housing Units |
| Owner Occupied Housing Units | 456 | 54.2% |
| Renter-Occupied Housing Units | 386 | 45.8% |
| Total Occupied Housing Units | 842 | 100.0% |
Occupancy by Household Size in Granger
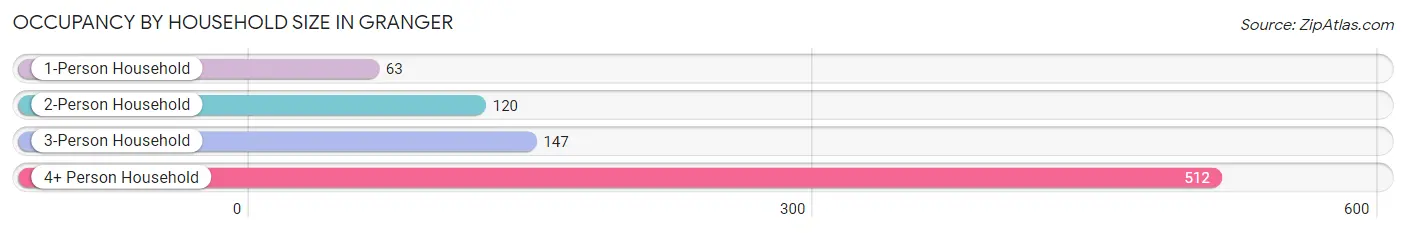
| Household Size | # Housing Units | % Housing Units |
| 1-Person Household | 63 | 7.5% |
| 2-Person Household | 120 | 14.2% |
| 3-Person Household | 147 | 17.5% |
| 4+ Person Household | 512 | 60.8% |
| Total Housing Units | 842 | 100.0% |
Occupancy by Ownership by Household Size in Granger
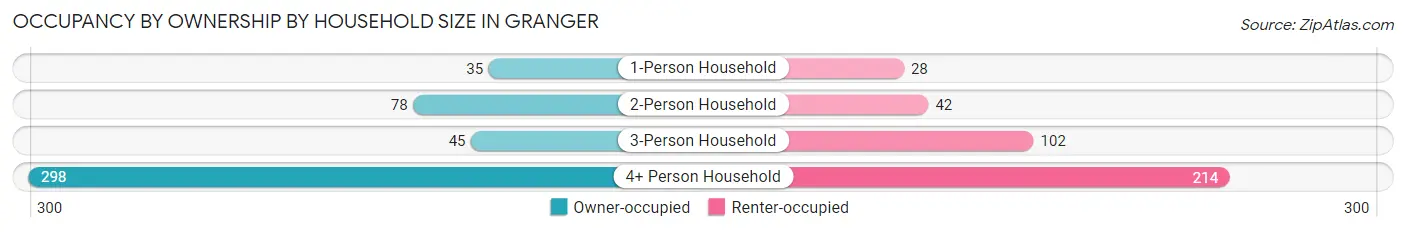
| Household Size | Owner-occupied | Renter-occupied |
| 1-Person Household | 35 (55.6%) | 28 (44.4%) |
| 2-Person Household | 78 (65.0%) | 42 (35.0%) |
| 3-Person Household | 45 (30.6%) | 102 (69.4%) |
| 4+ Person Household | 298 (58.2%) | 214 (41.8%) |
| Total Housing Units | 456 (54.2%) | 386 (45.8%) |
Occupancy by Educational Attainment in Granger
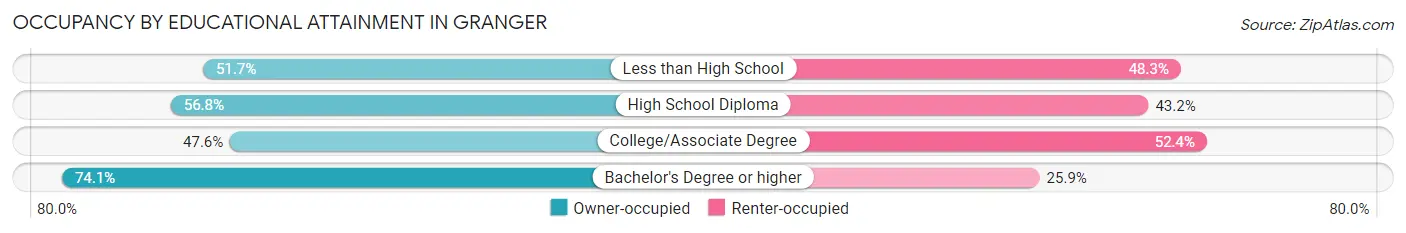
| Household Size | Owner-occupied | Renter-occupied |
| Less than High School | 167 (51.7%) | 156 (48.3%) |
| High School Diploma | 171 (56.8%) | 130 (43.2%) |
| College/Associate Degree | 78 (47.6%) | 86 (52.4%) |
| Bachelor's Degree or higher | 40 (74.1%) | 14 (25.9%) |
Occupancy by Age of Householder in Granger
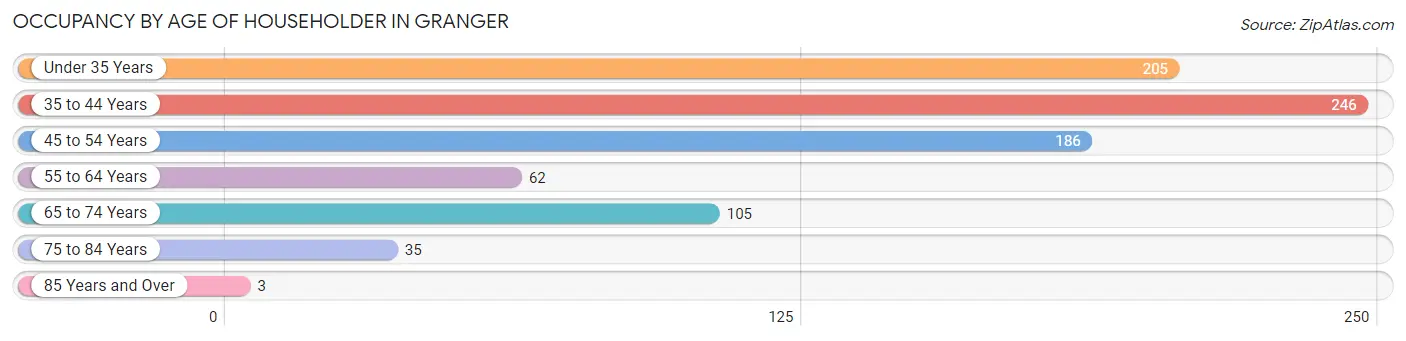
| Age Bracket | # Households | % Households |
| Under 35 Years | 205 | 24.3% |
| 35 to 44 Years | 246 | 29.2% |
| 45 to 54 Years | 186 | 22.1% |
| 55 to 64 Years | 62 | 7.4% |
| 65 to 74 Years | 105 | 12.5% |
| 75 to 84 Years | 35 | 4.2% |
| 85 Years and Over | 3 | 0.4% |
| Total | 842 | 100.0% |
Housing Finances in Granger
Median Income by Occupancy in Granger
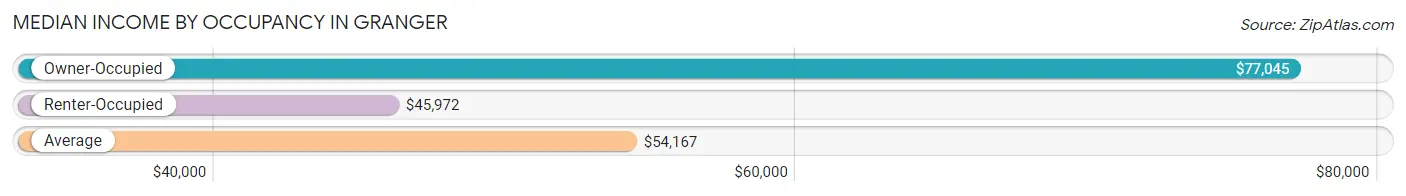
| Occupancy Type | # Households | Median Income |
| Owner-Occupied | 456 (54.2%) | $77,045 |
| Renter-Occupied | 386 (45.8%) | $45,972 |
| Average | 842 (100.0%) | $54,167 |
Occupancy by Householder Income Bracket in Granger
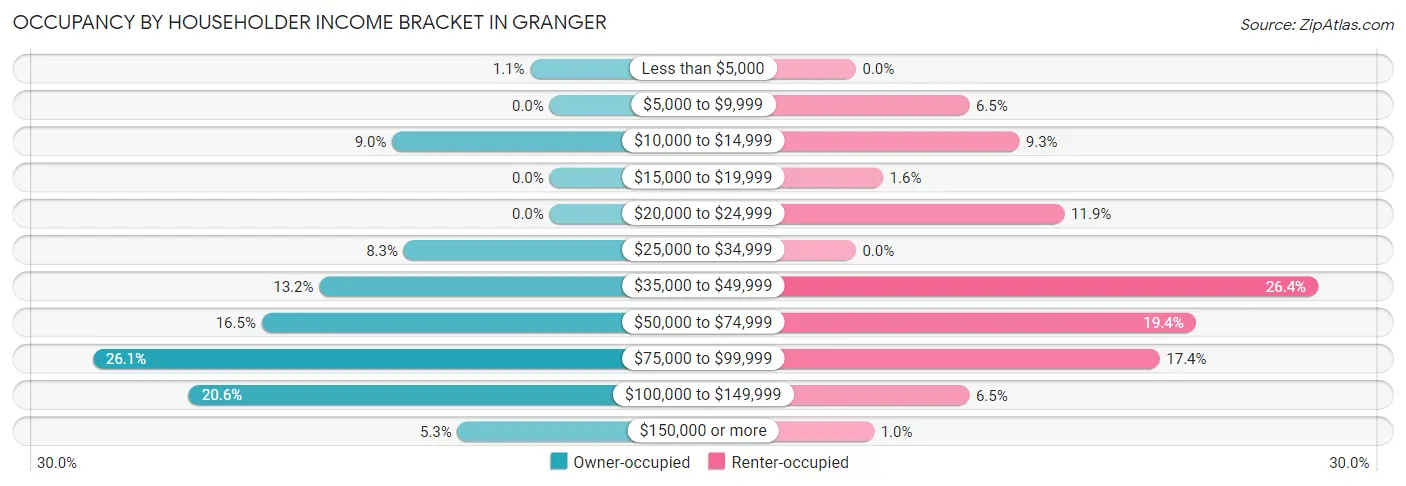
| Income Bracket | Owner-occupied | Renter-occupied |
| Less than $5,000 | 5 (1.1%) | 0 (0.0%) |
| $5,000 to $9,999 | 0 (0.0%) | 25 (6.5%) |
| $10,000 to $14,999 | 41 (9.0%) | 36 (9.3%) |
| $15,000 to $19,999 | 0 (0.0%) | 6 (1.5%) |
| $20,000 to $24,999 | 0 (0.0%) | 46 (11.9%) |
| $25,000 to $34,999 | 38 (8.3%) | 0 (0.0%) |
| $35,000 to $49,999 | 60 (13.2%) | 102 (26.4%) |
| $50,000 to $74,999 | 75 (16.5%) | 75 (19.4%) |
| $75,000 to $99,999 | 119 (26.1%) | 67 (17.4%) |
| $100,000 to $149,999 | 94 (20.6%) | 25 (6.5%) |
| $150,000 or more | 24 (5.3%) | 4 (1.0%) |
| Total | 456 (100.0%) | 386 (100.0%) |
Monthly Housing Cost Tiers in Granger
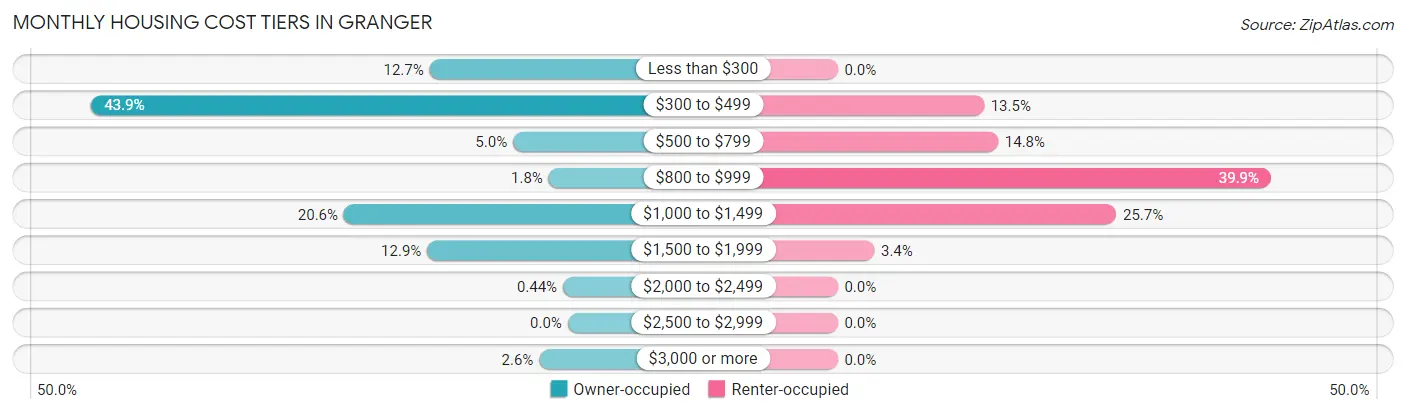
| Monthly Cost | Owner-occupied | Renter-occupied |
| Less than $300 | 58 (12.7%) | 0 (0.0%) |
| $300 to $499 | 200 (43.9%) | 52 (13.5%) |
| $500 to $799 | 23 (5.0%) | 57 (14.8%) |
| $800 to $999 | 8 (1.8%) | 154 (39.9%) |
| $1,000 to $1,499 | 94 (20.6%) | 99 (25.7%) |
| $1,500 to $1,999 | 59 (12.9%) | 13 (3.4%) |
| $2,000 to $2,499 | 2 (0.4%) | 0 (0.0%) |
| $2,500 to $2,999 | 0 (0.0%) | 0 (0.0%) |
| $3,000 or more | 12 (2.6%) | 0 (0.0%) |
| Total | 456 (100.0%) | 386 (100.0%) |
Physical Housing Characteristics in Granger
Housing Structures in Granger
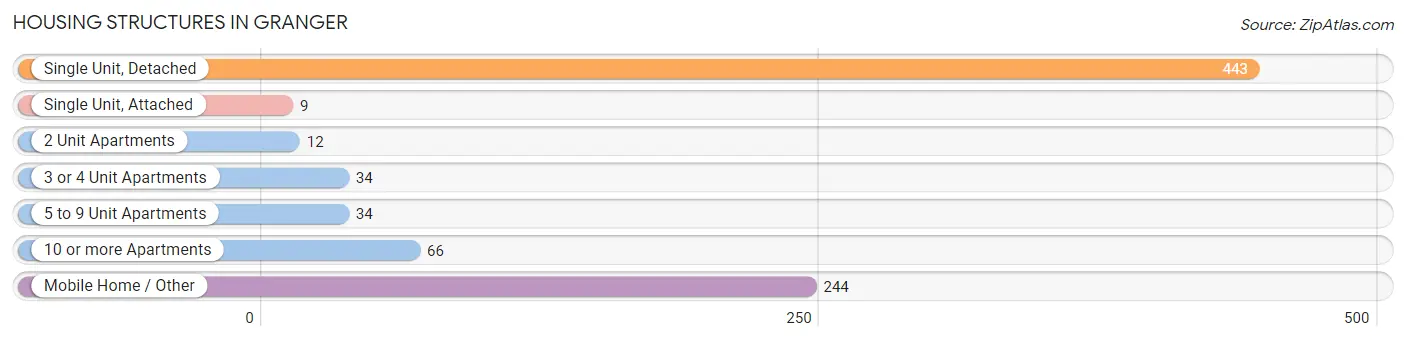
| Structure Type | # Housing Units | % Housing Units |
| Single Unit, Detached | 443 | 52.6% |
| Single Unit, Attached | 9 | 1.1% |
| 2 Unit Apartments | 12 | 1.4% |
| 3 or 4 Unit Apartments | 34 | 4.0% |
| 5 to 9 Unit Apartments | 34 | 4.0% |
| 10 or more Apartments | 66 | 7.8% |
| Mobile Home / Other | 244 | 29.0% |
| Total | 842 | 100.0% |
Housing Structures by Occupancy in Granger
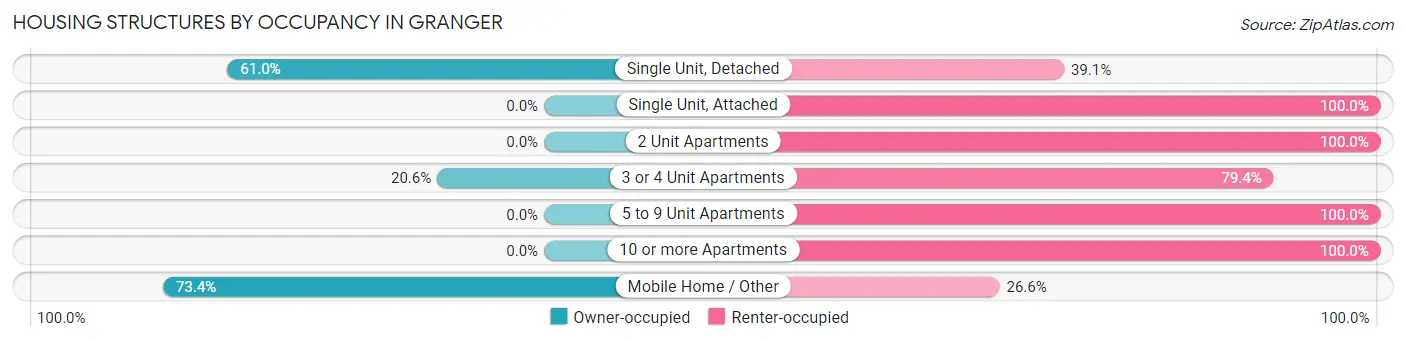
| Structure Type | Owner-occupied | Renter-occupied |
| Single Unit, Detached | 270 (61.0%) | 173 (39.1%) |
| Single Unit, Attached | 0 (0.0%) | 9 (100.0%) |
| 2 Unit Apartments | 0 (0.0%) | 12 (100.0%) |
| 3 or 4 Unit Apartments | 7 (20.6%) | 27 (79.4%) |
| 5 to 9 Unit Apartments | 0 (0.0%) | 34 (100.0%) |
| 10 or more Apartments | 0 (0.0%) | 66 (100.0%) |
| Mobile Home / Other | 179 (73.4%) | 65 (26.6%) |
| Total | 456 (54.2%) | 386 (45.8%) |
Housing Structures by Number of Rooms in Granger
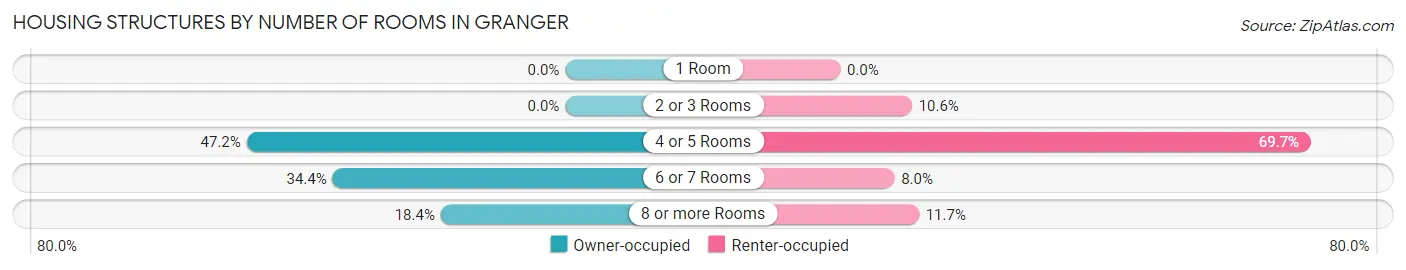
| Number of Rooms | Owner-occupied | Renter-occupied |
| 1 Room | 0 (0.0%) | 0 (0.0%) |
| 2 or 3 Rooms | 0 (0.0%) | 41 (10.6%) |
| 4 or 5 Rooms | 215 (47.1%) | 269 (69.7%) |
| 6 or 7 Rooms | 157 (34.4%) | 31 (8.0%) |
| 8 or more Rooms | 84 (18.4%) | 45 (11.7%) |
| Total | 456 (100.0%) | 386 (100.0%) |
Housing Structure by Heating Type in Granger
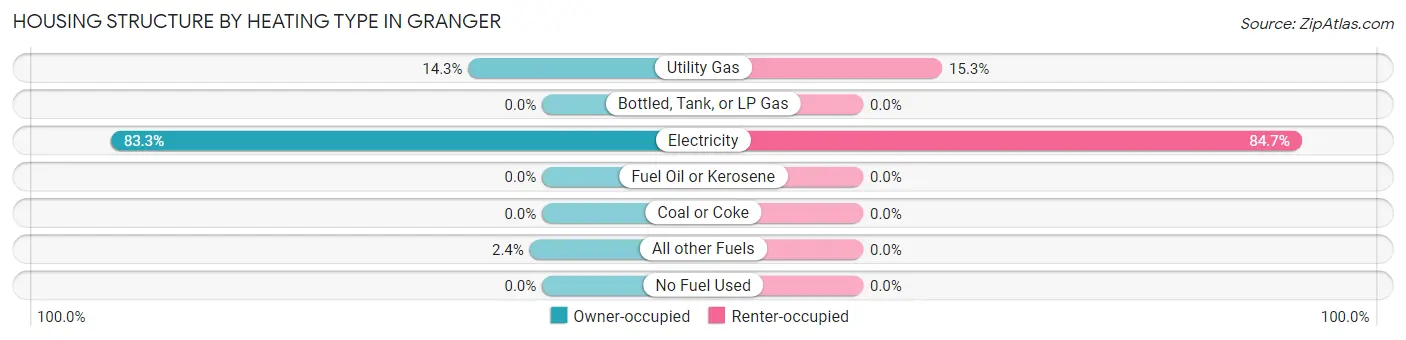
| Heating Type | Owner-occupied | Renter-occupied |
| Utility Gas | 65 (14.2%) | 59 (15.3%) |
| Bottled, Tank, or LP Gas | 0 (0.0%) | 0 (0.0%) |
| Electricity | 380 (83.3%) | 327 (84.7%) |
| Fuel Oil or Kerosene | 0 (0.0%) | 0 (0.0%) |
| Coal or Coke | 0 (0.0%) | 0 (0.0%) |
| All other Fuels | 11 (2.4%) | 0 (0.0%) |
| No Fuel Used | 0 (0.0%) | 0 (0.0%) |
| Total | 456 (100.0%) | 386 (100.0%) |
Household Vehicle Usage in Granger
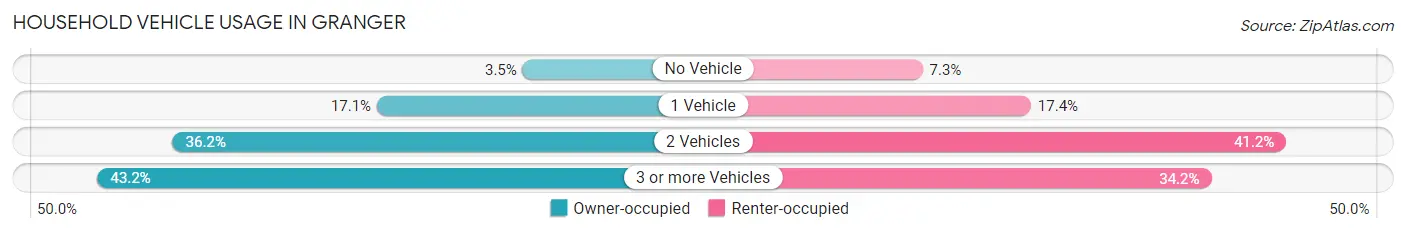
| Vehicles per Household | Owner-occupied | Renter-occupied |
| No Vehicle | 16 (3.5%) | 28 (7.2%) |
| 1 Vehicle | 78 (17.1%) | 67 (17.4%) |
| 2 Vehicles | 165 (36.2%) | 159 (41.2%) |
| 3 or more Vehicles | 197 (43.2%) | 132 (34.2%) |
| Total | 456 (100.0%) | 386 (100.0%) |
Real Estate & Mortgages in Granger
Real Estate and Mortgage Overview in Granger
| Characteristic | Without Mortgage | With Mortgage |
| Housing Units | 286 | 170 |
| Median Property Value | - | - |
| Median Household Income | $75,227 | $24 |
| Monthly Housing Costs | $345 | $12 |
| Real Estate Taxes | - | - |
Property Value by Mortgage Status in Granger
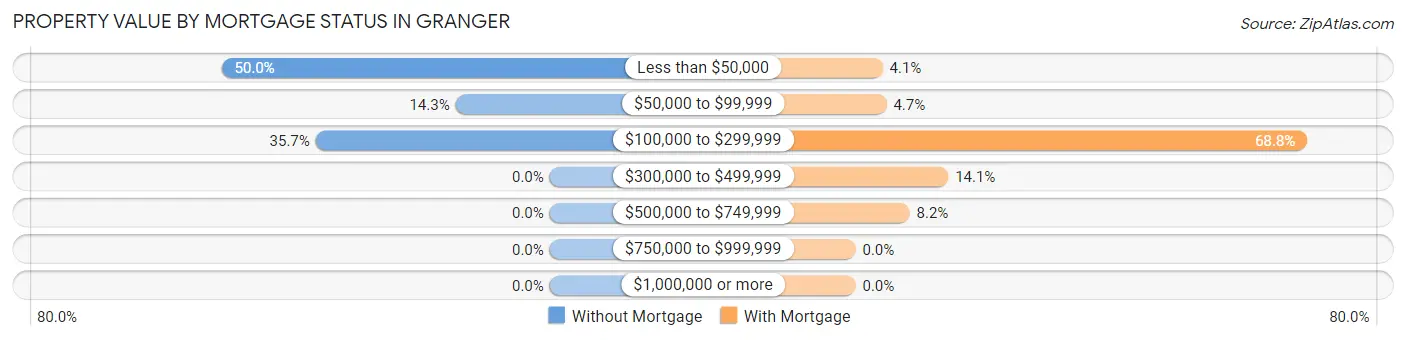
| Property Value | Without Mortgage | With Mortgage |
| Less than $50,000 | 143 (50.0%) | 7 (4.1%) |
| $50,000 to $99,999 | 41 (14.3%) | 8 (4.7%) |
| $100,000 to $299,999 | 102 (35.7%) | 117 (68.8%) |
| $300,000 to $499,999 | 0 (0.0%) | 24 (14.1%) |
| $500,000 to $749,999 | 0 (0.0%) | 14 (8.2%) |
| $750,000 to $999,999 | 0 (0.0%) | 0 (0.0%) |
| $1,000,000 or more | 0 (0.0%) | 0 (0.0%) |
| Total | 286 (100.0%) | 170 (100.0%) |
Household Income by Mortgage Status in Granger
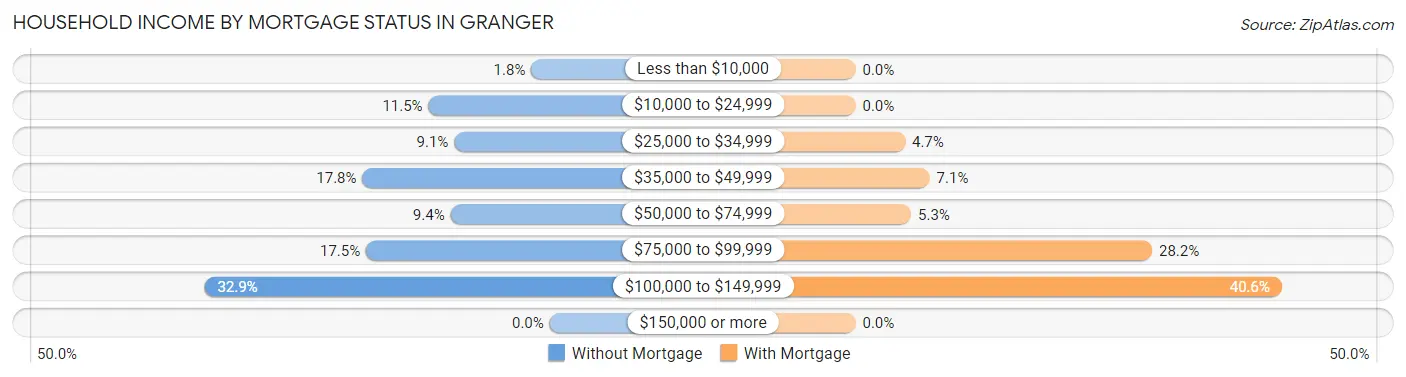
| Household Income | Without Mortgage | With Mortgage |
| Less than $10,000 | 5 (1.8%) | 0 (0.0%) |
| $10,000 to $24,999 | 33 (11.5%) | 0 (0.0%) |
| $25,000 to $34,999 | 26 (9.1%) | 8 (4.7%) |
| $35,000 to $49,999 | 51 (17.8%) | 12 (7.1%) |
| $50,000 to $74,999 | 27 (9.4%) | 9 (5.3%) |
| $75,000 to $99,999 | 50 (17.5%) | 48 (28.2%) |
| $100,000 to $149,999 | 94 (32.9%) | 69 (40.6%) |
| $150,000 or more | 0 (0.0%) | 0 (0.0%) |
| Total | 286 (100.0%) | 170 (100.0%) |
Property Value to Household Income Ratio in Granger
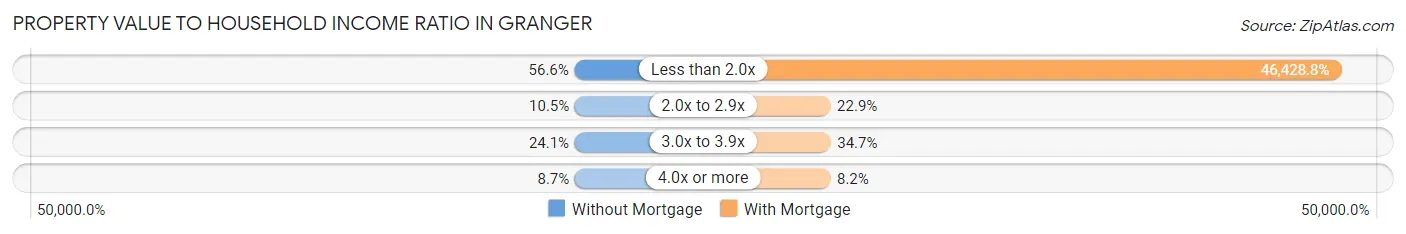
| Value-to-Income Ratio | Without Mortgage | With Mortgage |
| Less than 2.0x | 162 (56.6%) | 78,929 (46,428.8%) |
| 2.0x to 2.9x | 30 (10.5%) | 39 (22.9%) |
| 3.0x to 3.9x | 69 (24.1%) | 59 (34.7%) |
| 4.0x or more | 25 (8.7%) | 14 (8.2%) |
| Total | 286 (100.0%) | 170 (100.0%) |
Real Estate Taxes by Mortgage Status in Granger
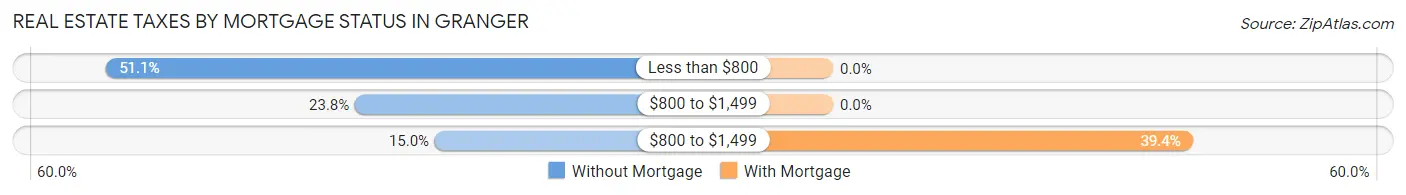
| Property Taxes | Without Mortgage | With Mortgage |
| Less than $800 | 146 (51.0%) | 0 (0.0%) |
| $800 to $1,499 | 68 (23.8%) | 0 (0.0%) |
| $800 to $1,499 | 43 (15.0%) | 67 (39.4%) |
| Total | 286 (100.0%) | 170 (100.0%) |
Health & Disability in Granger
Health Insurance Coverage by Age in Granger
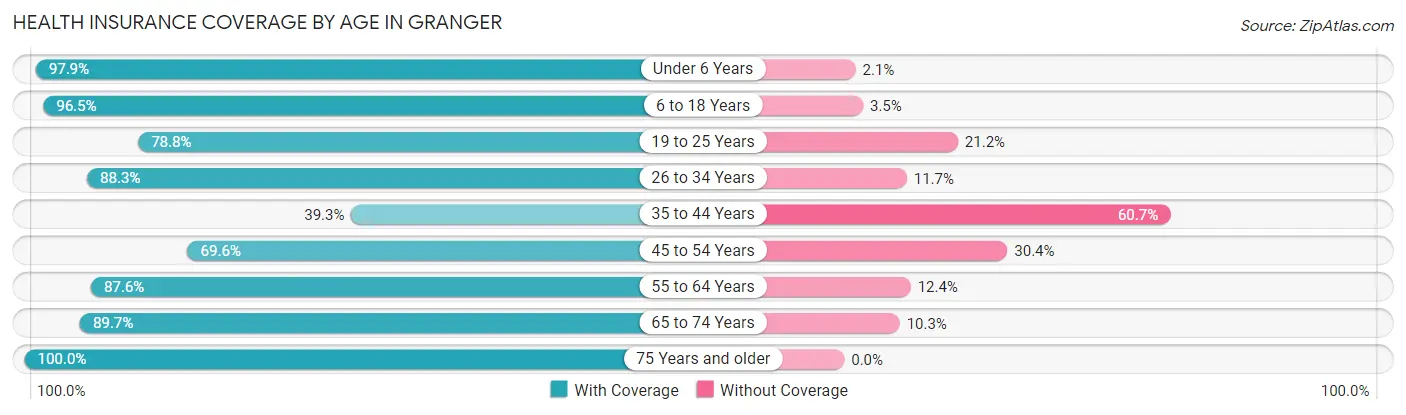
| Age Bracket | With Coverage | Without Coverage |
| Under 6 Years | 325 (97.9%) | 7 (2.1%) |
| 6 to 18 Years | 1,245 (96.5%) | 45 (3.5%) |
| 19 to 25 Years | 424 (78.8%) | 114 (21.2%) |
| 26 to 34 Years | 288 (88.3%) | 38 (11.7%) |
| 35 to 44 Years | 194 (39.3%) | 300 (60.7%) |
| 45 to 54 Years | 206 (69.6%) | 90 (30.4%) |
| 55 to 64 Years | 92 (87.6%) | 13 (12.4%) |
| 65 to 74 Years | 191 (89.7%) | 22 (10.3%) |
| 75 Years and older | 38 (100.0%) | 0 (0.0%) |
| Total | 3,003 (82.7%) | 629 (17.3%) |
Health Insurance Coverage by Citizenship Status in Granger
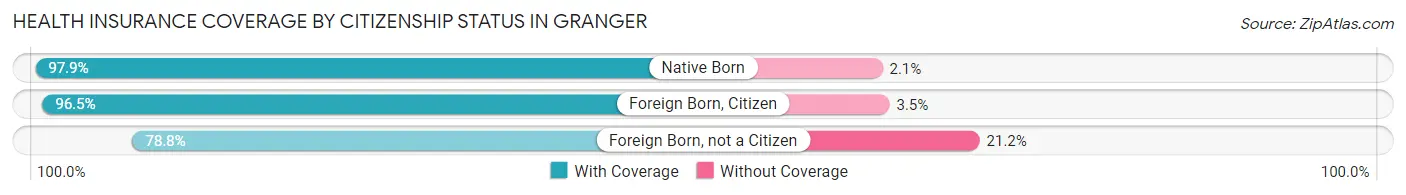
| Citizenship Status | With Coverage | Without Coverage |
| Native Born | 325 (97.9%) | 7 (2.1%) |
| Foreign Born, Citizen | 1,245 (96.5%) | 45 (3.5%) |
| Foreign Born, not a Citizen | 424 (78.8%) | 114 (21.2%) |
Health Insurance Coverage by Household Income in Granger
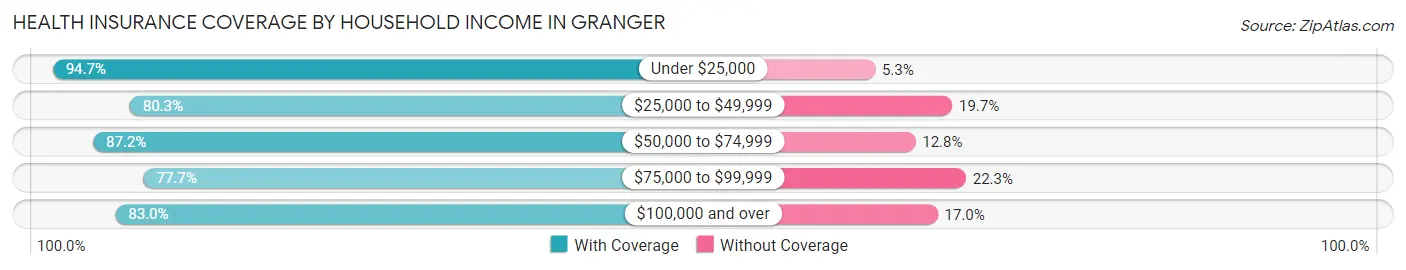
| Household Income | With Coverage | Without Coverage |
| Under $25,000 | 431 (94.7%) | 24 (5.3%) |
| $25,000 to $49,999 | 684 (80.3%) | 168 (19.7%) |
| $50,000 to $74,999 | 577 (87.2%) | 85 (12.8%) |
| $75,000 to $99,999 | 823 (77.7%) | 236 (22.3%) |
| $100,000 and over | 488 (83.0%) | 100 (17.0%) |
Public vs Private Health Insurance Coverage by Age in Granger
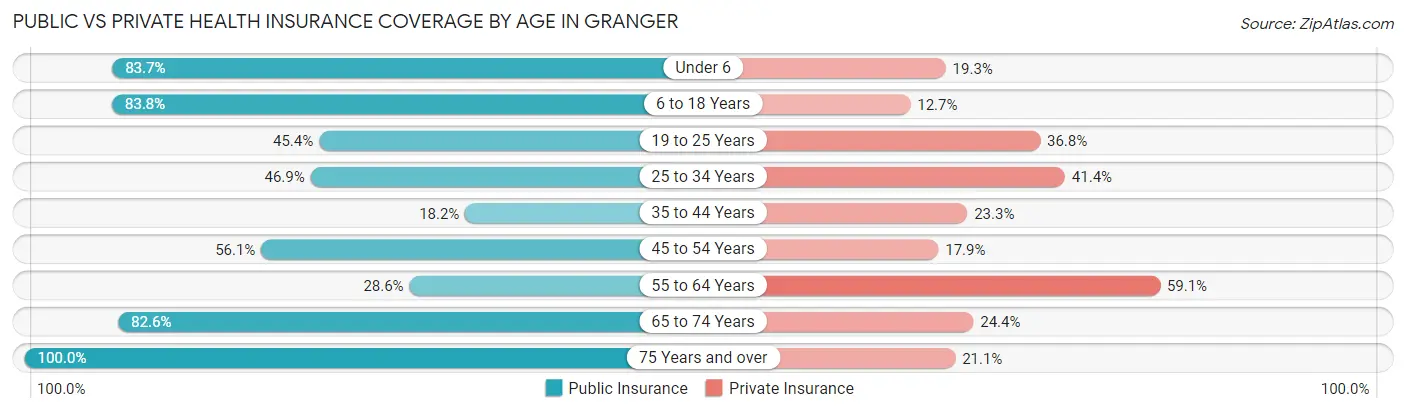
| Age Bracket | Public Insurance | Private Insurance |
| Under 6 | 278 (83.7%) | 64 (19.3%) |
| 6 to 18 Years | 1,081 (83.8%) | 164 (12.7%) |
| 19 to 25 Years | 244 (45.4%) | 198 (36.8%) |
| 25 to 34 Years | 153 (46.9%) | 135 (41.4%) |
| 35 to 44 Years | 90 (18.2%) | 115 (23.3%) |
| 45 to 54 Years | 166 (56.1%) | 53 (17.9%) |
| 55 to 64 Years | 30 (28.6%) | 62 (59.1%) |
| 65 to 74 Years | 176 (82.6%) | 52 (24.4%) |
| 75 Years and over | 38 (100.0%) | 8 (21.0%) |
| Total | 2,256 (62.1%) | 851 (23.4%) |
Disability Status by Sex by Age in Granger
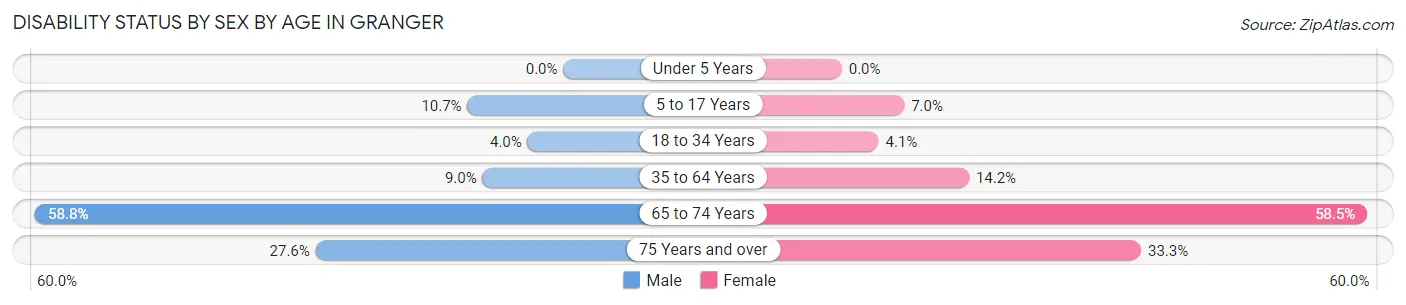
| Age Bracket | Male | Female |
| Under 5 Years | 0 (0.0%) | 0 (0.0%) |
| 5 to 17 Years | 80 (10.7%) | 33 (7.0%) |
| 18 to 34 Years | 21 (4.0%) | 20 (4.1%) |
| 35 to 64 Years | 38 (9.0%) | 67 (14.2%) |
| 65 to 74 Years | 70 (58.8%) | 55 (58.5%) |
| 75 Years and over | 8 (27.6%) | 3 (33.3%) |
Disability Class by Sex by Age in Granger
Disability Class: Hearing Difficulty
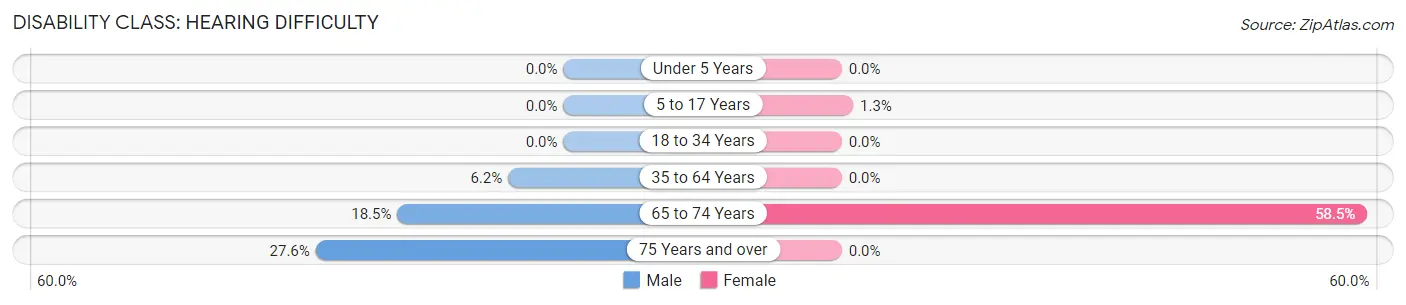
| Age Bracket | Male | Female |
| Under 5 Years | 0 (0.0%) | 0 (0.0%) |
| 5 to 17 Years | 0 (0.0%) | 6 (1.3%) |
| 18 to 34 Years | 0 (0.0%) | 0 (0.0%) |
| 35 to 64 Years | 26 (6.2%) | 0 (0.0%) |
| 65 to 74 Years | 22 (18.5%) | 55 (58.5%) |
| 75 Years and over | 8 (27.6%) | 0 (0.0%) |
Disability Class: Vision Difficulty
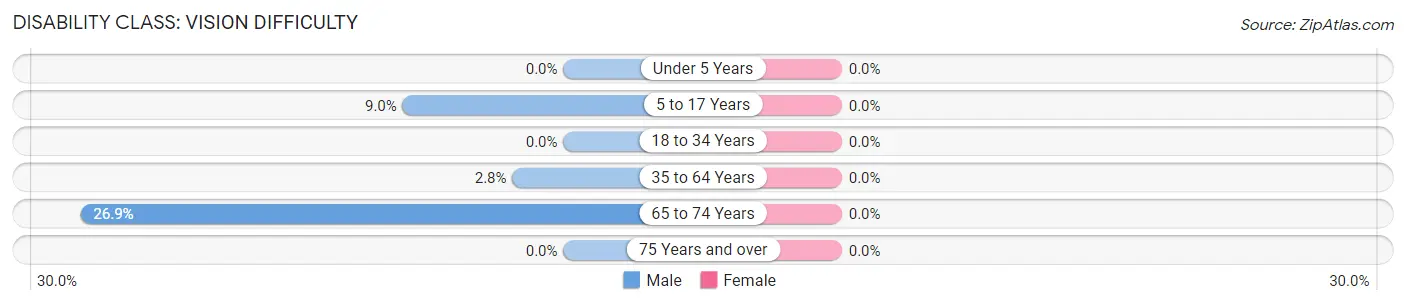
| Age Bracket | Male | Female |
| Under 5 Years | 0 (0.0%) | 0 (0.0%) |
| 5 to 17 Years | 67 (8.9%) | 0 (0.0%) |
| 18 to 34 Years | 0 (0.0%) | 0 (0.0%) |
| 35 to 64 Years | 12 (2.8%) | 0 (0.0%) |
| 65 to 74 Years | 32 (26.9%) | 0 (0.0%) |
| 75 Years and over | 0 (0.0%) | 0 (0.0%) |
Disability Class: Cognitive Difficulty
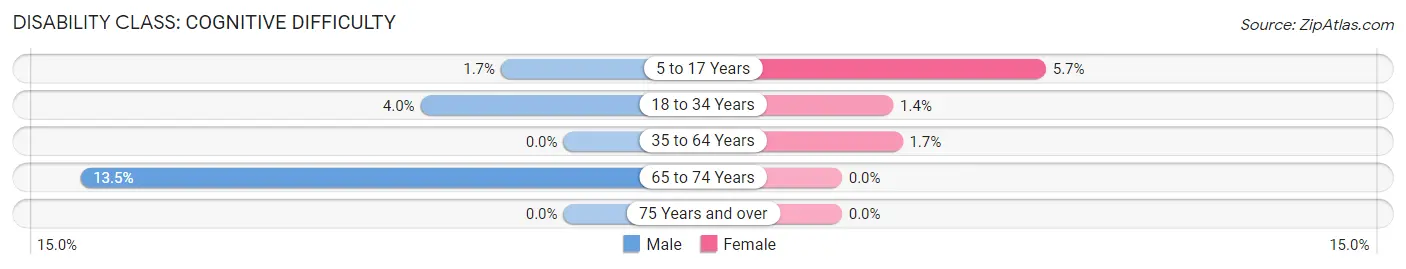
| Age Bracket | Male | Female |
| 5 to 17 Years | 13 (1.7%) | 27 (5.7%) |
| 18 to 34 Years | 21 (4.0%) | 7 (1.4%) |
| 35 to 64 Years | 0 (0.0%) | 8 (1.7%) |
| 65 to 74 Years | 16 (13.5%) | 0 (0.0%) |
| 75 Years and over | 0 (0.0%) | 0 (0.0%) |
Disability Class: Ambulatory Difficulty
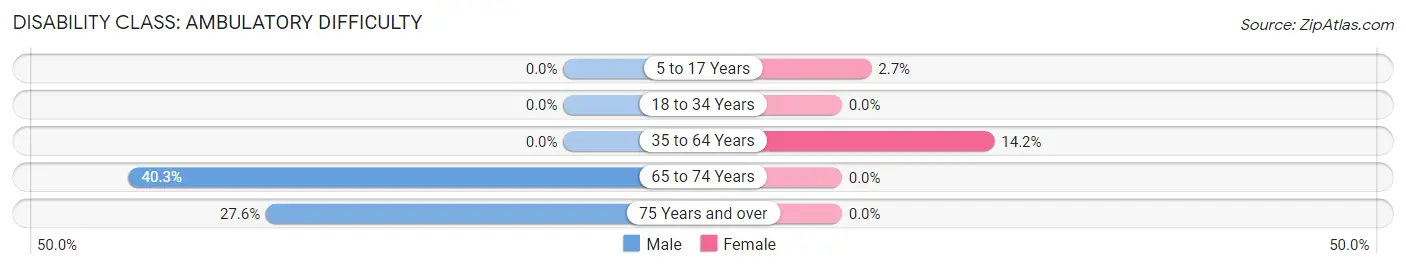
| Age Bracket | Male | Female |
| 5 to 17 Years | 0 (0.0%) | 13 (2.7%) |
| 18 to 34 Years | 0 (0.0%) | 0 (0.0%) |
| 35 to 64 Years | 0 (0.0%) | 67 (14.2%) |
| 65 to 74 Years | 48 (40.3%) | 0 (0.0%) |
| 75 Years and over | 8 (27.6%) | 0 (0.0%) |
Disability Class: Self-Care Difficulty
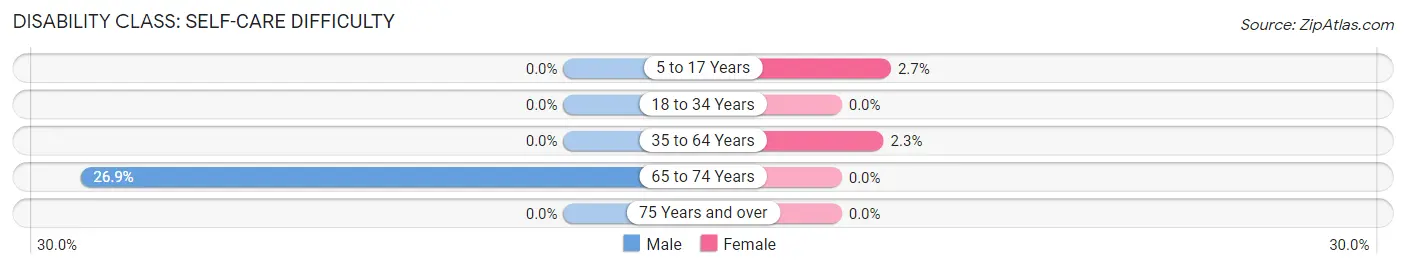
| Age Bracket | Male | Female |
| 5 to 17 Years | 0 (0.0%) | 13 (2.7%) |
| 18 to 34 Years | 0 (0.0%) | 0 (0.0%) |
| 35 to 64 Years | 0 (0.0%) | 11 (2.3%) |
| 65 to 74 Years | 32 (26.9%) | 0 (0.0%) |
| 75 Years and over | 0 (0.0%) | 0 (0.0%) |
Technology Access in Granger
Computing Device Access in Granger
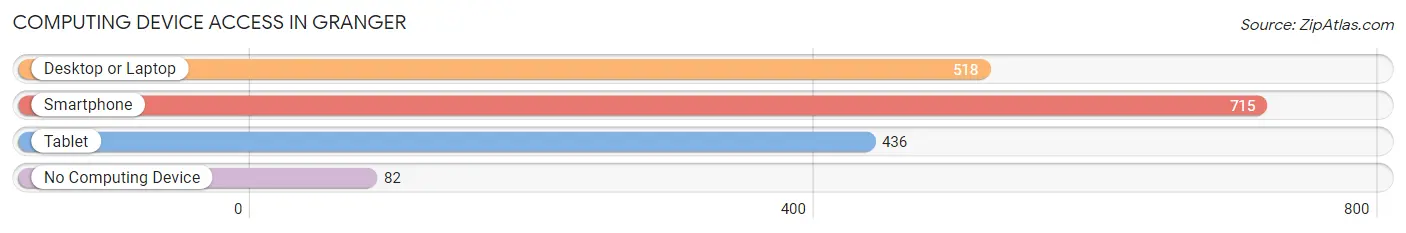
| Device Type | # Households | % Households |
| Desktop or Laptop | 518 | 61.5% |
| Smartphone | 715 | 84.9% |
| Tablet | 436 | 51.8% |
| No Computing Device | 82 | 9.7% |
| Total | 842 | 100.0% |
Internet Access in Granger
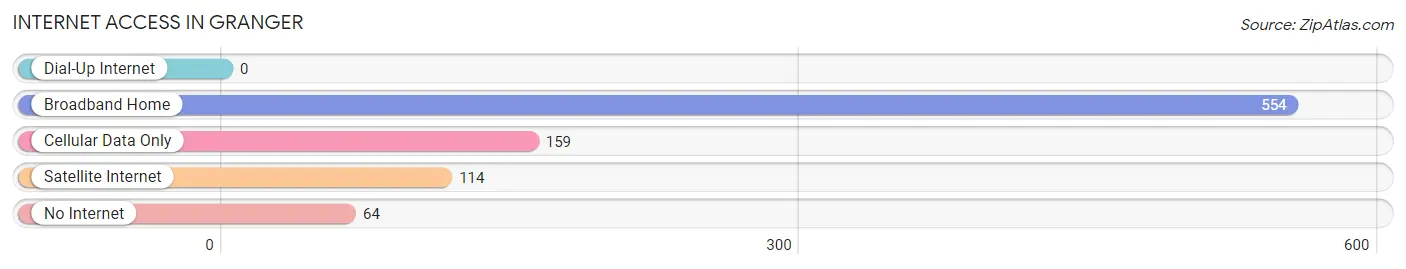
| Internet Type | # Households | % Households |
| Dial-Up Internet | 0 | 0.0% |
| Broadband Home | 554 | 65.8% |
| Cellular Data Only | 159 | 18.9% |
| Satellite Internet | 114 | 13.5% |
| No Internet | 64 | 7.6% |
| Total | 842 | 100.0% |
Granger Summary
Granger is a small city located in the Yakima Valley of Washington State. It is situated in the foothills of the Cascade Mountains, approximately 30 miles south of the city of Yakima. The city is home to a population of approximately 5,000 people, and is the county seat of Yakima County.
Geography
Granger is located in the Yakima Valley, which is a large agricultural region in the eastern part of Washington State. The city is situated in the foothills of the Cascade Mountains, and is surrounded by rolling hills and farmland. The city is located at an elevation of 1,400 feet, and has a total area of 2.2 square miles. The climate in Granger is semi-arid, with hot summers and cold winters.
Economy
Granger’s economy is largely based on agriculture. The city is home to a number of farms and ranches, and is a major producer of apples, cherries, and other fruits and vegetables. The city is also home to a number of manufacturing and service businesses, including a large food processing plant.
Demographics
As of the 2010 census, the population of Granger was 5,000. The racial makeup of the city was 79.3% White, 0.7% African American, 0.7% Native American, 0.7% Asian, 0.2% Pacific Islander, and 17.3% from other races. Hispanic or Latino of any race were 28.3% of the population.
The median income for a household in Granger was $37,500, and the median income for a family was $41,250. The per capita income for the city was $17,000. About 16.3% of families and 19.2% of the population were below the poverty line, including 25.3% of those under age 18 and 8.3% of those age 65 or over.
History
Granger was founded in 1883 by a group of settlers from the Midwest. The city was named after the Granger family, who were among the first settlers in the area. The city was incorporated in 1891, and the first mayor was elected in 1892.
In the early 1900s, Granger was a thriving agricultural community, and the city was home to a number of farms and ranches. The city was also home to a number of manufacturing and service businesses, including a large food processing plant.
In the 1950s, the city began to experience a decline in population, as many of the city’s residents moved away in search of better economic opportunities. However, in recent years, the city has seen a resurgence in population, as many people have moved back to the area in search of a more rural lifestyle.
Today, Granger is a small city with a population of approximately 5,000 people. The city is home to a number of farms and ranches, and is a major producer of apples, cherries, and other fruits and vegetables. The city is also home to a number of manufacturing and service businesses, including a large food processing plant.
Common Questions
What is Per Capita Income in Granger?
Per Capita income in Granger is $16,568.
What is the Median Family Income in Granger?
Median Family Income in Granger is $52,262.
What is the Median Household income in Granger?
Median Household Income in Granger is $54,167.
What is Income or Wage Gap in Granger?
Income or Wage Gap in Granger is 43.1%.
Women in Granger earn 56.9 cents for every dollar earned by a man.
What is Family Income Deficit in Granger?
Family Income Deficit in Granger is $12,579.
Families that are below poverty line in Granger earn $12,579 less on average than the poverty threshold level.
What is Inequality or Gini Index in Granger?
Inequality or Gini Index in Granger is 0.40.
What is the Total Population of Granger?
Total Population of Granger is 3,632.
What is the Total Male Population of Granger?
Total Male Population of Granger is 1,914.
What is the Total Female Population of Granger?
Total Female Population of Granger is 1,718.
What is the Ratio of Males per 100 Females in Granger?
There are 111.41 Males per 100 Females in Granger.
What is the Ratio of Females per 100 Males in Granger?
There are 89.76 Females per 100 Males in Granger.
What is the Median Population Age in Granger?
Median Population Age in Granger is 21.9 Years.
What is the Average Family Size in Granger
Average Family Size in Granger is 4.5 People.
What is the Average Household Size in Granger
Average Household Size in Granger is 4.3 People.
How Large is the Labor Force in Granger?
There are 1,646 People in the Labor Forcein in Granger.
What is the Percentage of People in the Labor Force in Granger?
69.0% of People are in the Labor Force in Granger.
What is the Unemployment Rate in Granger?
Unemployment Rate in Granger is 16.7%.