Outlook, WA Map & Demographics
Outlook Map
Outlook Overview
$24,544
PER CAPITA INCOME
$68,351
AVG FAMILY INCOME
$68,351
AVG HOUSEHOLD INCOME
28.2%
WAGE / INCOME GAP [ % ]
71.8¢/ $1
WAGE / INCOME GAP [ $ ]
0.18
INEQUALITY / GINI INDEX
340
TOTAL POPULATION
108
MALE POPULATION
232
FEMALE POPULATION
46.55
MALES / 100 FEMALES
214.81
FEMALES / 100 MALES
44.5
MEDIAN AGE
2.8
AVG FAMILY SIZE
2.8
AVG HOUSEHOLD SIZE
263
LABOR FORCE [ PEOPLE ]
100.0%
PERCENT IN LABOR FORCE
Outlook Zip Codes
Outlook Area Codes
Income in Outlook
Income Overview in Outlook
Per Capita Income in Outlook is $24,544, while median incomes of families and households are $68,351 and $68,351 respectively.
| Characteristic | Number | Measure |
| Per Capita Income | 340 | $24,544 |
| Median Family Income | 122 | $68,351 |
| Mean Family Income | 122 | $67,288 |
| Median Household Income | 122 | $68,351 |
| Mean Household Income | 122 | $67,288 |
| Income Deficit | 122 | $0 |
| Wage / Income Gap (%) | 340 | 28.23% |
| Wage / Income Gap ($) | 340 | 71.77¢ per $1 |
| Gini / Inequality Index | 340 | 0.18 |
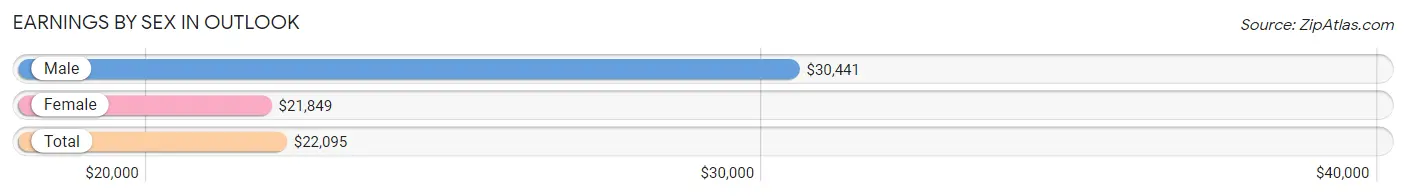
Earnings by Sex in Outlook
Average Earnings in Outlook are $22,095, $30,441 for men and $21,849 for women, a difference of 28.2%.
| Sex | Number | Average Earnings |
| Male | 88 (33.5%) | $30,441 |
| Female | 175 (66.5%) | $21,849 |
| Total | 263 (100.0%) | $22,095 |
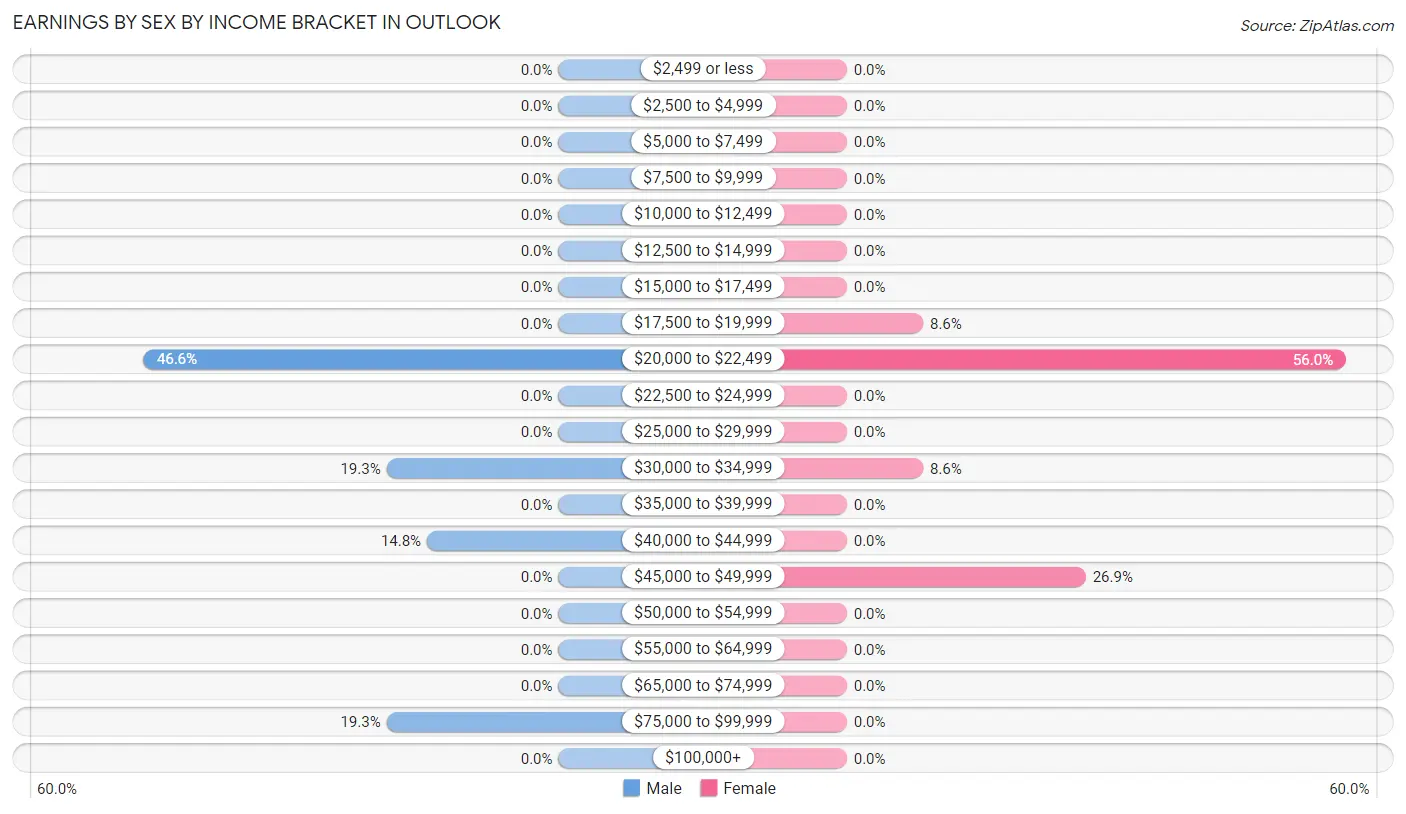
Earnings by Sex by Income Bracket in Outlook
The most common earnings brackets in Outlook are $20,000 to $22,499 for men (41 | 46.6%) and $20,000 to $22,499 for women (98 | 56.0%).
| Income | Male | Female |
| $2,499 or less | 0 (0.0%) | 0 (0.0%) |
| $2,500 to $4,999 | 0 (0.0%) | 0 (0.0%) |
| $5,000 to $7,499 | 0 (0.0%) | 0 (0.0%) |
| $7,500 to $9,999 | 0 (0.0%) | 0 (0.0%) |
| $10,000 to $12,499 | 0 (0.0%) | 0 (0.0%) |
| $12,500 to $14,999 | 0 (0.0%) | 0 (0.0%) |
| $15,000 to $17,499 | 0 (0.0%) | 0 (0.0%) |
| $17,500 to $19,999 | 0 (0.0%) | 15 (8.6%) |
| $20,000 to $22,499 | 41 (46.6%) | 98 (56.0%) |
| $22,500 to $24,999 | 0 (0.0%) | 0 (0.0%) |
| $25,000 to $29,999 | 0 (0.0%) | 0 (0.0%) |
| $30,000 to $34,999 | 17 (19.3%) | 15 (8.6%) |
| $35,000 to $39,999 | 0 (0.0%) | 0 (0.0%) |
| $40,000 to $44,999 | 13 (14.8%) | 0 (0.0%) |
| $45,000 to $49,999 | 0 (0.0%) | 47 (26.9%) |
| $50,000 to $54,999 | 0 (0.0%) | 0 (0.0%) |
| $55,000 to $64,999 | 0 (0.0%) | 0 (0.0%) |
| $65,000 to $74,999 | 0 (0.0%) | 0 (0.0%) |
| $75,000 to $99,999 | 17 (19.3%) | 0 (0.0%) |
| $100,000+ | 0 (0.0%) | 0 (0.0%) |
| Total | 88 (100.0%) | 175 (100.0%) |
Earnings by Sex by Educational Attainment in Outlook
| Educational Attainment | Male Income | Female Income |
| Less than High School | - | - |
| High School Diploma | - | - |
| College or Associate's Degree | - | - |
| Bachelor's Degree | - | - |
| Graduate Degree | - | - |
| Total | $30,441 | $0 |
Family Income in Outlook
Family Income Brackets in Outlook
According to the Outlook family income data, there are 47 families falling into the $50,000 to $74,999 income range, which is the most common income bracket and makes up 38.5% of all families.
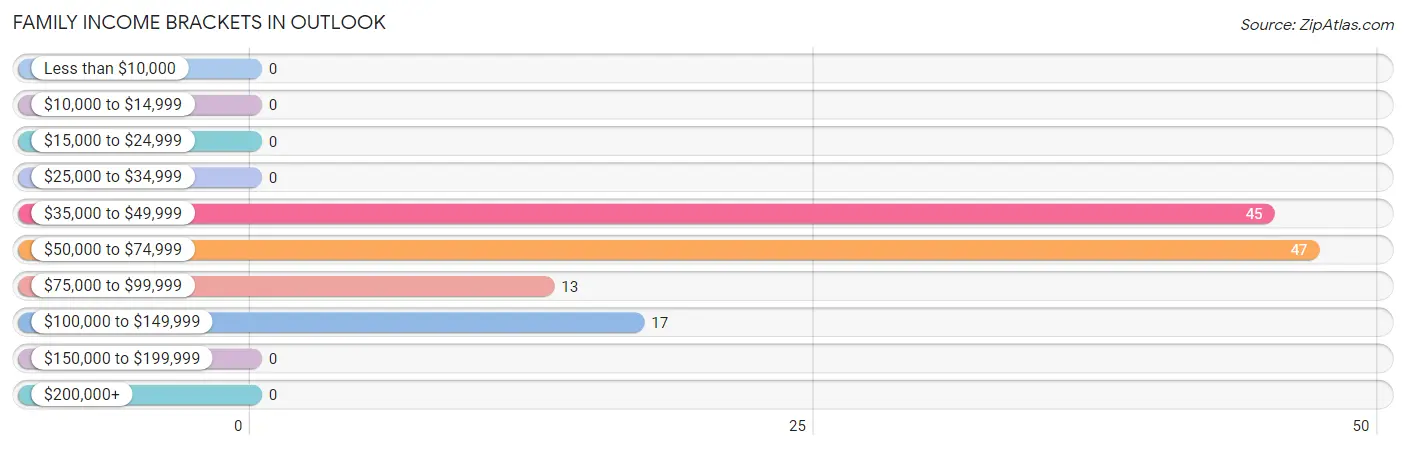
| Income Bracket | # Families | % Families |
| Less than $10,000 | 0 | 0.0% |
| $10,000 to $14,999 | 0 | 0.0% |
| $15,000 to $24,999 | 0 | 0.0% |
| $25,000 to $34,999 | 0 | 0.0% |
| $35,000 to $49,999 | 45 | 36.9% |
| $50,000 to $74,999 | 47 | 38.5% |
| $75,000 to $99,999 | 13 | 10.7% |
| $100,000 to $149,999 | 17 | 13.9% |
| $150,000 to $199,999 | 0 | 0.0% |
| $200,000+ | 0 | 0.0% |
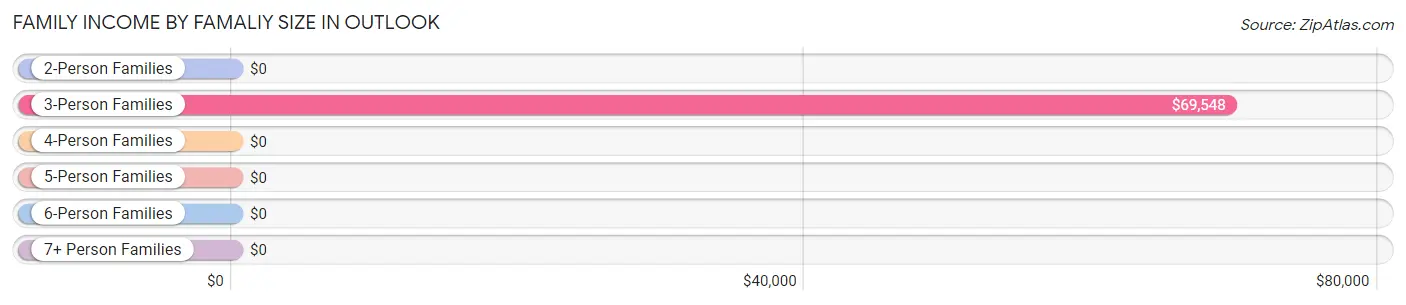
Family Income by Famaliy Size in Outlook
3-person families (77 | 63.1%) account for the highest median family income in Outlook with $69,548 per family, while 3-person families (77 | 63.1%) have the highest median income of $23,183 per family member.
| Income Bracket | # Families | Median Income |
| 2-Person Families | 45 (36.9%) | $0 |
| 3-Person Families | 77 (63.1%) | $69,548 |
| 4-Person Families | 0 (0.0%) | $0 |
| 5-Person Families | 0 (0.0%) | $0 |
| 6-Person Families | 0 (0.0%) | $0 |
| 7+ Person Families | 0 (0.0%) | $0 |
| Total | 122 (100.0%) | $68,351 |
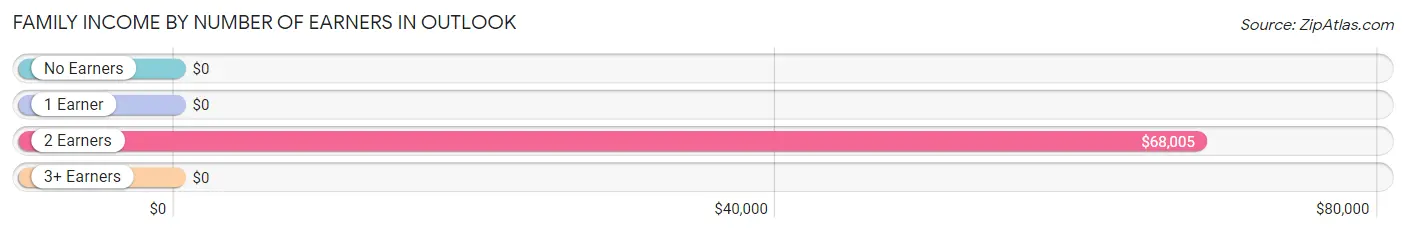
Family Income by Number of Earners in Outlook
| Number of Earners | # Families | Median Income |
| No Earners | 0 (0.0%) | $0 |
| 1 Earner | 0 (0.0%) | $0 |
| 2 Earners | 109 (89.3%) | $68,005 |
| 3+ Earners | 13 (10.7%) | $0 |
| Total | 122 (100.0%) | $68,351 |
Household Income in Outlook
Household Income Brackets in Outlook
With 47 households falling in the category, the $50,000 to $74,999 income range is the most frequent in Outlook, accounting for 38.5% of all households.
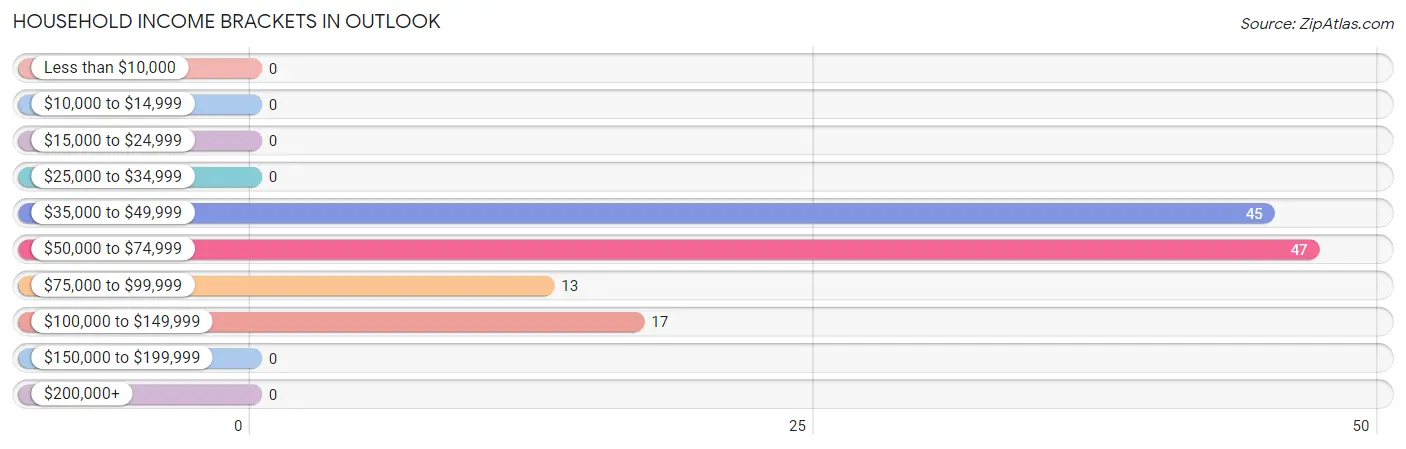
| Income Bracket | # Households | % Households |
| Less than $10,000 | 0 | 0.0% |
| $10,000 to $14,999 | 0 | 0.0% |
| $15,000 to $24,999 | 0 | 0.0% |
| $25,000 to $34,999 | 0 | 0.0% |
| $35,000 to $49,999 | 45 | 36.9% |
| $50,000 to $74,999 | 47 | 38.5% |
| $75,000 to $99,999 | 13 | 10.7% |
| $100,000 to $149,999 | 17 | 13.9% |
| $150,000 to $199,999 | 0 | 0.0% |
| $200,000+ | 0 | 0.0% |
Household Income by Householder Age in Outlook
The median household income in Outlook is $68,351, with the highest median household income of $67,899 found in the 45 to 64 years age bracket for the primary householder. A total of 105 households (86.1%) fall into this category.
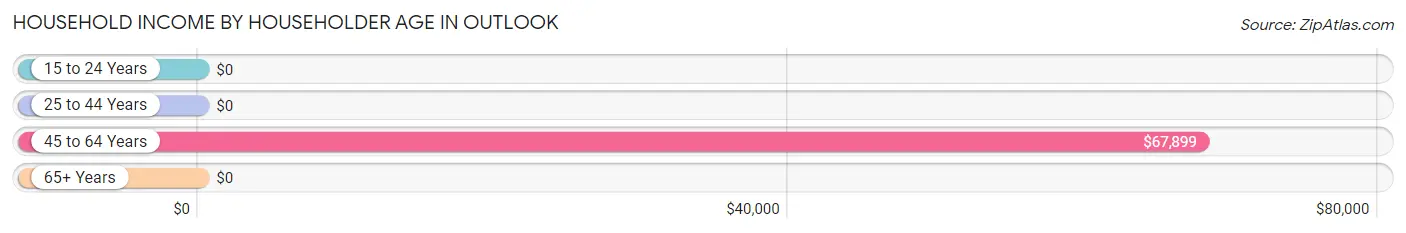
| Income Bracket | # Households | Median Income |
| 15 to 24 Years | 0 (0.0%) | $0 |
| 25 to 44 Years | 17 (13.9%) | $0 |
| 45 to 64 Years | 105 (86.1%) | $67,899 |
| 65+ Years | 0 (0.0%) | $0 |
| Total | 122 (100.0%) | $68,351 |
Poverty in Outlook
Income Below Poverty by Sex and Age in Outlook
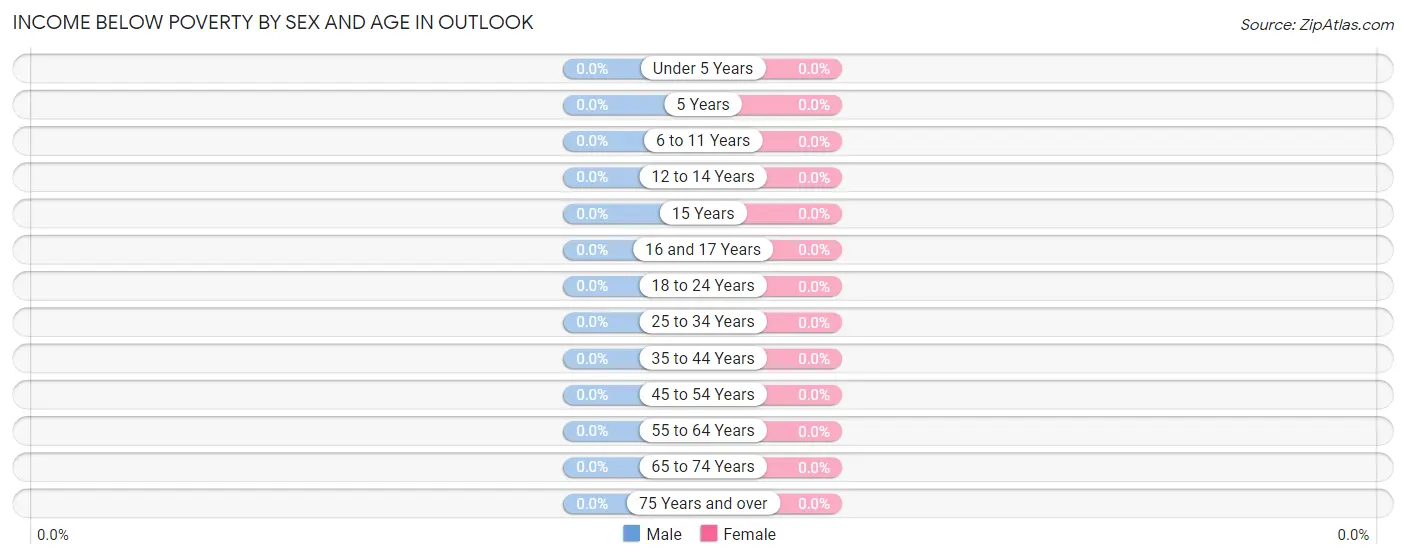
| Age Bracket | Male | Female |
| Under 5 Years | 0 (0.0%) | 0 (0.0%) |
| 5 Years | 0 (0.0%) | 0 (0.0%) |
| 6 to 11 Years | 0 (0.0%) | 0 (0.0%) |
| 12 to 14 Years | 0 (0.0%) | 0 (0.0%) |
| 15 Years | 0 (0.0%) | 0 (0.0%) |
| 16 and 17 Years | 0 (0.0%) | 0 (0.0%) |
| 18 to 24 Years | 0 (0.0%) | 0 (0.0%) |
| 25 to 34 Years | 0 (0.0%) | 0 (0.0%) |
| 35 to 44 Years | 0 (0.0%) | 0 (0.0%) |
| 45 to 54 Years | 0 (0.0%) | 0 (0.0%) |
| 55 to 64 Years | 0 (0.0%) | 0 (0.0%) |
| 65 to 74 Years | 0 (0.0%) | 0 (0.0%) |
| 75 Years and over | 0 (0.0%) | 0 (0.0%) |
| Total | 0 (0.0%) | 0 (0.0%) |
Income Above Poverty by Sex and Age in Outlook
According to the poverty statistics in Outlook, males aged 15 years and females aged under 5 years are the age groups that are most secure financially, with 100.0% of males and 100.0% of females in these age groups living above the poverty line.
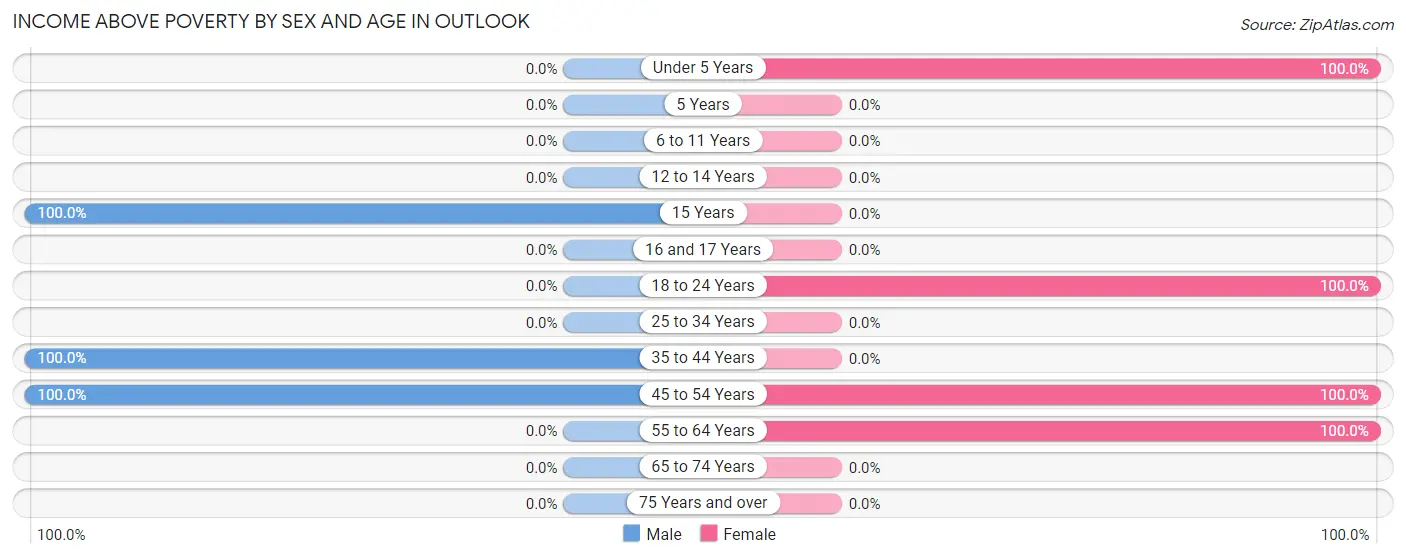
| Age Bracket | Male | Female |
| Under 5 Years | 0 (0.0%) | 57 (100.0%) |
| 5 Years | 0 (0.0%) | 0 (0.0%) |
| 6 to 11 Years | 0 (0.0%) | 0 (0.0%) |
| 12 to 14 Years | 0 (0.0%) | 0 (0.0%) |
| 15 Years | 20 (100.0%) | 0 (0.0%) |
| 16 and 17 Years | 0 (0.0%) | 0 (0.0%) |
| 18 to 24 Years | 0 (0.0%) | 68 (100.0%) |
| 25 to 34 Years | 0 (0.0%) | 0 (0.0%) |
| 35 to 44 Years | 34 (100.0%) | 0 (0.0%) |
| 45 to 54 Years | 54 (100.0%) | 60 (100.0%) |
| 55 to 64 Years | 0 (0.0%) | 47 (100.0%) |
| 65 to 74 Years | 0 (0.0%) | 0 (0.0%) |
| 75 Years and over | 0 (0.0%) | 0 (0.0%) |
| Total | 108 (100.0%) | 232 (100.0%) |
Income Below Poverty Among Married-Couple Families in Outlook
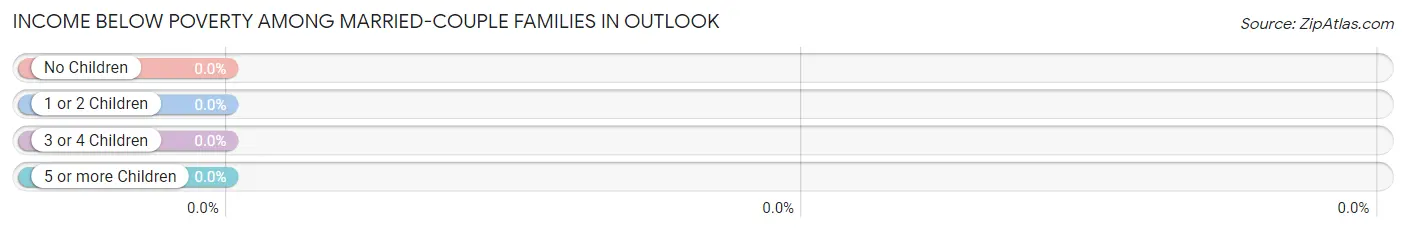
| Children | Above Poverty | Below Poverty |
| No Children | 58 (100.0%) | 0 (0.0%) |
| 1 or 2 Children | 0 (0.0%) | 0 (0.0%) |
| 3 or 4 Children | 0 (0.0%) | 0 (0.0%) |
| 5 or more Children | 0 (0.0%) | 0 (0.0%) |
| Total | 58 (100.0%) | 0 (0.0%) |
Income Below Poverty Among Single-Parent Households in Outlook
| Children | Single Father | Single Mother |
| No Children | 0 (0.0%) | 0 (0.0%) |
| 1 or 2 Children | 0 (0.0%) | 0 (0.0%) |
| 3 or 4 Children | 0 (0.0%) | 0 (0.0%) |
| 5 or more Children | 0 (0.0%) | 0 (0.0%) |
| Total | 0 (0.0%) | 0 (0.0%) |
Income Below Poverty Among Married-Couple vs Single-Parent Households in Outlook
| Children | Married-Couple Families | Single-Parent Households |
| No Children | 0 (0.0%) | 0 (0.0%) |
| 1 or 2 Children | 0 (0.0%) | 0 (0.0%) |
| 3 or 4 Children | 0 (0.0%) | 0 (0.0%) |
| 5 or more Children | 0 (0.0%) | 0 (0.0%) |
| Total | 0 (0.0%) | 0 (0.0%) |
Race in Outlook
The most populous races in Outlook are Hispanic or Latino (340 | 100.0%), White / Caucasian (157 | 46.2%), and Some other Race (97 | 28.5%).
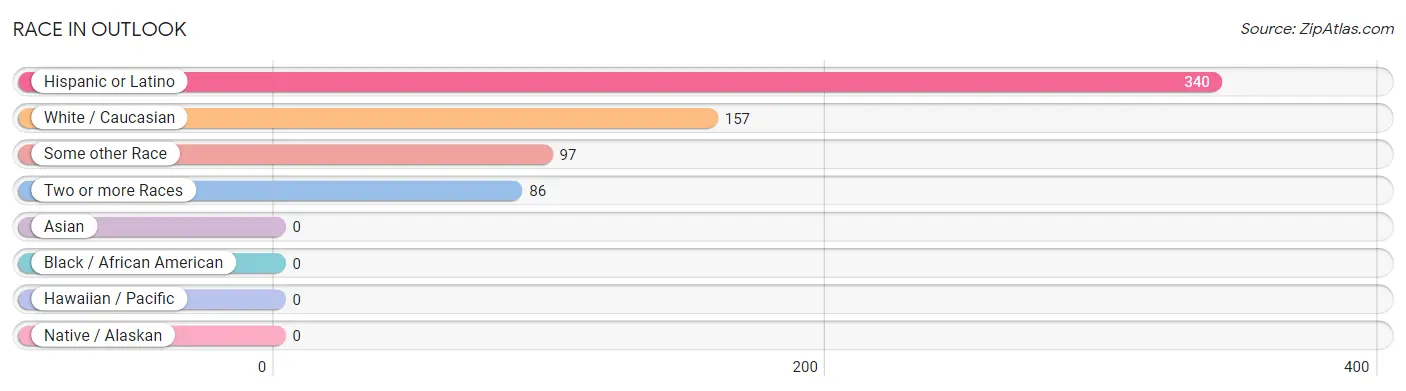
| Race | # Population | % Population |
| Asian | 0 | 0.0% |
| Black / African American | 0 | 0.0% |
| Hawaiian / Pacific | 0 | 0.0% |
| Hispanic or Latino | 340 | 100.0% |
| Native / Alaskan | 0 | 0.0% |
| White / Caucasian | 157 | 46.2% |
| Two or more Races | 86 | 25.3% |
| Some other Race | 97 | 28.5% |
| Total | 340 | 100.0% |
Ancestry in Outlook
The most populous ancestries reported in Outlook are Mexican (340 | 100.0%), and American (47 | 13.8%), together accounting for 113.8% of all Outlook residents.
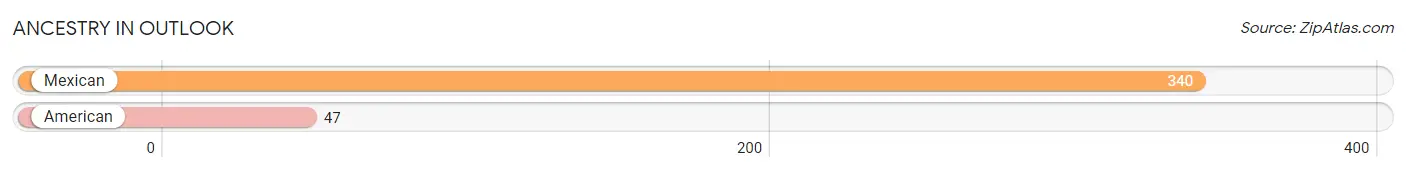
| Ancestry | # Population | % Population |
| American | 47 | 13.8% |
| Mexican | 340 | 100.0% | View All 2 Rows |
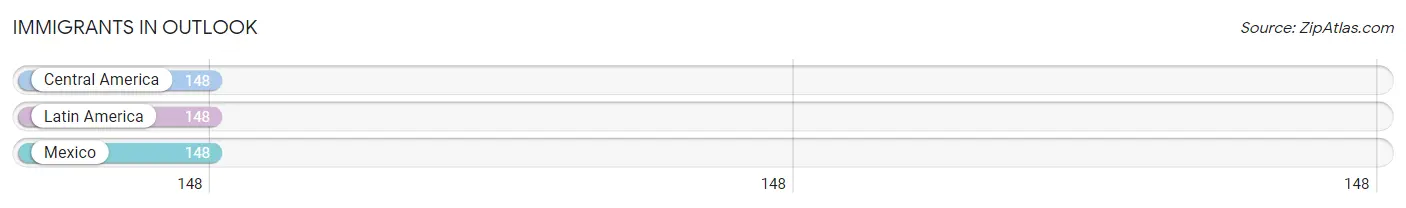
Immigrants in Outlook
The most numerous immigrant groups reported in Outlook came from Central America (148 | 43.5%), Latin America (148 | 43.5%), and Mexico (148 | 43.5%), together accounting for 130.6% of all Outlook residents.
| Immigration Origin | # Population | % Population |
| Central America | 148 | 43.5% |
| Latin America | 148 | 43.5% |
| Mexico | 148 | 43.5% | View All 3 Rows |
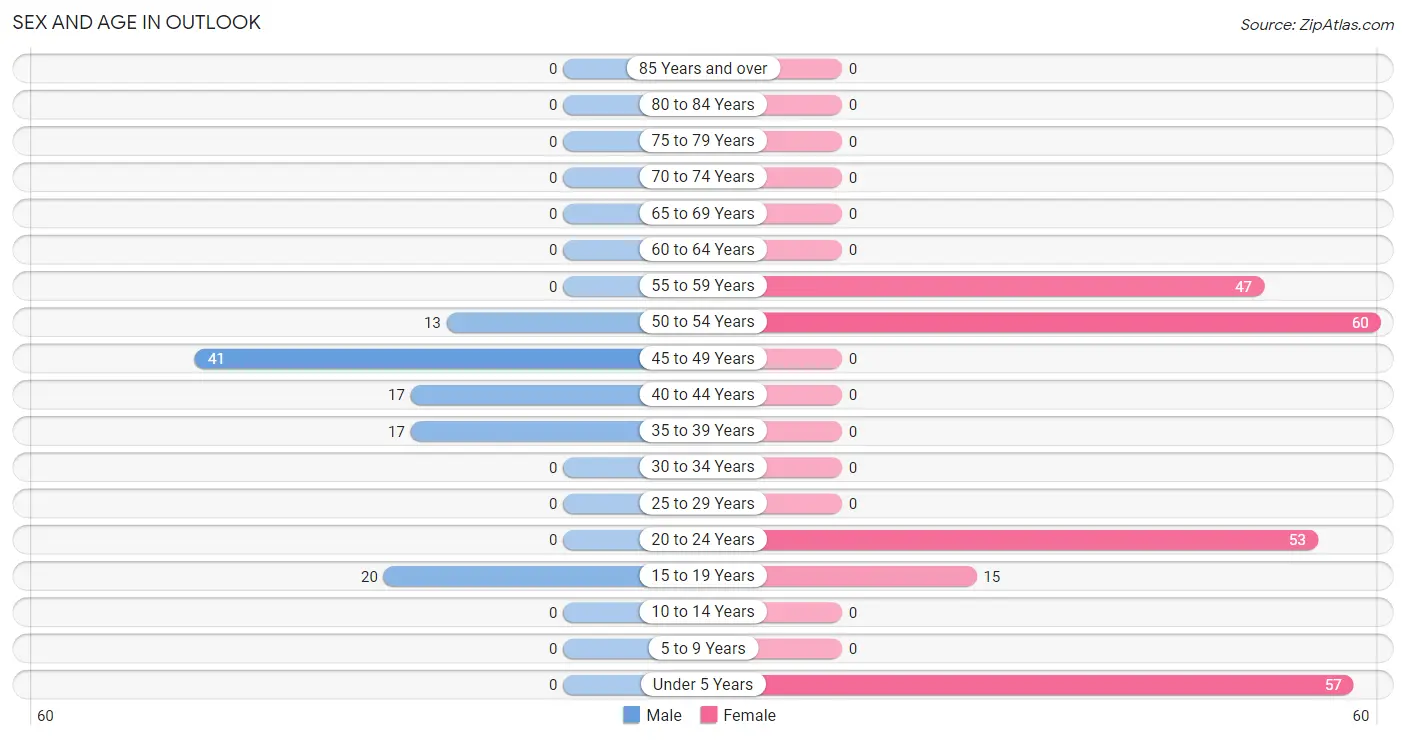
Sex and Age in Outlook
Sex and Age in Outlook
The most populous age groups in Outlook are 45 to 49 Years (41 | 38.0%) for men and 50 to 54 Years (60 | 25.9%) for women.
| Age Bracket | Male | Female |
| Under 5 Years | 0 (0.0%) | 57 (24.6%) |
| 5 to 9 Years | 0 (0.0%) | 0 (0.0%) |
| 10 to 14 Years | 0 (0.0%) | 0 (0.0%) |
| 15 to 19 Years | 20 (18.5%) | 15 (6.5%) |
| 20 to 24 Years | 0 (0.0%) | 53 (22.8%) |
| 25 to 29 Years | 0 (0.0%) | 0 (0.0%) |
| 30 to 34 Years | 0 (0.0%) | 0 (0.0%) |
| 35 to 39 Years | 17 (15.7%) | 0 (0.0%) |
| 40 to 44 Years | 17 (15.7%) | 0 (0.0%) |
| 45 to 49 Years | 41 (38.0%) | 0 (0.0%) |
| 50 to 54 Years | 13 (12.0%) | 60 (25.9%) |
| 55 to 59 Years | 0 (0.0%) | 47 (20.3%) |
| 60 to 64 Years | 0 (0.0%) | 0 (0.0%) |
| 65 to 69 Years | 0 (0.0%) | 0 (0.0%) |
| 70 to 74 Years | 0 (0.0%) | 0 (0.0%) |
| 75 to 79 Years | 0 (0.0%) | 0 (0.0%) |
| 80 to 84 Years | 0 (0.0%) | 0 (0.0%) |
| 85 Years and over | 0 (0.0%) | 0 (0.0%) |
| Total | 108 (100.0%) | 232 (100.0%) |
Families and Households in Outlook
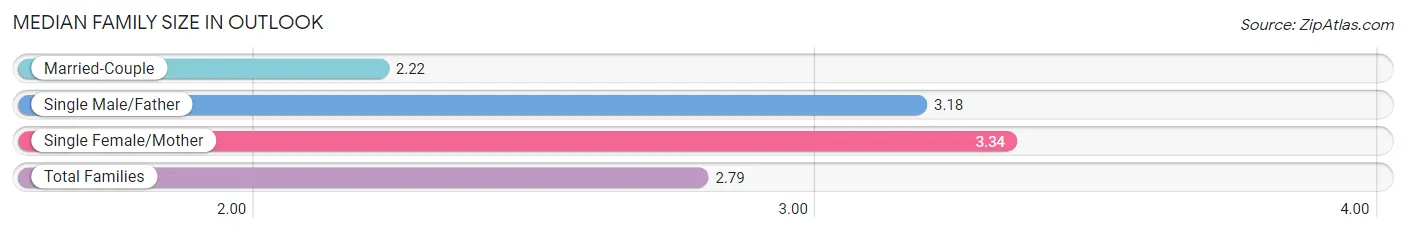
Median Family Size in Outlook
The median family size in Outlook is 2.79 persons per family, with single female/mother families (47 | 38.5%) accounting for the largest median family size of 3.34 persons per family. On the other hand, married-couple families (58 | 47.5%) represent the smallest median family size with 2.22 persons per family.
| Family Type | # Families | Family Size |
| Married-Couple | 58 (47.5%) | 2.22 |
| Single Male/Father | 17 (13.9%) | 3.18 |
| Single Female/Mother | 47 (38.5%) | 3.34 |
| Total Families | 122 (100.0%) | 2.79 |
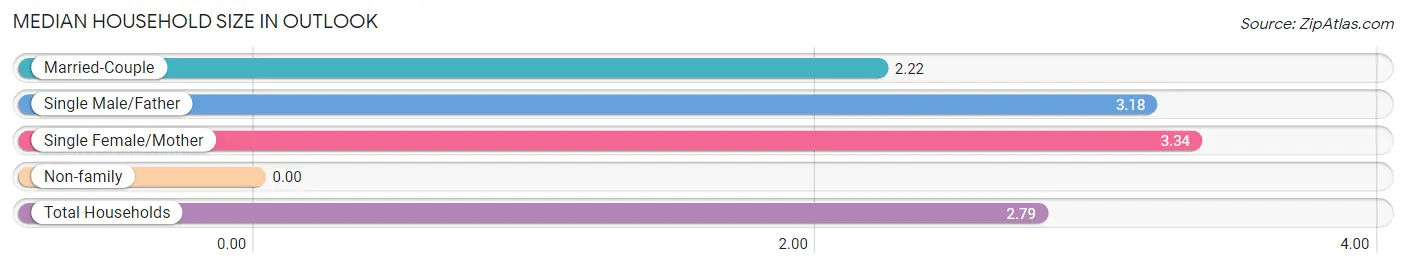
Median Household Size in Outlook
| Household Type | # Households | Household Size |
| Married-Couple | 58 (47.5%) | 2.22 |
| Single Male/Father | 17 (13.9%) | 3.18 |
| Single Female/Mother | 47 (38.5%) | 3.34 |
| Non-family | 0 (0.0%) | - |
| Total Households | 122 (100.0%) | 2.79 |
Household Size by Marriage Status in Outlook
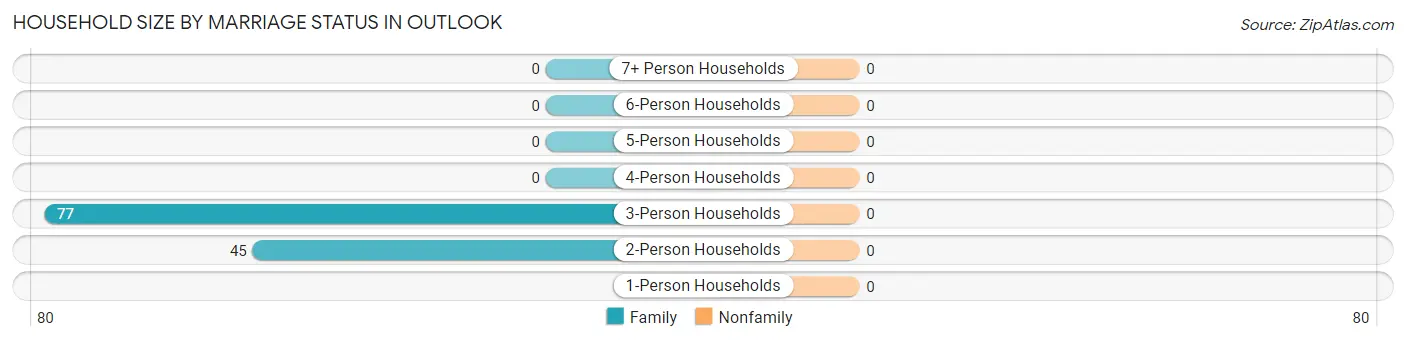
| Household Size | Family Households | Nonfamily Households |
| 1-Person Households | - | 0 (0.0%) |
| 2-Person Households | 45 (36.9%) | 0 (0.0%) |
| 3-Person Households | 77 (63.1%) | 0 (0.0%) |
| 4-Person Households | 0 (0.0%) | 0 (0.0%) |
| 5-Person Households | 0 (0.0%) | 0 (0.0%) |
| 6-Person Households | 0 (0.0%) | 0 (0.0%) |
| 7+ Person Households | 0 (0.0%) | 0 (0.0%) |
| Total | 122 (100.0%) | 0 (0.0%) |
Female Fertility in Outlook
Fertility by Age in Outlook
Average fertility rate in Outlook is 779.0 births per 1,000 women. Women in the age bracket of 20 to 34 years have the highest fertility rate with 1,000.0 births per 1,000 women. Women in the age bracket of 20 to 34 years acount for 100.0% of all women with births.
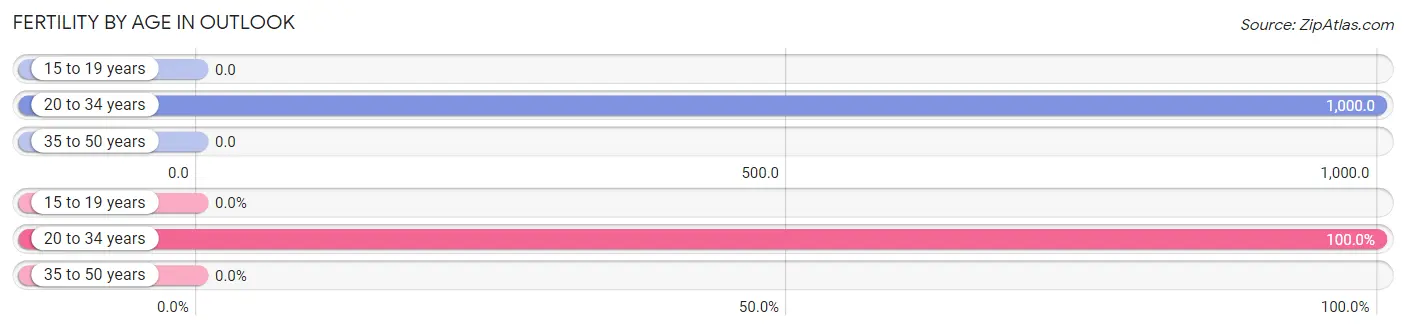
| Age Bracket | Women with Births | Births / 1,000 Women |
| 15 to 19 years | 0 (0.0%) | 0.0 |
| 20 to 34 years | 53 (100.0%) | 1,000.0 |
| 35 to 50 years | 0 (0.0%) | 0.0 |
| Total | 53 (100.0%) | 779.0 |
Fertility by Age by Marriage Status in Outlook
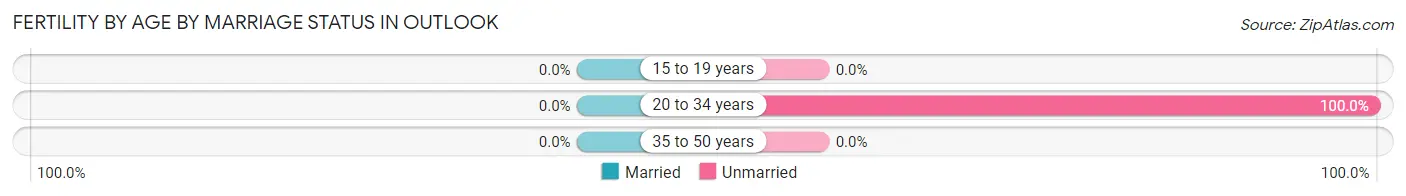
| Age Bracket | Married | Unmarried |
| 15 to 19 years | 0 (0.0%) | 0 (0.0%) |
| 20 to 34 years | 0 (0.0%) | 53 (100.0%) |
| 35 to 50 years | 0 (0.0%) | 0 (0.0%) |
| Total | 0 (0.0%) | 53 (100.0%) |
Fertility by Education in Outlook
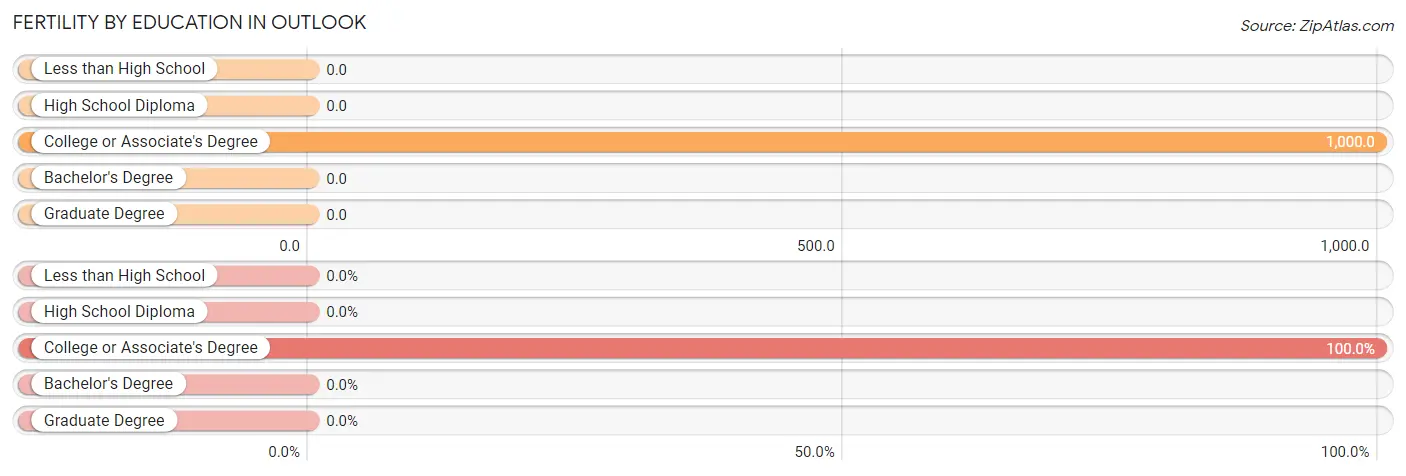
| Educational Attainment | Women with Births | Births / 1,000 Women |
| Less than High School | 0 (0.0%) | 0.0 |
| High School Diploma | 0 (0.0%) | 0.0 |
| College or Associate's Degree | 53 (100.0%) | 1,000.0 |
| Bachelor's Degree | 0 (0.0%) | 0.0 |
| Graduate Degree | 0 (0.0%) | 0.0 |
| Total | 53 (100.0%) | 779.0 |
Fertility by Education by Marriage Status in Outlook
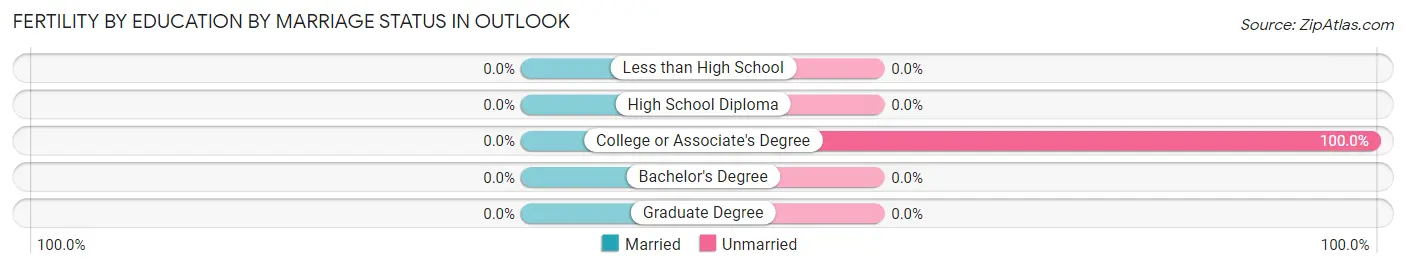
| Educational Attainment | Married | Unmarried |
| Less than High School | 0 (0.0%) | 0 (0.0%) |
| High School Diploma | 0 (0.0%) | 0 (0.0%) |
| College or Associate's Degree | 0 (0.0%) | 53 (100.0%) |
| Bachelor's Degree | 0 (0.0%) | 0 (0.0%) |
| Graduate Degree | 0 (0.0%) | 0 (0.0%) |
| Total | 0 (0.0%) | 53 (100.0%) |
Employment Characteristics in Outlook
Employment by Class of Employer in Outlook
Among the 218 employed individuals in Outlook, private company employees (171 | 78.4%), and state government employees (47 | 21.6%) make up the most common classes of employment.
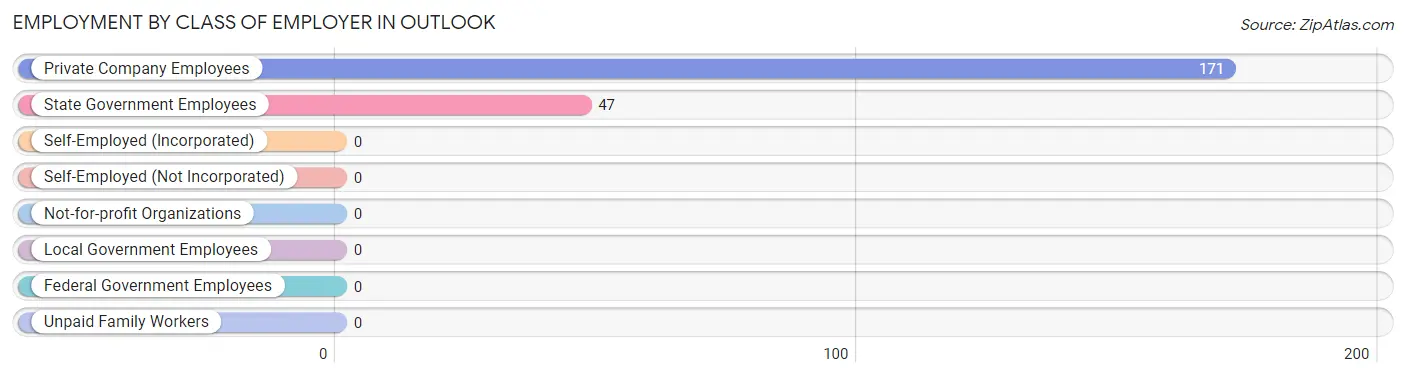
| Employer Class | # Employees | % Employees |
| Private Company Employees | 171 | 78.4% |
| Self-Employed (Incorporated) | 0 | 0.0% |
| Self-Employed (Not Incorporated) | 0 | 0.0% |
| Not-for-profit Organizations | 0 | 0.0% |
| Local Government Employees | 0 | 0.0% |
| State Government Employees | 47 | 21.6% |
| Federal Government Employees | 0 | 0.0% |
| Unpaid Family Workers | 0 | 0.0% |
| Total | 218 | 100.0% |
Employment Status by Age in Outlook
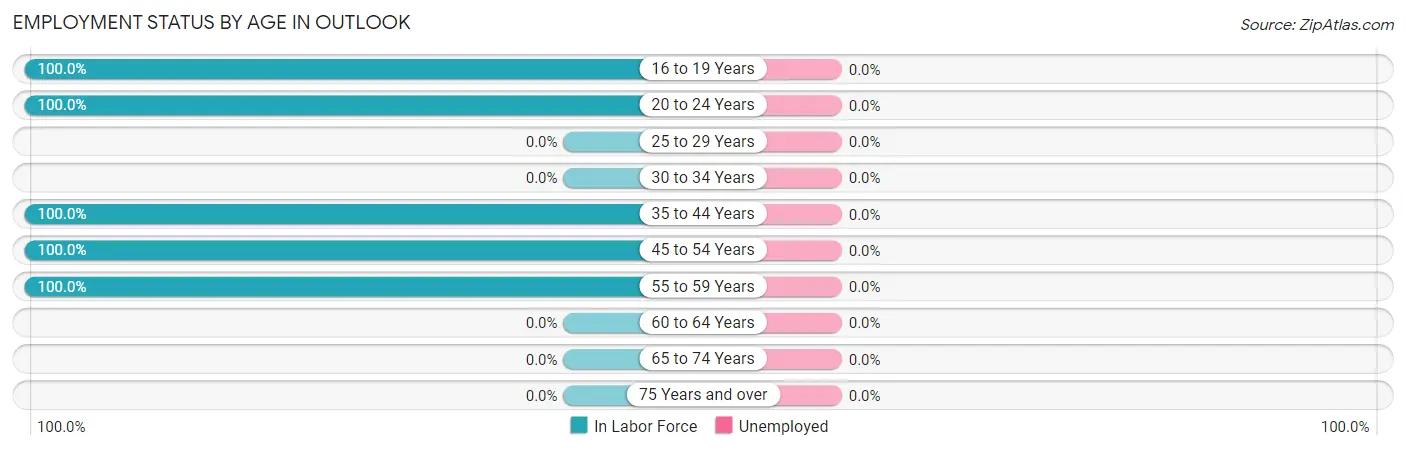
| Age Bracket | In Labor Force | Unemployed |
| 16 to 19 Years | 15 (100.0%) | 0 (0.0%) |
| 20 to 24 Years | 53 (100.0%) | 0 (0.0%) |
| 25 to 29 Years | 0 (0.0%) | 0 (0.0%) |
| 30 to 34 Years | 0 (0.0%) | 0 (0.0%) |
| 35 to 44 Years | 34 (100.0%) | 0 (0.0%) |
| 45 to 54 Years | 114 (100.0%) | 0 (0.0%) |
| 55 to 59 Years | 47 (100.0%) | 0 (0.0%) |
| 60 to 64 Years | 0 (0.0%) | 0 (0.0%) |
| 65 to 74 Years | 0 (0.0%) | 0 (0.0%) |
| 75 Years and over | 0 (0.0%) | 0 (0.0%) |
| Total | 263 (100.0%) | 0 (0.0%) |
Employment Status by Educational Attainment in Outlook
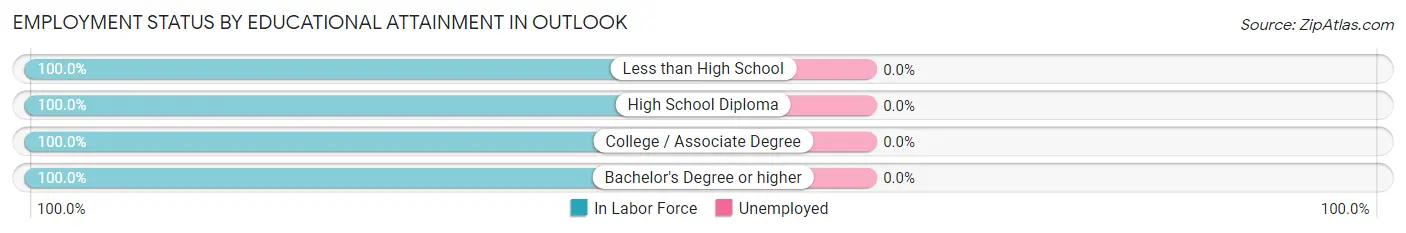
| Educational Attainment | In Labor Force | Unemployed |
| Less than High School | 49 (100.0%) | 0 (0.0%) |
| High School Diploma | 58 (100.0%) | 0 (0.0%) |
| College / Associate Degree | 41 (100.0%) | 0 (0.0%) |
| Bachelor's Degree or higher | 47 (100.0%) | 0 (0.0%) |
| Total | 195 (100.0%) | 0 (0.0%) |
Employment Occupations by Sex in Outlook
Management, Business, Science and Arts Occupations
The most common Management, Business, Science and Arts occupations in Outlook are Community & Social Service (47 | 17.9%), Education Instruction & Library (47 | 17.9%), and Management (13 | 4.9%).
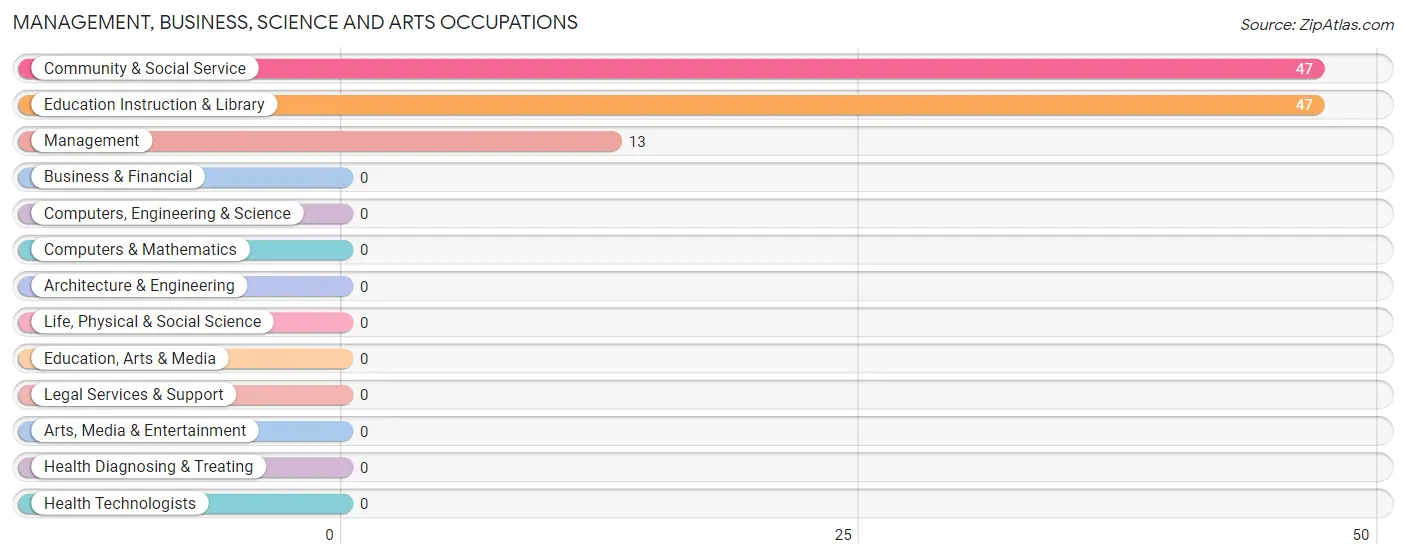
Management, Business, Science and Arts Occupations by Sex
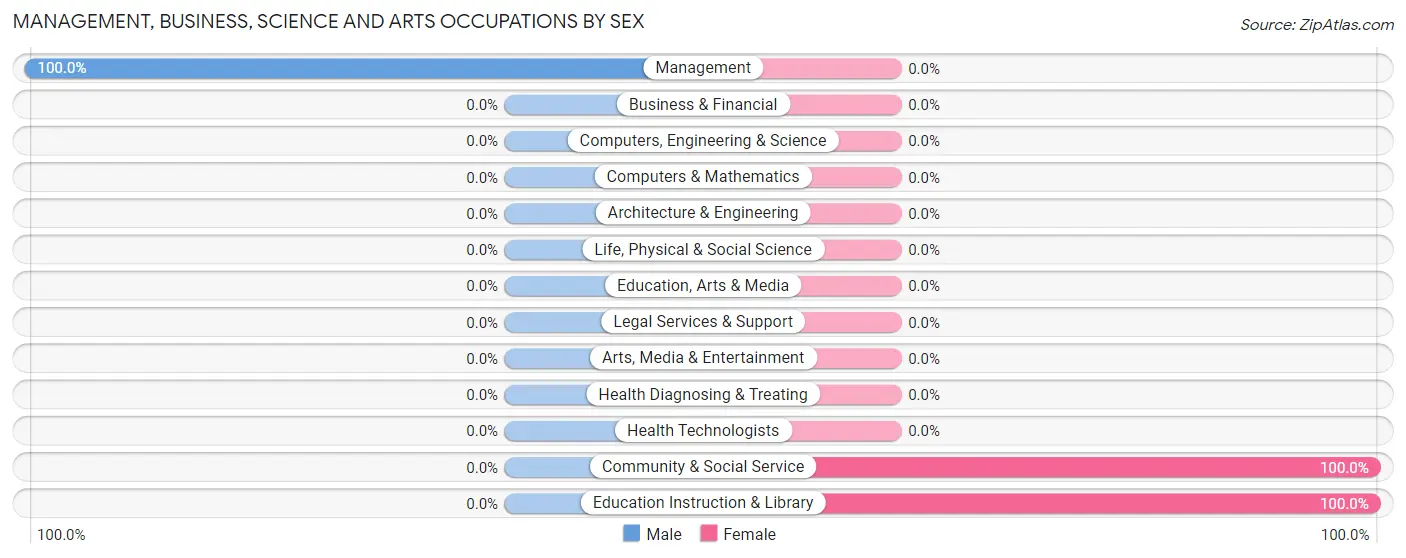
| Occupation | Male | Female |
| Management | 13 (100.0%) | 0 (0.0%) |
| Business & Financial | 0 (0.0%) | 0 (0.0%) |
| Computers, Engineering & Science | 0 (0.0%) | 0 (0.0%) |
| Computers & Mathematics | 0 (0.0%) | 0 (0.0%) |
| Architecture & Engineering | 0 (0.0%) | 0 (0.0%) |
| Life, Physical & Social Science | 0 (0.0%) | 0 (0.0%) |
| Community & Social Service | 0 (0.0%) | 47 (100.0%) |
| Education, Arts & Media | 0 (0.0%) | 0 (0.0%) |
| Legal Services & Support | 0 (0.0%) | 0 (0.0%) |
| Education Instruction & Library | 0 (0.0%) | 47 (100.0%) |
| Arts, Media & Entertainment | 0 (0.0%) | 0 (0.0%) |
| Health Diagnosing & Treating | 0 (0.0%) | 0 (0.0%) |
| Health Technologists | 0 (0.0%) | 0 (0.0%) |
| Total (Category) | 13 (21.7%) | 47 (78.3%) |
| Total (Overall) | 88 (33.5%) | 175 (66.5%) |
Services Occupations
The most common Services occupations in Outlook are , and Cleaning & Maintenance (17 | 6.5%).
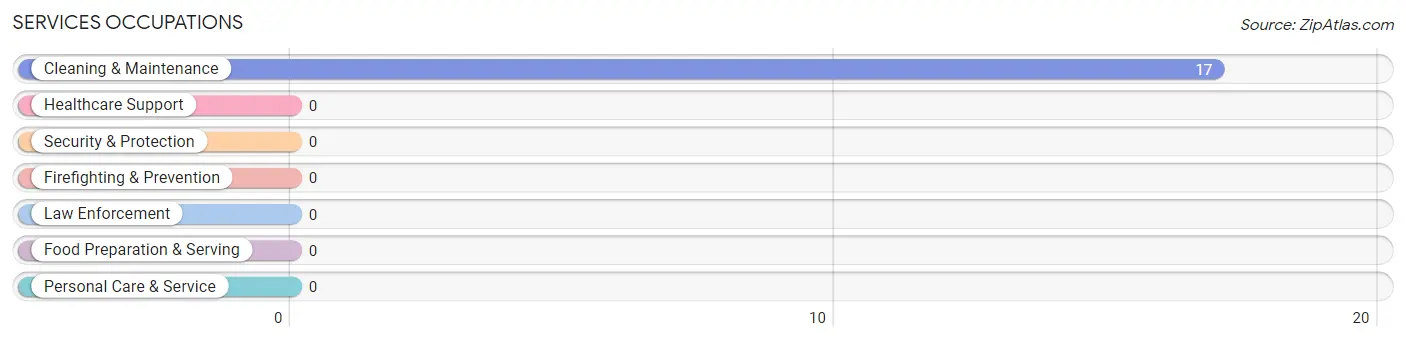
Services Occupations by Sex
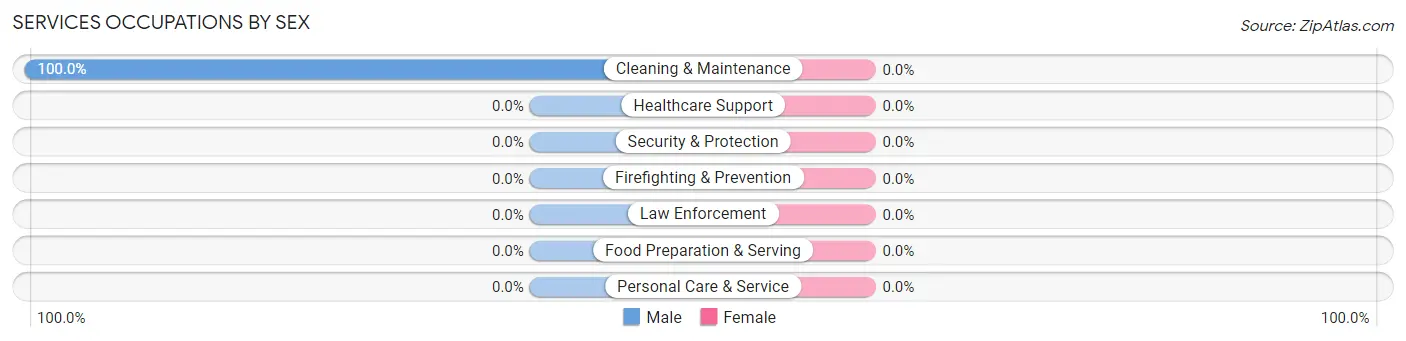
| Occupation | Male | Female |
| Healthcare Support | 0 (0.0%) | 0 (0.0%) |
| Security & Protection | 0 (0.0%) | 0 (0.0%) |
| Firefighting & Prevention | 0 (0.0%) | 0 (0.0%) |
| Law Enforcement | 0 (0.0%) | 0 (0.0%) |
| Food Preparation & Serving | 0 (0.0%) | 0 (0.0%) |
| Cleaning & Maintenance | 17 (100.0%) | 0 (0.0%) |
| Personal Care & Service | 0 (0.0%) | 0 (0.0%) |
| Total (Category) | 17 (100.0%) | 0 (0.0%) |
| Total (Overall) | 88 (33.5%) | 175 (66.5%) |
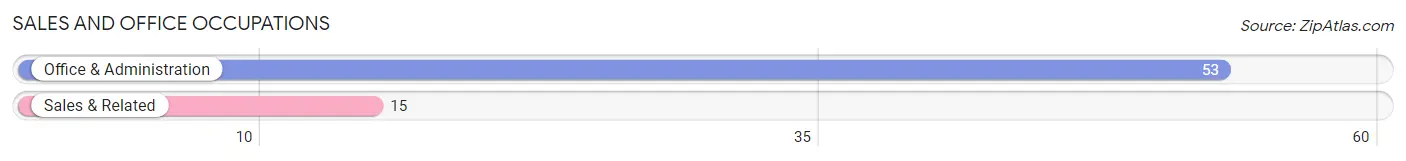
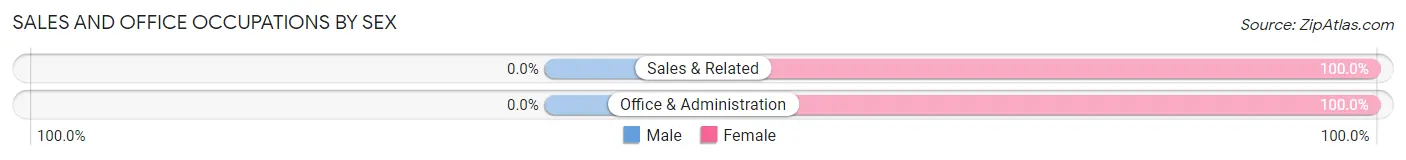
Sales and Office Occupations
The most common Sales and Office occupations in Outlook are Office & Administration (53 | 20.2%), and Sales & Related (15 | 5.7%).
Sales and Office Occupations by Sex
| Occupation | Male | Female |
| Sales & Related | 0 (0.0%) | 15 (100.0%) |
| Office & Administration | 0 (0.0%) | 53 (100.0%) |
| Total (Category) | 0 (0.0%) | 68 (100.0%) |
| Total (Overall) | 88 (33.5%) | 175 (66.5%) |
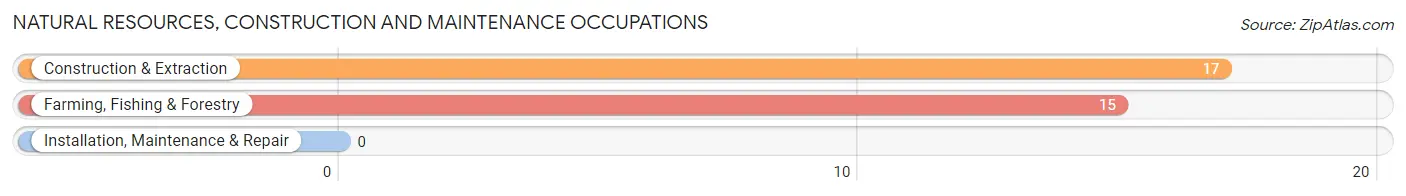
Natural Resources, Construction and Maintenance Occupations
The most common Natural Resources, Construction and Maintenance occupations in Outlook are Construction & Extraction (17 | 6.5%), and Farming, Fishing & Forestry (15 | 5.7%).
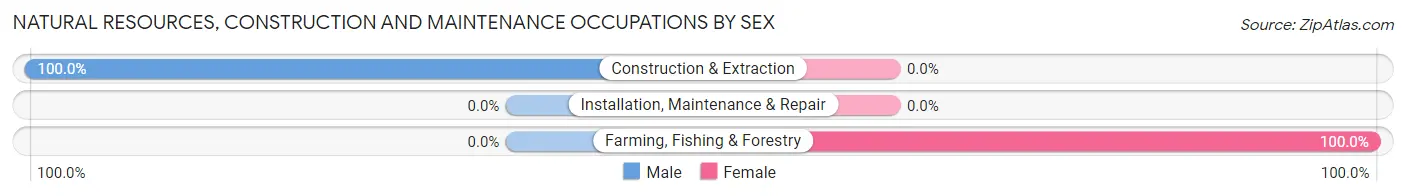
Natural Resources, Construction and Maintenance Occupations by Sex
| Occupation | Male | Female |
| Farming, Fishing & Forestry | 0 (0.0%) | 15 (100.0%) |
| Construction & Extraction | 17 (100.0%) | 0 (0.0%) |
| Installation, Maintenance & Repair | 0 (0.0%) | 0 (0.0%) |
| Total (Category) | 17 (53.1%) | 15 (46.9%) |
| Total (Overall) | 88 (33.5%) | 175 (66.5%) |
Production, Transportation and Moving Occupations
The most common Production, Transportation and Moving occupations in Outlook are , and Material Moving (86 | 32.7%).
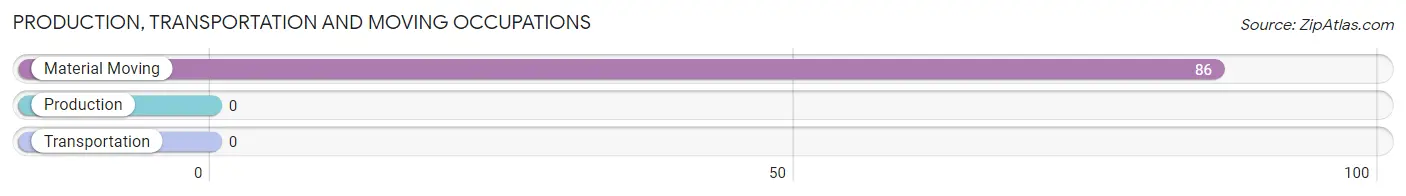
Production, Transportation and Moving Occupations by Sex
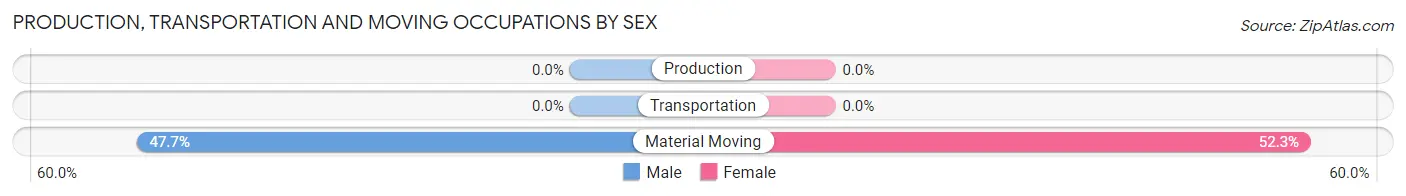
| Occupation | Male | Female |
| Production | 0 (0.0%) | 0 (0.0%) |
| Transportation | 0 (0.0%) | 0 (0.0%) |
| Material Moving | 41 (47.7%) | 45 (52.3%) |
| Total (Category) | 41 (47.7%) | 45 (52.3%) |
| Total (Overall) | 88 (33.5%) | 175 (66.5%) |
Employment Industries by Sex in Outlook
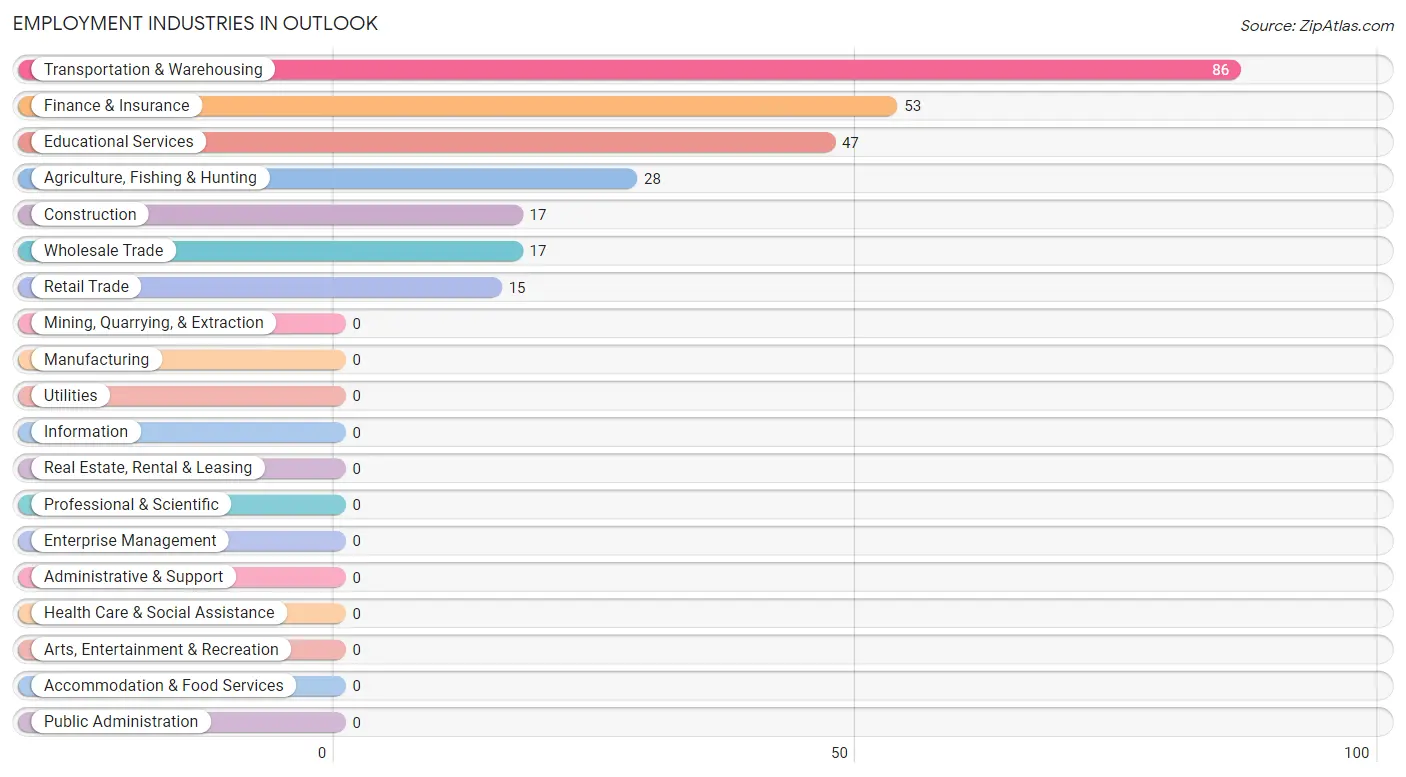
Employment Industries in Outlook
The major employment industries in Outlook include Transportation & Warehousing (86 | 32.7%), Finance & Insurance (53 | 20.2%), Educational Services (47 | 17.9%), Agriculture, Fishing & Hunting (28 | 10.6%), and Construction (17 | 6.5%).
Employment Industries by Sex in Outlook
The Outlook industries that see more men than women are Construction (100.0%), Wholesale Trade (100.0%), and Transportation & Warehousing (47.7%), whereas the industries that tend to have a higher number of women are Retail Trade (100.0%), Finance & Insurance (100.0%), and Educational Services (100.0%).
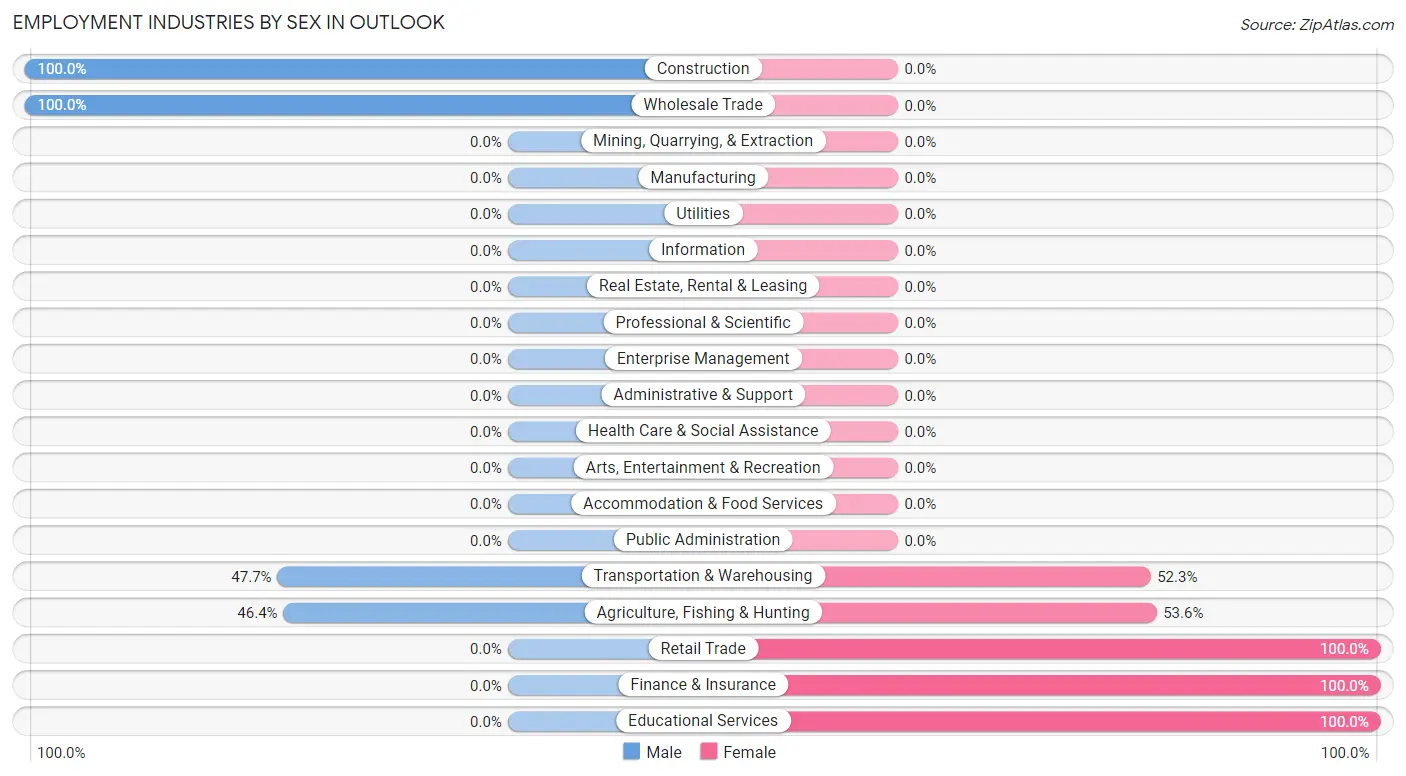
| Industry | Male | Female |
| Agriculture, Fishing & Hunting | 13 (46.4%) | 15 (53.6%) |
| Mining, Quarrying, & Extraction | 0 (0.0%) | 0 (0.0%) |
| Construction | 17 (100.0%) | 0 (0.0%) |
| Manufacturing | 0 (0.0%) | 0 (0.0%) |
| Wholesale Trade | 17 (100.0%) | 0 (0.0%) |
| Retail Trade | 0 (0.0%) | 15 (100.0%) |
| Transportation & Warehousing | 41 (47.7%) | 45 (52.3%) |
| Utilities | 0 (0.0%) | 0 (0.0%) |
| Information | 0 (0.0%) | 0 (0.0%) |
| Finance & Insurance | 0 (0.0%) | 53 (100.0%) |
| Real Estate, Rental & Leasing | 0 (0.0%) | 0 (0.0%) |
| Professional & Scientific | 0 (0.0%) | 0 (0.0%) |
| Enterprise Management | 0 (0.0%) | 0 (0.0%) |
| Administrative & Support | 0 (0.0%) | 0 (0.0%) |
| Educational Services | 0 (0.0%) | 47 (100.0%) |
| Health Care & Social Assistance | 0 (0.0%) | 0 (0.0%) |
| Arts, Entertainment & Recreation | 0 (0.0%) | 0 (0.0%) |
| Accommodation & Food Services | 0 (0.0%) | 0 (0.0%) |
| Public Administration | 0 (0.0%) | 0 (0.0%) |
| Total | 88 (33.5%) | 175 (66.5%) |
Education in Outlook
School Enrollment in Outlook
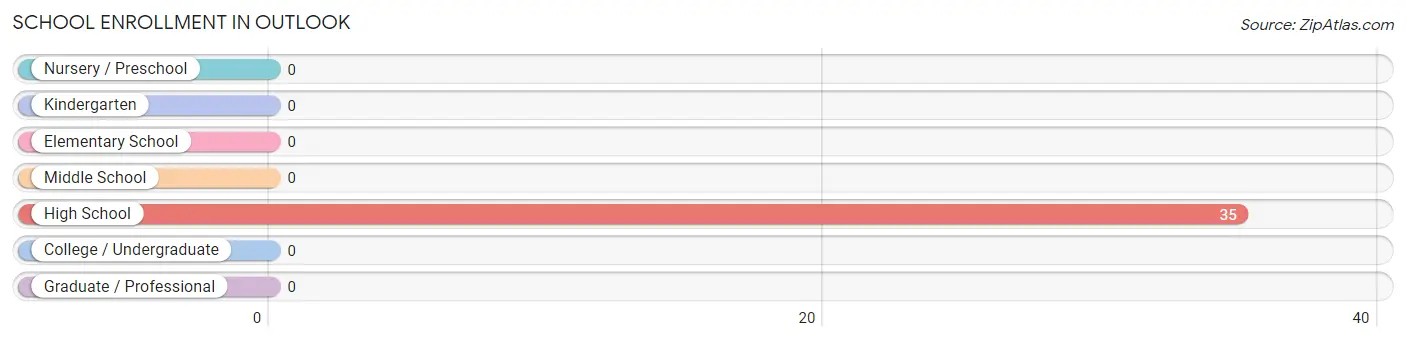
| School Level | # Students | % Students |
| Nursery / Preschool | 0 | 0.0% |
| Kindergarten | 0 | 0.0% |
| Elementary School | 0 | 0.0% |
| Middle School | 0 | 0.0% |
| High School | 35 | 100.0% |
| College / Undergraduate | 0 | 0.0% |
| Graduate / Professional | 0 | 0.0% |
| Total | 35 | 100.0% |
School Enrollment by Age by Funding Source in Outlook
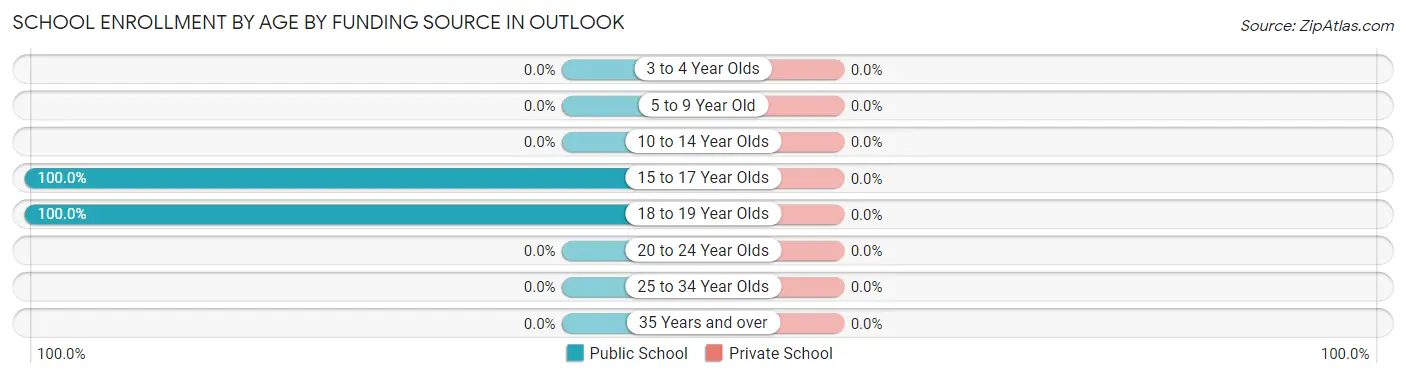
| Age Bracket | Public School | Private School |
| 3 to 4 Year Olds | 0 (0.0%) | 0 (0.0%) |
| 5 to 9 Year Old | 0 (0.0%) | 0 (0.0%) |
| 10 to 14 Year Olds | 0 (0.0%) | 0 (0.0%) |
| 15 to 17 Year Olds | 20 (100.0%) | 0 (0.0%) |
| 18 to 19 Year Olds | 15 (100.0%) | 0 (0.0%) |
| 20 to 24 Year Olds | 0 (0.0%) | 0 (0.0%) |
| 25 to 34 Year Olds | 0 (0.0%) | 0 (0.0%) |
| 35 Years and over | 0 (0.0%) | 0 (0.0%) |
| Total | 35 (100.0%) | 0 (0.0%) |
Educational Attainment by Field of Study in Outlook
, and education (47 | 100.0%) are the most common fields of study among 47 individuals in Outlook who have obtained a bachelor's degree or higher.
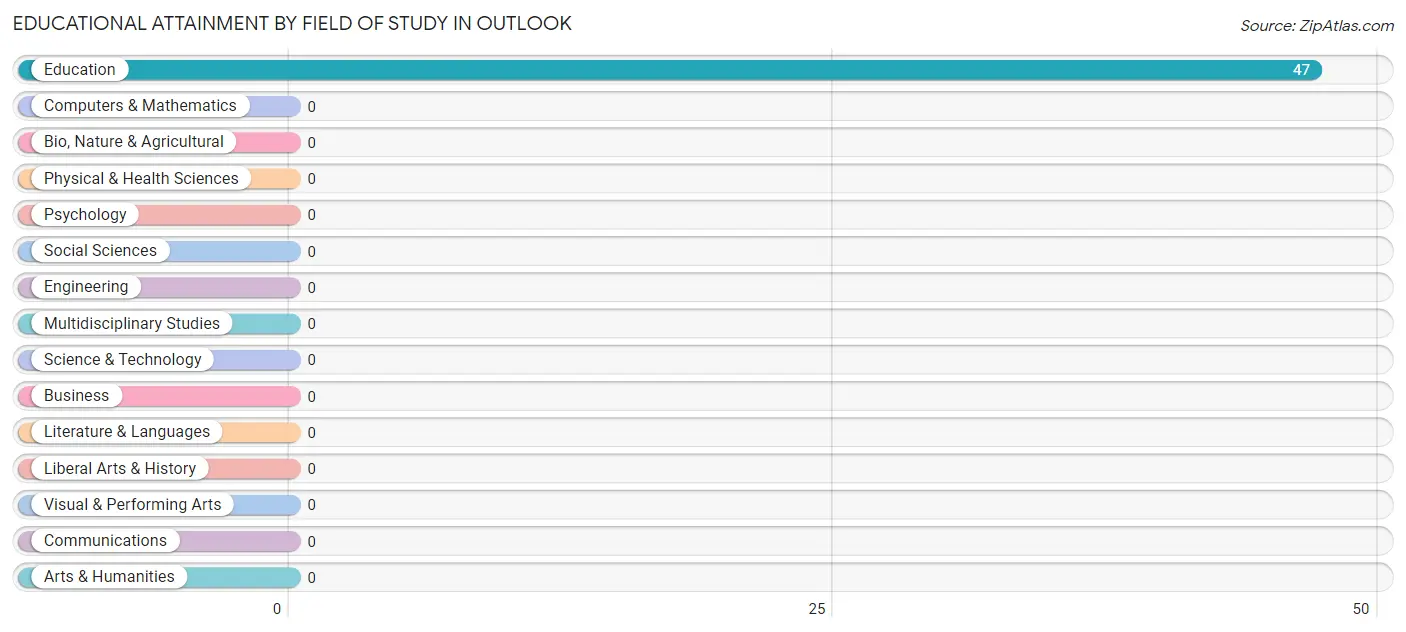
| Field of Study | # Graduates | % Graduates |
| Computers & Mathematics | 0 | 0.0% |
| Bio, Nature & Agricultural | 0 | 0.0% |
| Physical & Health Sciences | 0 | 0.0% |
| Psychology | 0 | 0.0% |
| Social Sciences | 0 | 0.0% |
| Engineering | 0 | 0.0% |
| Multidisciplinary Studies | 0 | 0.0% |
| Science & Technology | 0 | 0.0% |
| Business | 0 | 0.0% |
| Education | 47 | 100.0% |
| Literature & Languages | 0 | 0.0% |
| Liberal Arts & History | 0 | 0.0% |
| Visual & Performing Arts | 0 | 0.0% |
| Communications | 0 | 0.0% |
| Arts & Humanities | 0 | 0.0% |
| Total | 47 | 100.0% |
Transportation & Commute in Outlook
Vehicle Availability by Sex in Outlook
The most prevalent vehicle ownership categories in Outlook are males with 2 vehicles (41, accounting for 46.6%) and females with 2 vehicles (0, making up 31.5%).
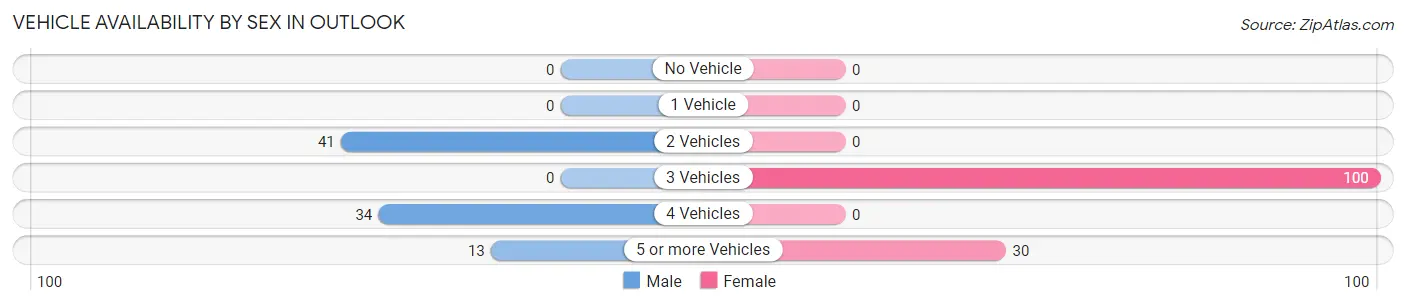
| Vehicles Available | Male | Female |
| No Vehicle | 0 (0.0%) | 0 (0.0%) |
| 1 Vehicle | 0 (0.0%) | 0 (0.0%) |
| 2 Vehicles | 41 (46.6%) | 0 (0.0%) |
| 3 Vehicles | 0 (0.0%) | 100 (76.9%) |
| 4 Vehicles | 34 (38.6%) | 0 (0.0%) |
| 5 or more Vehicles | 13 (14.8%) | 30 (23.1%) |
| Total | 88 (100.0%) | 130 (100.0%) |
Commute Time in Outlook
The most frequently occuring commute durations in Outlook are 10 to 14 minutes (70 commuters, 32.1%), 25 to 29 minutes (47 commuters, 21.6%), and less than 5 minutes (41 commuters, 18.8%).
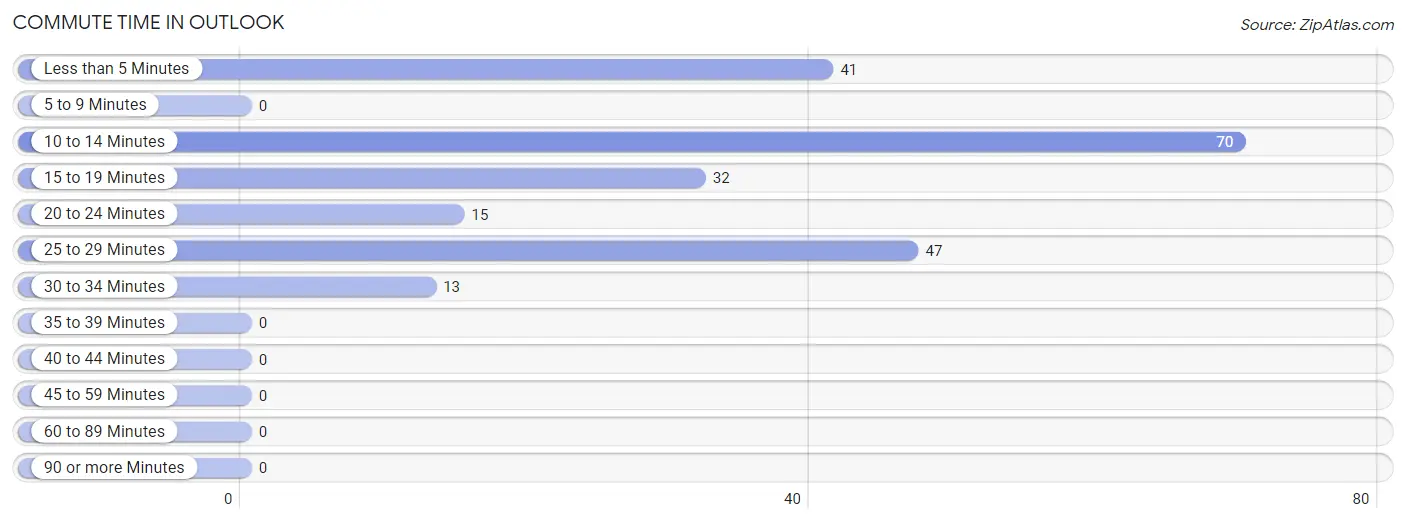
| Commute Time | # Commuters | % Commuters |
| Less than 5 Minutes | 41 | 18.8% |
| 5 to 9 Minutes | 0 | 0.0% |
| 10 to 14 Minutes | 70 | 32.1% |
| 15 to 19 Minutes | 32 | 14.7% |
| 20 to 24 Minutes | 15 | 6.9% |
| 25 to 29 Minutes | 47 | 21.6% |
| 30 to 34 Minutes | 13 | 6.0% |
| 35 to 39 Minutes | 0 | 0.0% |
| 40 to 44 Minutes | 0 | 0.0% |
| 45 to 59 Minutes | 0 | 0.0% |
| 60 to 89 Minutes | 0 | 0.0% |
| 90 or more Minutes | 0 | 0.0% |
Commute Time by Sex in Outlook
The most common commute times in Outlook are less than 5 minutes (41 commuters, 46.6%) for males and 10 to 14 minutes (53 commuters, 40.8%) for females.
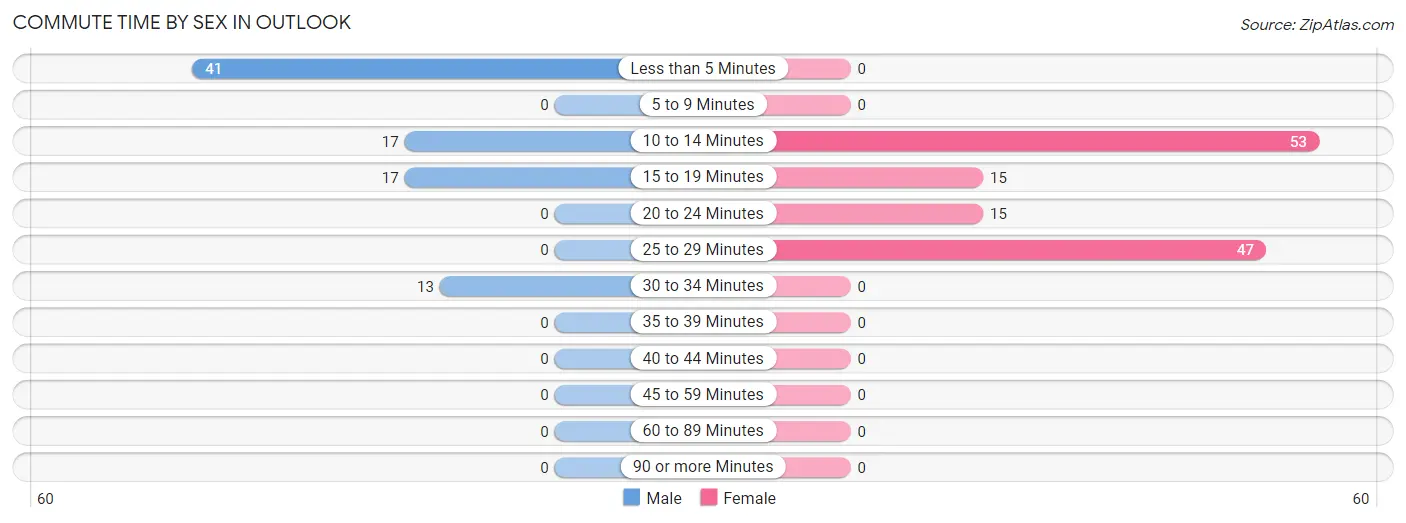
| Commute Time | Male | Female |
| Less than 5 Minutes | 41 (46.6%) | 0 (0.0%) |
| 5 to 9 Minutes | 0 (0.0%) | 0 (0.0%) |
| 10 to 14 Minutes | 17 (19.3%) | 53 (40.8%) |
| 15 to 19 Minutes | 17 (19.3%) | 15 (11.5%) |
| 20 to 24 Minutes | 0 (0.0%) | 15 (11.5%) |
| 25 to 29 Minutes | 0 (0.0%) | 47 (36.1%) |
| 30 to 34 Minutes | 13 (14.8%) | 0 (0.0%) |
| 35 to 39 Minutes | 0 (0.0%) | 0 (0.0%) |
| 40 to 44 Minutes | 0 (0.0%) | 0 (0.0%) |
| 45 to 59 Minutes | 0 (0.0%) | 0 (0.0%) |
| 60 to 89 Minutes | 0 (0.0%) | 0 (0.0%) |
| 90 or more Minutes | 0 (0.0%) | 0 (0.0%) |
Time of Departure to Work by Sex in Outlook
The most frequent times of departure to work in Outlook are 6:00 AM to 6:29 AM (54, 61.4%) for males and 8:00 AM to 8:29 AM (68, 52.3%) for females.
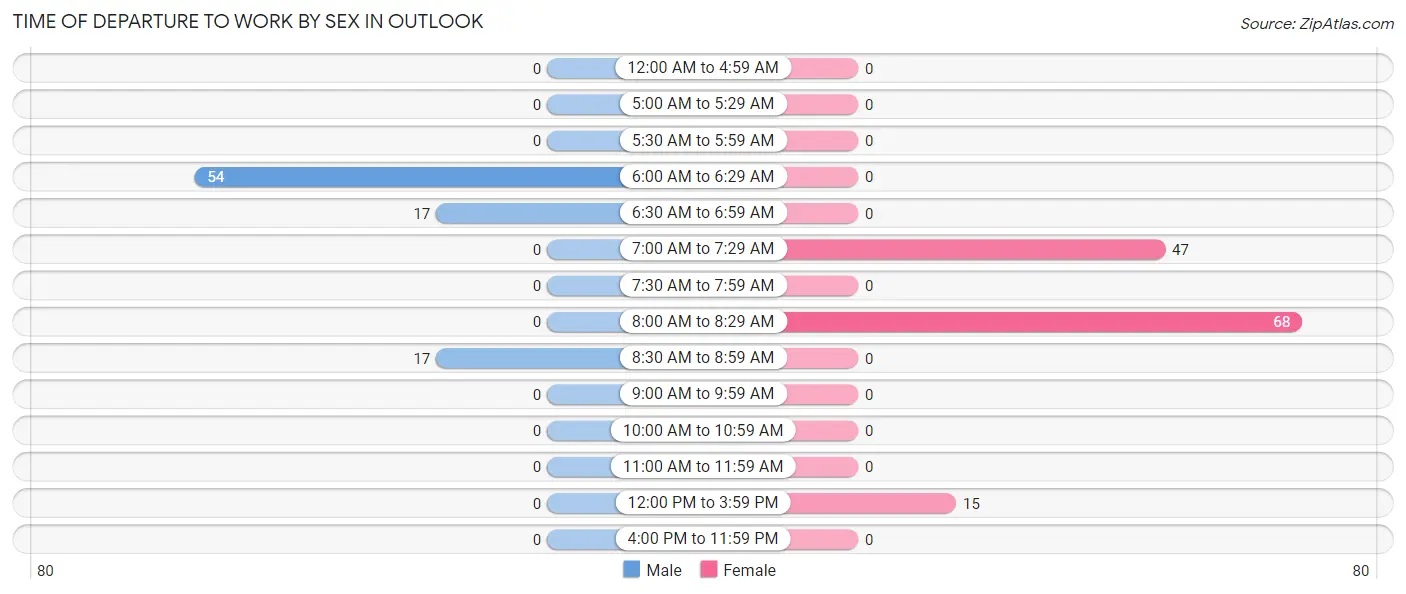
| Time of Departure | Male | Female |
| 12:00 AM to 4:59 AM | 0 (0.0%) | 0 (0.0%) |
| 5:00 AM to 5:29 AM | 0 (0.0%) | 0 (0.0%) |
| 5:30 AM to 5:59 AM | 0 (0.0%) | 0 (0.0%) |
| 6:00 AM to 6:29 AM | 54 (61.4%) | 0 (0.0%) |
| 6:30 AM to 6:59 AM | 17 (19.3%) | 0 (0.0%) |
| 7:00 AM to 7:29 AM | 0 (0.0%) | 47 (36.1%) |
| 7:30 AM to 7:59 AM | 0 (0.0%) | 0 (0.0%) |
| 8:00 AM to 8:29 AM | 0 (0.0%) | 68 (52.3%) |
| 8:30 AM to 8:59 AM | 17 (19.3%) | 0 (0.0%) |
| 9:00 AM to 9:59 AM | 0 (0.0%) | 0 (0.0%) |
| 10:00 AM to 10:59 AM | 0 (0.0%) | 0 (0.0%) |
| 11:00 AM to 11:59 AM | 0 (0.0%) | 0 (0.0%) |
| 12:00 PM to 3:59 PM | 0 (0.0%) | 15 (11.5%) |
| 4:00 PM to 11:59 PM | 0 (0.0%) | 0 (0.0%) |
| Total | 88 (100.0%) | 130 (100.0%) |
Housing Occupancy in Outlook
Occupancy by Ownership in Outlook
Of the total 122 dwellings in Outlook, owner-occupied units account for 77 (63.1%), while renter-occupied units make up 45 (36.9%).
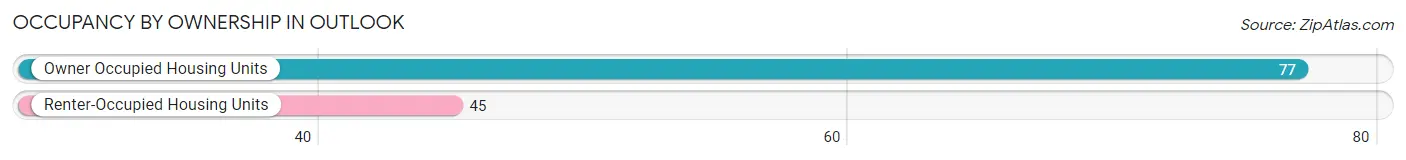
| Occupancy | # Housing Units | % Housing Units |
| Owner Occupied Housing Units | 77 | 63.1% |
| Renter-Occupied Housing Units | 45 | 36.9% |
| Total Occupied Housing Units | 122 | 100.0% |
Occupancy by Household Size in Outlook
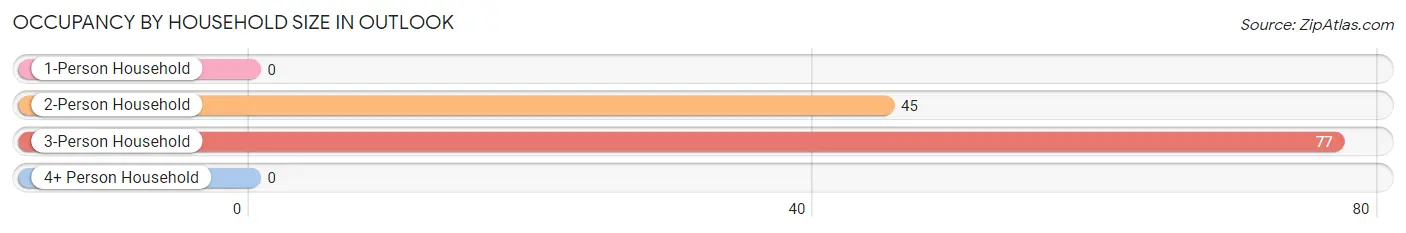
| Household Size | # Housing Units | % Housing Units |
| 1-Person Household | 0 | 0.0% |
| 2-Person Household | 45 | 36.9% |
| 3-Person Household | 77 | 63.1% |
| 4+ Person Household | 0 | 0.0% |
| Total Housing Units | 122 | 100.0% |
Occupancy by Ownership by Household Size in Outlook
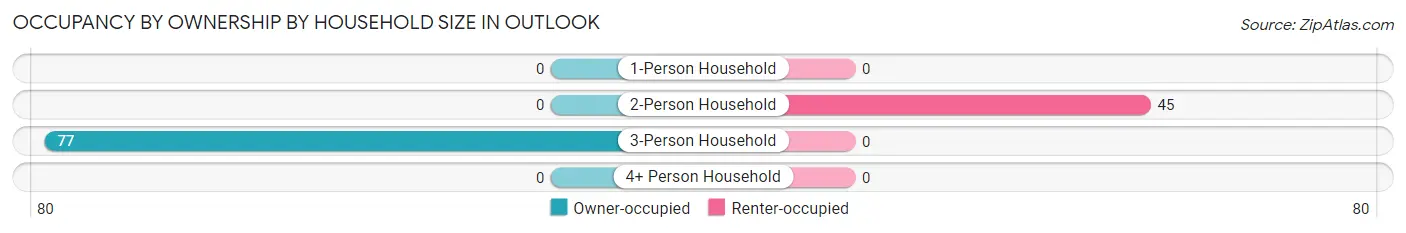
| Household Size | Owner-occupied | Renter-occupied |
| 1-Person Household | 0 (0.0%) | 0 (0.0%) |
| 2-Person Household | 0 (0.0%) | 45 (100.0%) |
| 3-Person Household | 77 (100.0%) | 0 (0.0%) |
| 4+ Person Household | 0 (0.0%) | 0 (0.0%) |
| Total Housing Units | 77 (63.1%) | 45 (36.9%) |
Occupancy by Educational Attainment in Outlook
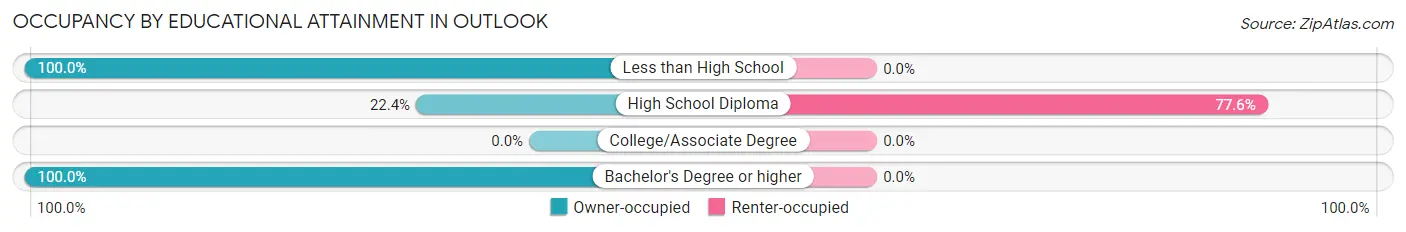
| Household Size | Owner-occupied | Renter-occupied |
| Less than High School | 17 (100.0%) | 0 (0.0%) |
| High School Diploma | 13 (22.4%) | 45 (77.6%) |
| College/Associate Degree | 0 (0.0%) | 0 (0.0%) |
| Bachelor's Degree or higher | 47 (100.0%) | 0 (0.0%) |
Occupancy by Age of Householder in Outlook
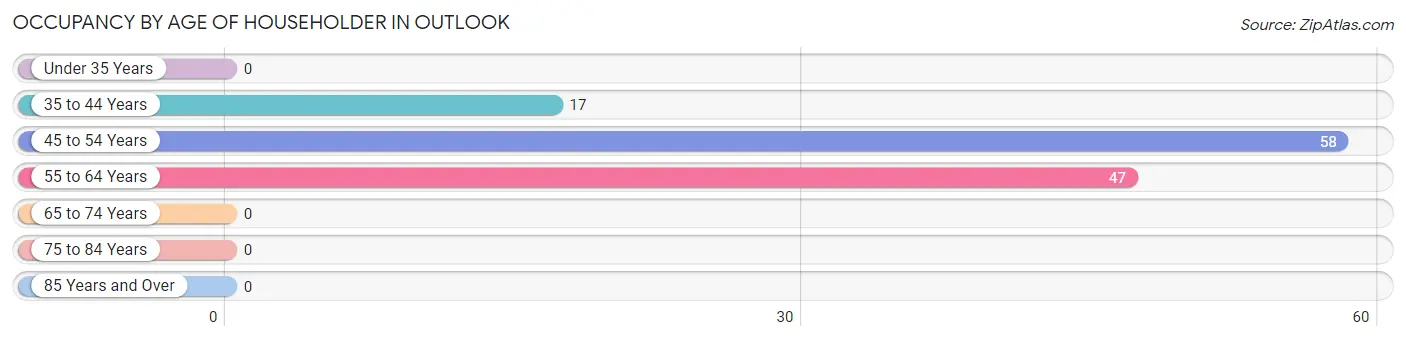
| Age Bracket | # Households | % Households |
| Under 35 Years | 0 | 0.0% |
| 35 to 44 Years | 17 | 13.9% |
| 45 to 54 Years | 58 | 47.5% |
| 55 to 64 Years | 47 | 38.5% |
| 65 to 74 Years | 0 | 0.0% |
| 75 to 84 Years | 0 | 0.0% |
| 85 Years and Over | 0 | 0.0% |
| Total | 122 | 100.0% |
Housing Finances in Outlook
Median Income by Occupancy in Outlook
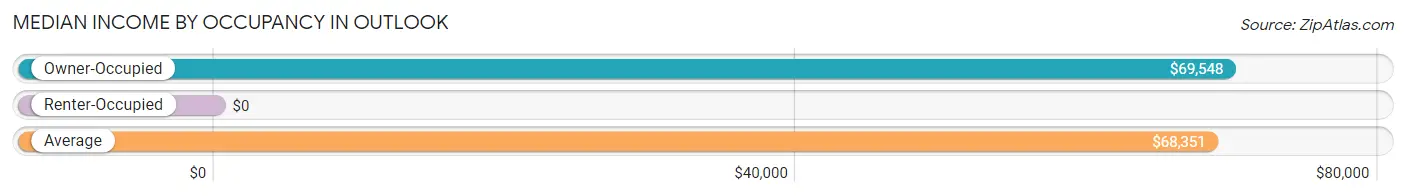
| Occupancy Type | # Households | Median Income |
| Owner-Occupied | 77 (63.1%) | $69,548 |
| Renter-Occupied | 45 (36.9%) | $0 |
| Average | 122 (100.0%) | $68,351 |
Occupancy by Householder Income Bracket in Outlook
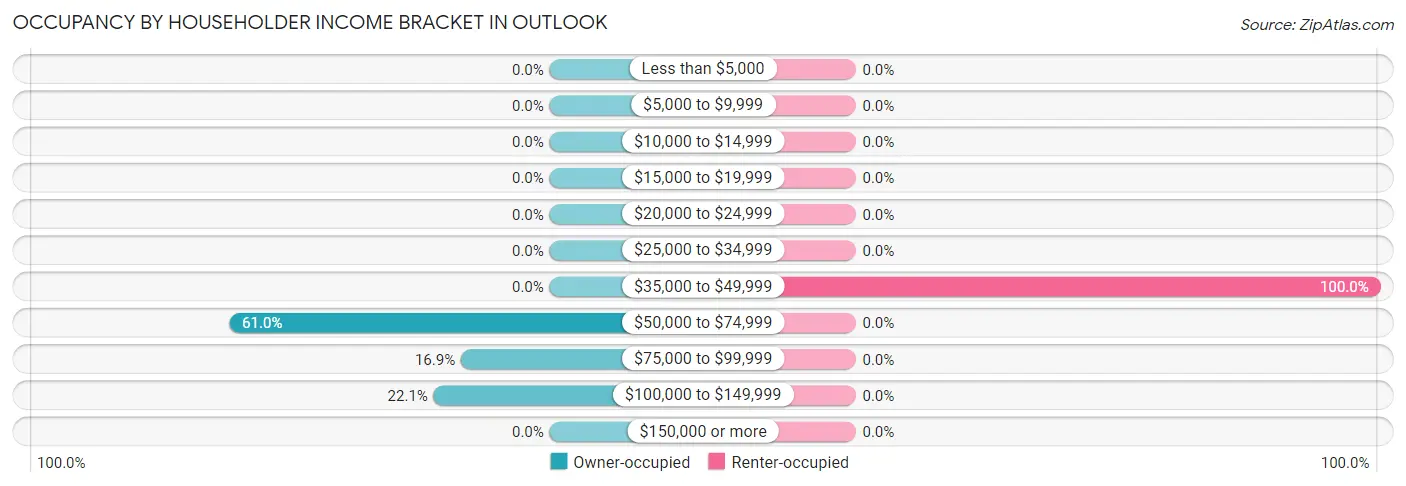
| Income Bracket | Owner-occupied | Renter-occupied |
| Less than $5,000 | 0 (0.0%) | 0 (0.0%) |
| $5,000 to $9,999 | 0 (0.0%) | 0 (0.0%) |
| $10,000 to $14,999 | 0 (0.0%) | 0 (0.0%) |
| $15,000 to $19,999 | 0 (0.0%) | 0 (0.0%) |
| $20,000 to $24,999 | 0 (0.0%) | 0 (0.0%) |
| $25,000 to $34,999 | 0 (0.0%) | 0 (0.0%) |
| $35,000 to $49,999 | 0 (0.0%) | 45 (100.0%) |
| $50,000 to $74,999 | 47 (61.0%) | 0 (0.0%) |
| $75,000 to $99,999 | 13 (16.9%) | 0 (0.0%) |
| $100,000 to $149,999 | 17 (22.1%) | 0 (0.0%) |
| $150,000 or more | 0 (0.0%) | 0 (0.0%) |
| Total | 77 (100.0%) | 45 (100.0%) |
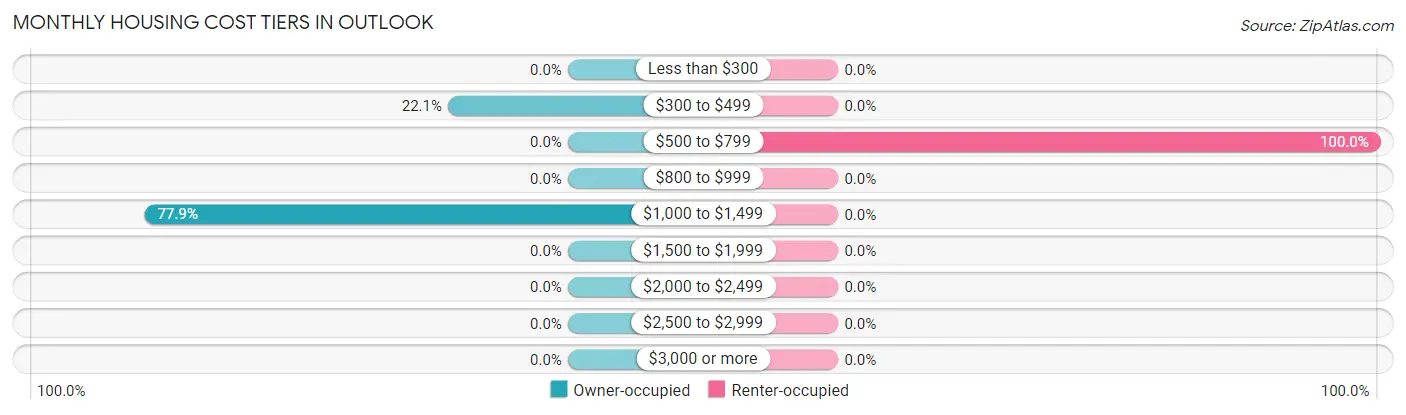
Monthly Housing Cost Tiers in Outlook
| Monthly Cost | Owner-occupied | Renter-occupied |
| Less than $300 | 0 (0.0%) | 0 (0.0%) |
| $300 to $499 | 17 (22.1%) | 0 (0.0%) |
| $500 to $799 | 0 (0.0%) | 45 (100.0%) |
| $800 to $999 | 0 (0.0%) | 0 (0.0%) |
| $1,000 to $1,499 | 60 (77.9%) | 0 (0.0%) |
| $1,500 to $1,999 | 0 (0.0%) | 0 (0.0%) |
| $2,000 to $2,499 | 0 (0.0%) | 0 (0.0%) |
| $2,500 to $2,999 | 0 (0.0%) | 0 (0.0%) |
| $3,000 or more | 0 (0.0%) | 0 (0.0%) |
| Total | 77 (100.0%) | 45 (100.0%) |
Physical Housing Characteristics in Outlook
Housing Structures in Outlook
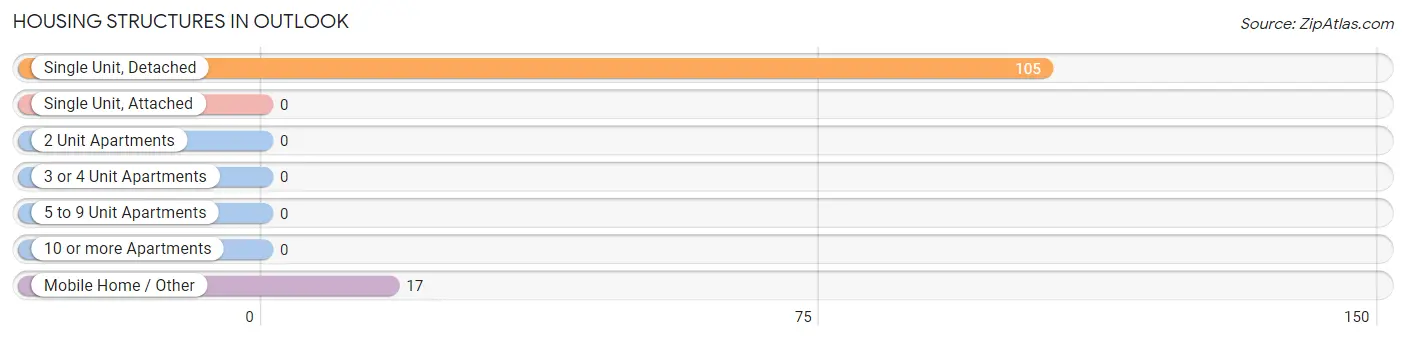
| Structure Type | # Housing Units | % Housing Units |
| Single Unit, Detached | 105 | 86.1% |
| Single Unit, Attached | 0 | 0.0% |
| 2 Unit Apartments | 0 | 0.0% |
| 3 or 4 Unit Apartments | 0 | 0.0% |
| 5 to 9 Unit Apartments | 0 | 0.0% |
| 10 or more Apartments | 0 | 0.0% |
| Mobile Home / Other | 17 | 13.9% |
| Total | 122 | 100.0% |
Housing Structures by Occupancy in Outlook
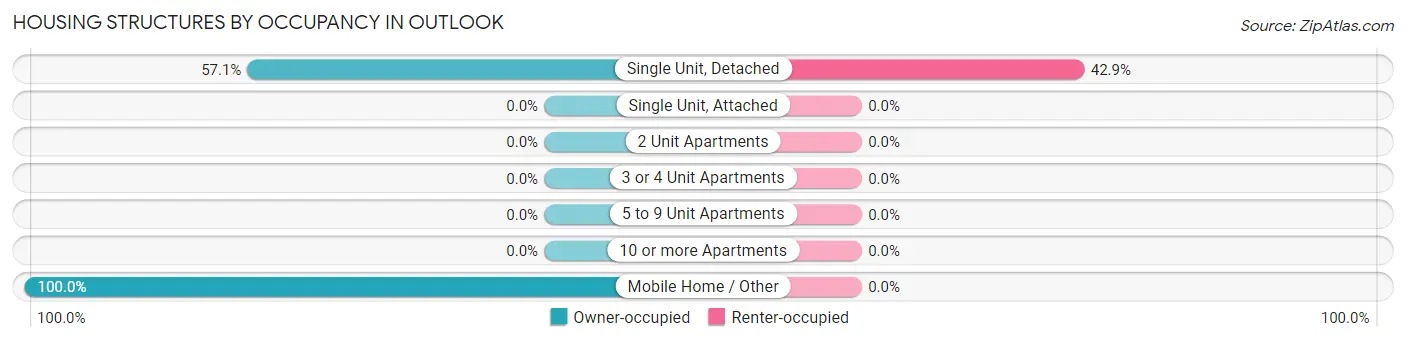
| Structure Type | Owner-occupied | Renter-occupied |
| Single Unit, Detached | 60 (57.1%) | 45 (42.9%) |
| Single Unit, Attached | 0 (0.0%) | 0 (0.0%) |
| 2 Unit Apartments | 0 (0.0%) | 0 (0.0%) |
| 3 or 4 Unit Apartments | 0 (0.0%) | 0 (0.0%) |
| 5 to 9 Unit Apartments | 0 (0.0%) | 0 (0.0%) |
| 10 or more Apartments | 0 (0.0%) | 0 (0.0%) |
| Mobile Home / Other | 17 (100.0%) | 0 (0.0%) |
| Total | 77 (63.1%) | 45 (36.9%) |
Housing Structures by Number of Rooms in Outlook
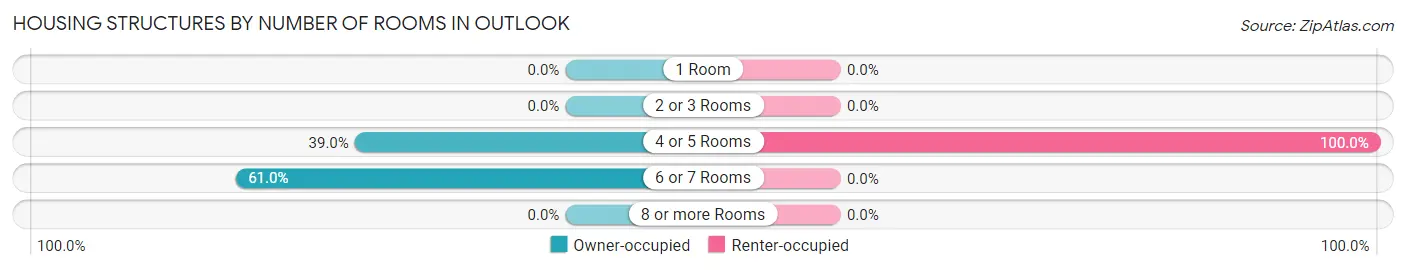
| Number of Rooms | Owner-occupied | Renter-occupied |
| 1 Room | 0 (0.0%) | 0 (0.0%) |
| 2 or 3 Rooms | 0 (0.0%) | 0 (0.0%) |
| 4 or 5 Rooms | 30 (39.0%) | 45 (100.0%) |
| 6 or 7 Rooms | 47 (61.0%) | 0 (0.0%) |
| 8 or more Rooms | 0 (0.0%) | 0 (0.0%) |
| Total | 77 (100.0%) | 45 (100.0%) |
Housing Structure by Heating Type in Outlook
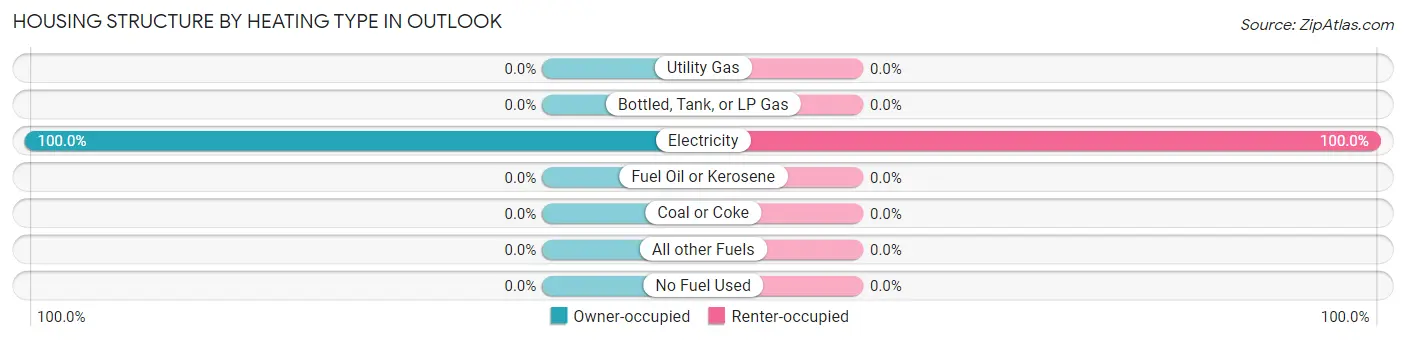
| Heating Type | Owner-occupied | Renter-occupied |
| Utility Gas | 0 (0.0%) | 0 (0.0%) |
| Bottled, Tank, or LP Gas | 0 (0.0%) | 0 (0.0%) |
| Electricity | 77 (100.0%) | 45 (100.0%) |
| Fuel Oil or Kerosene | 0 (0.0%) | 0 (0.0%) |
| Coal or Coke | 0 (0.0%) | 0 (0.0%) |
| All other Fuels | 0 (0.0%) | 0 (0.0%) |
| No Fuel Used | 0 (0.0%) | 0 (0.0%) |
| Total | 77 (100.0%) | 45 (100.0%) |
Household Vehicle Usage in Outlook
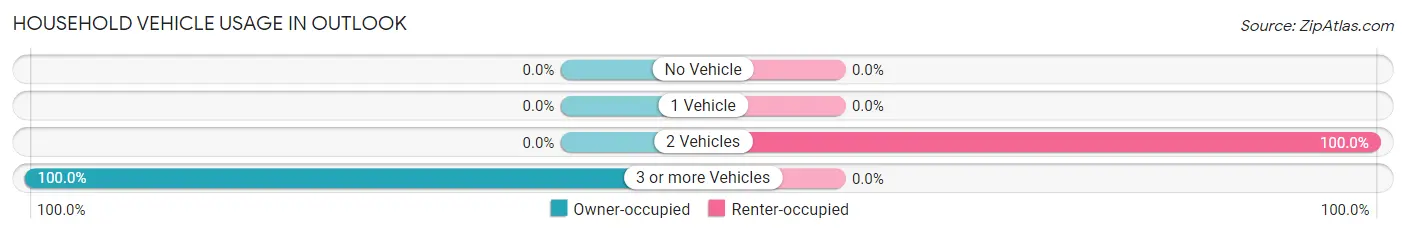
| Vehicles per Household | Owner-occupied | Renter-occupied |
| No Vehicle | 0 (0.0%) | 0 (0.0%) |
| 1 Vehicle | 0 (0.0%) | 0 (0.0%) |
| 2 Vehicles | 0 (0.0%) | 45 (100.0%) |
| 3 or more Vehicles | 77 (100.0%) | 0 (0.0%) |
| Total | 77 (100.0%) | 45 (100.0%) |
Real Estate & Mortgages in Outlook
Real Estate and Mortgage Overview in Outlook
| Characteristic | Without Mortgage | With Mortgage |
| Housing Units | 17 | 60 |
| Median Property Value | - | - |
| Median Household Income | - | - |
| Monthly Housing Costs | - | - |
| Real Estate Taxes | - | - |
Property Value by Mortgage Status in Outlook
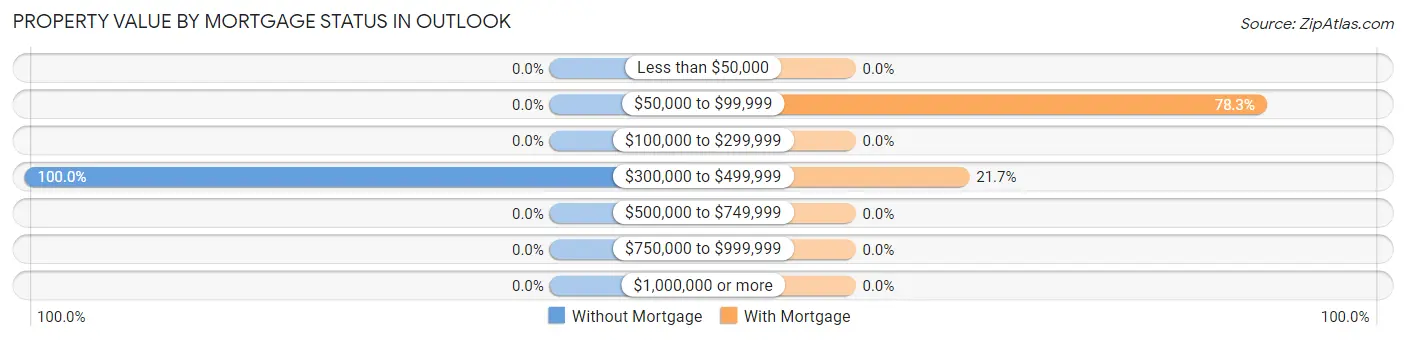
| Property Value | Without Mortgage | With Mortgage |
| Less than $50,000 | 0 (0.0%) | 0 (0.0%) |
| $50,000 to $99,999 | 0 (0.0%) | 47 (78.3%) |
| $100,000 to $299,999 | 0 (0.0%) | 0 (0.0%) |
| $300,000 to $499,999 | 17 (100.0%) | 13 (21.7%) |
| $500,000 to $749,999 | 0 (0.0%) | 0 (0.0%) |
| $750,000 to $999,999 | 0 (0.0%) | 0 (0.0%) |
| $1,000,000 or more | 0 (0.0%) | 0 (0.0%) |
| Total | 17 (100.0%) | 60 (100.0%) |
Household Income by Mortgage Status in Outlook
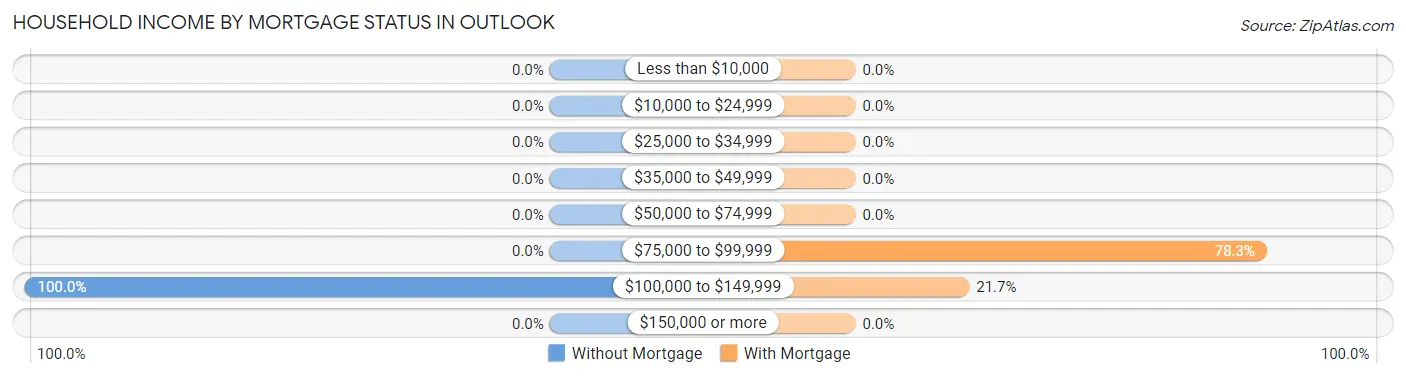
| Household Income | Without Mortgage | With Mortgage |
| Less than $10,000 | 0 (0.0%) | 0 (0.0%) |
| $10,000 to $24,999 | 0 (0.0%) | 0 (0.0%) |
| $25,000 to $34,999 | 0 (0.0%) | 0 (0.0%) |
| $35,000 to $49,999 | 0 (0.0%) | 0 (0.0%) |
| $50,000 to $74,999 | 0 (0.0%) | 0 (0.0%) |
| $75,000 to $99,999 | 0 (0.0%) | 47 (78.3%) |
| $100,000 to $149,999 | 17 (100.0%) | 13 (21.7%) |
| $150,000 or more | 0 (0.0%) | 0 (0.0%) |
| Total | 17 (100.0%) | 60 (100.0%) |
Property Value to Household Income Ratio in Outlook
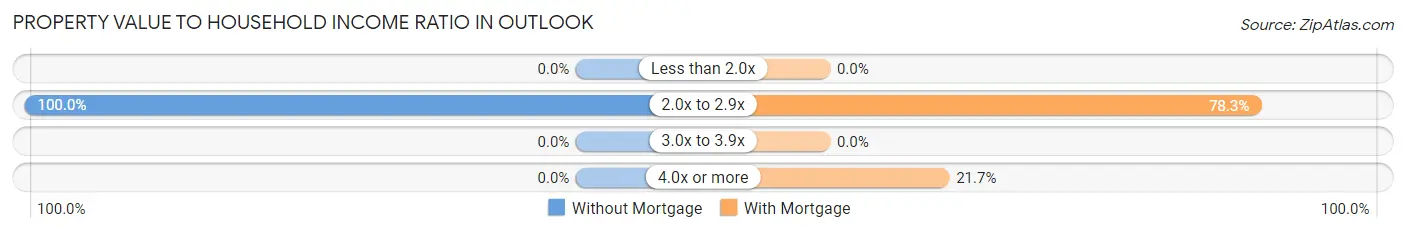
| Value-to-Income Ratio | Without Mortgage | With Mortgage |
| Less than 2.0x | 0 (0.0%) | 0 (0.0%) |
| 2.0x to 2.9x | 17 (100.0%) | 47 (78.3%) |
| 3.0x to 3.9x | 0 (0.0%) | 0 (0.0%) |
| 4.0x or more | 0 (0.0%) | 13 (21.7%) |
| Total | 17 (100.0%) | 60 (100.0%) |
Real Estate Taxes by Mortgage Status in Outlook
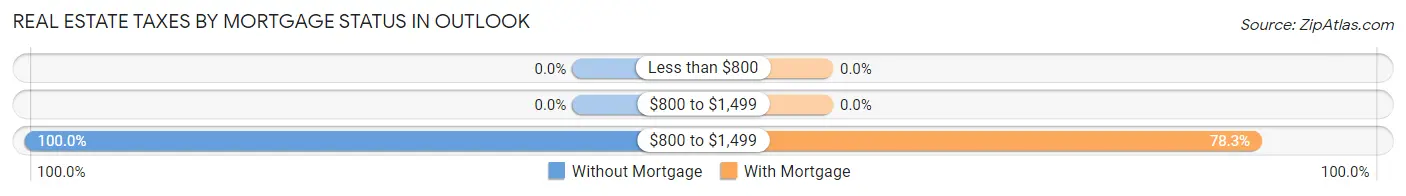
| Property Taxes | Without Mortgage | With Mortgage |
| Less than $800 | 0 (0.0%) | 0 (0.0%) |
| $800 to $1,499 | 0 (0.0%) | 0 (0.0%) |
| $800 to $1,499 | 17 (100.0%) | 47 (78.3%) |
| Total | 17 (100.0%) | 60 (100.0%) |
Health & Disability in Outlook
Health Insurance Coverage by Age in Outlook
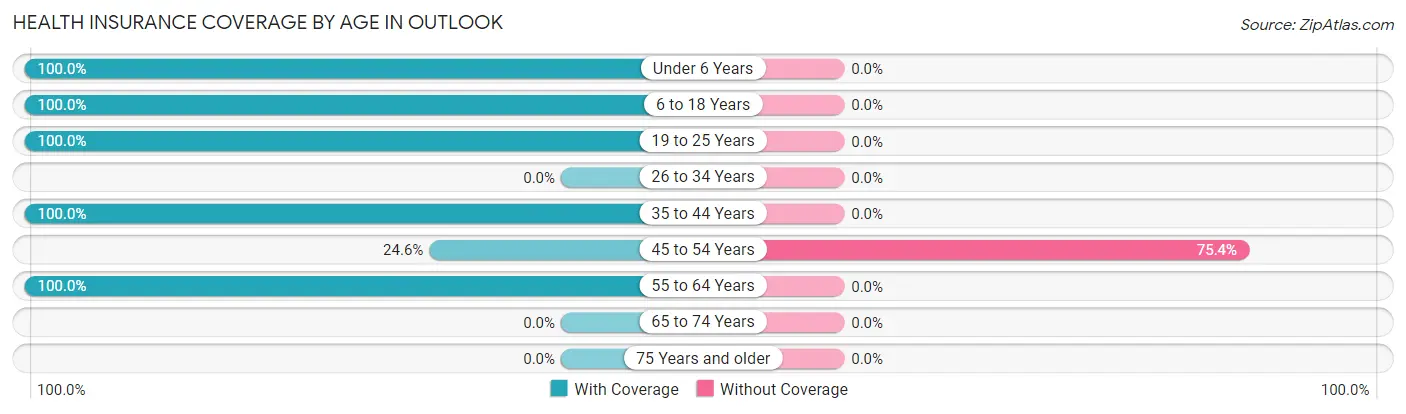
| Age Bracket | With Coverage | Without Coverage |
| Under 6 Years | 57 (100.0%) | 0 (0.0%) |
| 6 to 18 Years | 35 (100.0%) | 0 (0.0%) |
| 19 to 25 Years | 53 (100.0%) | 0 (0.0%) |
| 26 to 34 Years | 0 (0.0%) | 0 (0.0%) |
| 35 to 44 Years | 34 (100.0%) | 0 (0.0%) |
| 45 to 54 Years | 28 (24.6%) | 86 (75.4%) |
| 55 to 64 Years | 47 (100.0%) | 0 (0.0%) |
| 65 to 74 Years | 0 (0.0%) | 0 (0.0%) |
| 75 Years and older | 0 (0.0%) | 0 (0.0%) |
| Total | 254 (74.7%) | 86 (25.3%) |
Health Insurance Coverage by Citizenship Status in Outlook
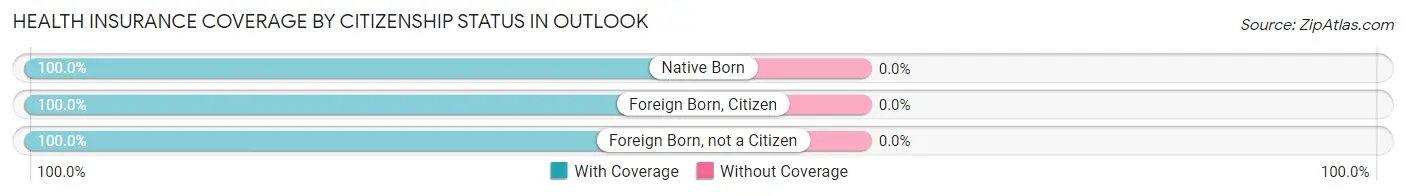
| Citizenship Status | With Coverage | Without Coverage |
| Native Born | 57 (100.0%) | 0 (0.0%) |
| Foreign Born, Citizen | 35 (100.0%) | 0 (0.0%) |
| Foreign Born, not a Citizen | 53 (100.0%) | 0 (0.0%) |
Health Insurance Coverage by Household Income in Outlook
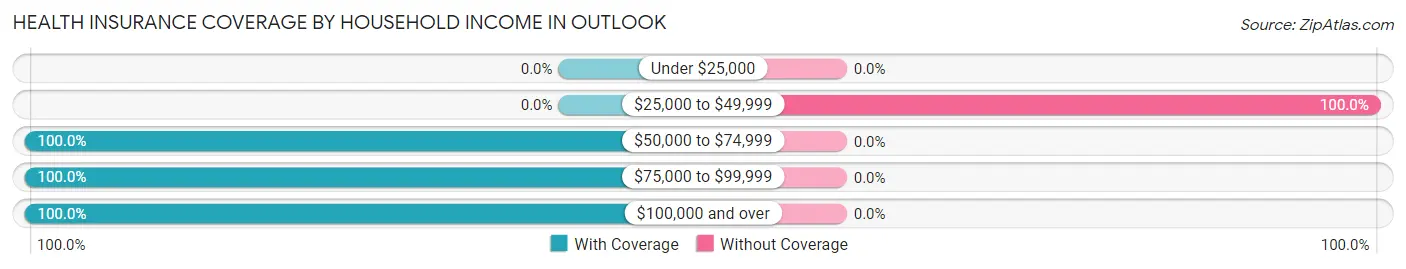
| Household Income | With Coverage | Without Coverage |
| Under $25,000 | 0 (0.0%) | 0 (0.0%) |
| $25,000 to $49,999 | 0 (0.0%) | 86 (100.0%) |
| $50,000 to $74,999 | 157 (100.0%) | 0 (0.0%) |
| $75,000 to $99,999 | 43 (100.0%) | 0 (0.0%) |
| $100,000 and over | 54 (100.0%) | 0 (0.0%) |
Public vs Private Health Insurance Coverage by Age in Outlook
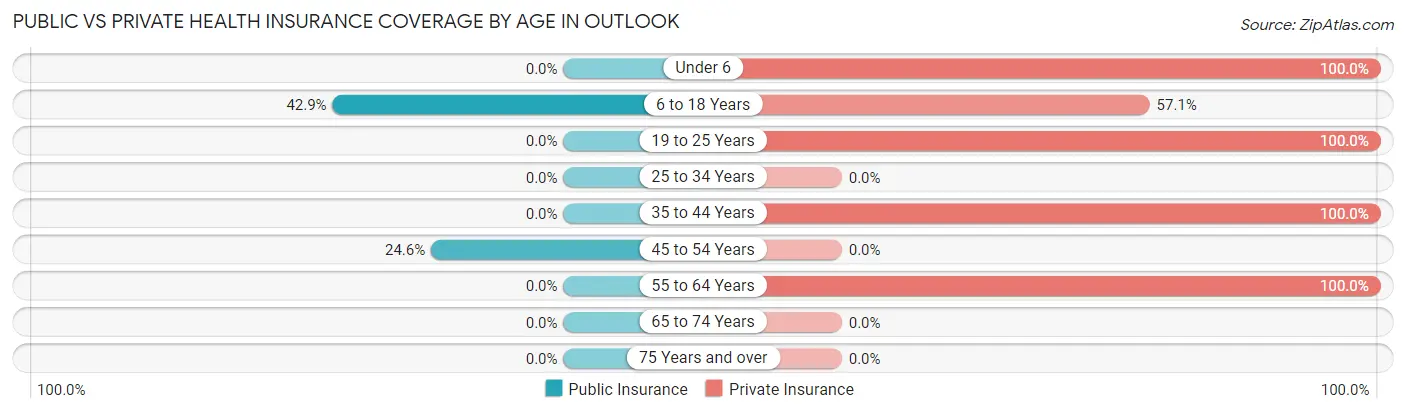
| Age Bracket | Public Insurance | Private Insurance |
| Under 6 | 0 (0.0%) | 57 (100.0%) |
| 6 to 18 Years | 15 (42.9%) | 20 (57.1%) |
| 19 to 25 Years | 0 (0.0%) | 53 (100.0%) |
| 25 to 34 Years | 0 (0.0%) | 0 (0.0%) |
| 35 to 44 Years | 0 (0.0%) | 34 (100.0%) |
| 45 to 54 Years | 28 (24.6%) | 0 (0.0%) |
| 55 to 64 Years | 0 (0.0%) | 47 (100.0%) |
| 65 to 74 Years | 0 (0.0%) | 0 (0.0%) |
| 75 Years and over | 0 (0.0%) | 0 (0.0%) |
| Total | 43 (12.7%) | 211 (62.1%) |
Disability Status by Sex by Age in Outlook
| Age Bracket | Male | Female |
| Under 5 Years | 0 (0.0%) | 0 (0.0%) |
| 5 to 17 Years | 0 (0.0%) | 0 (0.0%) |
| 18 to 34 Years | 0 (0.0%) | 0 (0.0%) |
| 35 to 64 Years | 0 (0.0%) | 0 (0.0%) |
| 65 to 74 Years | 0 (0.0%) | 0 (0.0%) |
| 75 Years and over | 0 (0.0%) | 0 (0.0%) |
Disability Class by Sex by Age in Outlook
Disability Class: Hearing Difficulty
| Age Bracket | Male | Female |
| Under 5 Years | 0 (0.0%) | 0 (0.0%) |
| 5 to 17 Years | 0 (0.0%) | 0 (0.0%) |
| 18 to 34 Years | 0 (0.0%) | 0 (0.0%) |
| 35 to 64 Years | 0 (0.0%) | 0 (0.0%) |
| 65 to 74 Years | 0 (0.0%) | 0 (0.0%) |
| 75 Years and over | 0 (0.0%) | 0 (0.0%) |
Disability Class: Vision Difficulty
| Age Bracket | Male | Female |
| Under 5 Years | 0 (0.0%) | 0 (0.0%) |
| 5 to 17 Years | 0 (0.0%) | 0 (0.0%) |
| 18 to 34 Years | 0 (0.0%) | 0 (0.0%) |
| 35 to 64 Years | 0 (0.0%) | 0 (0.0%) |
| 65 to 74 Years | 0 (0.0%) | 0 (0.0%) |
| 75 Years and over | 0 (0.0%) | 0 (0.0%) |
Disability Class: Cognitive Difficulty
| Age Bracket | Male | Female |
| 5 to 17 Years | 0 (0.0%) | 0 (0.0%) |
| 18 to 34 Years | 0 (0.0%) | 0 (0.0%) |
| 35 to 64 Years | 0 (0.0%) | 0 (0.0%) |
| 65 to 74 Years | 0 (0.0%) | 0 (0.0%) |
| 75 Years and over | 0 (0.0%) | 0 (0.0%) |
Disability Class: Ambulatory Difficulty
| Age Bracket | Male | Female |
| 5 to 17 Years | 0 (0.0%) | 0 (0.0%) |
| 18 to 34 Years | 0 (0.0%) | 0 (0.0%) |
| 35 to 64 Years | 0 (0.0%) | 0 (0.0%) |
| 65 to 74 Years | 0 (0.0%) | 0 (0.0%) |
| 75 Years and over | 0 (0.0%) | 0 (0.0%) |
Disability Class: Self-Care Difficulty

| Age Bracket | Male | Female |
| 5 to 17 Years | 0 (0.0%) | 0 (0.0%) |
| 18 to 34 Years | 0 (0.0%) | 0 (0.0%) |
| 35 to 64 Years | 0 (0.0%) | 0 (0.0%) |
| 65 to 74 Years | 0 (0.0%) | 0 (0.0%) |
| 75 Years and over | 0 (0.0%) | 0 (0.0%) |
Technology Access in Outlook
Computing Device Access in Outlook
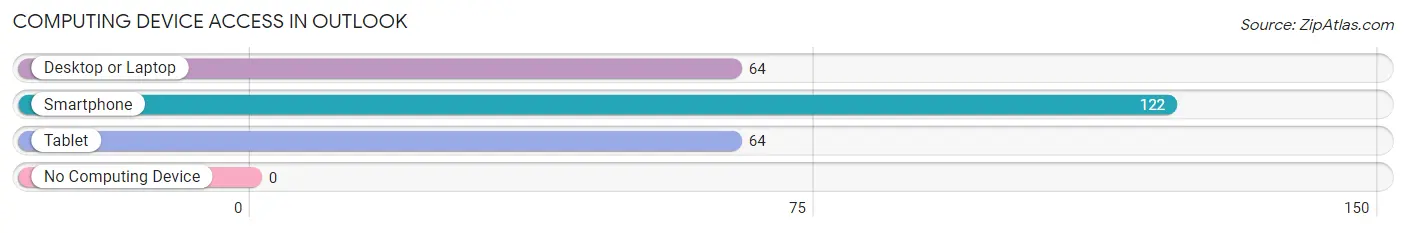
| Device Type | # Households | % Households |
| Desktop or Laptop | 64 | 52.5% |
| Smartphone | 122 | 100.0% |
| Tablet | 64 | 52.5% |
| No Computing Device | 0 | 0.0% |
| Total | 122 | 100.0% |
Internet Access in Outlook
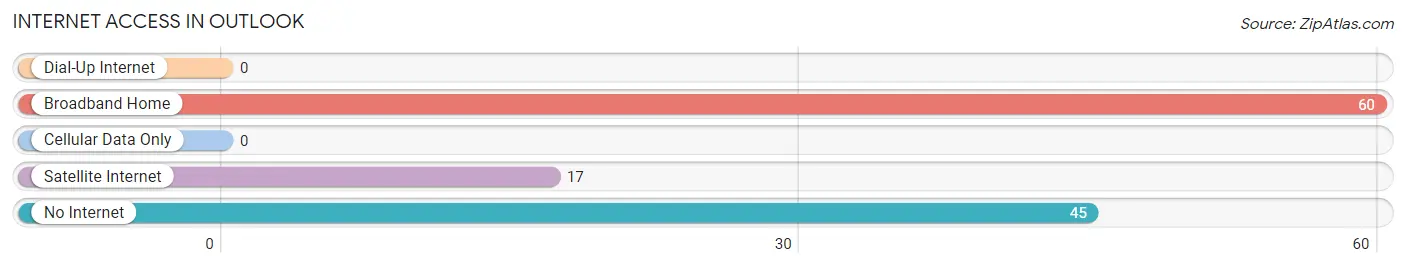
| Internet Type | # Households | % Households |
| Dial-Up Internet | 0 | 0.0% |
| Broadband Home | 60 | 49.2% |
| Cellular Data Only | 0 | 0.0% |
| Satellite Internet | 17 | 13.9% |
| No Internet | 45 | 36.9% |
| Total | 122 | 100.0% |
Outlook Summary
Outlook, Washington is a small town located in the heart of the Columbia Basin in the state of Washington. It is situated in the south-central part of the state, approximately 20 miles south of the city of Moses Lake. The town is located in Grant County and is part of the Moses Lake-Othello-Moses Lake Metropolitan Statistical Area. The population of Outlook was 1,845 in the 2010 census.
History
Outlook was founded in the late 1800s by settlers who were drawn to the area by the fertile soil and abundant water. The town was originally known as "Outlook Station" and was a stop on the Northern Pacific Railroad. The town was officially incorporated in 1909 and was named after the nearby Outlook Ridge.
Geography
Outlook is located in the Columbia Basin, a large area of flat land in the eastern part of Washington State. The town is situated at an elevation of 1,717 feet and is surrounded by rolling hills and farmland. The nearby Columbia River provides irrigation for the area and is a popular destination for fishing and boating.
Climate
Outlook has a semi-arid climate, with hot summers and cold winters. The average high temperature in July is 90°F and the average low temperature in January is 22°F. The area receives an average of 8.5 inches of precipitation per year, with most of it falling in the winter months.
Economy
Outlook's economy is largely based on agriculture. The area is known for its production of wheat, barley, and other grains. The town is also home to several food processing plants, including a cannery and a potato processing plant.
In addition to agriculture, Outlook is home to several businesses, including a lumber mill, a machine shop, and a trucking company. The town is also home to a number of retail stores, including a grocery store, a hardware store, and a pharmacy.
Demographics
As of the 2010 census, the population of Outlook was 1,845. The racial makeup of the town was 94.3% White, 0.7% African American, 0.7% Native American, 0.3% Asian, 0.1% Pacific Islander, and 3.0% from other races. The median household income was $37,917 and the median family income was $45,938.
Outlook is a small town with a close-knit community. The town is home to several churches, a library, and a community center. The town also hosts several annual events, including a Fourth of July celebration and a Harvest Festival.
Common Questions
What is Per Capita Income in Outlook?
Per Capita income in Outlook is $24,544.
What is the Median Family Income in Outlook?
Median Family Income in Outlook is $68,351.
What is the Median Household income in Outlook?
Median Household Income in Outlook is $68,351.
What is Income or Wage Gap in Outlook?
Income or Wage Gap in Outlook is 28.2%.
Women in Outlook earn 71.8 cents for every dollar earned by a man.
What is Inequality or Gini Index in Outlook?
Inequality or Gini Index in Outlook is 0.18.
What is the Total Population of Outlook?
Total Population of Outlook is 340.
What is the Total Male Population of Outlook?
Total Male Population of Outlook is 108.
What is the Total Female Population of Outlook?
Total Female Population of Outlook is 232.
What is the Ratio of Males per 100 Females in Outlook?
There are 46.55 Males per 100 Females in Outlook.
What is the Ratio of Females per 100 Males in Outlook?
There are 214.81 Females per 100 Males in Outlook.
What is the Median Population Age in Outlook?
Median Population Age in Outlook is 44.5 Years.
What is the Average Family Size in Outlook
Average Family Size in Outlook is 2.8 People.
What is the Average Household Size in Outlook
Average Household Size in Outlook is 2.8 People.
How Large is the Labor Force in Outlook?
There are 263 People in the Labor Forcein in Outlook.
What is the Percentage of People in the Labor Force in Outlook?
100.0% of People are in the Labor Force in Outlook.