Clallam Bay, WA Map & Demographics
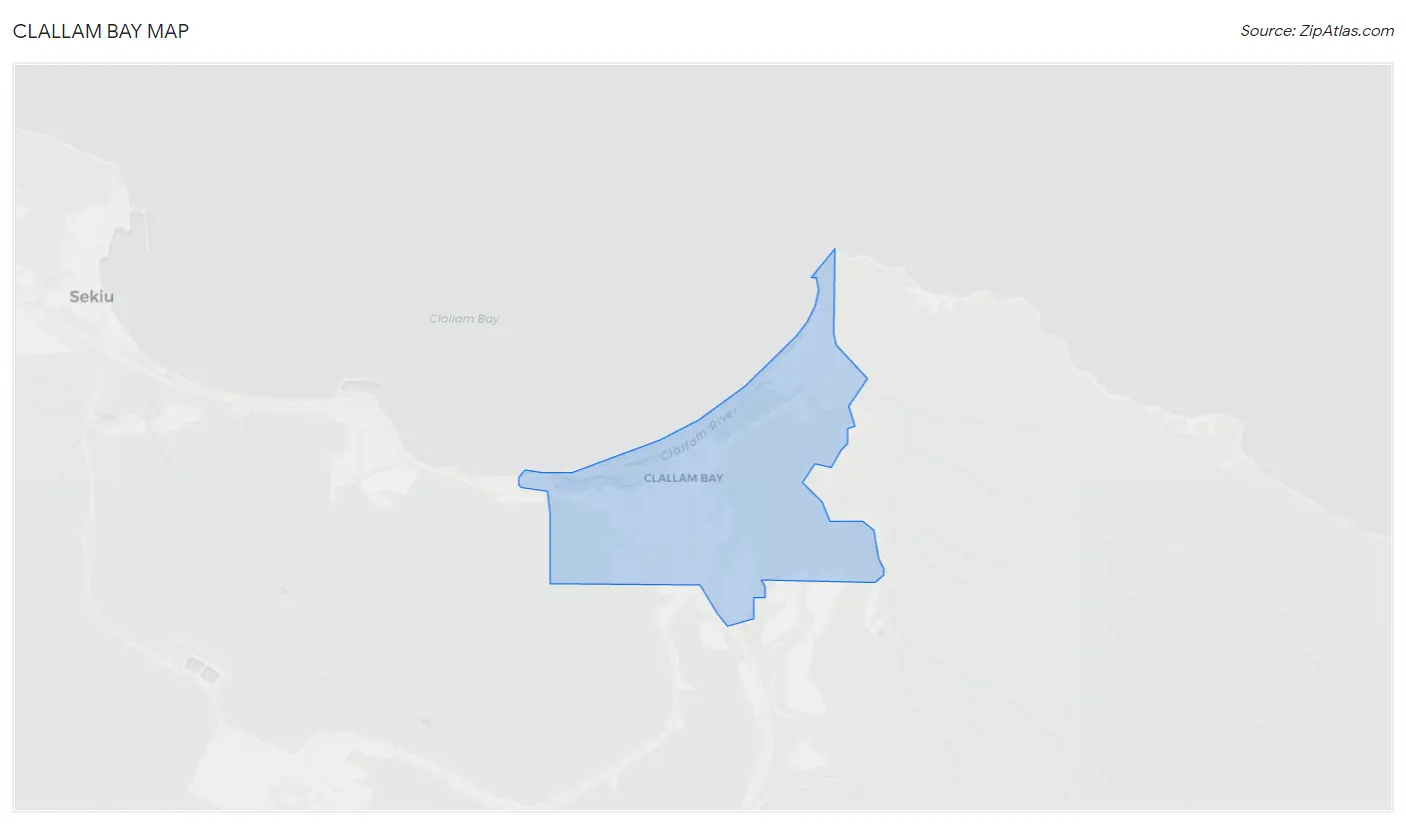
Clallam Bay Map
Clallam Bay Overview
$22,679
PER CAPITA INCOME
$45,179
AVG FAMILY INCOME
$45,321
AVG HOUSEHOLD INCOME
45.4%
WAGE / INCOME GAP [ % ]
54.6¢/ $1
WAGE / INCOME GAP [ $ ]
0.34
INEQUALITY / GINI INDEX
734
TOTAL POPULATION
302
MALE POPULATION
432
FEMALE POPULATION
69.91
MALES / 100 FEMALES
143.05
FEMALES / 100 MALES
31.0
MEDIAN AGE
3.5
AVG FAMILY SIZE
2.9
AVG HOUSEHOLD SIZE
447
LABOR FORCE [ PEOPLE ]
81.9%
PERCENT IN LABOR FORCE
Clallam Bay Zip Codes
Clallam Bay Area Codes
Income in Clallam Bay
Income Overview in Clallam Bay
Per Capita Income in Clallam Bay is $22,679, while median incomes of families and households are $45,179 and $45,321 respectively.
| Characteristic | Number | Measure |
| Per Capita Income | 734 | $22,679 |
| Median Family Income | 145 | $45,179 |
| Mean Family Income | 145 | $51,168 |
| Median Household Income | 253 | $45,321 |
| Mean Household Income | 253 | $56,797 |
| Income Deficit | 145 | $0 |
| Wage / Income Gap (%) | 734 | 45.37% |
| Wage / Income Gap ($) | 734 | 54.63¢ per $1 |
| Gini / Inequality Index | 734 | 0.34 |
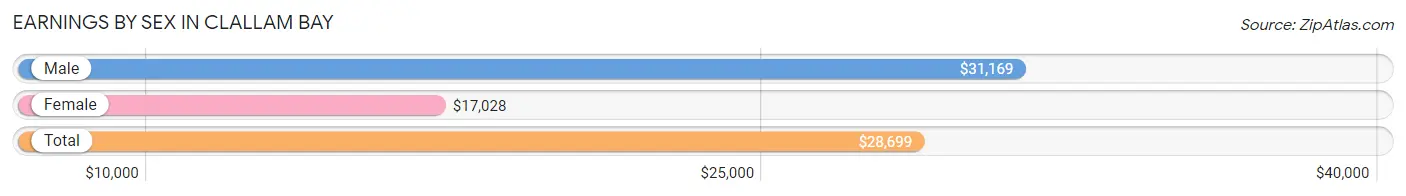
Earnings by Sex in Clallam Bay
Average Earnings in Clallam Bay are $28,699, $31,169 for men and $17,028 for women, a difference of 45.4%.
| Sex | Number | Average Earnings |
| Male | 197 (42.5%) | $31,169 |
| Female | 266 (57.5%) | $17,028 |
| Total | 463 (100.0%) | $28,699 |
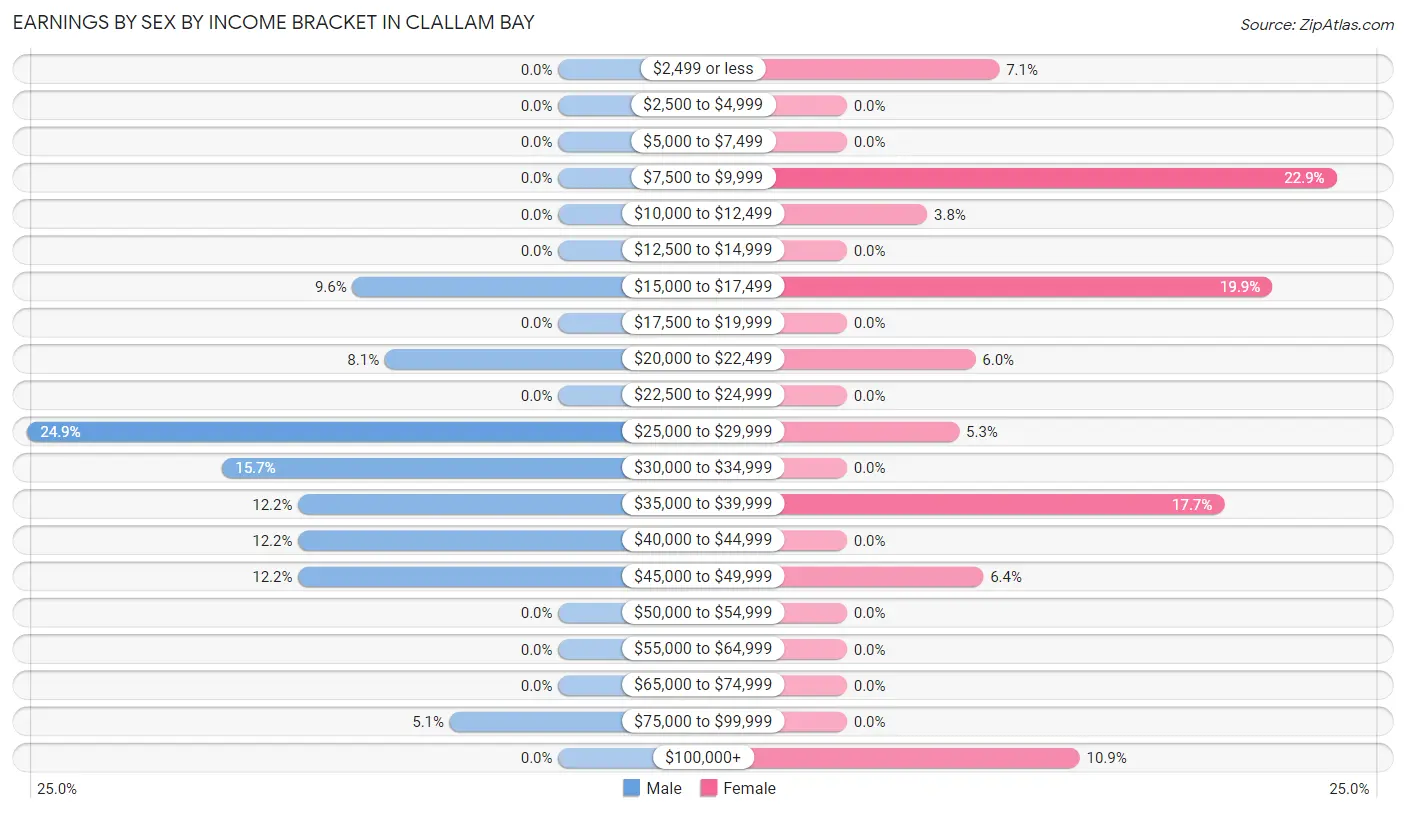
Earnings by Sex by Income Bracket in Clallam Bay
The most common earnings brackets in Clallam Bay are $25,000 to $29,999 for men (49 | 24.9%) and $7,500 to $9,999 for women (61 | 22.9%).
| Income | Male | Female |
| $2,499 or less | 0 (0.0%) | 19 (7.1%) |
| $2,500 to $4,999 | 0 (0.0%) | 0 (0.0%) |
| $5,000 to $7,499 | 0 (0.0%) | 0 (0.0%) |
| $7,500 to $9,999 | 0 (0.0%) | 61 (22.9%) |
| $10,000 to $12,499 | 0 (0.0%) | 10 (3.8%) |
| $12,500 to $14,999 | 0 (0.0%) | 0 (0.0%) |
| $15,000 to $17,499 | 19 (9.6%) | 53 (19.9%) |
| $17,500 to $19,999 | 0 (0.0%) | 0 (0.0%) |
| $20,000 to $22,499 | 16 (8.1%) | 16 (6.0%) |
| $22,500 to $24,999 | 0 (0.0%) | 0 (0.0%) |
| $25,000 to $29,999 | 49 (24.9%) | 14 (5.3%) |
| $30,000 to $34,999 | 31 (15.7%) | 0 (0.0%) |
| $35,000 to $39,999 | 24 (12.2%) | 47 (17.7%) |
| $40,000 to $44,999 | 24 (12.2%) | 0 (0.0%) |
| $45,000 to $49,999 | 24 (12.2%) | 17 (6.4%) |
| $50,000 to $54,999 | 0 (0.0%) | 0 (0.0%) |
| $55,000 to $64,999 | 0 (0.0%) | 0 (0.0%) |
| $65,000 to $74,999 | 0 (0.0%) | 0 (0.0%) |
| $75,000 to $99,999 | 10 (5.1%) | 0 (0.0%) |
| $100,000+ | 0 (0.0%) | 29 (10.9%) |
| Total | 197 (100.0%) | 266 (100.0%) |
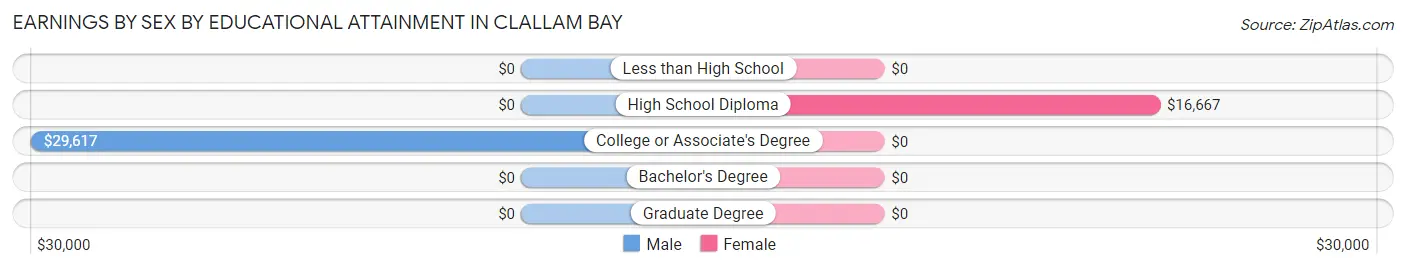
Earnings by Sex by Educational Attainment in Clallam Bay
Average earnings in Clallam Bay are $31,169 for men and $21,172 for women, a difference of 32.1%. Men with an educational attainment of college or associate's degree enjoy the highest average annual earnings of $29,617, while those with college or associate's degree education earn the least with $29,617. Women with an educational attainment of high school diploma earn the most with the average annual earnings of $16,667, while those with high school diploma education have the smallest earnings of $16,667.
| Educational Attainment | Male Income | Female Income |
| Less than High School | - | - |
| High School Diploma | - | - |
| College or Associate's Degree | $29,617 | $0 |
| Bachelor's Degree | - | - |
| Graduate Degree | - | - |
| Total | $31,169 | $21,172 |
Family Income in Clallam Bay
Family Income Brackets in Clallam Bay
According to the Clallam Bay family income data, there are 47 families falling into the $25,000 to $34,999 income range, which is the most common income bracket and makes up 32.4% of all families.
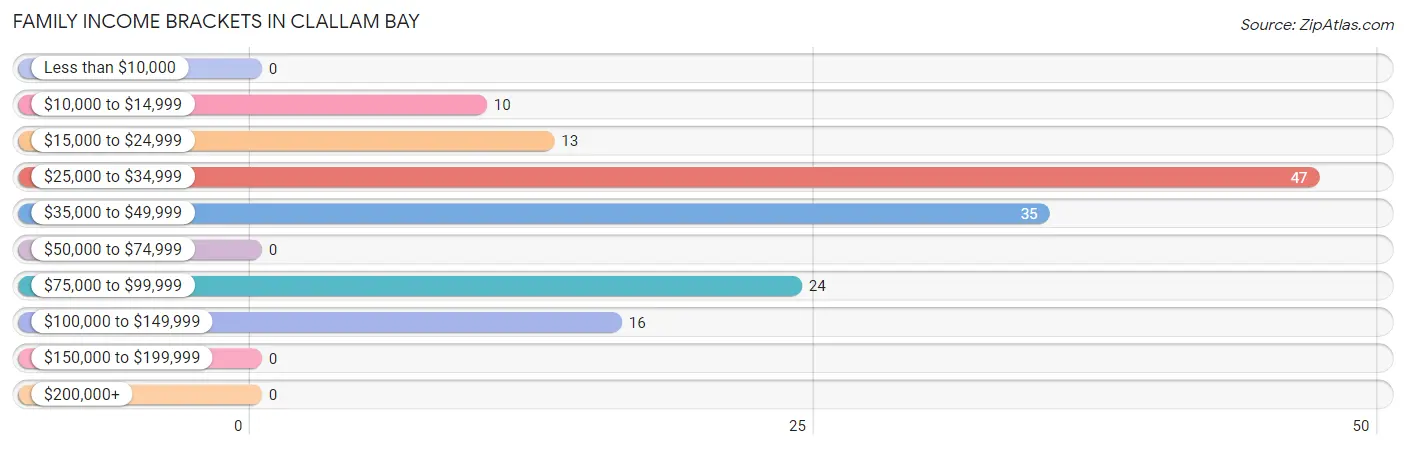
| Income Bracket | # Families | % Families |
| Less than $10,000 | 0 | 0.0% |
| $10,000 to $14,999 | 10 | 6.9% |
| $15,000 to $24,999 | 13 | 9.0% |
| $25,000 to $34,999 | 47 | 32.4% |
| $35,000 to $49,999 | 35 | 24.1% |
| $50,000 to $74,999 | 0 | 0.0% |
| $75,000 to $99,999 | 24 | 16.6% |
| $100,000 to $149,999 | 16 | 11.0% |
| $150,000 to $199,999 | 0 | 0.0% |
| $200,000+ | 0 | 0.0% |
Family Income by Famaliy Size in Clallam Bay
2-person families (86 | 59.3%) account for the highest median family income in Clallam Bay with $30,323 per family, while 2-person families (86 | 59.3%) have the highest median income of $15,162 per family member.
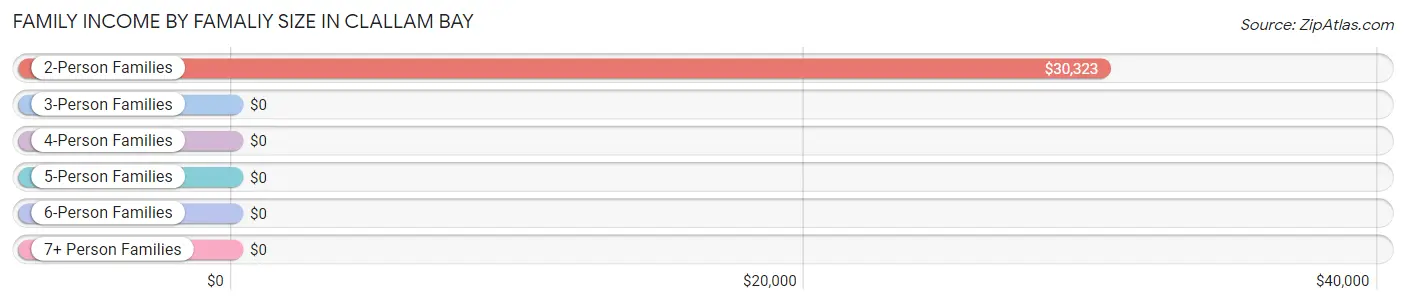
| Income Bracket | # Families | Median Income |
| 2-Person Families | 86 (59.3%) | $30,323 |
| 3-Person Families | 10 (6.9%) | $0 |
| 4-Person Families | 35 (24.1%) | $0 |
| 5-Person Families | 14 (9.7%) | $0 |
| 6-Person Families | 0 (0.0%) | $0 |
| 7+ Person Families | 0 (0.0%) | $0 |
| Total | 145 (100.0%) | $45,179 |
Family Income by Number of Earners in Clallam Bay
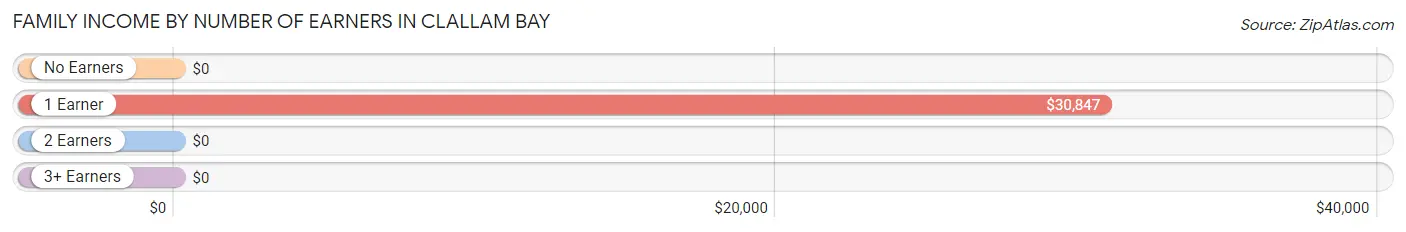
| Number of Earners | # Families | Median Income |
| No Earners | 13 (9.0%) | $0 |
| 1 Earner | 73 (50.3%) | $30,847 |
| 2 Earners | 59 (40.7%) | $0 |
| 3+ Earners | 0 (0.0%) | $0 |
| Total | 145 (100.0%) | $45,179 |
Household Income in Clallam Bay
Household Income Brackets in Clallam Bay
With 68 households falling in the category, the $25,000 to $34,999 income range is the most frequent in Clallam Bay, accounting for 26.9% of all households.
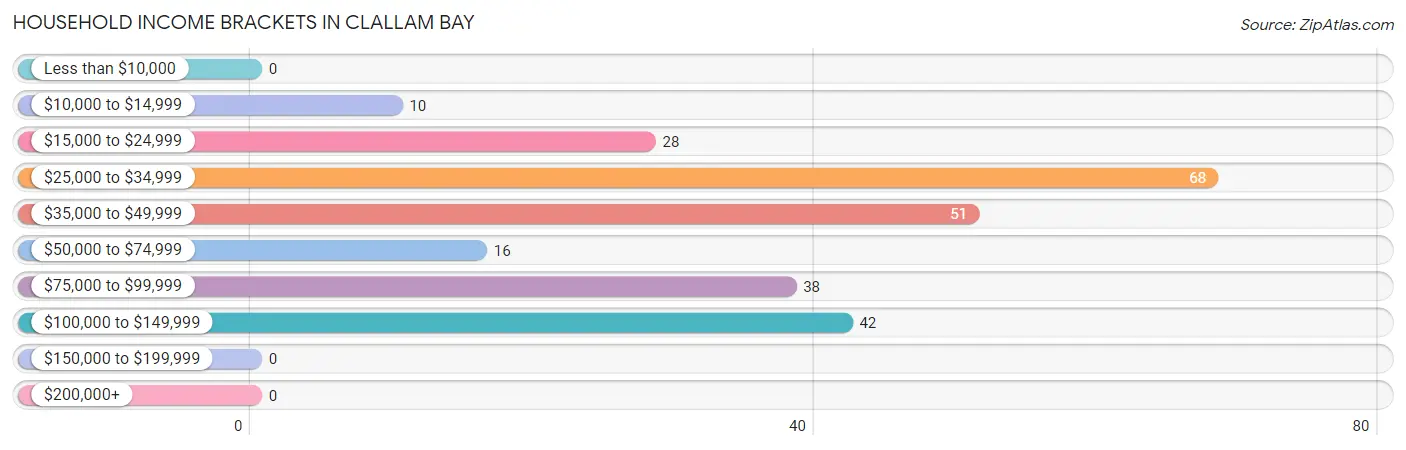
| Income Bracket | # Households | % Households |
| Less than $10,000 | 0 | 0.0% |
| $10,000 to $14,999 | 10 | 4.0% |
| $15,000 to $24,999 | 28 | 11.1% |
| $25,000 to $34,999 | 68 | 26.9% |
| $35,000 to $49,999 | 51 | 20.2% |
| $50,000 to $74,999 | 16 | 6.3% |
| $75,000 to $99,999 | 38 | 15.0% |
| $100,000 to $149,999 | 42 | 16.6% |
| $150,000 to $199,999 | 0 | 0.0% |
| $200,000+ | 0 | 0.0% |
Household Income by Householder Age in Clallam Bay
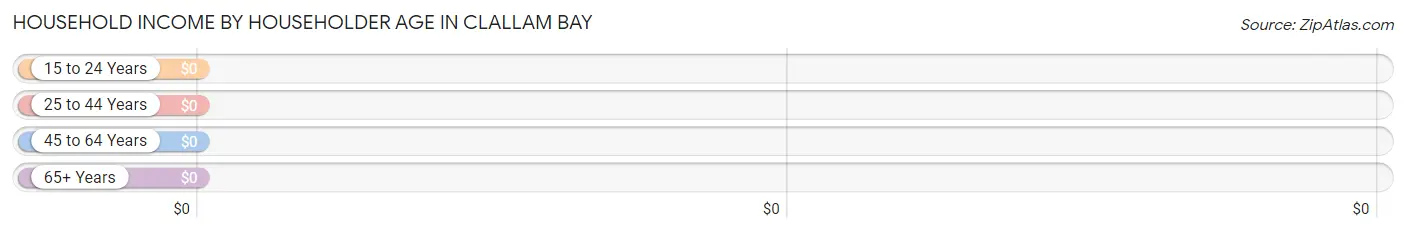
| Income Bracket | # Households | Median Income |
| 15 to 24 Years | 35 (13.8%) | $0 |
| 25 to 44 Years | 67 (26.5%) | $0 |
| 45 to 64 Years | 91 (36.0%) | $0 |
| 65+ Years | 60 (23.7%) | $0 |
| Total | 253 (100.0%) | $45,321 |
Poverty in Clallam Bay
Income Below Poverty by Sex and Age in Clallam Bay
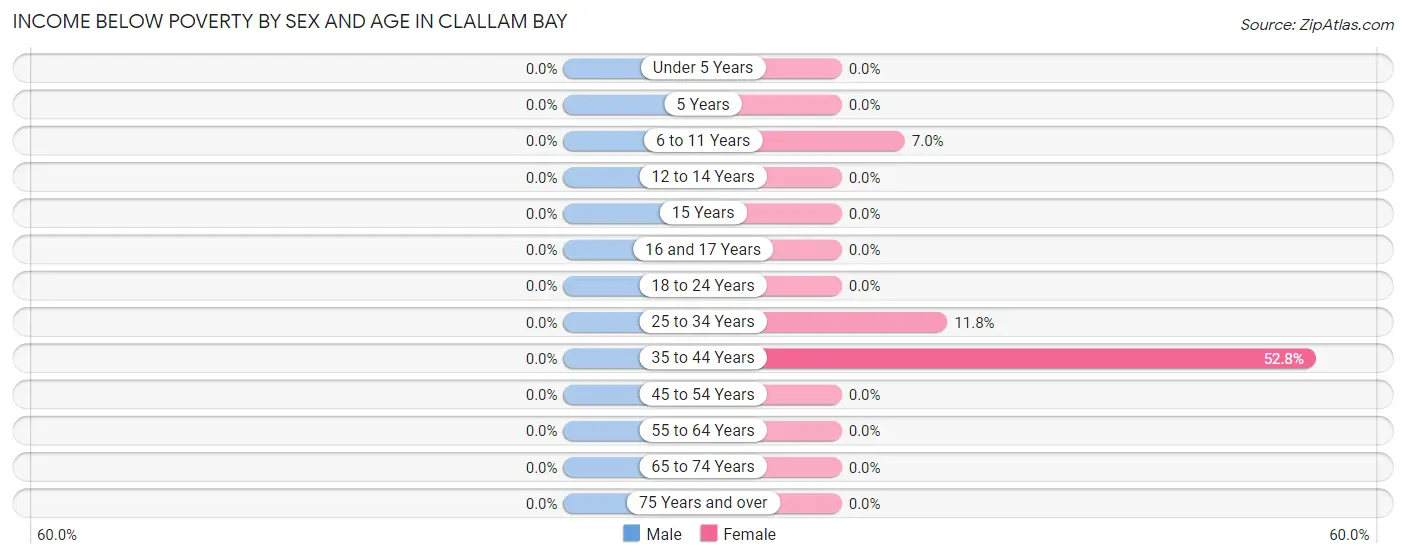
| Age Bracket | Male | Female |
| Under 5 Years | 0 (0.0%) | 0 (0.0%) |
| 5 Years | 0 (0.0%) | 0 (0.0%) |
| 6 to 11 Years | 0 (0.0%) | 8 (7.0%) |
| 12 to 14 Years | 0 (0.0%) | 0 (0.0%) |
| 15 Years | 0 (0.0%) | 0 (0.0%) |
| 16 and 17 Years | 0 (0.0%) | 0 (0.0%) |
| 18 to 24 Years | 0 (0.0%) | 0 (0.0%) |
| 25 to 34 Years | 0 (0.0%) | 10 (11.8%) |
| 35 to 44 Years | 0 (0.0%) | 19 (52.8%) |
| 45 to 54 Years | 0 (0.0%) | 0 (0.0%) |
| 55 to 64 Years | 0 (0.0%) | 0 (0.0%) |
| 65 to 74 Years | 0 (0.0%) | 0 (0.0%) |
| 75 Years and over | 0 (0.0%) | 0 (0.0%) |
| Total | 0 (0.0%) | 37 (8.6%) |
Income Above Poverty by Sex and Age in Clallam Bay
According to the poverty statistics in Clallam Bay, males aged under 5 years and females aged 18 to 24 years are the age groups that are most secure financially, with 100.0% of males and 100.0% of females in these age groups living above the poverty line.
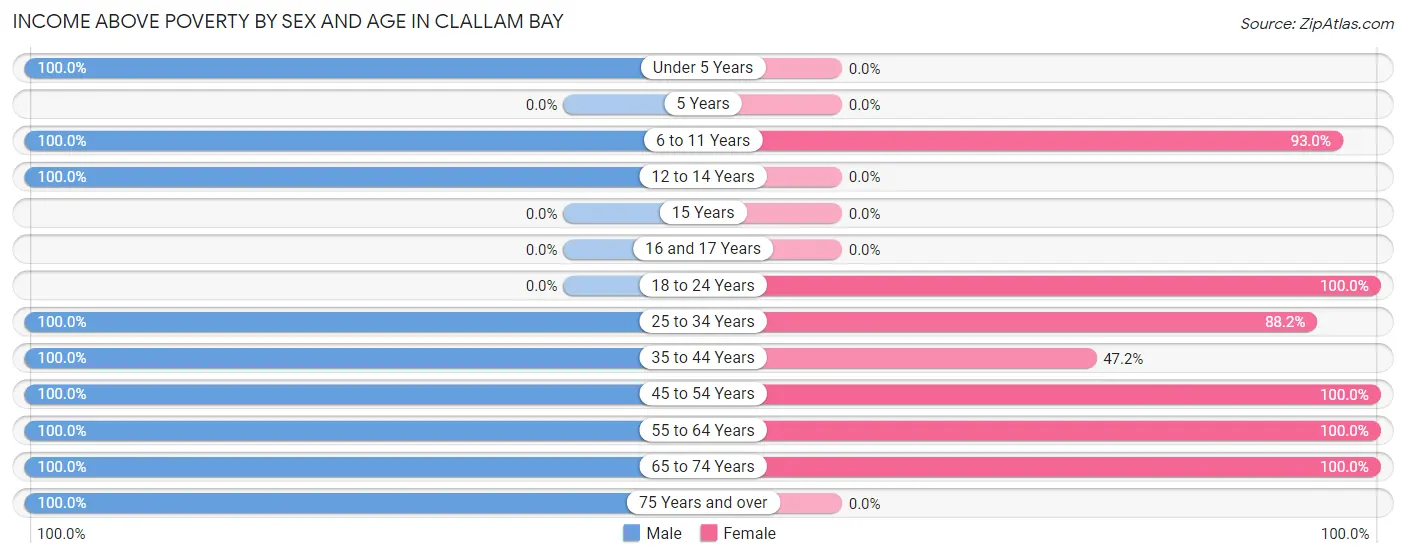
| Age Bracket | Male | Female |
| Under 5 Years | 27 (100.0%) | 0 (0.0%) |
| 5 Years | 0 (0.0%) | 0 (0.0%) |
| 6 to 11 Years | 29 (100.0%) | 106 (93.0%) |
| 12 to 14 Years | 18 (100.0%) | 0 (0.0%) |
| 15 Years | 0 (0.0%) | 0 (0.0%) |
| 16 and 17 Years | 0 (0.0%) | 0 (0.0%) |
| 18 to 24 Years | 0 (0.0%) | 35 (100.0%) |
| 25 to 34 Years | 97 (100.0%) | 75 (88.2%) |
| 35 to 44 Years | 43 (100.0%) | 17 (47.2%) |
| 45 to 54 Years | 31 (100.0%) | 70 (100.0%) |
| 55 to 64 Years | 26 (100.0%) | 63 (100.0%) |
| 65 to 74 Years | 16 (100.0%) | 29 (100.0%) |
| 75 Years and over | 15 (100.0%) | 0 (0.0%) |
| Total | 302 (100.0%) | 395 (91.4%) |
Income Below Poverty Among Married-Couple Families in Clallam Bay
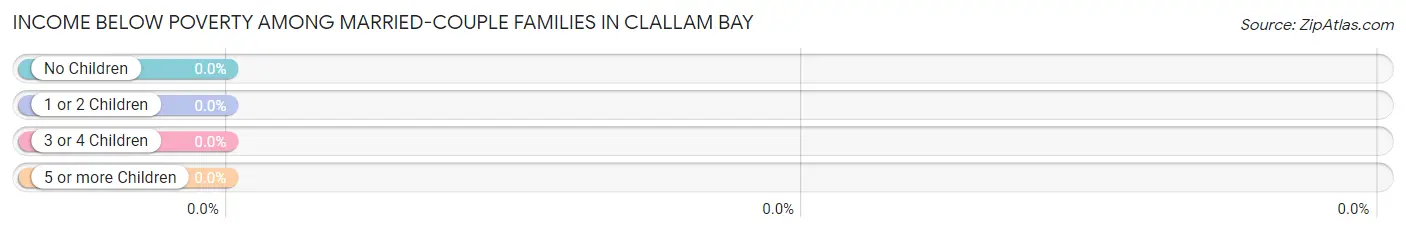
| Children | Above Poverty | Below Poverty |
| No Children | 26 (100.0%) | 0 (0.0%) |
| 1 or 2 Children | 35 (100.0%) | 0 (0.0%) |
| 3 or 4 Children | 14 (100.0%) | 0 (0.0%) |
| 5 or more Children | 0 (0.0%) | 0 (0.0%) |
| Total | 75 (100.0%) | 0 (0.0%) |
Income Below Poverty Among Single-Parent Households in Clallam Bay
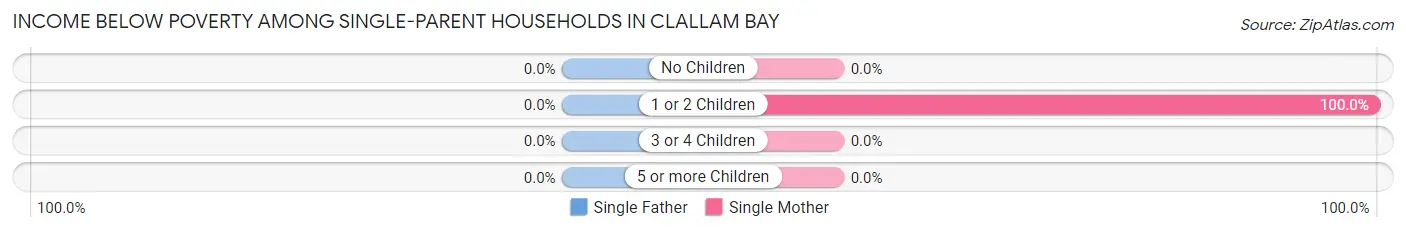
| Children | Single Father | Single Mother |
| No Children | 0 (0.0%) | 0 (0.0%) |
| 1 or 2 Children | 0 (0.0%) | 10 (100.0%) |
| 3 or 4 Children | 0 (0.0%) | 0 (0.0%) |
| 5 or more Children | 0 (0.0%) | 0 (0.0%) |
| Total | 0 (0.0%) | 10 (25.6%) |
Income Below Poverty Among Married-Couple vs Single-Parent Households in Clallam Bay
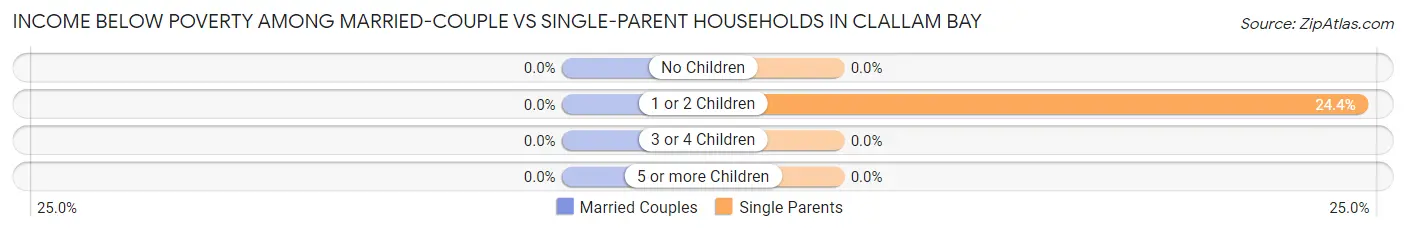
| Children | Married-Couple Families | Single-Parent Households |
| No Children | 0 (0.0%) | 0 (0.0%) |
| 1 or 2 Children | 0 (0.0%) | 10 (24.4%) |
| 3 or 4 Children | 0 (0.0%) | 0 (0.0%) |
| 5 or more Children | 0 (0.0%) | 0 (0.0%) |
| Total | 0 (0.0%) | 10 (14.3%) |
Race in Clallam Bay
The most populous races in Clallam Bay are White / Caucasian (502 | 68.4%), Hispanic or Latino (180 | 24.5%), and Some other Race (96 | 13.1%).
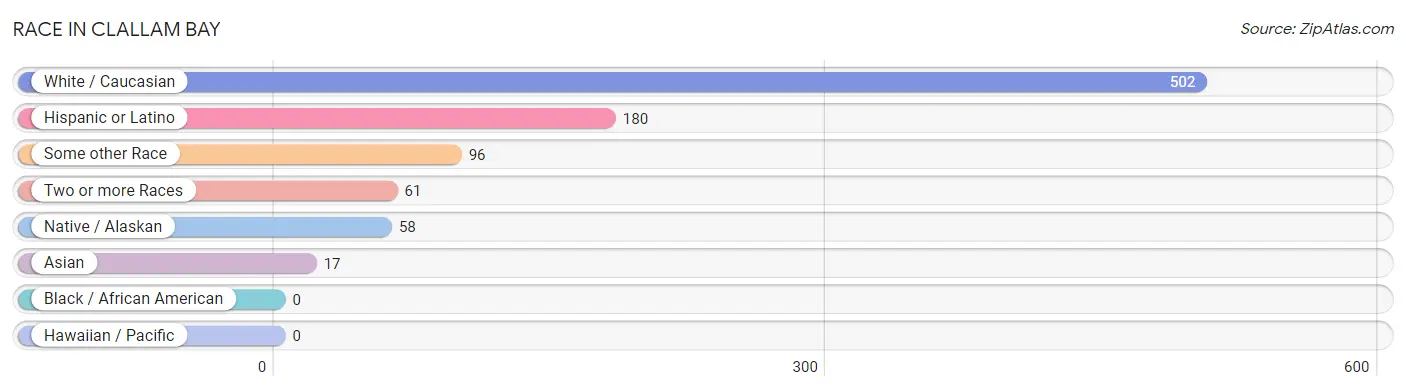
| Race | # Population | % Population |
| Asian | 17 | 2.3% |
| Black / African American | 0 | 0.0% |
| Hawaiian / Pacific | 0 | 0.0% |
| Hispanic or Latino | 180 | 24.5% |
| Native / Alaskan | 58 | 7.9% |
| White / Caucasian | 502 | 68.4% |
| Two or more Races | 61 | 8.3% |
| Some other Race | 96 | 13.1% |
| Total | 734 | 100.0% |
Ancestry in Clallam Bay
The most populous ancestries reported in Clallam Bay are Mexican (84 | 11.4%), Irish (73 | 10.0%), German (57 | 7.8%), Spaniard (54 | 7.4%), and Swedish (52 | 7.1%), together accounting for 43.6% of all Clallam Bay residents.
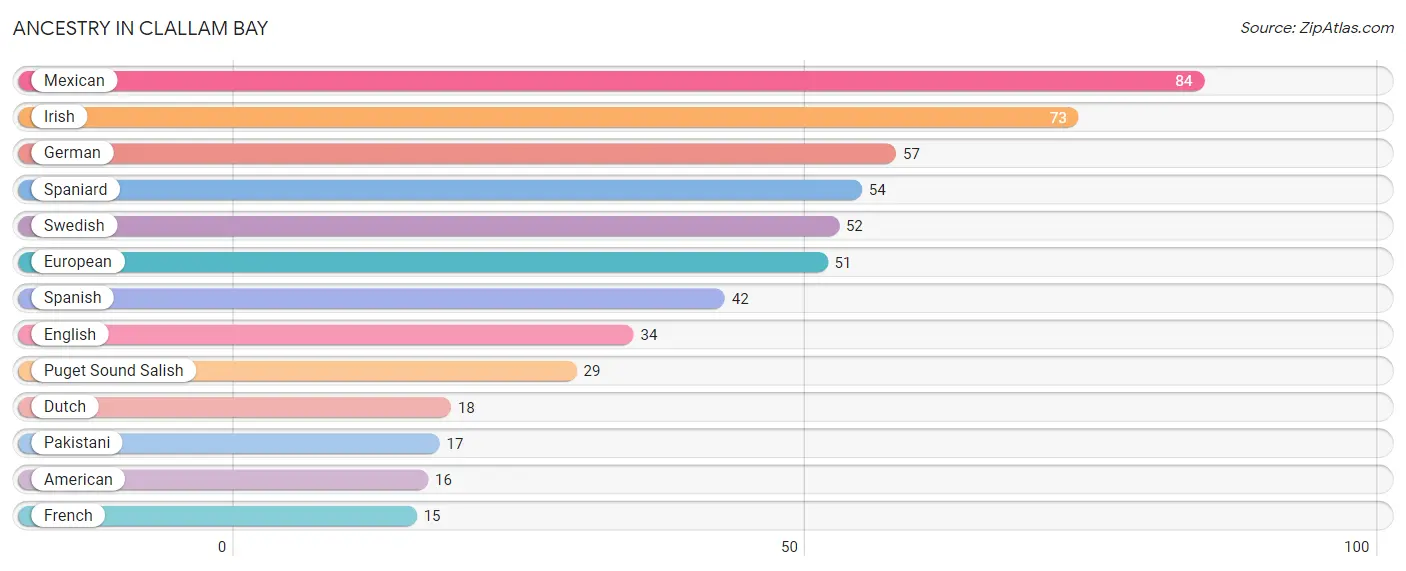
| Ancestry | # Population | % Population |
| American | 16 | 2.2% |
| Dutch | 18 | 2.5% |
| English | 34 | 4.6% |
| European | 51 | 7.0% |
| French | 15 | 2.0% |
| German | 57 | 7.8% |
| Irish | 73 | 10.0% |
| Mexican | 84 | 11.4% |
| Pakistani | 17 | 2.3% |
| Puget Sound Salish | 29 | 4.0% |
| Spaniard | 54 | 7.4% |
| Spanish | 42 | 5.7% |
| Swedish | 52 | 7.1% | View All 13 Rows |
Immigrants in Clallam Bay
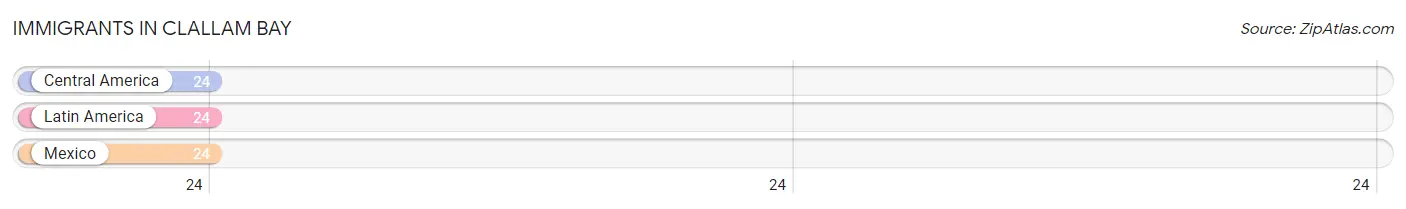
The most numerous immigrant groups reported in Clallam Bay came from Central America (24 | 3.3%), Latin America (24 | 3.3%), and Mexico (24 | 3.3%), together accounting for 9.8% of all Clallam Bay residents.
| Immigration Origin | # Population | % Population |
| Central America | 24 | 3.3% |
| Latin America | 24 | 3.3% |
| Mexico | 24 | 3.3% | View All 3 Rows |
Sex and Age in Clallam Bay
Sex and Age in Clallam Bay
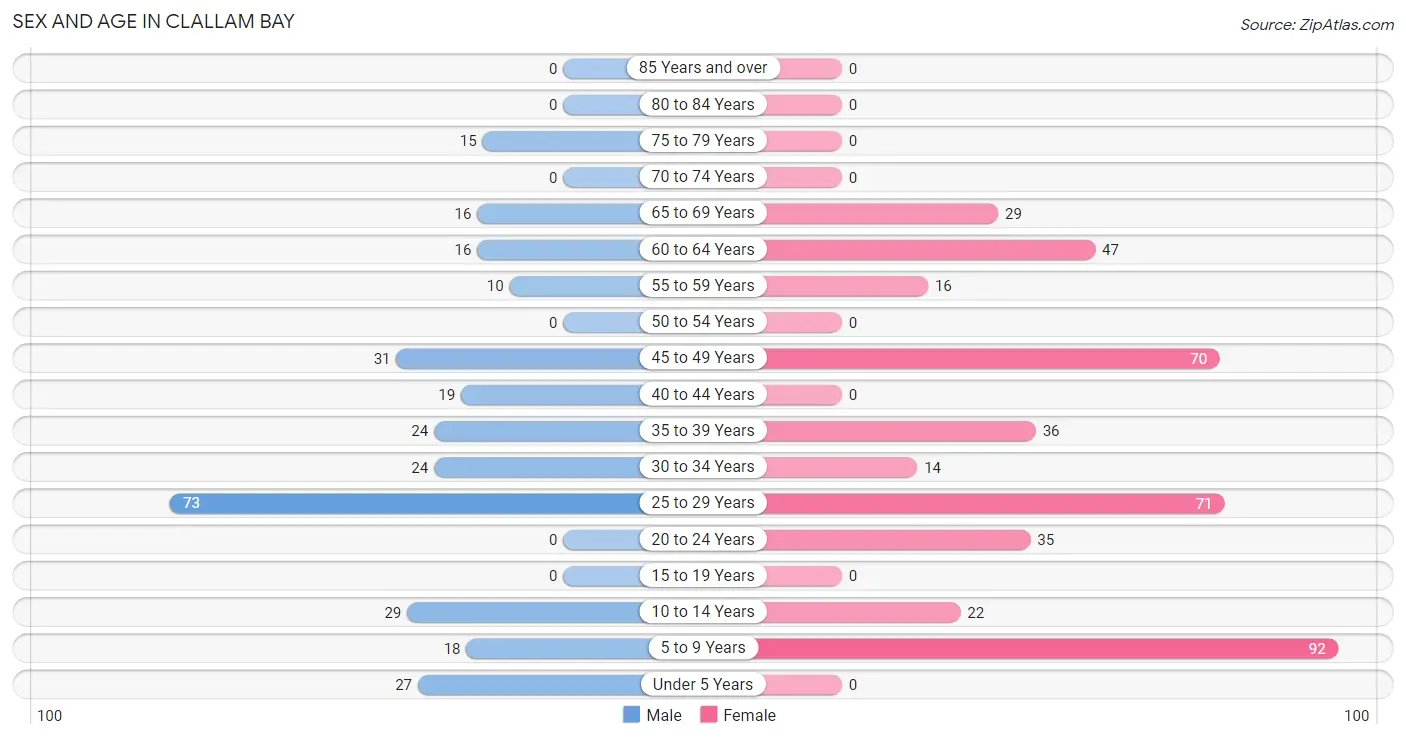
The most populous age groups in Clallam Bay are 25 to 29 Years (73 | 24.2%) for men and 5 to 9 Years (92 | 21.3%) for women.
| Age Bracket | Male | Female |
| Under 5 Years | 27 (8.9%) | 0 (0.0%) |
| 5 to 9 Years | 18 (6.0%) | 92 (21.3%) |
| 10 to 14 Years | 29 (9.6%) | 22 (5.1%) |
| 15 to 19 Years | 0 (0.0%) | 0 (0.0%) |
| 20 to 24 Years | 0 (0.0%) | 35 (8.1%) |
| 25 to 29 Years | 73 (24.2%) | 71 (16.4%) |
| 30 to 34 Years | 24 (8.0%) | 14 (3.2%) |
| 35 to 39 Years | 24 (8.0%) | 36 (8.3%) |
| 40 to 44 Years | 19 (6.3%) | 0 (0.0%) |
| 45 to 49 Years | 31 (10.3%) | 70 (16.2%) |
| 50 to 54 Years | 0 (0.0%) | 0 (0.0%) |
| 55 to 59 Years | 10 (3.3%) | 16 (3.7%) |
| 60 to 64 Years | 16 (5.3%) | 47 (10.9%) |
| 65 to 69 Years | 16 (5.3%) | 29 (6.7%) |
| 70 to 74 Years | 0 (0.0%) | 0 (0.0%) |
| 75 to 79 Years | 15 (5.0%) | 0 (0.0%) |
| 80 to 84 Years | 0 (0.0%) | 0 (0.0%) |
| 85 Years and over | 0 (0.0%) | 0 (0.0%) |
| Total | 302 (100.0%) | 432 (100.0%) |
Families and Households in Clallam Bay
Median Family Size in Clallam Bay
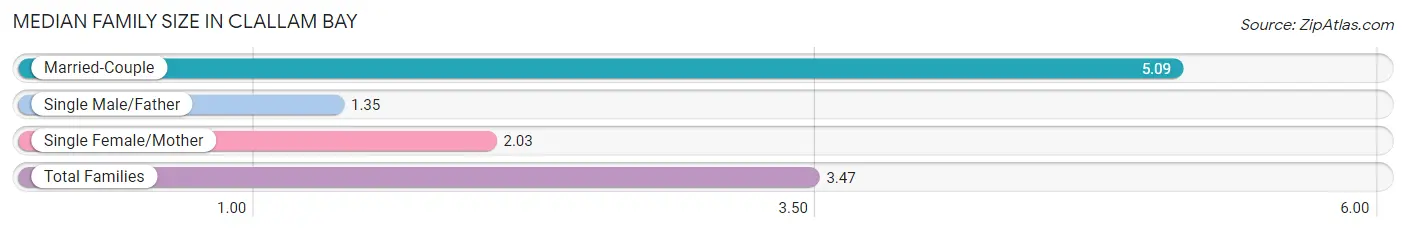
The median family size in Clallam Bay is 3.47 persons per family, with married-couple families (75 | 51.7%) accounting for the largest median family size of 5.09 persons per family. On the other hand, single male/father families (31 | 21.4%) represent the smallest median family size with 1.35 persons per family.
| Family Type | # Families | Family Size |
| Married-Couple | 75 (51.7%) | 5.09 |
| Single Male/Father | 31 (21.4%) | 1.35 |
| Single Female/Mother | 39 (26.9%) | 2.03 |
| Total Families | 145 (100.0%) | 3.47 |
Median Household Size in Clallam Bay
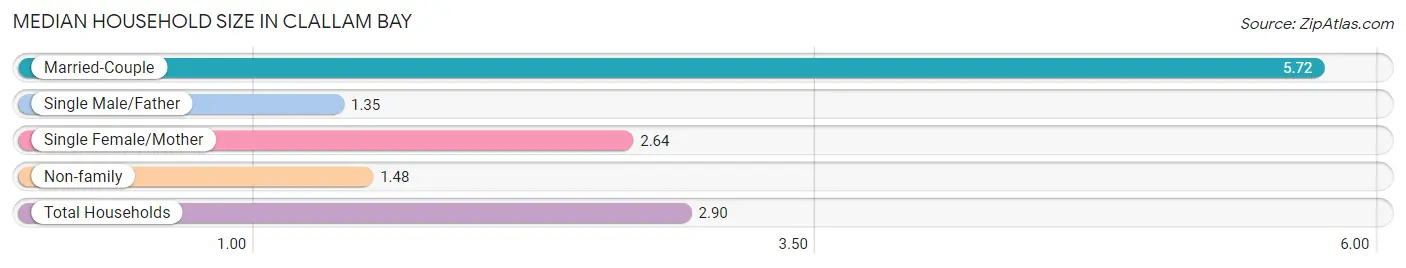
The median household size in Clallam Bay is 2.90 persons per household, with married-couple households (75 | 29.6%) accounting for the largest median household size of 5.72 persons per household. single male/father households (31 | 12.2%) represent the smallest median household size with 1.35 persons per household.
| Household Type | # Households | Household Size |
| Married-Couple | 75 (29.6%) | 5.72 |
| Single Male/Father | 31 (12.2%) | 1.35 |
| Single Female/Mother | 39 (15.4%) | 2.64 |
| Non-family | 108 (42.7%) | 1.48 |
| Total Households | 253 (100.0%) | 2.90 |
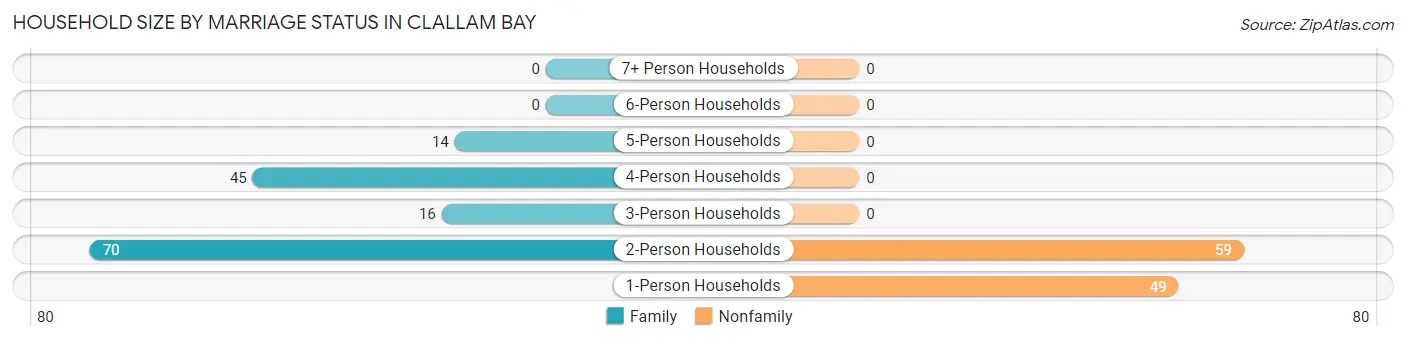
Household Size by Marriage Status in Clallam Bay
Out of a total of 253 households in Clallam Bay, 145 (57.3%) are family households, while 108 (42.7%) are nonfamily households. The most numerous type of family households are 2-person households, comprising 70, and the most common type of nonfamily households are 2-person households, comprising 59.
| Household Size | Family Households | Nonfamily Households |
| 1-Person Households | - | 49 (19.4%) |
| 2-Person Households | 70 (27.7%) | 59 (23.3%) |
| 3-Person Households | 16 (6.3%) | 0 (0.0%) |
| 4-Person Households | 45 (17.8%) | 0 (0.0%) |
| 5-Person Households | 14 (5.5%) | 0 (0.0%) |
| 6-Person Households | 0 (0.0%) | 0 (0.0%) |
| 7+ Person Households | 0 (0.0%) | 0 (0.0%) |
| Total | 145 (57.3%) | 108 (42.7%) |
Female Fertility in Clallam Bay
Fertility by Age in Clallam Bay
| Age Bracket | Women with Births | Births / 1,000 Women |
| 15 to 19 years | 0 (0.0%) | 0.0 |
| 20 to 34 years | 0 (0.0%) | 0.0 |
| 35 to 50 years | 0 (0.0%) | 0.0 |
| Total | 0 (0.0%) | 0.0 |
Fertility by Age by Marriage Status in Clallam Bay
| Age Bracket | Married | Unmarried |
| 15 to 19 years | 0 (0.0%) | 0 (0.0%) |
| 20 to 34 years | 0 (0.0%) | 0 (0.0%) |
| 35 to 50 years | 0 (0.0%) | 0 (0.0%) |
| Total | 0 (0.0%) | 0 (0.0%) |
Fertility by Education in Clallam Bay
| Educational Attainment | Women with Births | Births / 1,000 Women |
| Less than High School | 0 (0.0%) | 0.0 |
| High School Diploma | 0 (0.0%) | 0.0 |
| College or Associate's Degree | 0 (0.0%) | 0.0 |
| Bachelor's Degree | 0 (0.0%) | 0.0 |
| Graduate Degree | 0 (0.0%) | 0.0 |
| Total | 0 (0.0%) | 0.0 |
Fertility by Education by Marriage Status in Clallam Bay
| Educational Attainment | Married | Unmarried |
| Less than High School | 0 (0.0%) | 0 (0.0%) |
| High School Diploma | 0 (0.0%) | 0 (0.0%) |
| College or Associate's Degree | 0 (0.0%) | 0 (0.0%) |
| Bachelor's Degree | 0 (0.0%) | 0 (0.0%) |
| Graduate Degree | 0 (0.0%) | 0 (0.0%) |
| Total | 0 (0.0%) | 0 (0.0%) |
Employment Characteristics in Clallam Bay
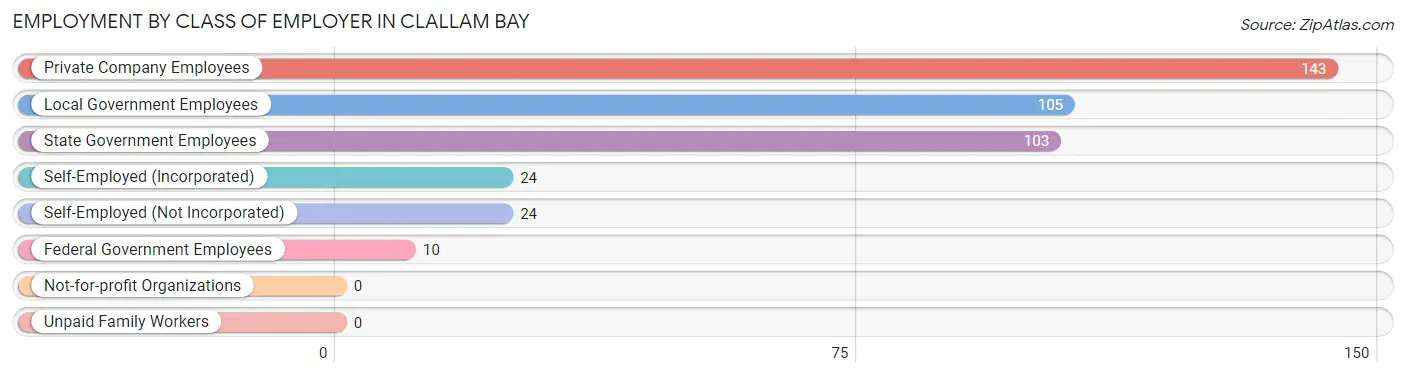
Employment by Class of Employer in Clallam Bay
Among the 409 employed individuals in Clallam Bay, private company employees (143 | 35.0%), local government employees (105 | 25.7%), and state government employees (103 | 25.2%) make up the most common classes of employment.
| Employer Class | # Employees | % Employees |
| Private Company Employees | 143 | 35.0% |
| Self-Employed (Incorporated) | 24 | 5.9% |
| Self-Employed (Not Incorporated) | 24 | 5.9% |
| Not-for-profit Organizations | 0 | 0.0% |
| Local Government Employees | 105 | 25.7% |
| State Government Employees | 103 | 25.2% |
| Federal Government Employees | 10 | 2.4% |
| Unpaid Family Workers | 0 | 0.0% |
| Total | 409 | 100.0% |
Employment Status by Age in Clallam Bay
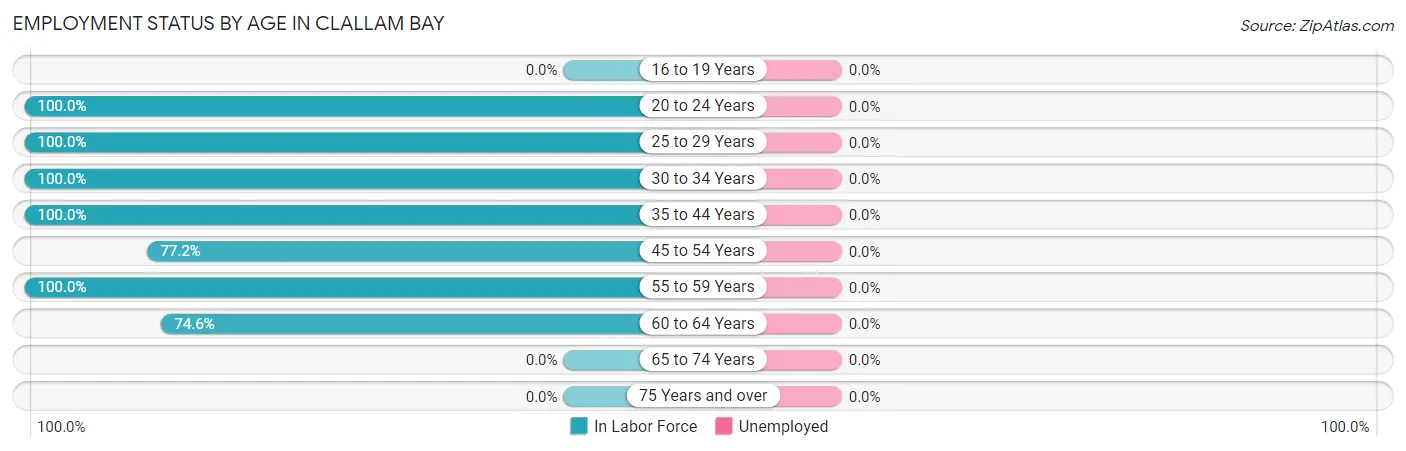
| Age Bracket | In Labor Force | Unemployed |
| 16 to 19 Years | 0 (0.0%) | 0 (0.0%) |
| 20 to 24 Years | 35 (100.0%) | 0 (0.0%) |
| 25 to 29 Years | 144 (100.0%) | 0 (0.0%) |
| 30 to 34 Years | 38 (100.0%) | 0 (0.0%) |
| 35 to 44 Years | 79 (100.0%) | 0 (0.0%) |
| 45 to 54 Years | 78 (77.2%) | 0 (0.0%) |
| 55 to 59 Years | 26 (100.0%) | 0 (0.0%) |
| 60 to 64 Years | 47 (74.6%) | 0 (0.0%) |
| 65 to 74 Years | 0 (0.0%) | 0 (0.0%) |
| 75 Years and over | 0 (0.0%) | 0 (0.0%) |
| Total | 447 (81.9%) | 0 (0.0%) |
Employment Status by Educational Attainment in Clallam Bay
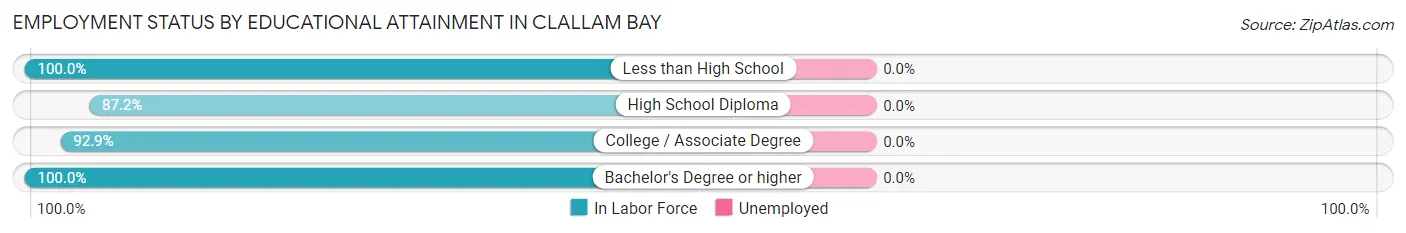
| Educational Attainment | In Labor Force | Unemployed |
| Less than High School | 43 (100.0%) | 0 (0.0%) |
| High School Diploma | 197 (87.2%) | 0 (0.0%) |
| College / Associate Degree | 131 (92.9%) | 0 (0.0%) |
| Bachelor's Degree or higher | 41 (100.0%) | 0 (0.0%) |
| Total | 412 (91.4%) | 0 (0.0%) |
Employment Occupations by Sex in Clallam Bay
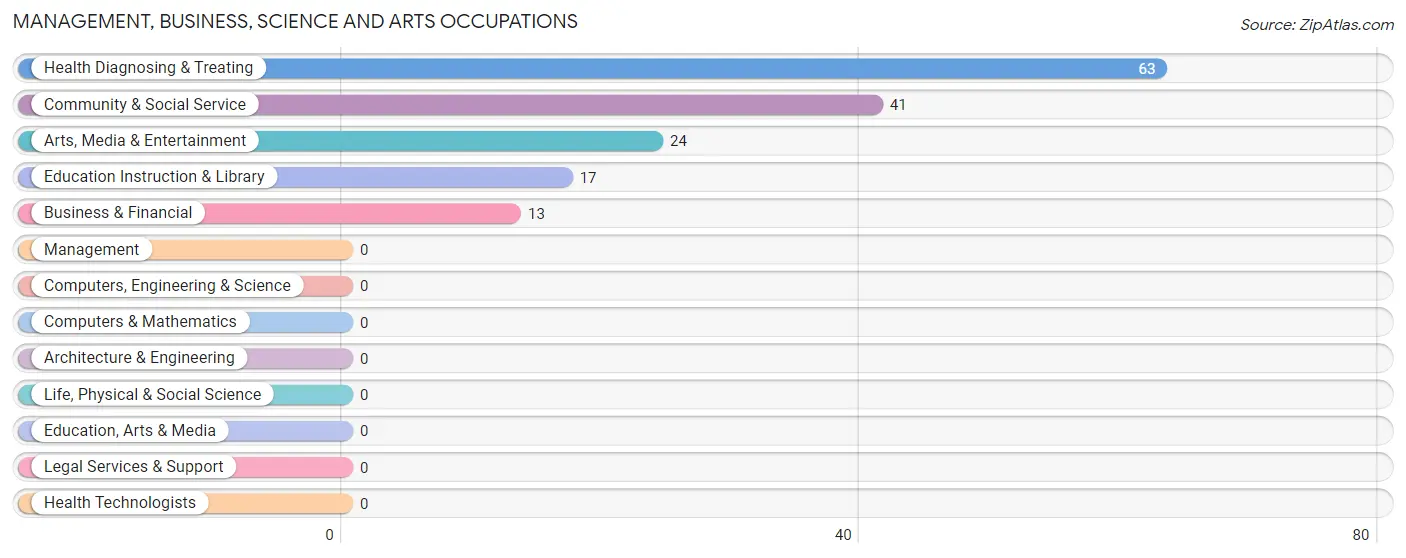
Management, Business, Science and Arts Occupations
The most common Management, Business, Science and Arts occupations in Clallam Bay are Health Diagnosing & Treating (63 | 14.1%), Community & Social Service (41 | 9.2%), Arts, Media & Entertainment (24 | 5.4%), Education Instruction & Library (17 | 3.8%), and Business & Financial (13 | 2.9%).
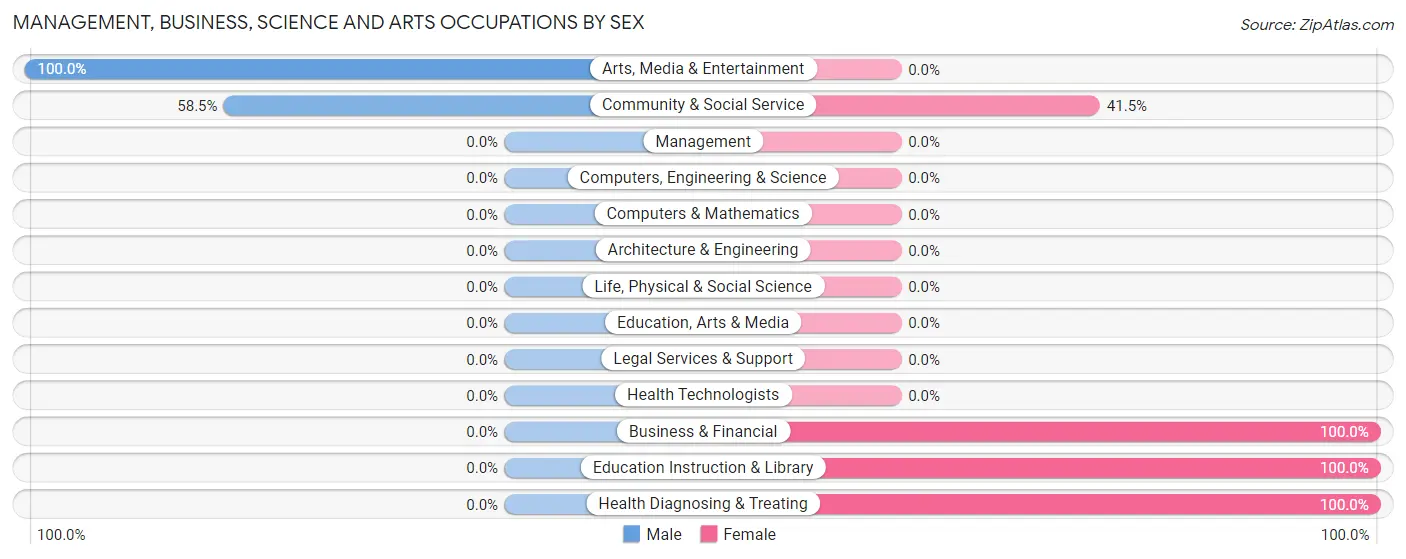
Management, Business, Science and Arts Occupations by Sex
Within the Management, Business, Science and Arts occupations in Clallam Bay, the most male-oriented occupations are Arts, Media & Entertainment (100.0%), and Community & Social Service (58.5%), while the most female-oriented occupations are Business & Financial (100.0%), Education Instruction & Library (100.0%), and Health Diagnosing & Treating (100.0%).
| Occupation | Male | Female |
| Management | 0 (0.0%) | 0 (0.0%) |
| Business & Financial | 0 (0.0%) | 13 (100.0%) |
| Computers, Engineering & Science | 0 (0.0%) | 0 (0.0%) |
| Computers & Mathematics | 0 (0.0%) | 0 (0.0%) |
| Architecture & Engineering | 0 (0.0%) | 0 (0.0%) |
| Life, Physical & Social Science | 0 (0.0%) | 0 (0.0%) |
| Community & Social Service | 24 (58.5%) | 17 (41.5%) |
| Education, Arts & Media | 0 (0.0%) | 0 (0.0%) |
| Legal Services & Support | 0 (0.0%) | 0 (0.0%) |
| Education Instruction & Library | 0 (0.0%) | 17 (100.0%) |
| Arts, Media & Entertainment | 24 (100.0%) | 0 (0.0%) |
| Health Diagnosing & Treating | 0 (0.0%) | 63 (100.0%) |
| Health Technologists | 0 (0.0%) | 0 (0.0%) |
| Total (Category) | 24 (20.5%) | 93 (79.5%) |
| Total (Overall) | 181 (40.5%) | 266 (59.5%) |
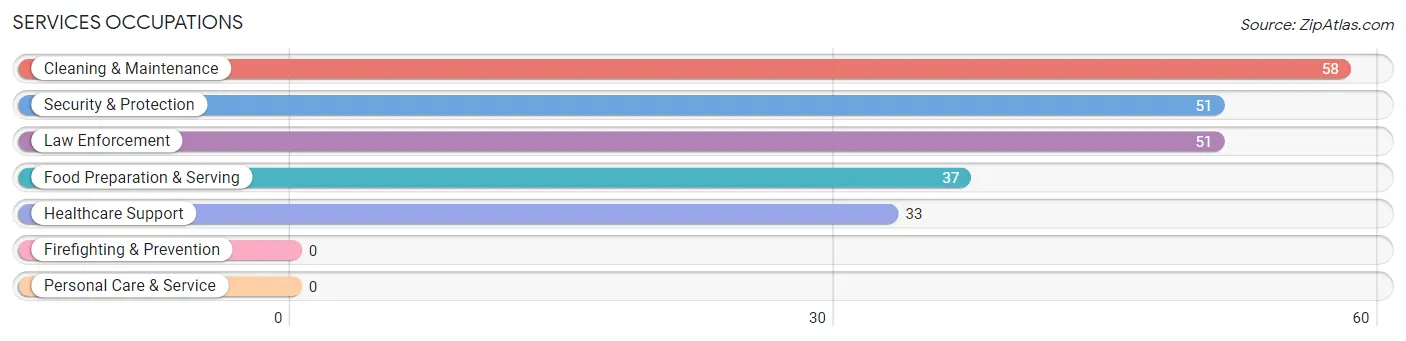
Services Occupations
The most common Services occupations in Clallam Bay are Cleaning & Maintenance (58 | 13.0%), Security & Protection (51 | 11.4%), Law Enforcement (51 | 11.4%), Food Preparation & Serving (37 | 8.3%), and Healthcare Support (33 | 7.4%).
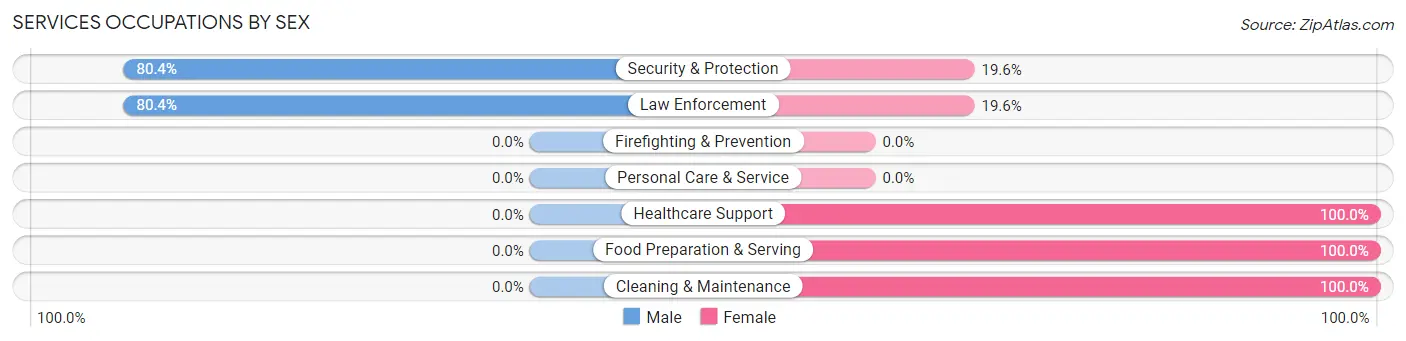
Services Occupations by Sex
Within the Services occupations in Clallam Bay, the most male-oriented occupations are Security & Protection (80.4%), and Law Enforcement (80.4%), while the most female-oriented occupations are Healthcare Support (100.0%), Food Preparation & Serving (100.0%), and Cleaning & Maintenance (100.0%).
| Occupation | Male | Female |
| Healthcare Support | 0 (0.0%) | 33 (100.0%) |
| Security & Protection | 41 (80.4%) | 10 (19.6%) |
| Firefighting & Prevention | 0 (0.0%) | 0 (0.0%) |
| Law Enforcement | 41 (80.4%) | 10 (19.6%) |
| Food Preparation & Serving | 0 (0.0%) | 37 (100.0%) |
| Cleaning & Maintenance | 0 (0.0%) | 58 (100.0%) |
| Personal Care & Service | 0 (0.0%) | 0 (0.0%) |
| Total (Category) | 41 (22.9%) | 138 (77.1%) |
| Total (Overall) | 181 (40.5%) | 266 (59.5%) |
Sales and Office Occupations
Sales and Office Occupations by Sex
| Occupation | Male | Female |
| Sales & Related | 0 (0.0%) | 0 (0.0%) |
| Office & Administration | 0 (0.0%) | 0 (0.0%) |
| Total (Category) | 0 (0.0%) | 0 (0.0%) |
| Total (Overall) | 181 (40.5%) | 266 (59.5%) |
Natural Resources, Construction and Maintenance Occupations
The most common Natural Resources, Construction and Maintenance occupations in Clallam Bay are Installation, Maintenance & Repair (49 | 11.0%), and Farming, Fishing & Forestry (43 | 9.6%).
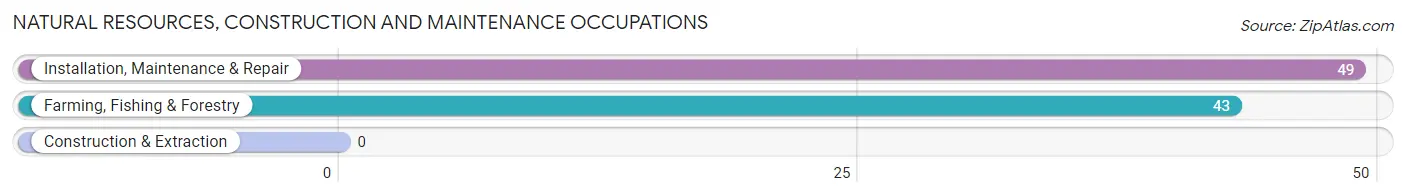
Natural Resources, Construction and Maintenance Occupations by Sex
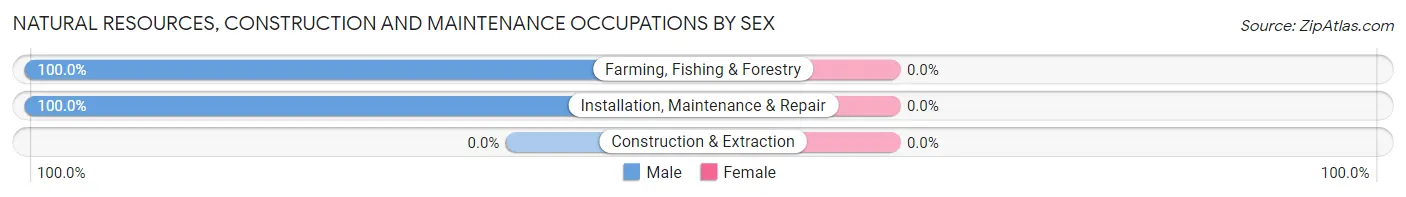
| Occupation | Male | Female |
| Farming, Fishing & Forestry | 43 (100.0%) | 0 (0.0%) |
| Construction & Extraction | 0 (0.0%) | 0 (0.0%) |
| Installation, Maintenance & Repair | 49 (100.0%) | 0 (0.0%) |
| Total (Category) | 92 (100.0%) | 0 (0.0%) |
| Total (Overall) | 181 (40.5%) | 266 (59.5%) |
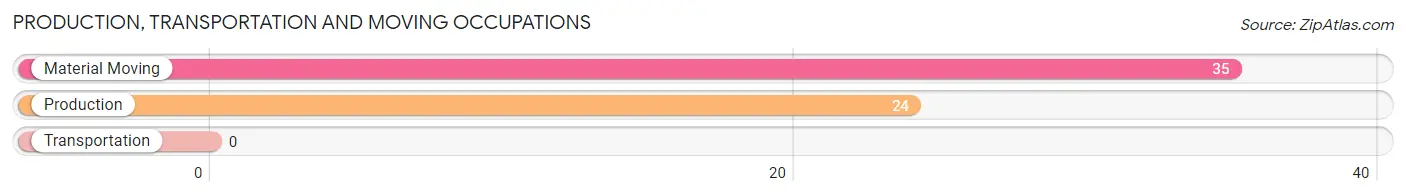
Production, Transportation and Moving Occupations
The most common Production, Transportation and Moving occupations in Clallam Bay are Material Moving (35 | 7.8%), and Production (24 | 5.4%).
Production, Transportation and Moving Occupations by Sex
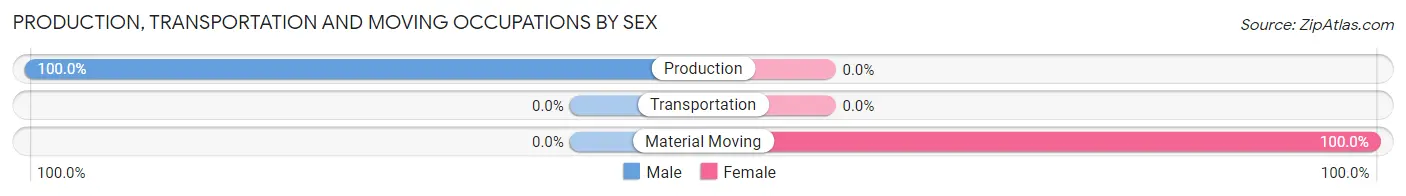
| Occupation | Male | Female |
| Production | 24 (100.0%) | 0 (0.0%) |
| Transportation | 0 (0.0%) | 0 (0.0%) |
| Material Moving | 0 (0.0%) | 35 (100.0%) |
| Total (Category) | 24 (40.7%) | 35 (59.3%) |
| Total (Overall) | 181 (40.5%) | 266 (59.5%) |
Employment Industries by Sex in Clallam Bay
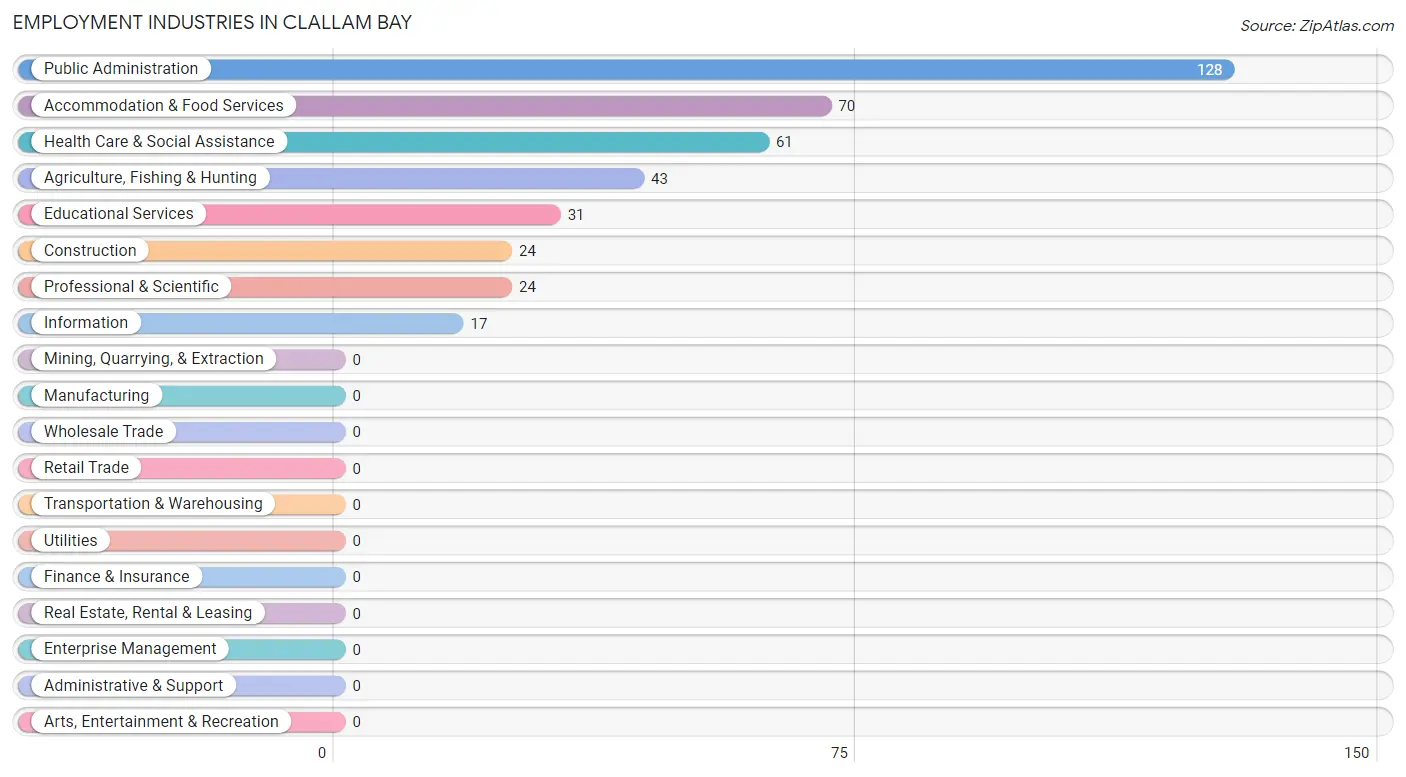
Employment Industries in Clallam Bay
The major employment industries in Clallam Bay include Public Administration (128 | 28.6%), Accommodation & Food Services (70 | 15.7%), Health Care & Social Assistance (61 | 13.7%), Agriculture, Fishing & Hunting (43 | 9.6%), and Educational Services (31 | 6.9%).
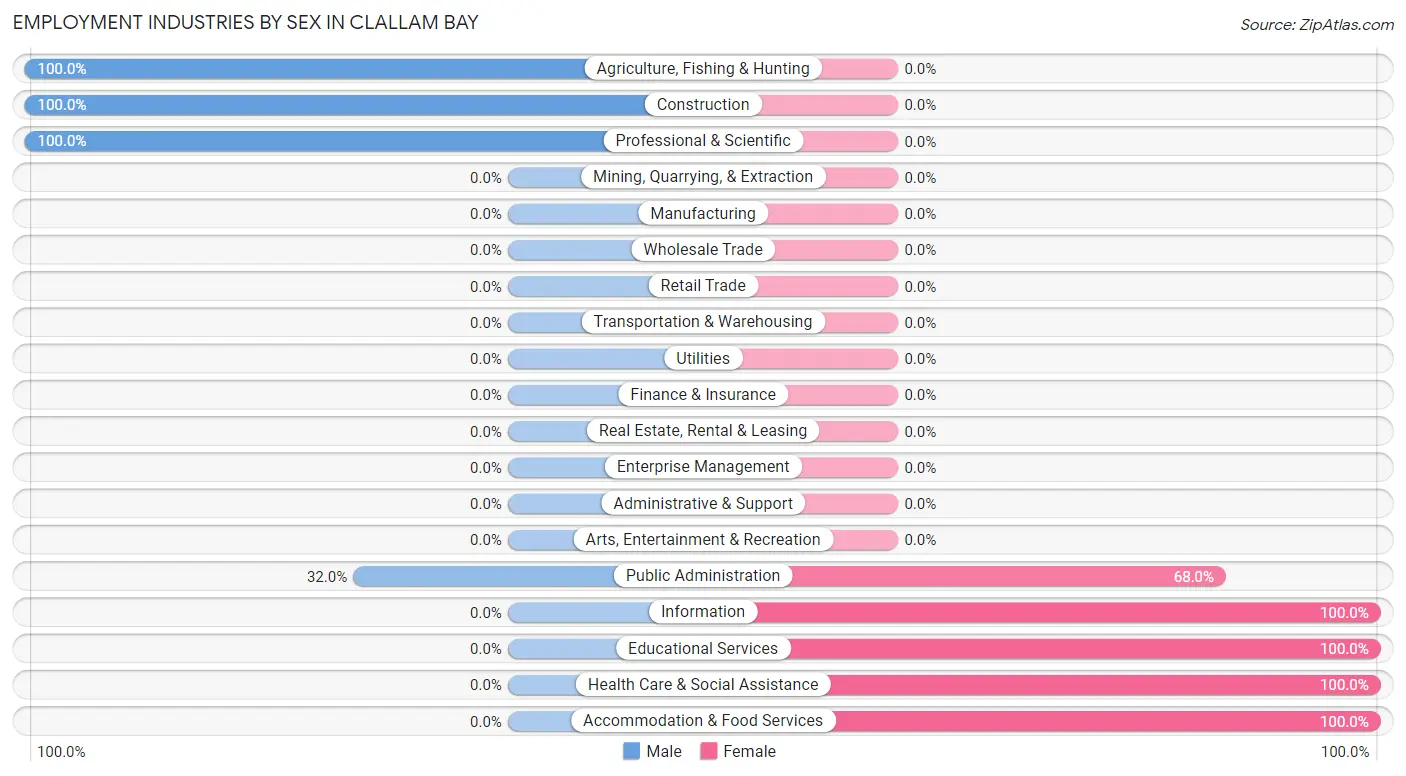
Employment Industries by Sex in Clallam Bay
The Clallam Bay industries that see more men than women are Agriculture, Fishing & Hunting (100.0%), Construction (100.0%), and Professional & Scientific (100.0%), whereas the industries that tend to have a higher number of women are Information (100.0%), Educational Services (100.0%), and Health Care & Social Assistance (100.0%).
| Industry | Male | Female |
| Agriculture, Fishing & Hunting | 43 (100.0%) | 0 (0.0%) |
| Mining, Quarrying, & Extraction | 0 (0.0%) | 0 (0.0%) |
| Construction | 24 (100.0%) | 0 (0.0%) |
| Manufacturing | 0 (0.0%) | 0 (0.0%) |
| Wholesale Trade | 0 (0.0%) | 0 (0.0%) |
| Retail Trade | 0 (0.0%) | 0 (0.0%) |
| Transportation & Warehousing | 0 (0.0%) | 0 (0.0%) |
| Utilities | 0 (0.0%) | 0 (0.0%) |
| Information | 0 (0.0%) | 17 (100.0%) |
| Finance & Insurance | 0 (0.0%) | 0 (0.0%) |
| Real Estate, Rental & Leasing | 0 (0.0%) | 0 (0.0%) |
| Professional & Scientific | 24 (100.0%) | 0 (0.0%) |
| Enterprise Management | 0 (0.0%) | 0 (0.0%) |
| Administrative & Support | 0 (0.0%) | 0 (0.0%) |
| Educational Services | 0 (0.0%) | 31 (100.0%) |
| Health Care & Social Assistance | 0 (0.0%) | 61 (100.0%) |
| Arts, Entertainment & Recreation | 0 (0.0%) | 0 (0.0%) |
| Accommodation & Food Services | 0 (0.0%) | 70 (100.0%) |
| Public Administration | 41 (32.0%) | 87 (68.0%) |
| Total | 181 (40.5%) | 266 (59.5%) |
Education in Clallam Bay
School Enrollment in Clallam Bay
The most common levels of schooling among the 160 students in Clallam Bay are kindergarten (84 | 52.5%), middle school (40 | 25.0%), and elementary school (26 | 16.3%).
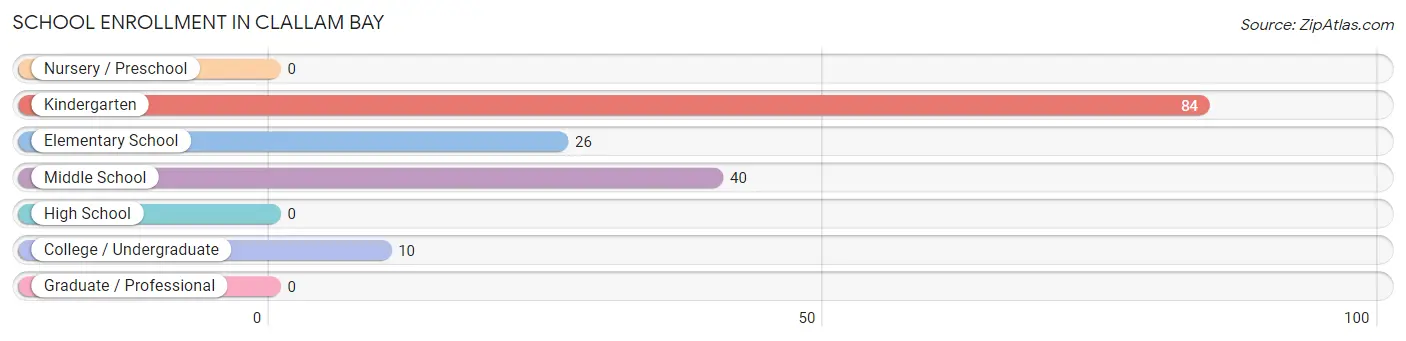
| School Level | # Students | % Students |
| Nursery / Preschool | 0 | 0.0% |
| Kindergarten | 84 | 52.5% |
| Elementary School | 26 | 16.3% |
| Middle School | 40 | 25.0% |
| High School | 0 | 0.0% |
| College / Undergraduate | 10 | 6.2% |
| Graduate / Professional | 0 | 0.0% |
| Total | 160 | 100.0% |
School Enrollment by Age by Funding Source in Clallam Bay
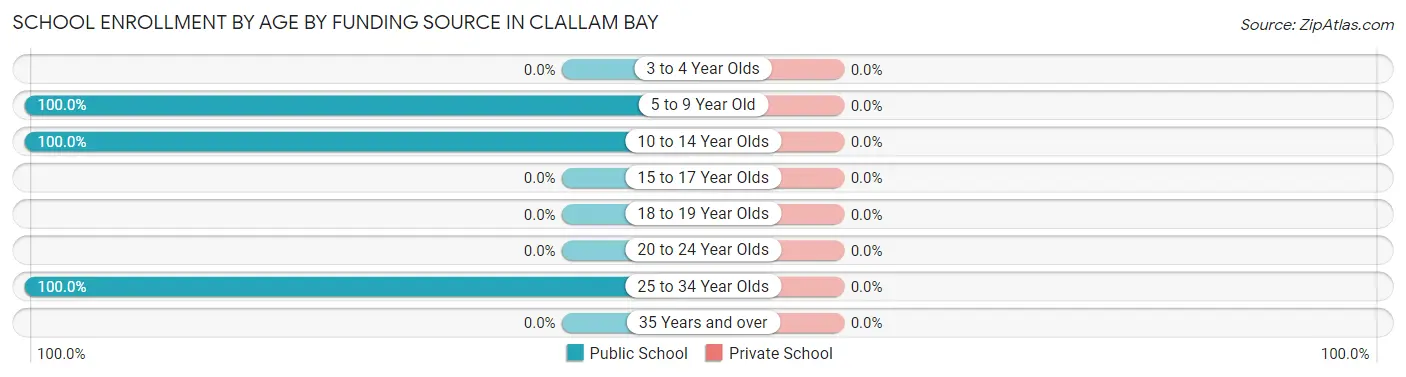
| Age Bracket | Public School | Private School |
| 3 to 4 Year Olds | 0 (0.0%) | 0 (0.0%) |
| 5 to 9 Year Old | 110 (100.0%) | 0 (0.0%) |
| 10 to 14 Year Olds | 40 (100.0%) | 0 (0.0%) |
| 15 to 17 Year Olds | 0 (0.0%) | 0 (0.0%) |
| 18 to 19 Year Olds | 0 (0.0%) | 0 (0.0%) |
| 20 to 24 Year Olds | 0 (0.0%) | 0 (0.0%) |
| 25 to 34 Year Olds | 10 (100.0%) | 0 (0.0%) |
| 35 Years and over | 0 (0.0%) | 0 (0.0%) |
| Total | 160 (100.0%) | 0 (0.0%) |
Educational Attainment by Field of Study in Clallam Bay
Literature & languages (24 | 58.5%), and arts & humanities (17 | 41.5%) are the most common fields of study among 41 individuals in Clallam Bay who have obtained a bachelor's degree or higher.
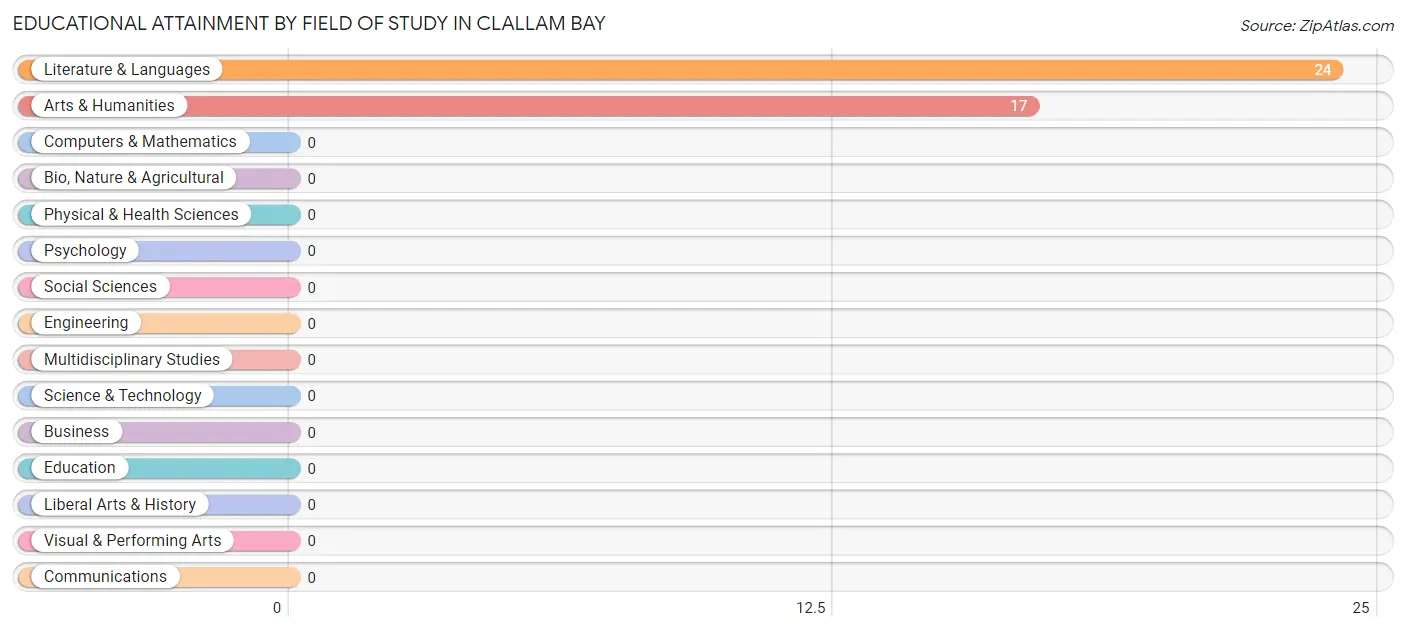
| Field of Study | # Graduates | % Graduates |
| Computers & Mathematics | 0 | 0.0% |
| Bio, Nature & Agricultural | 0 | 0.0% |
| Physical & Health Sciences | 0 | 0.0% |
| Psychology | 0 | 0.0% |
| Social Sciences | 0 | 0.0% |
| Engineering | 0 | 0.0% |
| Multidisciplinary Studies | 0 | 0.0% |
| Science & Technology | 0 | 0.0% |
| Business | 0 | 0.0% |
| Education | 0 | 0.0% |
| Literature & Languages | 24 | 58.5% |
| Liberal Arts & History | 0 | 0.0% |
| Visual & Performing Arts | 0 | 0.0% |
| Communications | 0 | 0.0% |
| Arts & Humanities | 17 | 41.5% |
| Total | 41 | 100.0% |
Transportation & Commute in Clallam Bay
Vehicle Availability by Sex in Clallam Bay
The most prevalent vehicle ownership categories in Clallam Bay are males with 4 vehicles (58, accounting for 35.8%) and females with 4 vehicles (122, making up 23.5%).
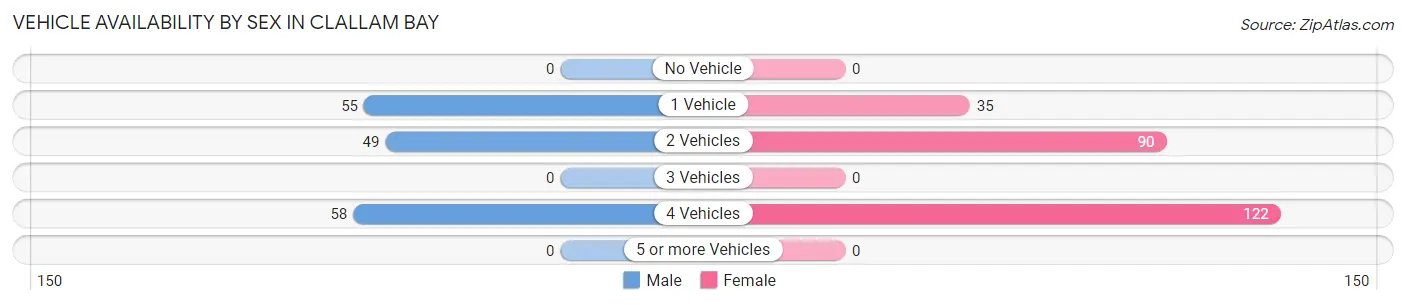
| Vehicles Available | Male | Female |
| No Vehicle | 0 (0.0%) | 0 (0.0%) |
| 1 Vehicle | 55 (34.0%) | 35 (14.2%) |
| 2 Vehicles | 49 (30.2%) | 90 (36.4%) |
| 3 Vehicles | 0 (0.0%) | 0 (0.0%) |
| 4 Vehicles | 58 (35.8%) | 122 (49.4%) |
| 5 or more Vehicles | 0 (0.0%) | 0 (0.0%) |
| Total | 162 (100.0%) | 247 (100.0%) |
Commute Time in Clallam Bay
The most frequently occuring commute durations in Clallam Bay are 5 to 9 minutes (107 commuters, 27.8%), 45 to 59 minutes (91 commuters, 23.6%), and less than 5 minutes (71 commuters, 18.4%).
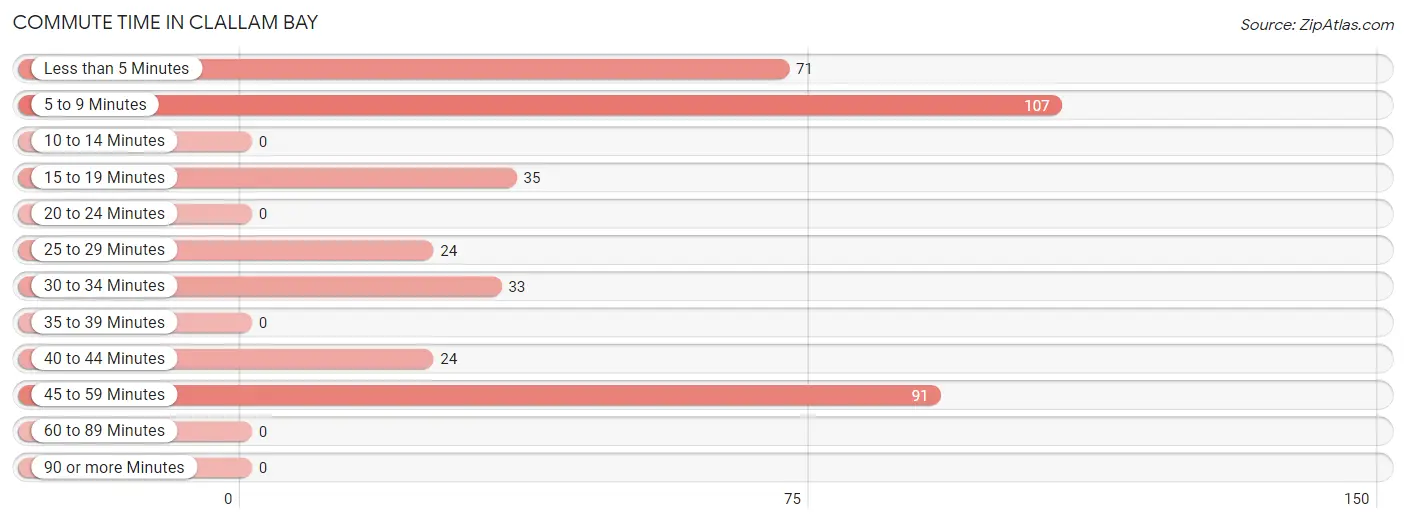
| Commute Time | # Commuters | % Commuters |
| Less than 5 Minutes | 71 | 18.4% |
| 5 to 9 Minutes | 107 | 27.8% |
| 10 to 14 Minutes | 0 | 0.0% |
| 15 to 19 Minutes | 35 | 9.1% |
| 20 to 24 Minutes | 0 | 0.0% |
| 25 to 29 Minutes | 24 | 6.2% |
| 30 to 34 Minutes | 33 | 8.6% |
| 35 to 39 Minutes | 0 | 0.0% |
| 40 to 44 Minutes | 24 | 6.2% |
| 45 to 59 Minutes | 91 | 23.6% |
| 60 to 89 Minutes | 0 | 0.0% |
| 90 or more Minutes | 0 | 0.0% |
Commute Time by Sex in Clallam Bay
The most common commute times in Clallam Bay are 45 to 59 minutes (49 commuters, 35.5%) for males and 5 to 9 minutes (76 commuters, 30.8%) for females.
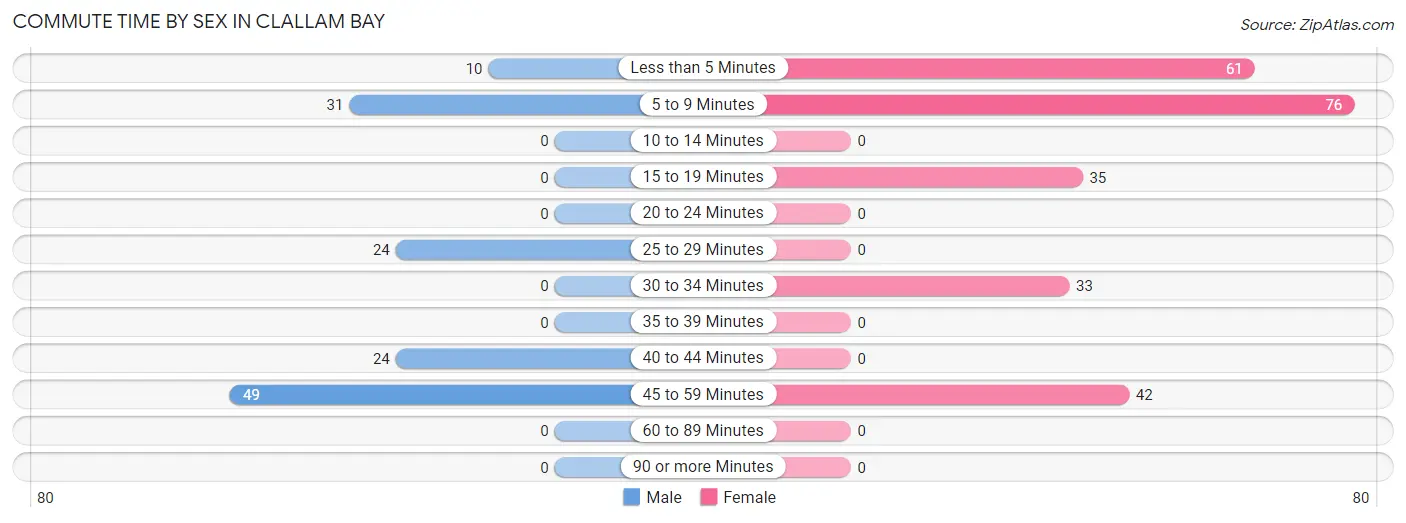
| Commute Time | Male | Female |
| Less than 5 Minutes | 10 (7.2%) | 61 (24.7%) |
| 5 to 9 Minutes | 31 (22.5%) | 76 (30.8%) |
| 10 to 14 Minutes | 0 (0.0%) | 0 (0.0%) |
| 15 to 19 Minutes | 0 (0.0%) | 35 (14.2%) |
| 20 to 24 Minutes | 0 (0.0%) | 0 (0.0%) |
| 25 to 29 Minutes | 24 (17.4%) | 0 (0.0%) |
| 30 to 34 Minutes | 0 (0.0%) | 33 (13.4%) |
| 35 to 39 Minutes | 0 (0.0%) | 0 (0.0%) |
| 40 to 44 Minutes | 24 (17.4%) | 0 (0.0%) |
| 45 to 59 Minutes | 49 (35.5%) | 42 (17.0%) |
| 60 to 89 Minutes | 0 (0.0%) | 0 (0.0%) |
| 90 or more Minutes | 0 (0.0%) | 0 (0.0%) |
Time of Departure to Work by Sex in Clallam Bay
The most frequent times of departure to work in Clallam Bay are 12:00 AM to 4:59 AM (73, 52.9%) for males and 5:00 AM to 5:29 AM (89, 36.0%) for females.
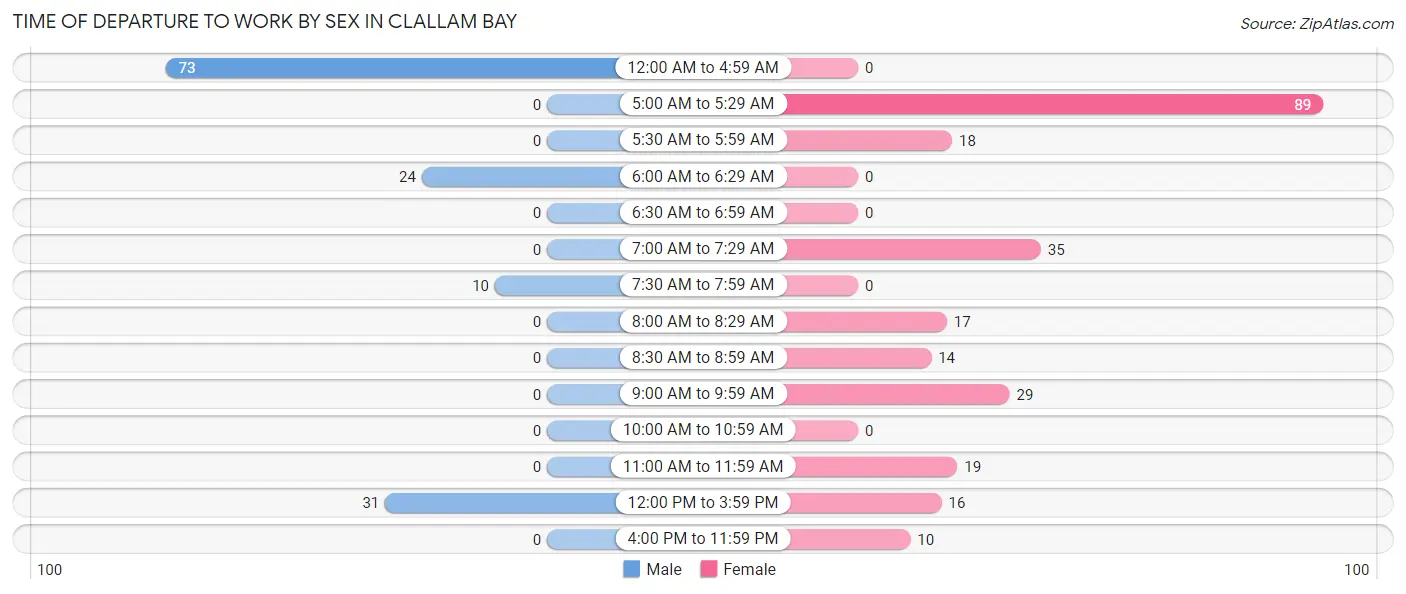
| Time of Departure | Male | Female |
| 12:00 AM to 4:59 AM | 73 (52.9%) | 0 (0.0%) |
| 5:00 AM to 5:29 AM | 0 (0.0%) | 89 (36.0%) |
| 5:30 AM to 5:59 AM | 0 (0.0%) | 18 (7.3%) |
| 6:00 AM to 6:29 AM | 24 (17.4%) | 0 (0.0%) |
| 6:30 AM to 6:59 AM | 0 (0.0%) | 0 (0.0%) |
| 7:00 AM to 7:29 AM | 0 (0.0%) | 35 (14.2%) |
| 7:30 AM to 7:59 AM | 10 (7.2%) | 0 (0.0%) |
| 8:00 AM to 8:29 AM | 0 (0.0%) | 17 (6.9%) |
| 8:30 AM to 8:59 AM | 0 (0.0%) | 14 (5.7%) |
| 9:00 AM to 9:59 AM | 0 (0.0%) | 29 (11.7%) |
| 10:00 AM to 10:59 AM | 0 (0.0%) | 0 (0.0%) |
| 11:00 AM to 11:59 AM | 0 (0.0%) | 19 (7.7%) |
| 12:00 PM to 3:59 PM | 31 (22.5%) | 16 (6.5%) |
| 4:00 PM to 11:59 PM | 0 (0.0%) | 10 (4.1%) |
| Total | 138 (100.0%) | 247 (100.0%) |
Housing Occupancy in Clallam Bay
Occupancy by Ownership in Clallam Bay
Of the total 253 dwellings in Clallam Bay, owner-occupied units account for 108 (42.7%), while renter-occupied units make up 145 (57.3%).
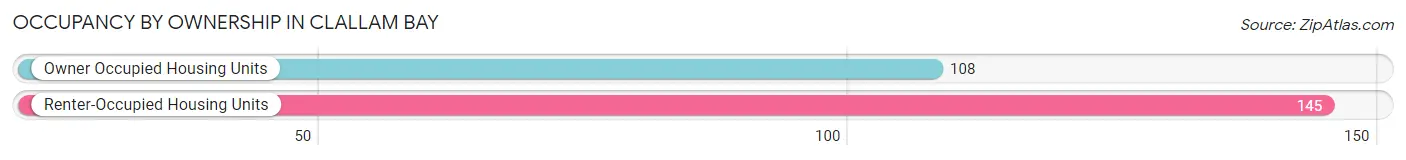
| Occupancy | # Housing Units | % Housing Units |
| Owner Occupied Housing Units | 108 | 42.7% |
| Renter-Occupied Housing Units | 145 | 57.3% |
| Total Occupied Housing Units | 253 | 100.0% |
Occupancy by Household Size in Clallam Bay
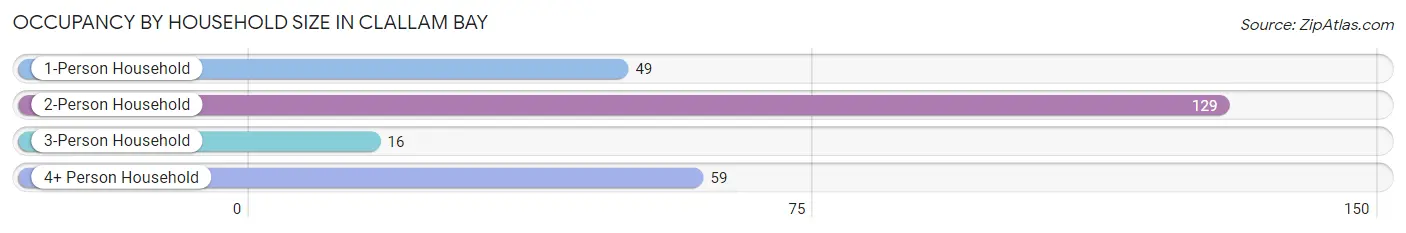
| Household Size | # Housing Units | % Housing Units |
| 1-Person Household | 49 | 19.4% |
| 2-Person Household | 129 | 51.0% |
| 3-Person Household | 16 | 6.3% |
| 4+ Person Household | 59 | 23.3% |
| Total Housing Units | 253 | 100.0% |
Occupancy by Ownership by Household Size in Clallam Bay
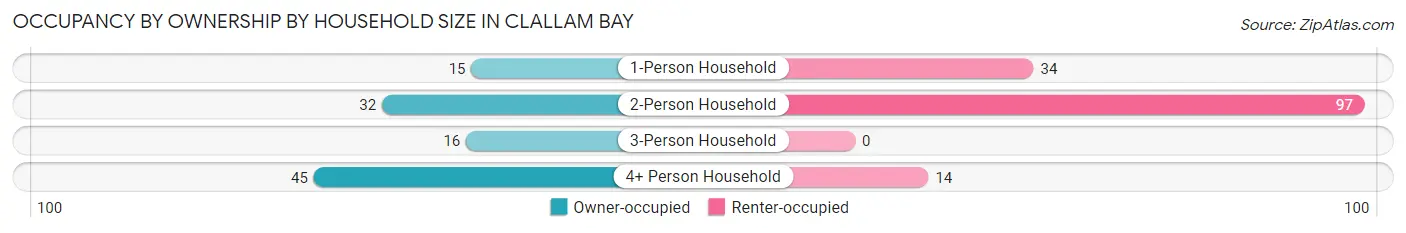
| Household Size | Owner-occupied | Renter-occupied |
| 1-Person Household | 15 (30.6%) | 34 (69.4%) |
| 2-Person Household | 32 (24.8%) | 97 (75.2%) |
| 3-Person Household | 16 (100.0%) | 0 (0.0%) |
| 4+ Person Household | 45 (76.3%) | 14 (23.7%) |
| Total Housing Units | 108 (42.7%) | 145 (57.3%) |
Occupancy by Educational Attainment in Clallam Bay
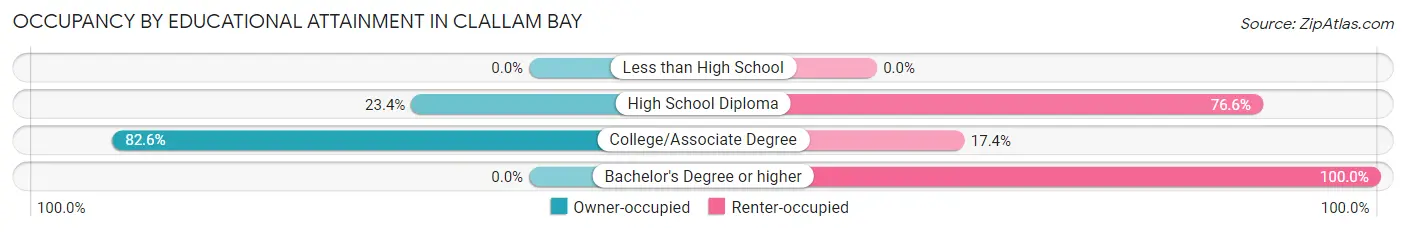
| Household Size | Owner-occupied | Renter-occupied |
| Less than High School | 0 (0.0%) | 0 (0.0%) |
| High School Diploma | 32 (23.4%) | 105 (76.6%) |
| College/Associate Degree | 76 (82.6%) | 16 (17.4%) |
| Bachelor's Degree or higher | 0 (0.0%) | 24 (100.0%) |
Occupancy by Age of Householder in Clallam Bay
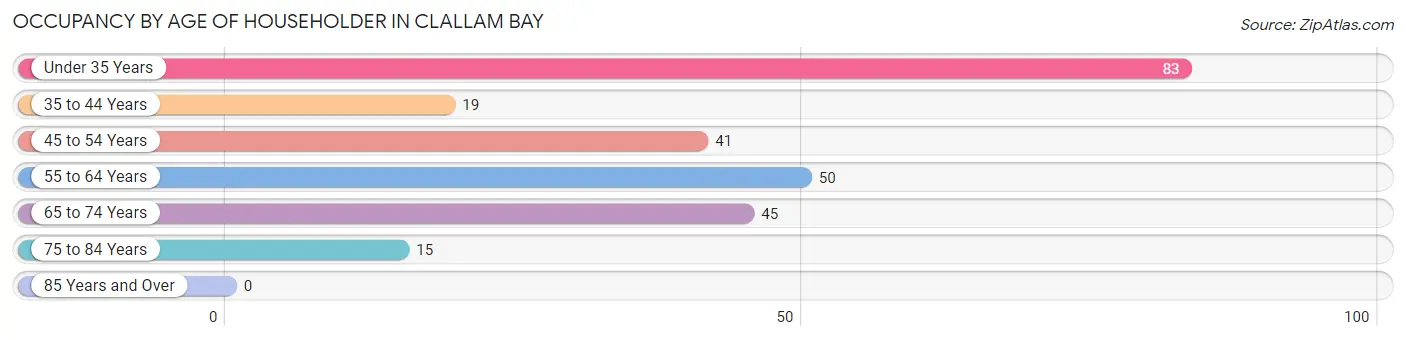
| Age Bracket | # Households | % Households |
| Under 35 Years | 83 | 32.8% |
| 35 to 44 Years | 19 | 7.5% |
| 45 to 54 Years | 41 | 16.2% |
| 55 to 64 Years | 50 | 19.8% |
| 65 to 74 Years | 45 | 17.8% |
| 75 to 84 Years | 15 | 5.9% |
| 85 Years and Over | 0 | 0.0% |
| Total | 253 | 100.0% |
Housing Finances in Clallam Bay
Median Income by Occupancy in Clallam Bay
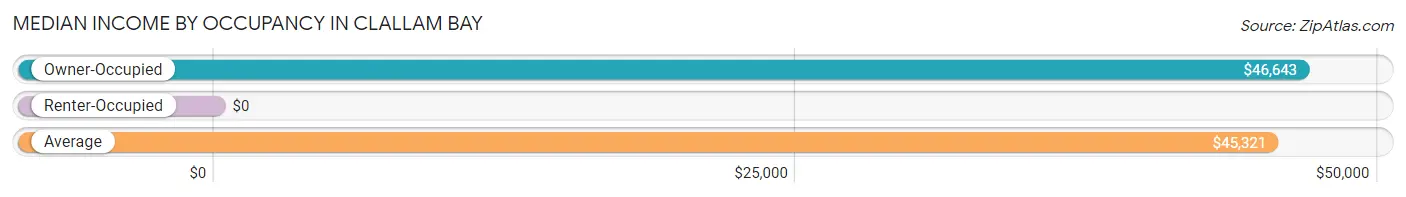
| Occupancy Type | # Households | Median Income |
| Owner-Occupied | 108 (42.7%) | $46,643 |
| Renter-Occupied | 145 (57.3%) | $0 |
| Average | 253 (100.0%) | $45,321 |
Occupancy by Householder Income Bracket in Clallam Bay
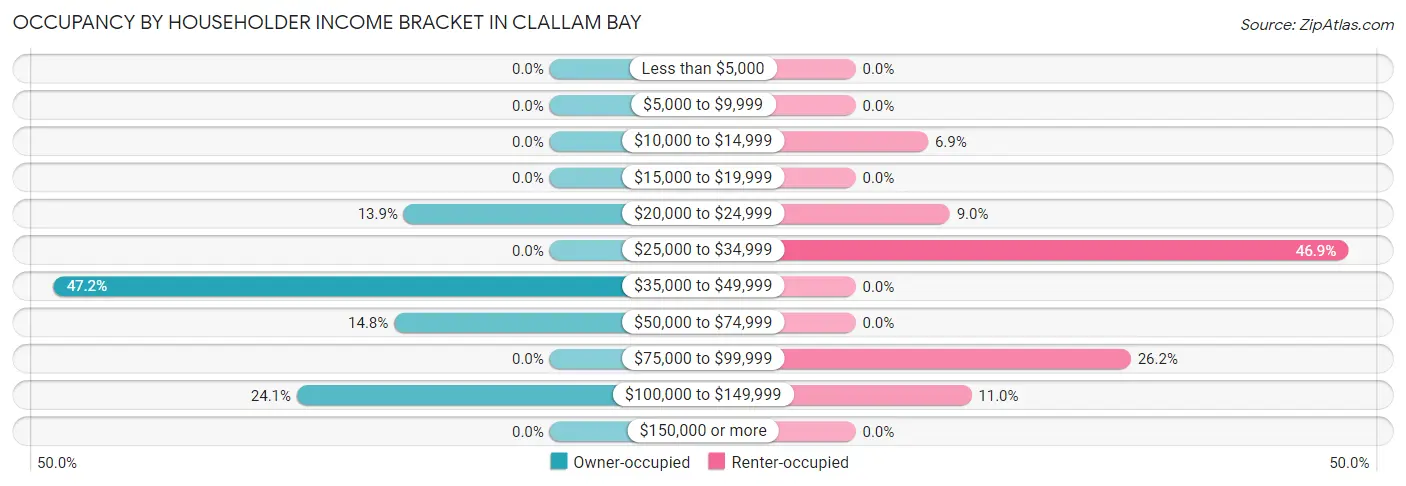
| Income Bracket | Owner-occupied | Renter-occupied |
| Less than $5,000 | 0 (0.0%) | 0 (0.0%) |
| $5,000 to $9,999 | 0 (0.0%) | 0 (0.0%) |
| $10,000 to $14,999 | 0 (0.0%) | 10 (6.9%) |
| $15,000 to $19,999 | 0 (0.0%) | 0 (0.0%) |
| $20,000 to $24,999 | 15 (13.9%) | 13 (9.0%) |
| $25,000 to $34,999 | 0 (0.0%) | 68 (46.9%) |
| $35,000 to $49,999 | 51 (47.2%) | 0 (0.0%) |
| $50,000 to $74,999 | 16 (14.8%) | 0 (0.0%) |
| $75,000 to $99,999 | 0 (0.0%) | 38 (26.2%) |
| $100,000 to $149,999 | 26 (24.1%) | 16 (11.0%) |
| $150,000 or more | 0 (0.0%) | 0 (0.0%) |
| Total | 108 (100.0%) | 145 (100.0%) |
Monthly Housing Cost Tiers in Clallam Bay
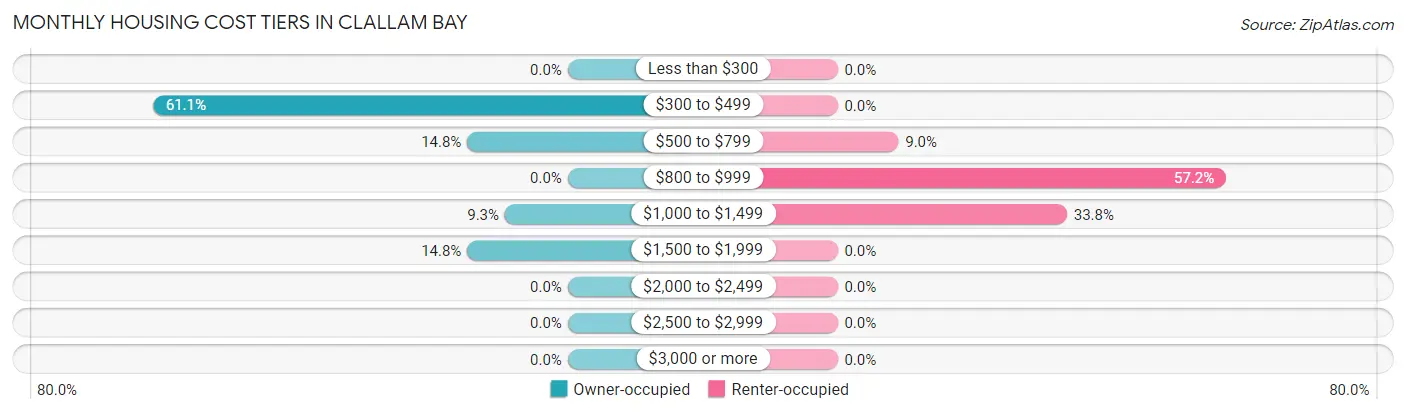
| Monthly Cost | Owner-occupied | Renter-occupied |
| Less than $300 | 0 (0.0%) | 0 (0.0%) |
| $300 to $499 | 66 (61.1%) | 0 (0.0%) |
| $500 to $799 | 16 (14.8%) | 13 (9.0%) |
| $800 to $999 | 0 (0.0%) | 83 (57.2%) |
| $1,000 to $1,499 | 10 (9.3%) | 49 (33.8%) |
| $1,500 to $1,999 | 16 (14.8%) | 0 (0.0%) |
| $2,000 to $2,499 | 0 (0.0%) | 0 (0.0%) |
| $2,500 to $2,999 | 0 (0.0%) | 0 (0.0%) |
| $3,000 or more | 0 (0.0%) | 0 (0.0%) |
| Total | 108 (100.0%) | 145 (100.0%) |
Physical Housing Characteristics in Clallam Bay
Housing Structures in Clallam Bay
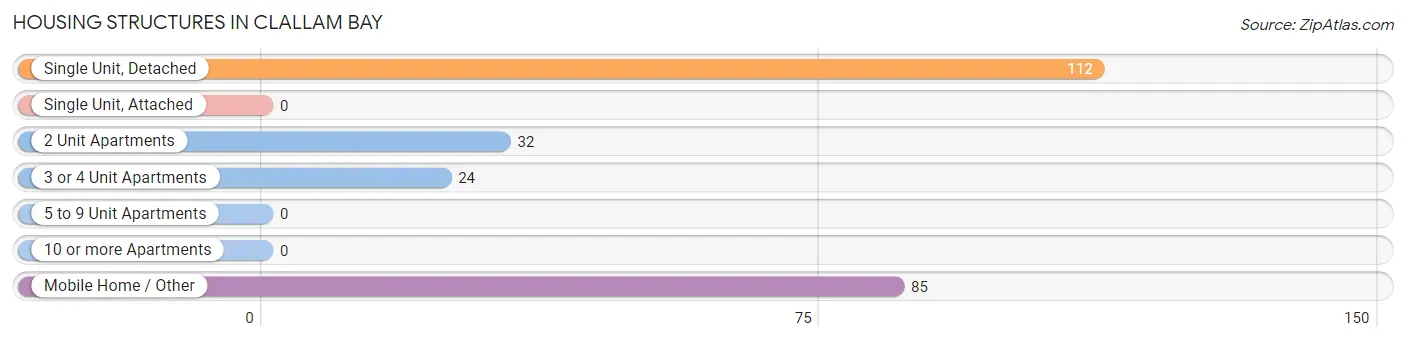
| Structure Type | # Housing Units | % Housing Units |
| Single Unit, Detached | 112 | 44.3% |
| Single Unit, Attached | 0 | 0.0% |
| 2 Unit Apartments | 32 | 12.7% |
| 3 or 4 Unit Apartments | 24 | 9.5% |
| 5 to 9 Unit Apartments | 0 | 0.0% |
| 10 or more Apartments | 0 | 0.0% |
| Mobile Home / Other | 85 | 33.6% |
| Total | 253 | 100.0% |
Housing Structures by Occupancy in Clallam Bay

| Structure Type | Owner-occupied | Renter-occupied |
| Single Unit, Detached | 82 (73.2%) | 30 (26.8%) |
| Single Unit, Attached | 0 (0.0%) | 0 (0.0%) |
| 2 Unit Apartments | 0 (0.0%) | 32 (100.0%) |
| 3 or 4 Unit Apartments | 0 (0.0%) | 24 (100.0%) |
| 5 to 9 Unit Apartments | 0 (0.0%) | 0 (0.0%) |
| 10 or more Apartments | 0 (0.0%) | 0 (0.0%) |
| Mobile Home / Other | 26 (30.6%) | 59 (69.4%) |
| Total | 108 (42.7%) | 145 (57.3%) |
Housing Structures by Number of Rooms in Clallam Bay
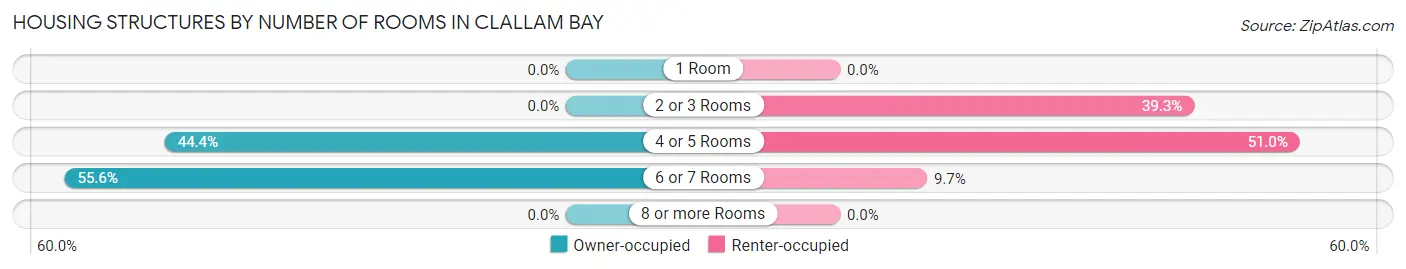
| Number of Rooms | Owner-occupied | Renter-occupied |
| 1 Room | 0 (0.0%) | 0 (0.0%) |
| 2 or 3 Rooms | 0 (0.0%) | 57 (39.3%) |
| 4 or 5 Rooms | 48 (44.4%) | 74 (51.0%) |
| 6 or 7 Rooms | 60 (55.6%) | 14 (9.7%) |
| 8 or more Rooms | 0 (0.0%) | 0 (0.0%) |
| Total | 108 (100.0%) | 145 (100.0%) |
Housing Structure by Heating Type in Clallam Bay
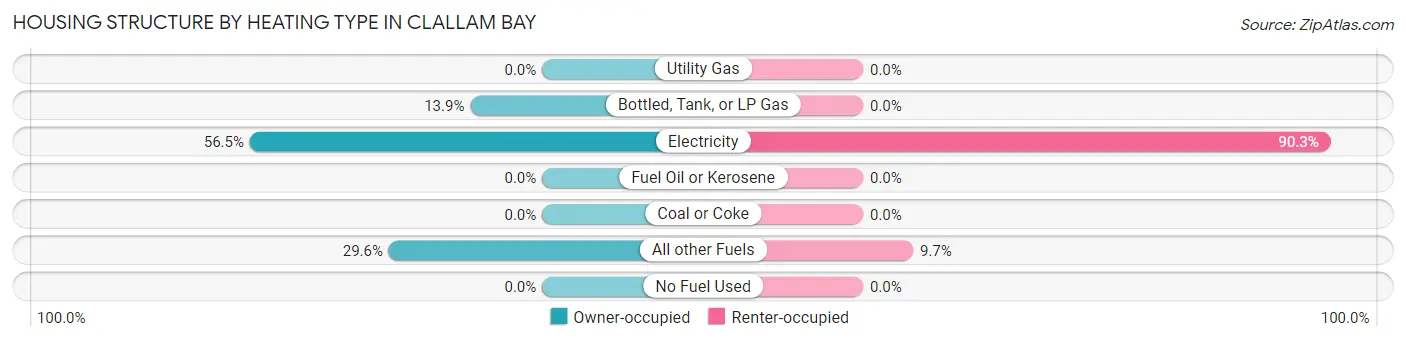
| Heating Type | Owner-occupied | Renter-occupied |
| Utility Gas | 0 (0.0%) | 0 (0.0%) |
| Bottled, Tank, or LP Gas | 15 (13.9%) | 0 (0.0%) |
| Electricity | 61 (56.5%) | 131 (90.3%) |
| Fuel Oil or Kerosene | 0 (0.0%) | 0 (0.0%) |
| Coal or Coke | 0 (0.0%) | 0 (0.0%) |
| All other Fuels | 32 (29.6%) | 14 (9.7%) |
| No Fuel Used | 0 (0.0%) | 0 (0.0%) |
| Total | 108 (100.0%) | 145 (100.0%) |
Household Vehicle Usage in Clallam Bay
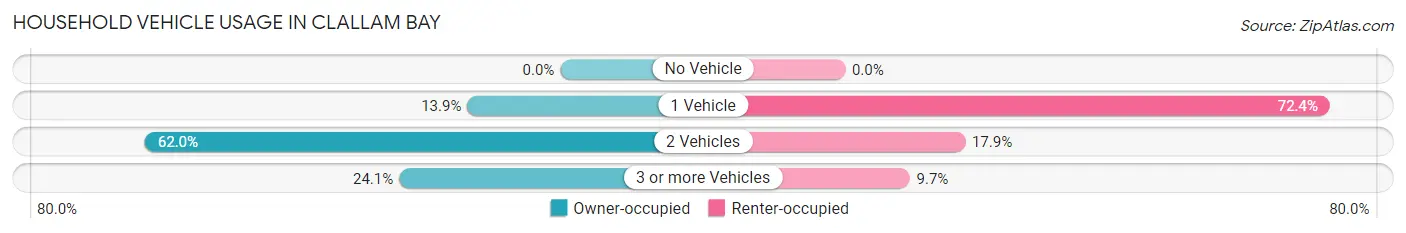
| Vehicles per Household | Owner-occupied | Renter-occupied |
| No Vehicle | 0 (0.0%) | 0 (0.0%) |
| 1 Vehicle | 15 (13.9%) | 105 (72.4%) |
| 2 Vehicles | 67 (62.0%) | 26 (17.9%) |
| 3 or more Vehicles | 26 (24.1%) | 14 (9.7%) |
| Total | 108 (100.0%) | 145 (100.0%) |
Real Estate & Mortgages in Clallam Bay
Real Estate and Mortgage Overview in Clallam Bay
| Characteristic | Without Mortgage | With Mortgage |
| Housing Units | 82 | 26 |
| Median Property Value | $225,500 | $0 |
| Median Household Income | $45,714 | $0 |
| Monthly Housing Costs | $462 | $0 |
| Real Estate Taxes | $2,500 | $0 |
Property Value by Mortgage Status in Clallam Bay
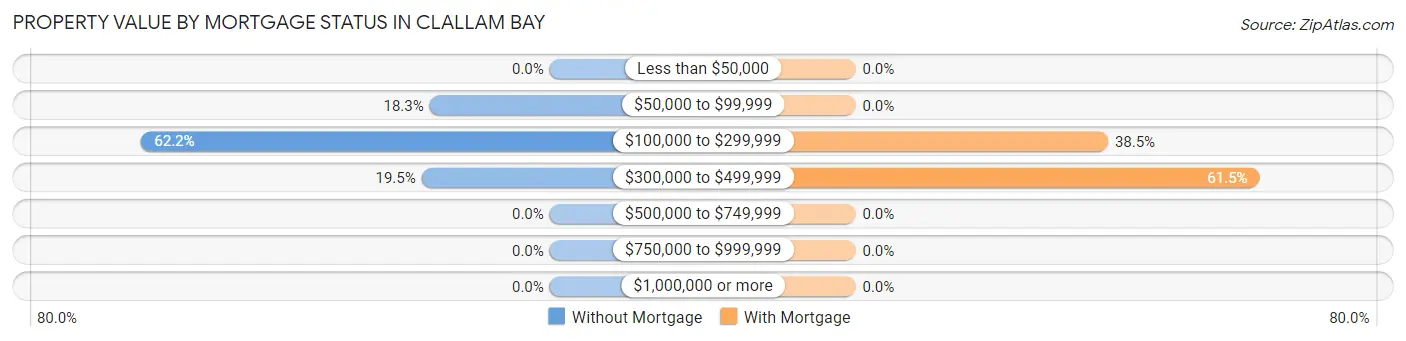
| Property Value | Without Mortgage | With Mortgage |
| Less than $50,000 | 0 (0.0%) | 0 (0.0%) |
| $50,000 to $99,999 | 15 (18.3%) | 0 (0.0%) |
| $100,000 to $299,999 | 51 (62.2%) | 10 (38.5%) |
| $300,000 to $499,999 | 16 (19.5%) | 16 (61.5%) |
| $500,000 to $749,999 | 0 (0.0%) | 0 (0.0%) |
| $750,000 to $999,999 | 0 (0.0%) | 0 (0.0%) |
| $1,000,000 or more | 0 (0.0%) | 0 (0.0%) |
| Total | 82 (100.0%) | 26 (100.0%) |
Household Income by Mortgage Status in Clallam Bay
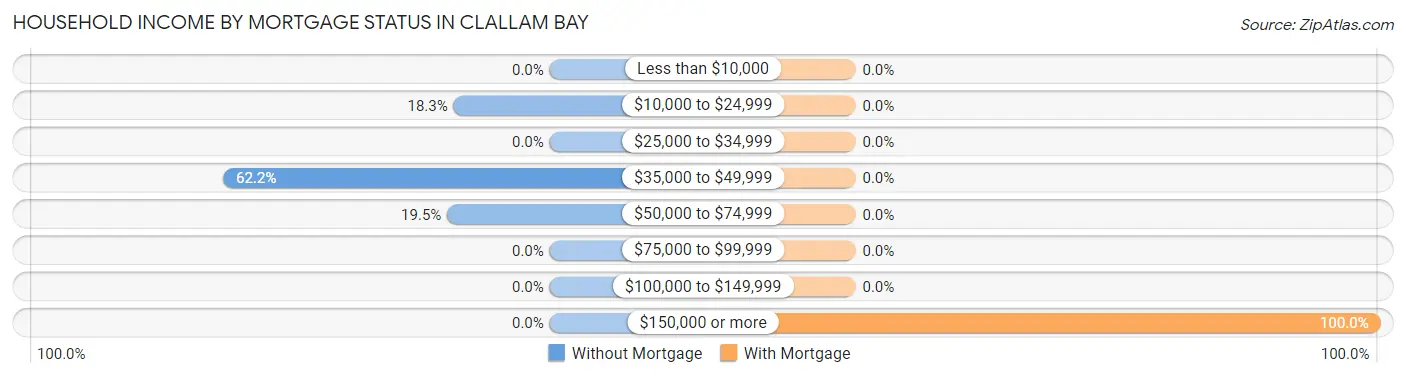
| Household Income | Without Mortgage | With Mortgage |
| Less than $10,000 | 0 (0.0%) | 0 (0.0%) |
| $10,000 to $24,999 | 15 (18.3%) | 0 (0.0%) |
| $25,000 to $34,999 | 0 (0.0%) | 0 (0.0%) |
| $35,000 to $49,999 | 51 (62.2%) | 0 (0.0%) |
| $50,000 to $74,999 | 16 (19.5%) | 0 (0.0%) |
| $75,000 to $99,999 | 0 (0.0%) | 0 (0.0%) |
| $100,000 to $149,999 | 0 (0.0%) | 0 (0.0%) |
| $150,000 or more | 0 (0.0%) | 26 (100.0%) |
| Total | 82 (100.0%) | 26 (100.0%) |
Property Value to Household Income Ratio in Clallam Bay
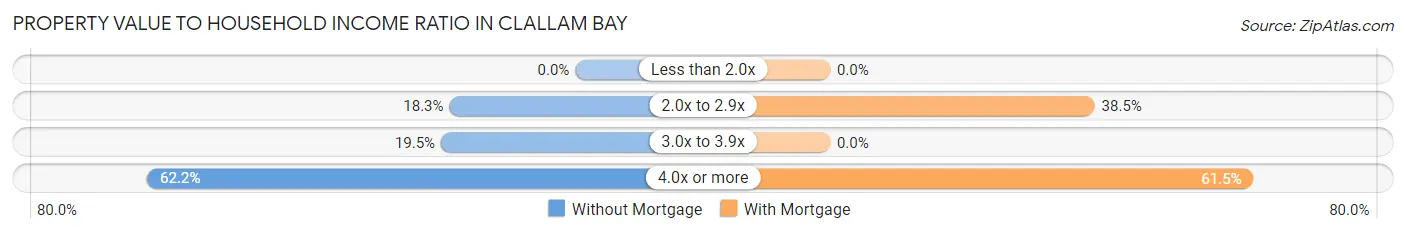
| Value-to-Income Ratio | Without Mortgage | With Mortgage |
| Less than 2.0x | 0 (0.0%) | 0 (0.0%) |
| 2.0x to 2.9x | 15 (18.3%) | 10 (38.5%) |
| 3.0x to 3.9x | 16 (19.5%) | 0 (0.0%) |
| 4.0x or more | 51 (62.2%) | 16 (61.5%) |
| Total | 82 (100.0%) | 26 (100.0%) |
Real Estate Taxes by Mortgage Status in Clallam Bay
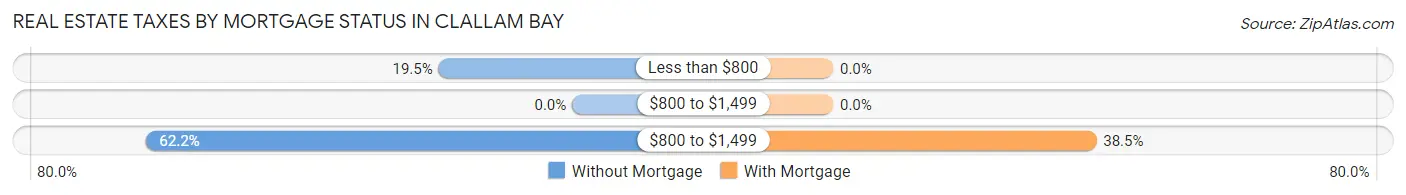
| Property Taxes | Without Mortgage | With Mortgage |
| Less than $800 | 16 (19.5%) | 0 (0.0%) |
| $800 to $1,499 | 0 (0.0%) | 0 (0.0%) |
| $800 to $1,499 | 51 (62.2%) | 10 (38.5%) |
| Total | 82 (100.0%) | 26 (100.0%) |
Health & Disability in Clallam Bay
Health Insurance Coverage by Age in Clallam Bay
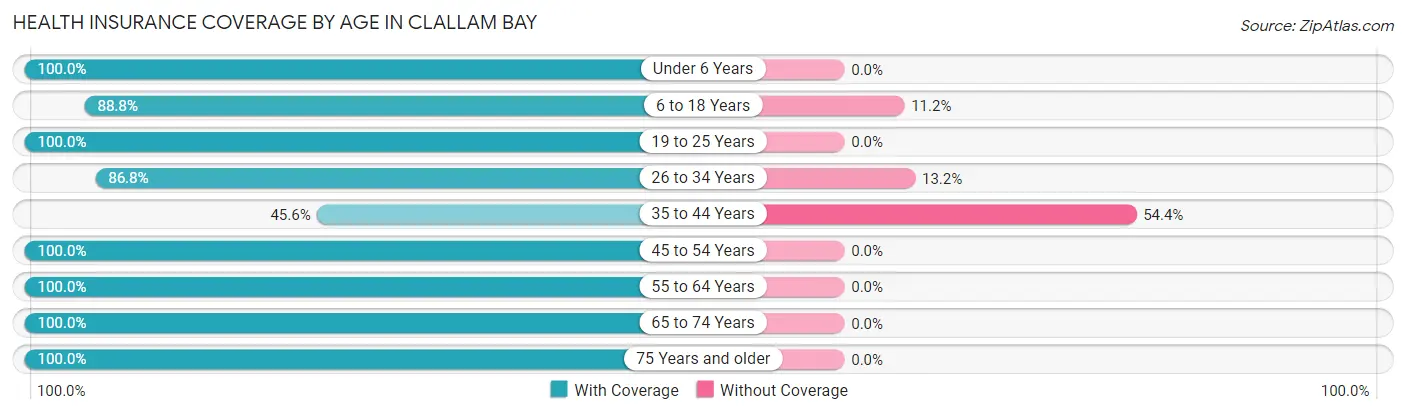
| Age Bracket | With Coverage | Without Coverage |
| Under 6 Years | 27 (100.0%) | 0 (0.0%) |
| 6 to 18 Years | 143 (88.8%) | 18 (11.2%) |
| 19 to 25 Years | 35 (100.0%) | 0 (0.0%) |
| 26 to 34 Years | 158 (86.8%) | 24 (13.2%) |
| 35 to 44 Years | 36 (45.6%) | 43 (54.4%) |
| 45 to 54 Years | 101 (100.0%) | 0 (0.0%) |
| 55 to 64 Years | 89 (100.0%) | 0 (0.0%) |
| 65 to 74 Years | 45 (100.0%) | 0 (0.0%) |
| 75 Years and older | 15 (100.0%) | 0 (0.0%) |
| Total | 649 (88.4%) | 85 (11.6%) |
Health Insurance Coverage by Citizenship Status in Clallam Bay
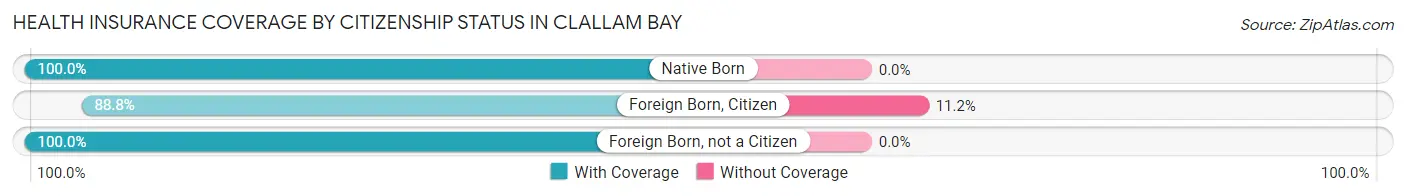
| Citizenship Status | With Coverage | Without Coverage |
| Native Born | 27 (100.0%) | 0 (0.0%) |
| Foreign Born, Citizen | 143 (88.8%) | 18 (11.2%) |
| Foreign Born, not a Citizen | 35 (100.0%) | 0 (0.0%) |
Health Insurance Coverage by Household Income in Clallam Bay
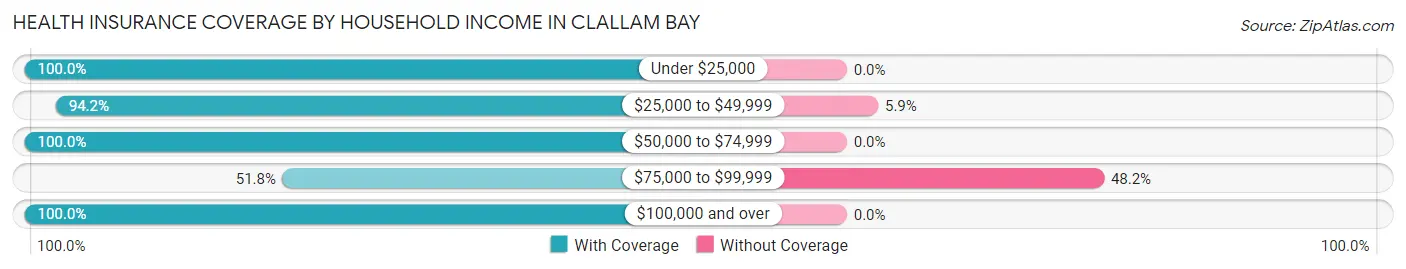
| Household Income | With Coverage | Without Coverage |
| Under $25,000 | 59 (100.0%) | 0 (0.0%) |
| $25,000 to $49,999 | 306 (94.2%) | 19 (5.9%) |
| $50,000 to $74,999 | 59 (100.0%) | 0 (0.0%) |
| $75,000 to $99,999 | 71 (51.8%) | 66 (48.2%) |
| $100,000 and over | 154 (100.0%) | 0 (0.0%) |
Public vs Private Health Insurance Coverage by Age in Clallam Bay
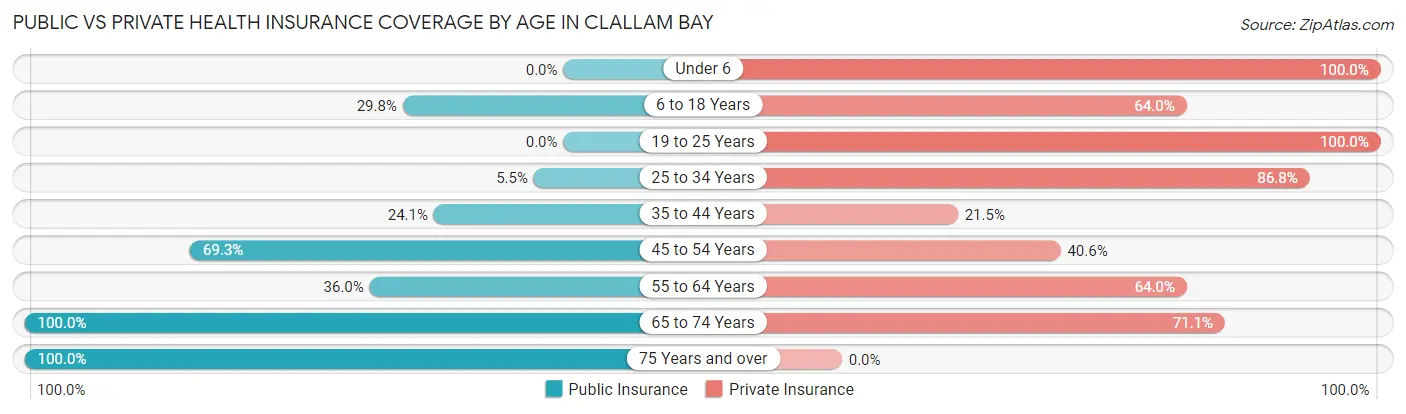
| Age Bracket | Public Insurance | Private Insurance |
| Under 6 | 0 (0.0%) | 27 (100.0%) |
| 6 to 18 Years | 48 (29.8%) | 103 (64.0%) |
| 19 to 25 Years | 0 (0.0%) | 35 (100.0%) |
| 25 to 34 Years | 10 (5.5%) | 158 (86.8%) |
| 35 to 44 Years | 19 (24.0%) | 17 (21.5%) |
| 45 to 54 Years | 70 (69.3%) | 41 (40.6%) |
| 55 to 64 Years | 32 (36.0%) | 57 (64.0%) |
| 65 to 74 Years | 45 (100.0%) | 32 (71.1%) |
| 75 Years and over | 15 (100.0%) | 0 (0.0%) |
| Total | 239 (32.6%) | 470 (64.0%) |
Disability Status by Sex by Age in Clallam Bay
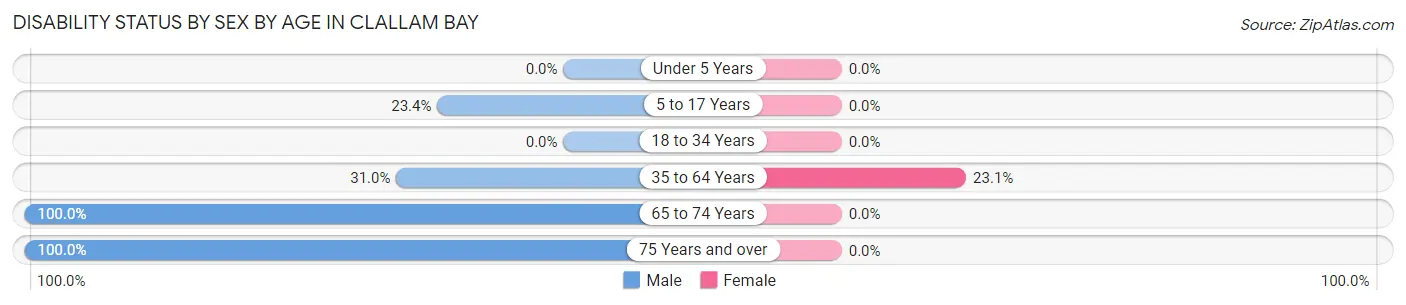
| Age Bracket | Male | Female |
| Under 5 Years | 0 (0.0%) | 0 (0.0%) |
| 5 to 17 Years | 11 (23.4%) | 0 (0.0%) |
| 18 to 34 Years | 0 (0.0%) | 0 (0.0%) |
| 35 to 64 Years | 31 (31.0%) | 39 (23.1%) |
| 65 to 74 Years | 16 (100.0%) | 0 (0.0%) |
| 75 Years and over | 15 (100.0%) | 0 (0.0%) |
Disability Class by Sex by Age in Clallam Bay
Disability Class: Hearing Difficulty
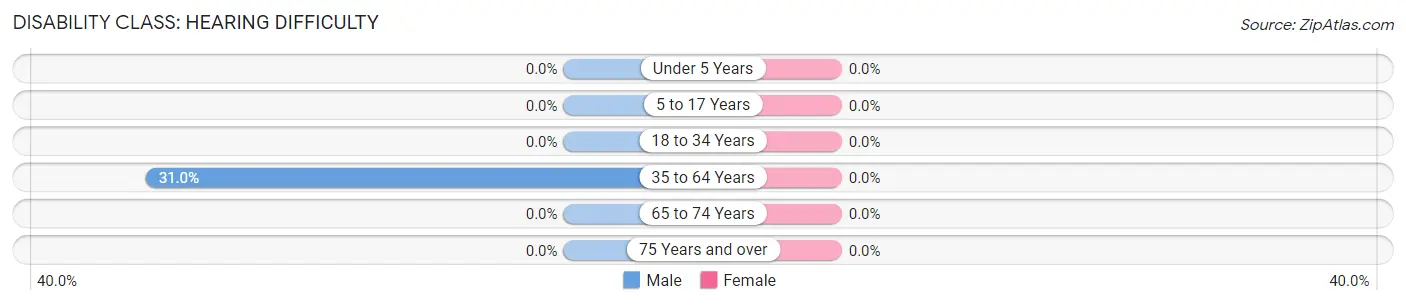
| Age Bracket | Male | Female |
| Under 5 Years | 0 (0.0%) | 0 (0.0%) |
| 5 to 17 Years | 0 (0.0%) | 0 (0.0%) |
| 18 to 34 Years | 0 (0.0%) | 0 (0.0%) |
| 35 to 64 Years | 31 (31.0%) | 0 (0.0%) |
| 65 to 74 Years | 0 (0.0%) | 0 (0.0%) |
| 75 Years and over | 0 (0.0%) | 0 (0.0%) |
Disability Class: Vision Difficulty
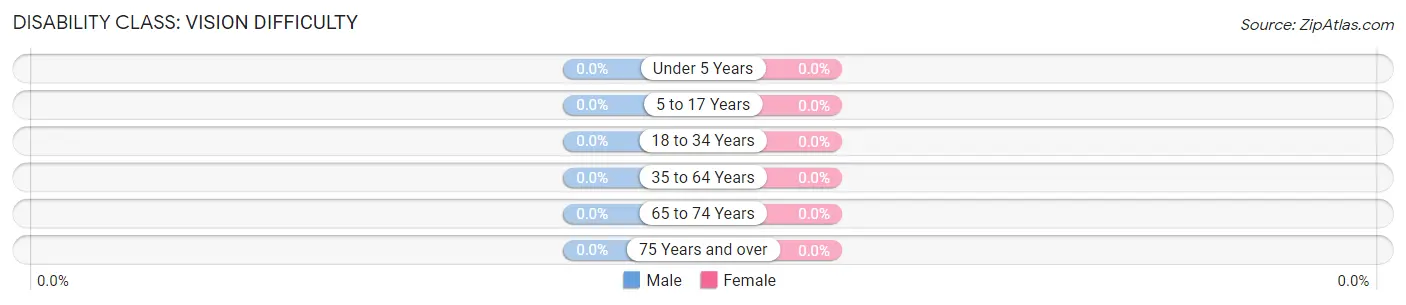
| Age Bracket | Male | Female |
| Under 5 Years | 0 (0.0%) | 0 (0.0%) |
| 5 to 17 Years | 0 (0.0%) | 0 (0.0%) |
| 18 to 34 Years | 0 (0.0%) | 0 (0.0%) |
| 35 to 64 Years | 0 (0.0%) | 0 (0.0%) |
| 65 to 74 Years | 0 (0.0%) | 0 (0.0%) |
| 75 Years and over | 0 (0.0%) | 0 (0.0%) |
Disability Class: Cognitive Difficulty
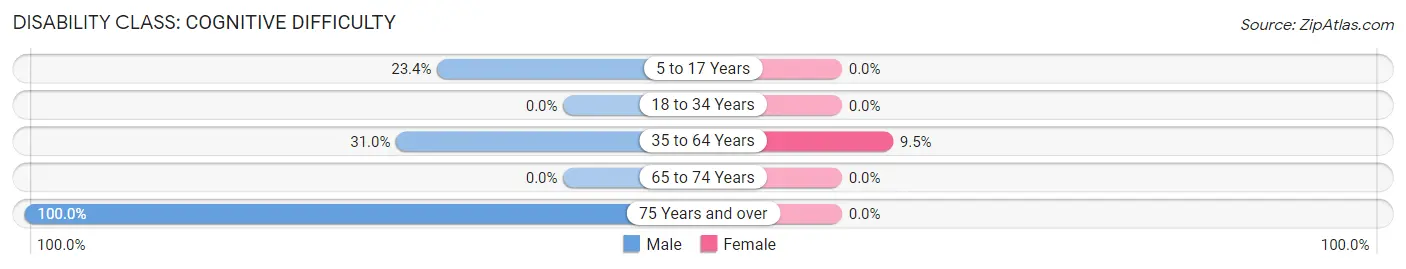
| Age Bracket | Male | Female |
| 5 to 17 Years | 11 (23.4%) | 0 (0.0%) |
| 18 to 34 Years | 0 (0.0%) | 0 (0.0%) |
| 35 to 64 Years | 31 (31.0%) | 16 (9.5%) |
| 65 to 74 Years | 0 (0.0%) | 0 (0.0%) |
| 75 Years and over | 15 (100.0%) | 0 (0.0%) |
Disability Class: Ambulatory Difficulty
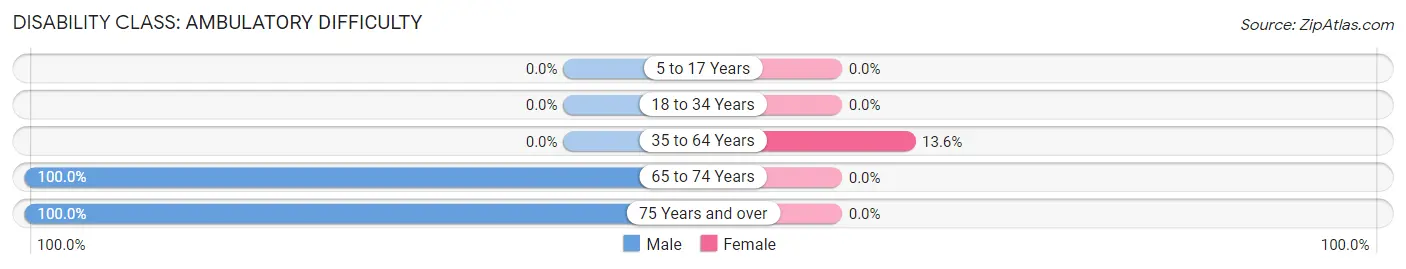
| Age Bracket | Male | Female |
| 5 to 17 Years | 0 (0.0%) | 0 (0.0%) |
| 18 to 34 Years | 0 (0.0%) | 0 (0.0%) |
| 35 to 64 Years | 0 (0.0%) | 23 (13.6%) |
| 65 to 74 Years | 16 (100.0%) | 0 (0.0%) |
| 75 Years and over | 15 (100.0%) | 0 (0.0%) |
Disability Class: Self-Care Difficulty
| Age Bracket | Male | Female |
| 5 to 17 Years | 0 (0.0%) | 0 (0.0%) |
| 18 to 34 Years | 0 (0.0%) | 0 (0.0%) |
| 35 to 64 Years | 0 (0.0%) | 0 (0.0%) |
| 65 to 74 Years | 0 (0.0%) | 0 (0.0%) |
| 75 Years and over | 0 (0.0%) | 0 (0.0%) |
Technology Access in Clallam Bay
Computing Device Access in Clallam Bay
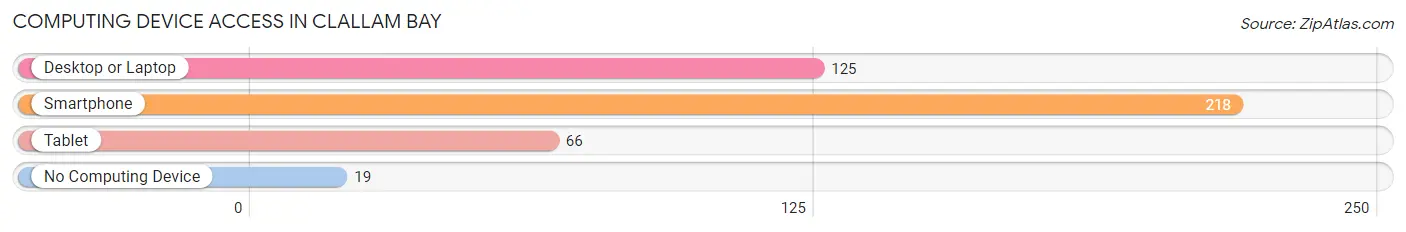
| Device Type | # Households | % Households |
| Desktop or Laptop | 125 | 49.4% |
| Smartphone | 218 | 86.2% |
| Tablet | 66 | 26.1% |
| No Computing Device | 19 | 7.5% |
| Total | 253 | 100.0% |
Internet Access in Clallam Bay
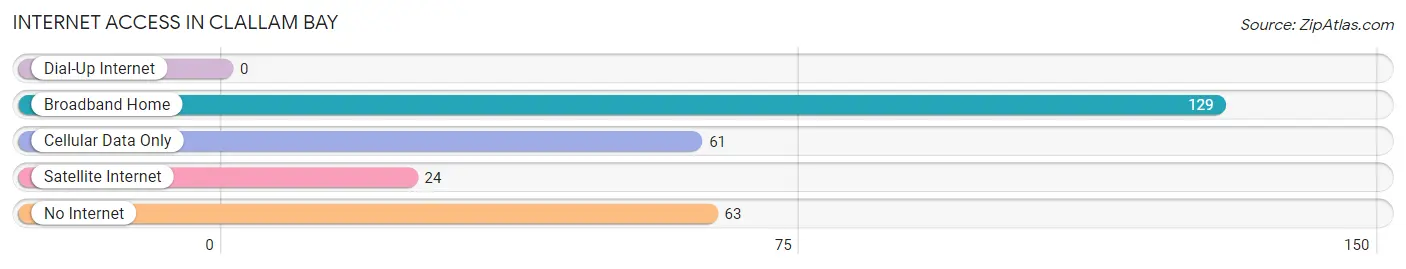
| Internet Type | # Households | % Households |
| Dial-Up Internet | 0 | 0.0% |
| Broadband Home | 129 | 51.0% |
| Cellular Data Only | 61 | 24.1% |
| Satellite Internet | 24 | 9.5% |
| No Internet | 63 | 24.9% |
| Total | 253 | 100.0% |
Clallam Bay Summary
Clallam Bay is a small unincorporated community located on the Olympic Peninsula in the state of Washington. It is situated on the Strait of Juan de Fuca, approximately 30 miles west of Port Angeles. The population of Clallam Bay was estimated to be 645 in 2019.
History
Clallam Bay was first settled in the late 1800s by a group of Native Americans from the Makah tribe. The Makah people had lived in the area for centuries, and the settlement of Clallam Bay was a natural extension of their traditional territory. The town was officially established in 1906, when the first post office was opened.
The town was named after the Clallam Bay, a bay located just south of the town. The bay was named by Captain George Vancouver in 1792, after the Clallam people, a Native American tribe that lived in the area.
The town of Clallam Bay grew slowly over the years, and by the 1950s it had become a popular tourist destination. The town was known for its beautiful beaches, fishing, and outdoor activities.
Geography
Clallam Bay is located on the Olympic Peninsula in the state of Washington. It is situated on the Strait of Juan de Fuca, approximately 30 miles west of Port Angeles. The town is surrounded by the Olympic National Park and Olympic National Forest.
The town is located at the mouth of the Clallam River, which flows into the Strait of Juan de Fuca. The river is a popular spot for fishing, and is home to a variety of fish species, including salmon, steelhead, and trout.
The town is located in a temperate rainforest climate, with mild temperatures and abundant rainfall. The average annual precipitation is approximately 80 inches.
Economy
The economy of Clallam Bay is largely based on tourism and fishing. The town is a popular destination for outdoor activities, such as fishing, camping, and hiking. The town is also home to a number of small businesses, including restaurants, shops, and lodging.
The town is also home to a number of seafood processing plants, which process and package fish and shellfish for sale. The seafood industry is an important part of the local economy, and provides employment for many of the town’s residents.
Demographics
The population of Clallam Bay was estimated to be 645 in 2019. The town is predominantly white, with a small minority population. The median household income is approximately $41,000, and the median home value is approximately $200,000.
The town is served by the Clallam Bay-Sekiu School District, which includes two elementary schools, one middle school, and one high school. The town is also home to a branch of Peninsula College, which offers a variety of courses and programs.
Conclusion
Clallam Bay is a small unincorporated community located on the Olympic Peninsula in the state of Washington. It is situated on the Strait of Juan de Fuca, approximately 30 miles west of Port Angeles. The population of Clallam Bay was estimated to be 645 in 2019. The town is predominantly white, with a small minority population. The economy of Clallam Bay is largely based on tourism and fishing, and the town is a popular destination for outdoor activities. The town is also home to a number of small businesses, including restaurants, shops, and lodging. The town is served by the Clallam Bay-Sekiu School District, and is home to a branch of Peninsula College.
Common Questions
What is Per Capita Income in Clallam Bay?
Per Capita income in Clallam Bay is $22,679.
What is the Median Family Income in Clallam Bay?
Median Family Income in Clallam Bay is $45,179.
What is the Median Household income in Clallam Bay?
Median Household Income in Clallam Bay is $45,321.
What is Income or Wage Gap in Clallam Bay?
Income or Wage Gap in Clallam Bay is 45.4%.
Women in Clallam Bay earn 54.6 cents for every dollar earned by a man.
What is Inequality or Gini Index in Clallam Bay?
Inequality or Gini Index in Clallam Bay is 0.34.
What is the Total Population of Clallam Bay?
Total Population of Clallam Bay is 734.
What is the Total Male Population of Clallam Bay?
Total Male Population of Clallam Bay is 302.
What is the Total Female Population of Clallam Bay?
Total Female Population of Clallam Bay is 432.
What is the Ratio of Males per 100 Females in Clallam Bay?
There are 69.91 Males per 100 Females in Clallam Bay.
What is the Ratio of Females per 100 Males in Clallam Bay?
There are 143.05 Females per 100 Males in Clallam Bay.
What is the Median Population Age in Clallam Bay?
Median Population Age in Clallam Bay is 31.0 Years.
What is the Average Family Size in Clallam Bay
Average Family Size in Clallam Bay is 3.5 People.
What is the Average Household Size in Clallam Bay
Average Household Size in Clallam Bay is 2.9 People.
How Large is the Labor Force in Clallam Bay?
There are 447 People in the Labor Forcein in Clallam Bay.
What is the Percentage of People in the Labor Force in Clallam Bay?
81.9% of People are in the Labor Force in Clallam Bay.