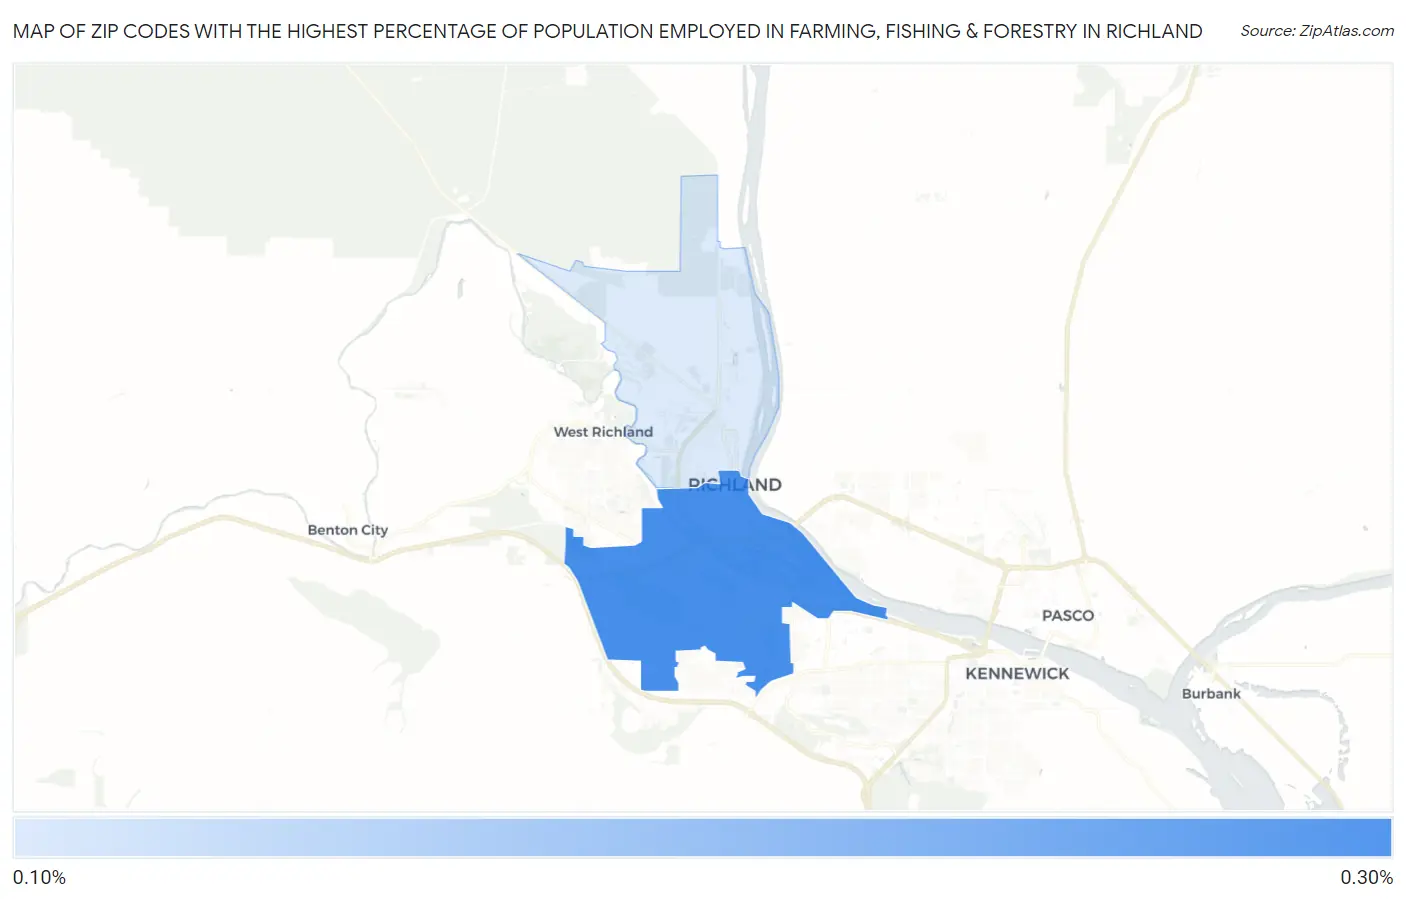
Zip Codes with the Highest Percentage of Population Employed in Farming, Fishing & Forestry in Richland, WA
RELATED REPORTS & OPTIONS
Farming, Fishing & Forestry
Richland
Compare Zip Codes
Map of Zip Codes with the Highest Percentage of Population Employed in Farming, Fishing & Forestry in Richland
0.13%
0.25%
Zip Codes with the Highest Percentage of Population Employed in Farming, Fishing & Forestry in Richland, WA
| Zip Code | % Employed | vs State | vs National | |
| 1. | 99352 | 0.25% | 1.5%(-1.26)#361 | 0.61%(-0.354)#15,386 |
| 2. | 99354 | 0.13% | 1.5%(-1.38)#402 | 0.61%(-0.476)#17,277 |
1
Common Questions
What are the Top Zip Codes with the Highest Percentage of Population Employed in Farming, Fishing & Forestry in Richland, WA?
Top Zip Codes with the Highest Percentage of Population Employed in Farming, Fishing & Forestry in Richland, WA are:
What zip code has the Highest Percentage of Population Employed in Farming, Fishing & Forestry in Richland, WA?
99352 has the Highest Percentage of Population Employed in Farming, Fishing & Forestry in Richland, WA with 0.25%.
What is the Percentage of Population Employed in Farming, Fishing & Forestry in Richland, WA?
Percentage of Population Employed in Farming, Fishing & Forestry in Richland is 0.20%.
What is the Percentage of Population Employed in Farming, Fishing & Forestry in Washington?
Percentage of Population Employed in Farming, Fishing & Forestry in Washington is 1.5%.
What is the Percentage of Population Employed in Farming, Fishing & Forestry in the United States?
Percentage of Population Employed in Farming, Fishing & Forestry in the United States is 0.61%.