Burbank, WA Map & Demographics
Burbank Map
Burbank Overview
$31,030
PER CAPITA INCOME
$92,286
AVG FAMILY INCOME
$84,046
AVG HOUSEHOLD INCOME
53.4%
WAGE / INCOME GAP [ % ]
46.6¢/ $1
WAGE / INCOME GAP [ $ ]
0.31
INEQUALITY / GINI INDEX
3,383
TOTAL POPULATION
1,887
MALE POPULATION
1,496
FEMALE POPULATION
126.14
MALES / 100 FEMALES
79.28
FEMALES / 100 MALES
32.0
MEDIAN AGE
3.5
AVG FAMILY SIZE
3.0
AVG HOUSEHOLD SIZE
1,518
LABOR FORCE [ PEOPLE ]
62.0%
PERCENT IN LABOR FORCE
10.9%
UNEMPLOYMENT RATE
Burbank Zip Codes
Burbank Area Codes
Income in Burbank
Income Overview in Burbank
Per Capita Income in Burbank is $31,030, while median incomes of families and households are $92,286 and $84,046 respectively.
| Characteristic | Number | Measure |
| Per Capita Income | 3,383 | $31,030 |
| Median Family Income | 876 | $92,286 |
| Mean Family Income | 876 | $97,434 |
| Median Household Income | 1,111 | $84,046 |
| Mean Household Income | 1,111 | $93,657 |
| Income Deficit | 876 | $0 |
| Wage / Income Gap (%) | 3,383 | 53.35% |
| Wage / Income Gap ($) | 3,383 | 46.65¢ per $1 |
| Gini / Inequality Index | 3,383 | 0.31 |
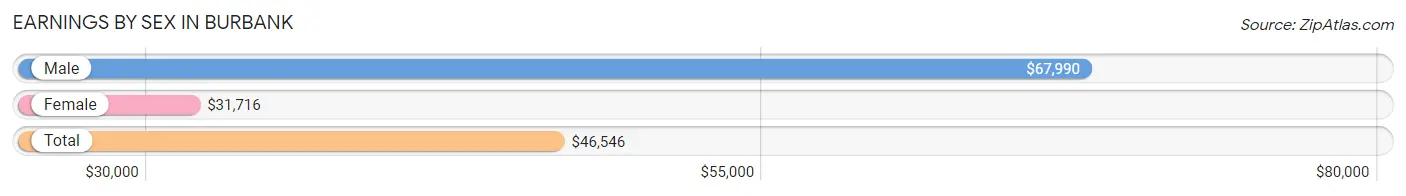
Earnings by Sex in Burbank
Average Earnings in Burbank are $46,546, $67,990 for men and $31,716 for women, a difference of 53.3%.
| Sex | Number | Average Earnings |
| Male | 833 (52.7%) | $67,990 |
| Female | 748 (47.3%) | $31,716 |
| Total | 1,581 (100.0%) | $46,546 |
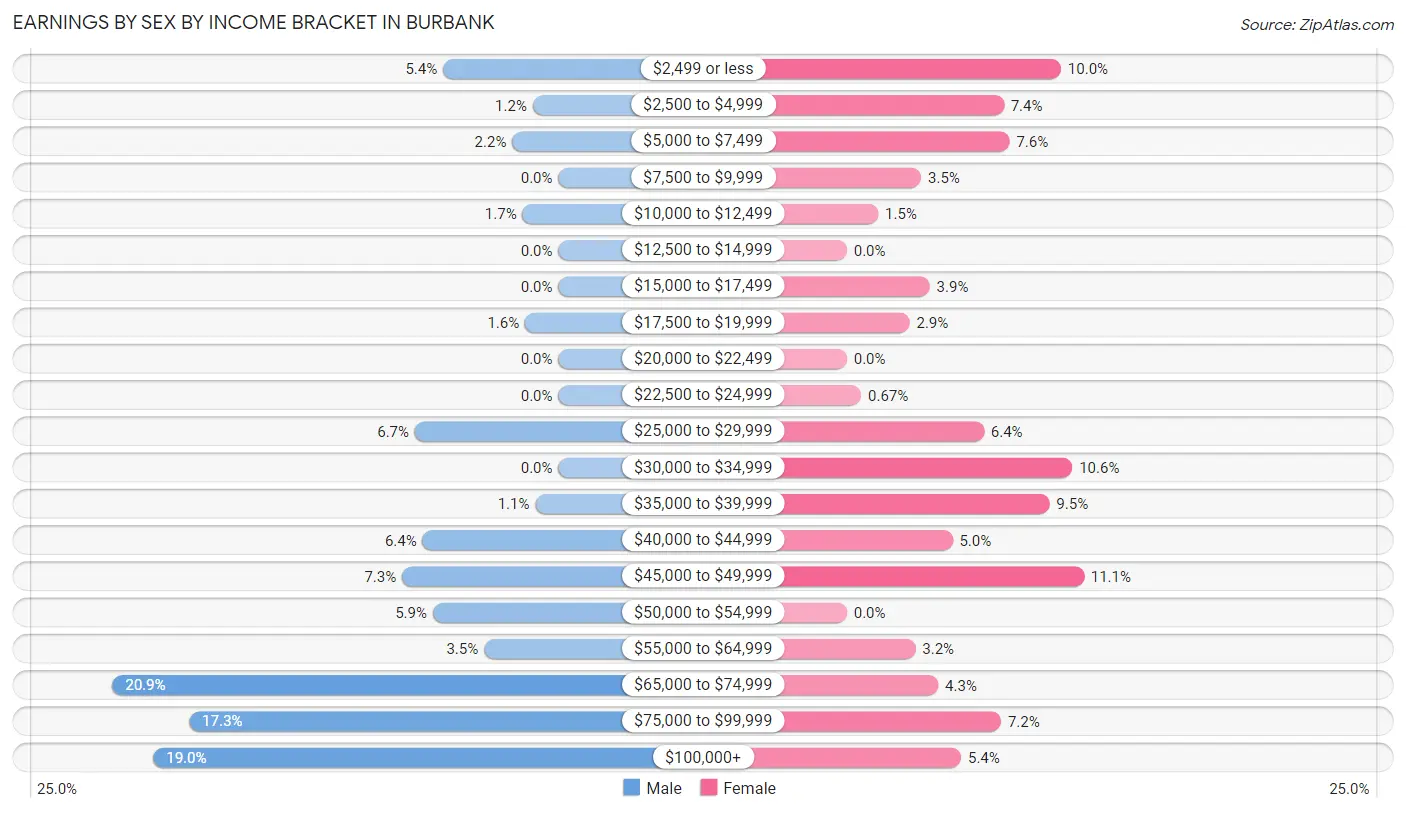
Earnings by Sex by Income Bracket in Burbank
The most common earnings brackets in Burbank are $65,000 to $74,999 for men (174 | 20.9%) and $45,000 to $49,999 for women (83 | 11.1%).
| Income | Male | Female |
| $2,499 or less | 45 (5.4%) | 75 (10.0%) |
| $2,500 to $4,999 | 10 (1.2%) | 55 (7.3%) |
| $5,000 to $7,499 | 18 (2.2%) | 57 (7.6%) |
| $7,500 to $9,999 | 0 (0.0%) | 26 (3.5%) |
| $10,000 to $12,499 | 14 (1.7%) | 11 (1.5%) |
| $12,500 to $14,999 | 0 (0.0%) | 0 (0.0%) |
| $15,000 to $17,499 | 0 (0.0%) | 29 (3.9%) |
| $17,500 to $19,999 | 13 (1.6%) | 22 (2.9%) |
| $20,000 to $22,499 | 0 (0.0%) | 0 (0.0%) |
| $22,500 to $24,999 | 0 (0.0%) | 5 (0.7%) |
| $25,000 to $29,999 | 56 (6.7%) | 48 (6.4%) |
| $30,000 to $34,999 | 0 (0.0%) | 79 (10.6%) |
| $35,000 to $39,999 | 9 (1.1%) | 71 (9.5%) |
| $40,000 to $44,999 | 53 (6.4%) | 37 (5.0%) |
| $45,000 to $49,999 | 61 (7.3%) | 83 (11.1%) |
| $50,000 to $54,999 | 49 (5.9%) | 0 (0.0%) |
| $55,000 to $64,999 | 29 (3.5%) | 24 (3.2%) |
| $65,000 to $74,999 | 174 (20.9%) | 32 (4.3%) |
| $75,000 to $99,999 | 144 (17.3%) | 54 (7.2%) |
| $100,000+ | 158 (19.0%) | 40 (5.3%) |
| Total | 833 (100.0%) | 748 (100.0%) |
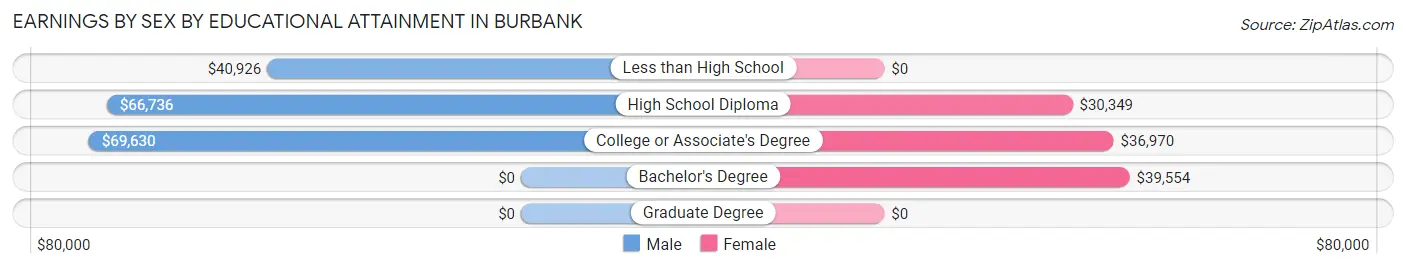
Earnings by Sex by Educational Attainment in Burbank
Average earnings in Burbank are $68,135 for men and $35,320 for women, a difference of 48.2%. Men with an educational attainment of college or associate's degree enjoy the highest average annual earnings of $69,630, while those with less than high school education earn the least with $40,926. Women with an educational attainment of bachelor's degree earn the most with the average annual earnings of $39,554, while those with high school diploma education have the smallest earnings of $30,349.
| Educational Attainment | Male Income | Female Income |
| Less than High School | $40,926 | $0 |
| High School Diploma | $66,736 | $30,349 |
| College or Associate's Degree | $69,630 | $36,970 |
| Bachelor's Degree | - | - |
| Graduate Degree | - | - |
| Total | $68,135 | $35,320 |
Family Income in Burbank
Family Income Brackets in Burbank
According to the Burbank family income data, there are 230 families falling into the $100,000 to $149,999 income range, which is the most common income bracket and makes up 26.3% of all families.
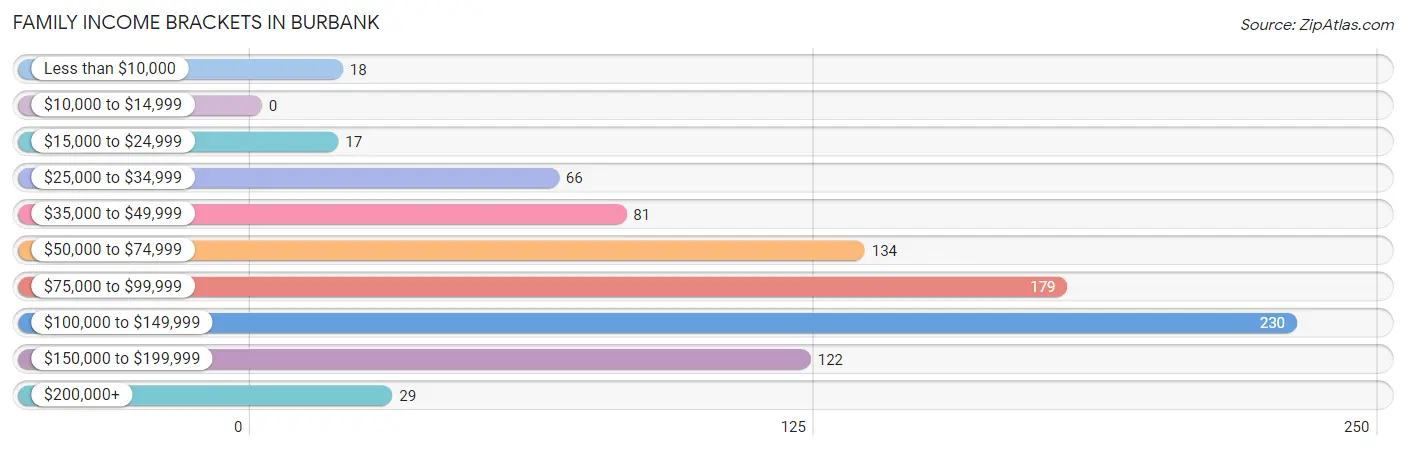
| Income Bracket | # Families | % Families |
| Less than $10,000 | 18 | 2.1% |
| $10,000 to $14,999 | 0 | 0.0% |
| $15,000 to $24,999 | 17 | 1.9% |
| $25,000 to $34,999 | 66 | 7.5% |
| $35,000 to $49,999 | 81 | 9.2% |
| $50,000 to $74,999 | 134 | 15.3% |
| $75,000 to $99,999 | 179 | 20.4% |
| $100,000 to $149,999 | 230 | 26.3% |
| $150,000 to $199,999 | 122 | 13.9% |
| $200,000+ | 29 | 3.3% |
Family Income by Famaliy Size in Burbank
5-person families (70 | 8.0%) account for the highest median family income in Burbank with $118,750 per family, while 2-person families (366 | 41.8%) have the highest median income of $45,625 per family member.
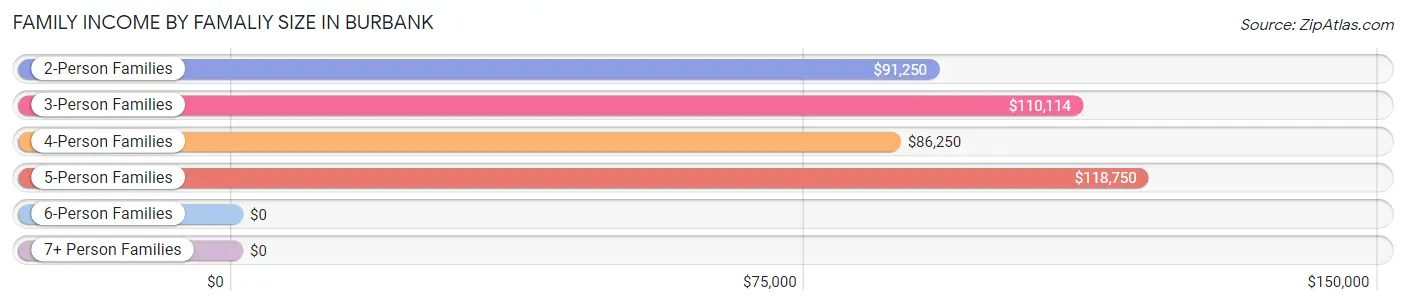
| Income Bracket | # Families | Median Income |
| 2-Person Families | 366 (41.8%) | $91,250 |
| 3-Person Families | 235 (26.8%) | $110,114 |
| 4-Person Families | 156 (17.8%) | $86,250 |
| 5-Person Families | 70 (8.0%) | $118,750 |
| 6-Person Families | 26 (3.0%) | $0 |
| 7+ Person Families | 23 (2.6%) | $0 |
| Total | 876 (100.0%) | $92,286 |
Family Income by Number of Earners in Burbank
The median family income in Burbank is $92,286, with families comprising 2 earners (407) having the highest median family income of $115,574, while families with no earners (114) have the lowest median family income of $40,972, accounting for 46.5% and 13.0% of families, respectively.
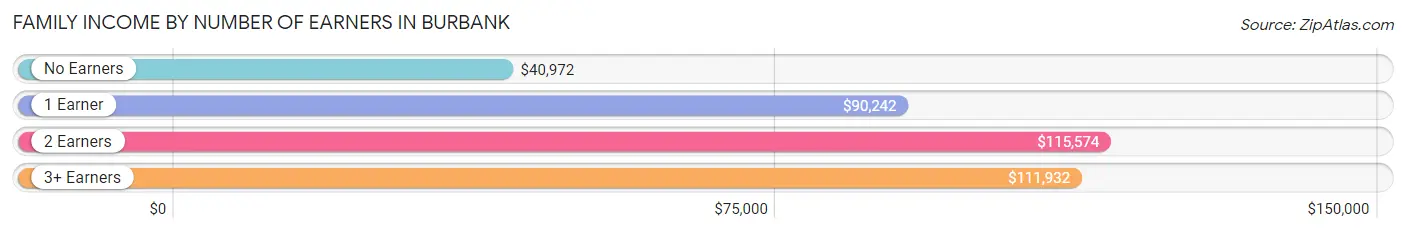
| Number of Earners | # Families | Median Income |
| No Earners | 114 (13.0%) | $40,972 |
| 1 Earner | 270 (30.8%) | $90,242 |
| 2 Earners | 407 (46.5%) | $115,574 |
| 3+ Earners | 85 (9.7%) | $111,932 |
| Total | 876 (100.0%) | $92,286 |
Household Income in Burbank
Household Income Brackets in Burbank
With 226 households falling in the category, the $100,000 to $149,999 income range is the most frequent in Burbank, accounting for 20.3% of all households.
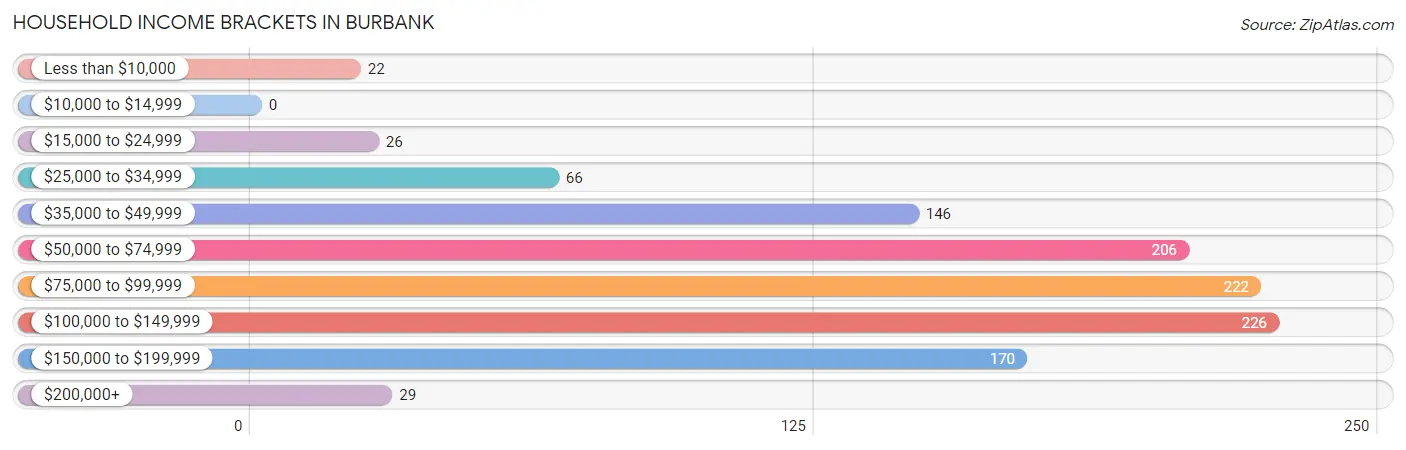
| Income Bracket | # Households | % Households |
| Less than $10,000 | 22 | 2.0% |
| $10,000 to $14,999 | 0 | 0.0% |
| $15,000 to $24,999 | 26 | 2.3% |
| $25,000 to $34,999 | 66 | 5.9% |
| $35,000 to $49,999 | 146 | 13.1% |
| $50,000 to $74,999 | 206 | 18.5% |
| $75,000 to $99,999 | 222 | 20.0% |
| $100,000 to $149,999 | 226 | 20.3% |
| $150,000 to $199,999 | 170 | 15.3% |
| $200,000+ | 29 | 2.6% |
Household Income by Householder Age in Burbank
The median household income in Burbank is $84,046, with the highest median household income of $126,538 found in the 45 to 64 years age bracket for the primary householder. A total of 370 households (33.3%) fall into this category. Meanwhile, the 15 to 24 years age bracket for the primary householder has the lowest median household income of $0, with 55 households (5.0%) in this group.
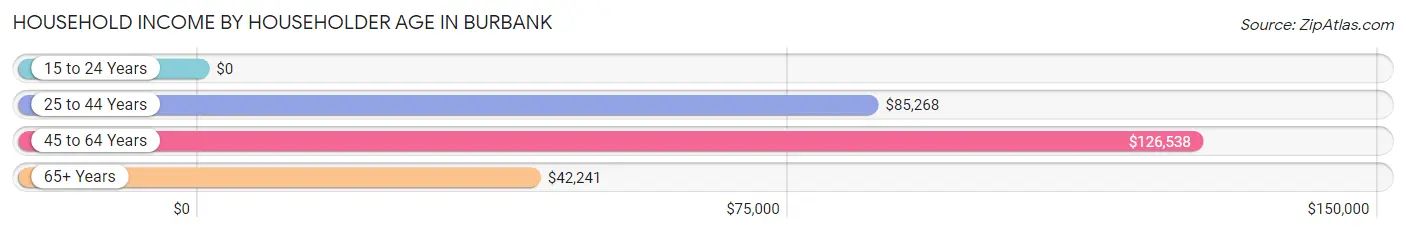
| Income Bracket | # Households | Median Income |
| 15 to 24 Years | 55 (5.0%) | $0 |
| 25 to 44 Years | 404 (36.4%) | $85,268 |
| 45 to 64 Years | 370 (33.3%) | $126,538 |
| 65+ Years | 282 (25.4%) | $42,241 |
| Total | 1,111 (100.0%) | $84,046 |
Poverty in Burbank
Income Below Poverty by Sex and Age in Burbank
With 9.5% poverty level for males and 8.2% for females among the residents of Burbank, 15 year old males and 16 and 17 year old females are the most vulnerable to poverty, with 34 males (77.3%) and 42 females (60.0%) in their respective age groups living below the poverty level.
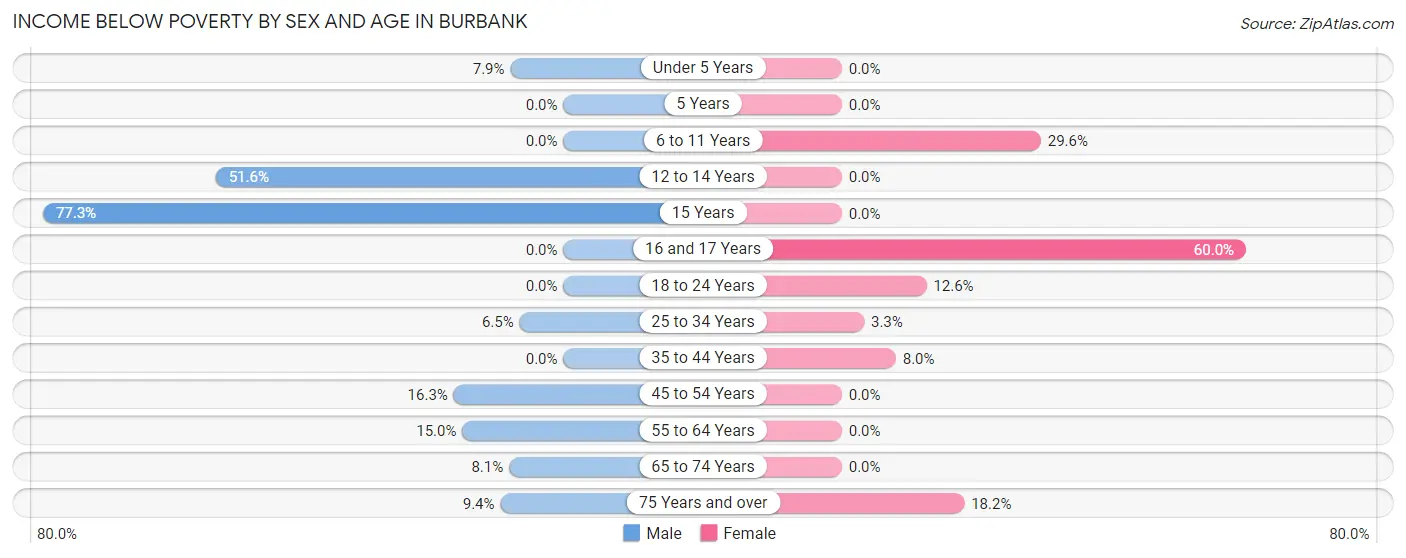
| Age Bracket | Male | Female |
| Under 5 Years | 10 (7.9%) | 0 (0.0%) |
| 5 Years | 0 (0.0%) | 0 (0.0%) |
| 6 to 11 Years | 0 (0.0%) | 26 (29.5%) |
| 12 to 14 Years | 32 (51.6%) | 0 (0.0%) |
| 15 Years | 34 (77.3%) | 0 (0.0%) |
| 16 and 17 Years | 0 (0.0%) | 42 (60.0%) |
| 18 to 24 Years | 0 (0.0%) | 24 (12.6%) |
| 25 to 34 Years | 14 (6.5%) | 6 (3.3%) |
| 35 to 44 Years | 0 (0.0%) | 13 (8.0%) |
| 45 to 54 Years | 36 (16.3%) | 0 (0.0%) |
| 55 to 64 Years | 33 (15.0%) | 0 (0.0%) |
| 65 to 74 Years | 10 (8.1%) | 0 (0.0%) |
| 75 Years and over | 10 (9.3%) | 12 (18.2%) |
| Total | 179 (9.5%) | 123 (8.2%) |
Income Above Poverty by Sex and Age in Burbank
According to the poverty statistics in Burbank, males aged 5 years and females aged under 5 years are the age groups that are most secure financially, with 100.0% of males and 100.0% of females in these age groups living above the poverty line.
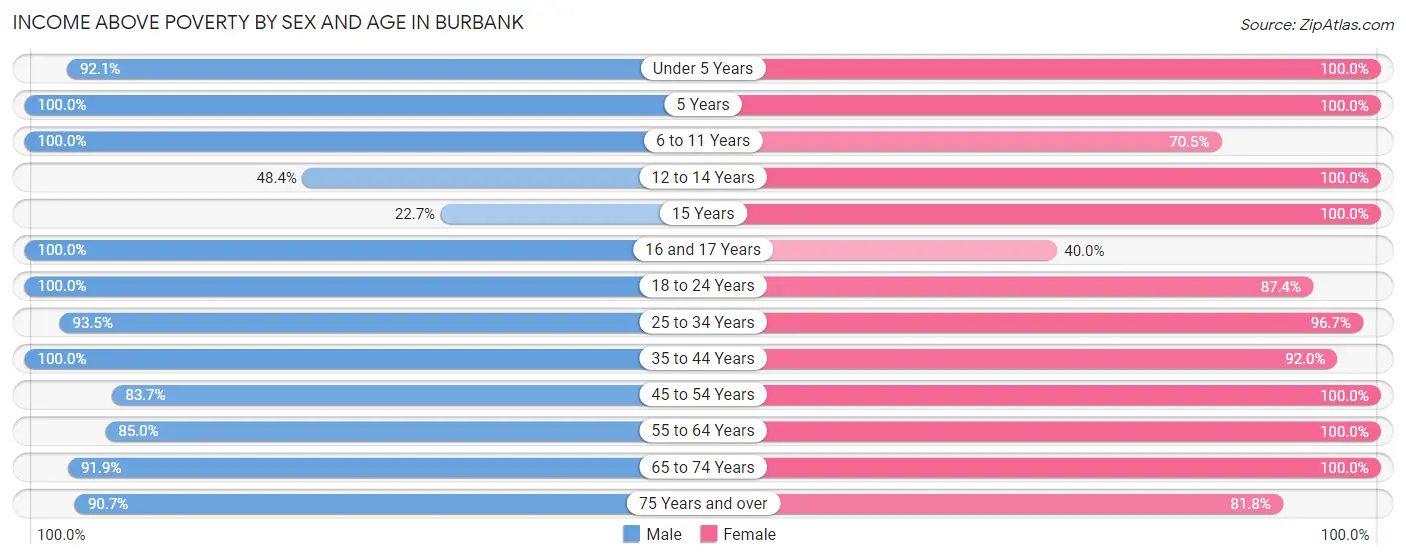
| Age Bracket | Male | Female |
| Under 5 Years | 117 (92.1%) | 98 (100.0%) |
| 5 Years | 119 (100.0%) | 39 (100.0%) |
| 6 to 11 Years | 246 (100.0%) | 62 (70.5%) |
| 12 to 14 Years | 30 (48.4%) | 66 (100.0%) |
| 15 Years | 10 (22.7%) | 45 (100.0%) |
| 16 and 17 Years | 51 (100.0%) | 28 (40.0%) |
| 18 to 24 Years | 131 (100.0%) | 167 (87.4%) |
| 25 to 34 Years | 201 (93.5%) | 176 (96.7%) |
| 35 to 44 Years | 220 (100.0%) | 149 (92.0%) |
| 45 to 54 Years | 185 (83.7%) | 181 (100.0%) |
| 55 to 64 Years | 187 (85.0%) | 170 (100.0%) |
| 65 to 74 Years | 114 (91.9%) | 138 (100.0%) |
| 75 Years and over | 97 (90.6%) | 54 (81.8%) |
| Total | 1,708 (90.5%) | 1,373 (91.8%) |
Income Below Poverty Among Married-Couple Families in Burbank
The poverty statistics for married-couple families in Burbank show that 3.3% or 25 of the total 754 families live below the poverty line. Families with 3 or 4 children have the highest poverty rate of 16.3%, comprising of 13 families. On the other hand, families with 1 or 2 children have the lowest poverty rate of 0.0%, which includes 0 families.
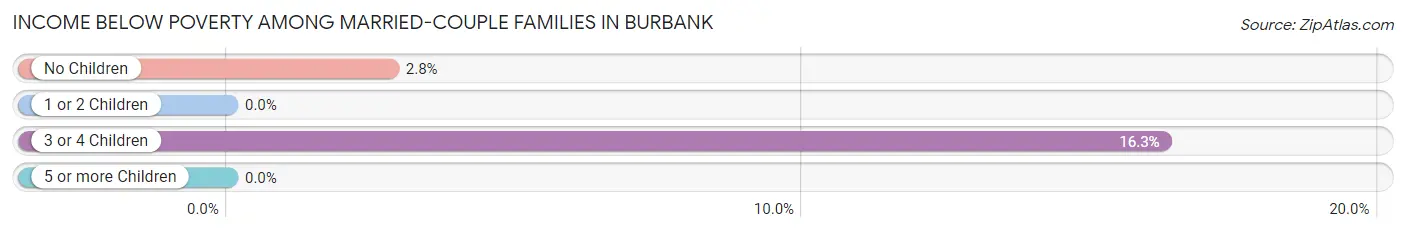
| Children | Above Poverty | Below Poverty |
| No Children | 416 (97.2%) | 12 (2.8%) |
| 1 or 2 Children | 236 (100.0%) | 0 (0.0%) |
| 3 or 4 Children | 67 (83.8%) | 13 (16.3%) |
| 5 or more Children | 10 (100.0%) | 0 (0.0%) |
| Total | 729 (96.7%) | 25 (3.3%) |
Income Below Poverty Among Single-Parent Households in Burbank
According to the poverty data in Burbank, 41.5% or 17 single-father households and 7.4% or 6 single-mother households are living below the poverty line. Among single-father households, those with no children have the highest poverty rate, with 17 households (60.7%) experiencing poverty. Likewise, among single-mother households, those with 1 or 2 children have the highest poverty rate, with 6 households (100.0%) falling below the poverty line.
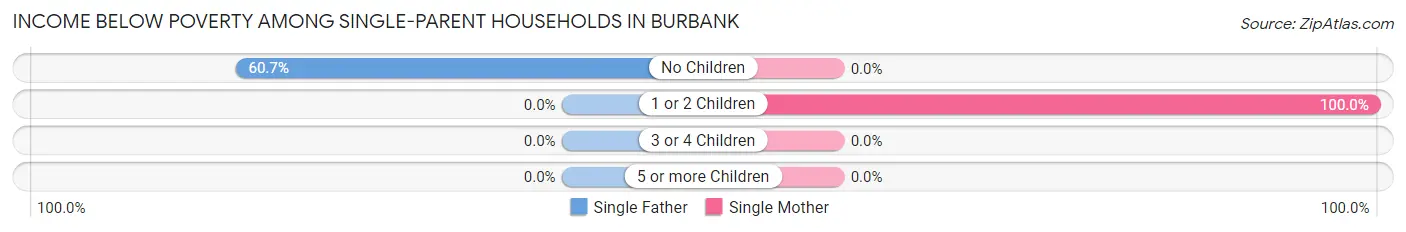
| Children | Single Father | Single Mother |
| No Children | 17 (60.7%) | 0 (0.0%) |
| 1 or 2 Children | 0 (0.0%) | 6 (100.0%) |
| 3 or 4 Children | 0 (0.0%) | 0 (0.0%) |
| 5 or more Children | 0 (0.0%) | 0 (0.0%) |
| Total | 17 (41.5%) | 6 (7.4%) |
Income Below Poverty Among Married-Couple vs Single-Parent Households in Burbank
The poverty data for Burbank shows that 25 of the married-couple family households (3.3%) and 23 of the single-parent households (18.9%) are living below the poverty level. Within the married-couple family households, those with 3 or 4 children have the highest poverty rate, with 13 households (16.3%) falling below the poverty line. Among the single-parent households, those with 1 or 2 children have the highest poverty rate, with 6 household (31.6%) living below poverty.
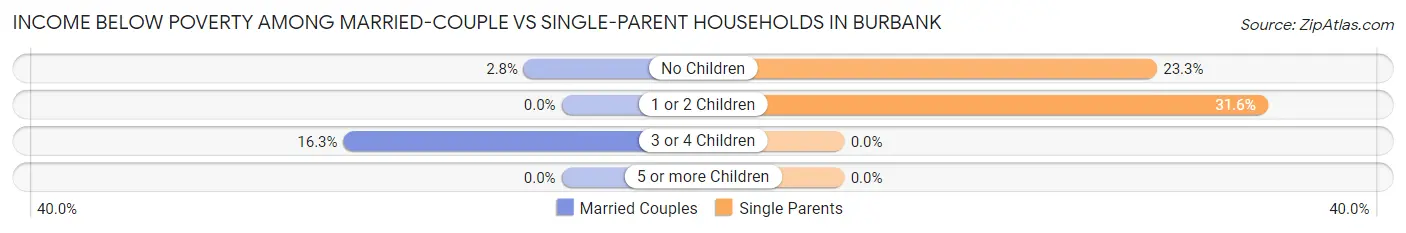
| Children | Married-Couple Families | Single-Parent Households |
| No Children | 12 (2.8%) | 17 (23.3%) |
| 1 or 2 Children | 0 (0.0%) | 6 (31.6%) |
| 3 or 4 Children | 13 (16.3%) | 0 (0.0%) |
| 5 or more Children | 0 (0.0%) | 0 (0.0%) |
| Total | 25 (3.3%) | 23 (18.9%) |
Race in Burbank
The most populous races in Burbank are White / Caucasian (2,525 | 74.6%), Hispanic or Latino (789 | 23.3%), and Two or more Races (419 | 12.4%).
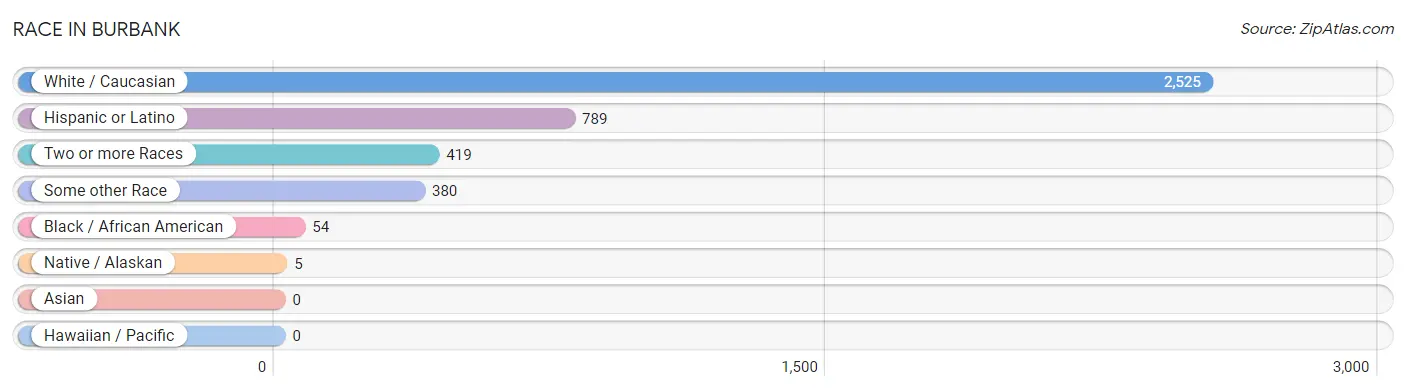
| Race | # Population | % Population |
| Asian | 0 | 0.0% |
| Black / African American | 54 | 1.6% |
| Hawaiian / Pacific | 0 | 0.0% |
| Hispanic or Latino | 789 | 23.3% |
| Native / Alaskan | 5 | 0.2% |
| White / Caucasian | 2,525 | 74.6% |
| Two or more Races | 419 | 12.4% |
| Some other Race | 380 | 11.2% |
| Total | 3,383 | 100.0% |
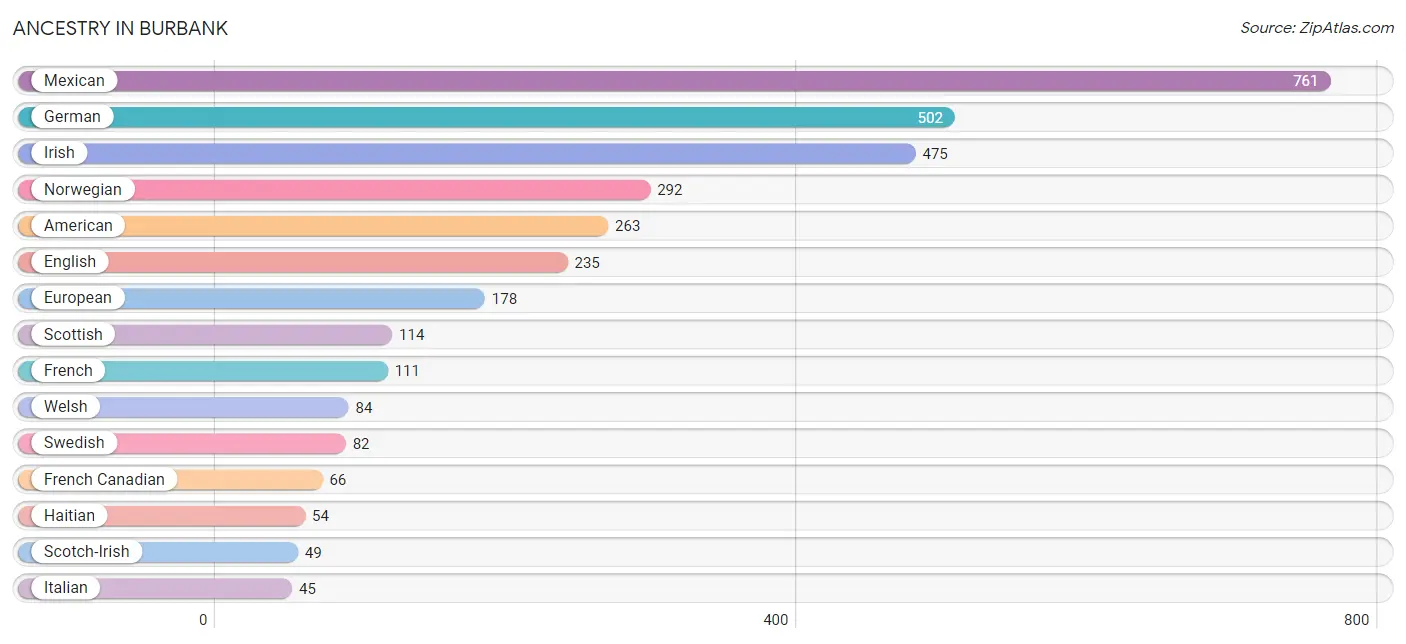
Ancestry in Burbank
The most populous ancestries reported in Burbank are Mexican (761 | 22.5%), German (502 | 14.8%), Irish (475 | 14.0%), Norwegian (292 | 8.6%), and American (263 | 7.8%), together accounting for 67.8% of all Burbank residents.
| Ancestry | # Population | % Population |
| American | 263 | 7.8% |
| Apache | 5 | 0.2% |
| Belgian | 7 | 0.2% |
| British | 12 | 0.4% |
| Canadian | 14 | 0.4% |
| Central American | 28 | 0.8% |
| Cherokee | 33 | 1.0% |
| Chippewa | 5 | 0.2% |
| Comanche | 5 | 0.2% |
| Croatian | 24 | 0.7% |
| Danish | 23 | 0.7% |
| Dutch | 18 | 0.5% |
| English | 235 | 7.0% |
| European | 178 | 5.3% |
| Finnish | 38 | 1.1% |
| French | 111 | 3.3% |
| French Canadian | 66 | 1.9% |
| German | 502 | 14.8% |
| Guatemalan | 28 | 0.8% |
| Haitian | 54 | 1.6% |
| Hungarian | 18 | 0.5% |
| Irish | 475 | 14.0% |
| Iroquois | 5 | 0.2% |
| Italian | 45 | 1.3% |
| Mexican | 761 | 22.5% |
| Norwegian | 292 | 8.6% |
| Polish | 27 | 0.8% |
| Portuguese | 40 | 1.2% |
| Scandinavian | 42 | 1.2% |
| Scotch-Irish | 49 | 1.5% |
| Scottish | 114 | 3.4% |
| Swedish | 82 | 2.4% |
| Swiss | 13 | 0.4% |
| Welsh | 84 | 2.5% | View All 34 Rows |
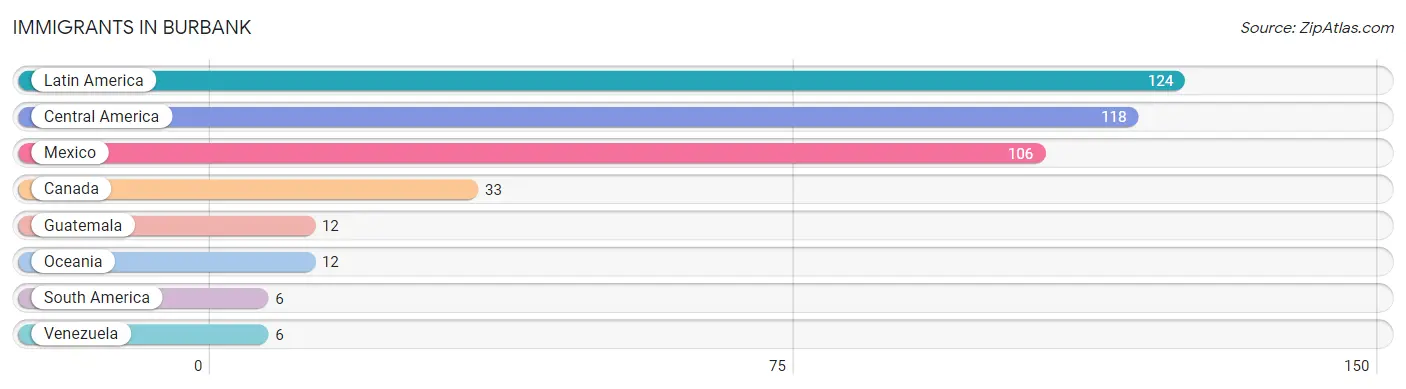
Immigrants in Burbank
The most numerous immigrant groups reported in Burbank came from Latin America (124 | 3.7%), Central America (118 | 3.5%), Mexico (106 | 3.1%), Canada (33 | 1.0%), and Guatemala (12 | 0.4%), together accounting for 11.6% of all Burbank residents.
| Immigration Origin | # Population | % Population |
| Canada | 33 | 1.0% |
| Central America | 118 | 3.5% |
| Guatemala | 12 | 0.4% |
| Latin America | 124 | 3.7% |
| Mexico | 106 | 3.1% |
| Oceania | 12 | 0.4% |
| South America | 6 | 0.2% |
| Venezuela | 6 | 0.2% | View All 8 Rows |
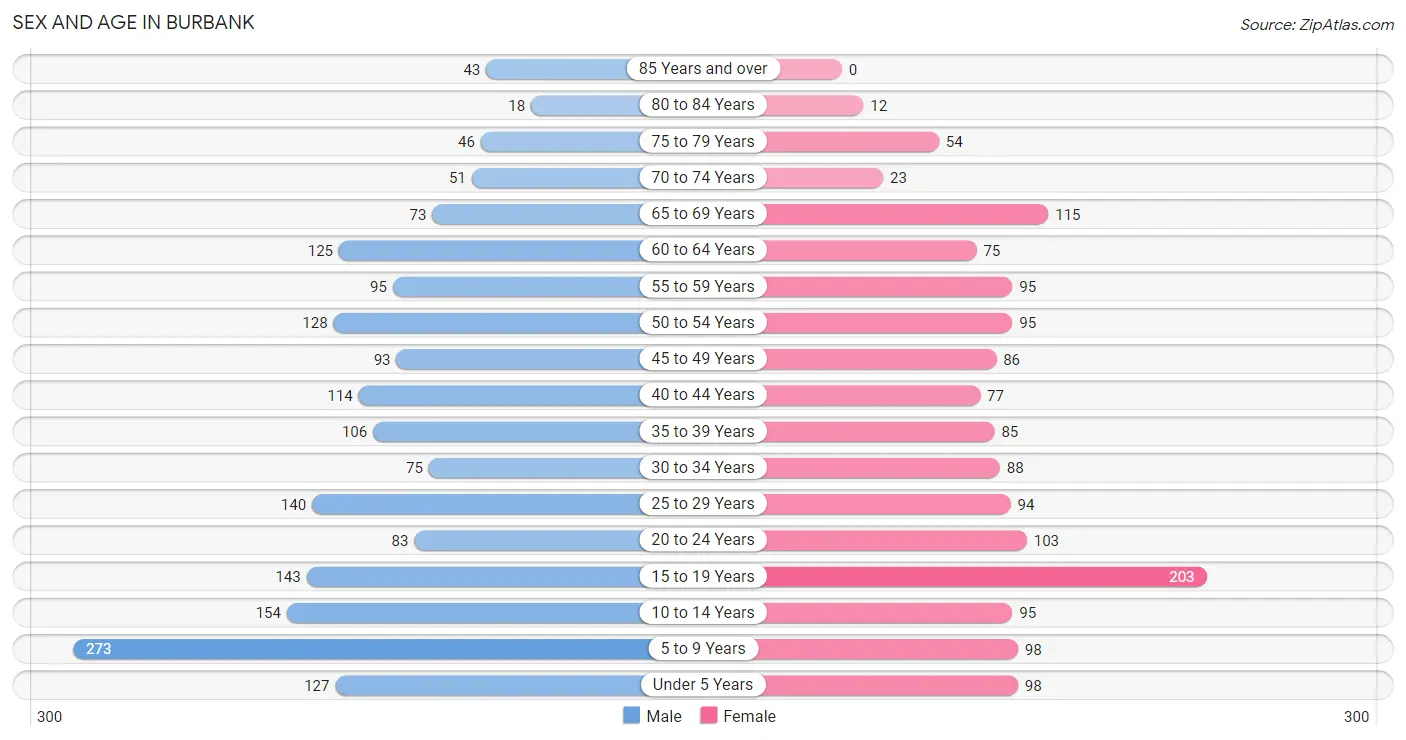
Sex and Age in Burbank
Sex and Age in Burbank
The most populous age groups in Burbank are 5 to 9 Years (273 | 14.5%) for men and 15 to 19 Years (203 | 13.6%) for women.
| Age Bracket | Male | Female |
| Under 5 Years | 127 (6.7%) | 98 (6.6%) |
| 5 to 9 Years | 273 (14.5%) | 98 (6.6%) |
| 10 to 14 Years | 154 (8.2%) | 95 (6.4%) |
| 15 to 19 Years | 143 (7.6%) | 203 (13.6%) |
| 20 to 24 Years | 83 (4.4%) | 103 (6.9%) |
| 25 to 29 Years | 140 (7.4%) | 94 (6.3%) |
| 30 to 34 Years | 75 (4.0%) | 88 (5.9%) |
| 35 to 39 Years | 106 (5.6%) | 85 (5.7%) |
| 40 to 44 Years | 114 (6.0%) | 77 (5.1%) |
| 45 to 49 Years | 93 (4.9%) | 86 (5.8%) |
| 50 to 54 Years | 128 (6.8%) | 95 (6.4%) |
| 55 to 59 Years | 95 (5.0%) | 95 (6.4%) |
| 60 to 64 Years | 125 (6.6%) | 75 (5.0%) |
| 65 to 69 Years | 73 (3.9%) | 115 (7.7%) |
| 70 to 74 Years | 51 (2.7%) | 23 (1.5%) |
| 75 to 79 Years | 46 (2.4%) | 54 (3.6%) |
| 80 to 84 Years | 18 (0.9%) | 12 (0.8%) |
| 85 Years and over | 43 (2.3%) | 0 (0.0%) |
| Total | 1,887 (100.0%) | 1,496 (100.0%) |
Families and Households in Burbank
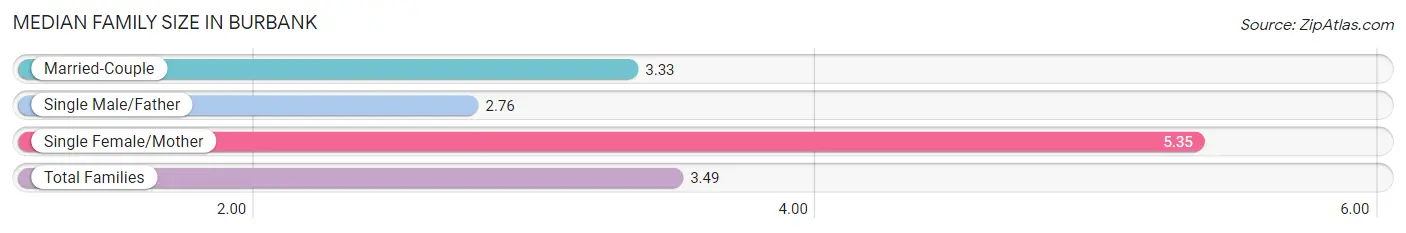
Median Family Size in Burbank
The median family size in Burbank is 3.49 persons per family, with single female/mother families (81 | 9.2%) accounting for the largest median family size of 5.35 persons per family. On the other hand, single male/father families (41 | 4.7%) represent the smallest median family size with 2.76 persons per family.
| Family Type | # Families | Family Size |
| Married-Couple | 754 (86.1%) | 3.33 |
| Single Male/Father | 41 (4.7%) | 2.76 |
| Single Female/Mother | 81 (9.2%) | 5.35 |
| Total Families | 876 (100.0%) | 3.49 |
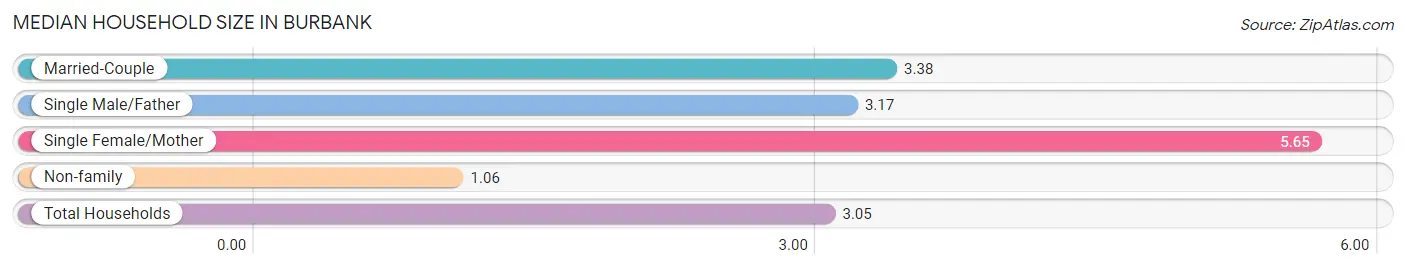
Median Household Size in Burbank
The median household size in Burbank is 3.05 persons per household, with single female/mother households (81 | 7.3%) accounting for the largest median household size of 5.65 persons per household. non-family households (235 | 21.1%) represent the smallest median household size with 1.06 persons per household.
| Household Type | # Households | Household Size |
| Married-Couple | 754 (67.9%) | 3.38 |
| Single Male/Father | 41 (3.7%) | 3.17 |
| Single Female/Mother | 81 (7.3%) | 5.65 |
| Non-family | 235 (21.1%) | 1.06 |
| Total Households | 1,111 (100.0%) | 3.05 |
Household Size by Marriage Status in Burbank
Out of a total of 1,111 households in Burbank, 876 (78.8%) are family households, while 235 (21.1%) are nonfamily households. The most numerous type of family households are 2-person households, comprising 366, and the most common type of nonfamily households are 1-person households, comprising 214.
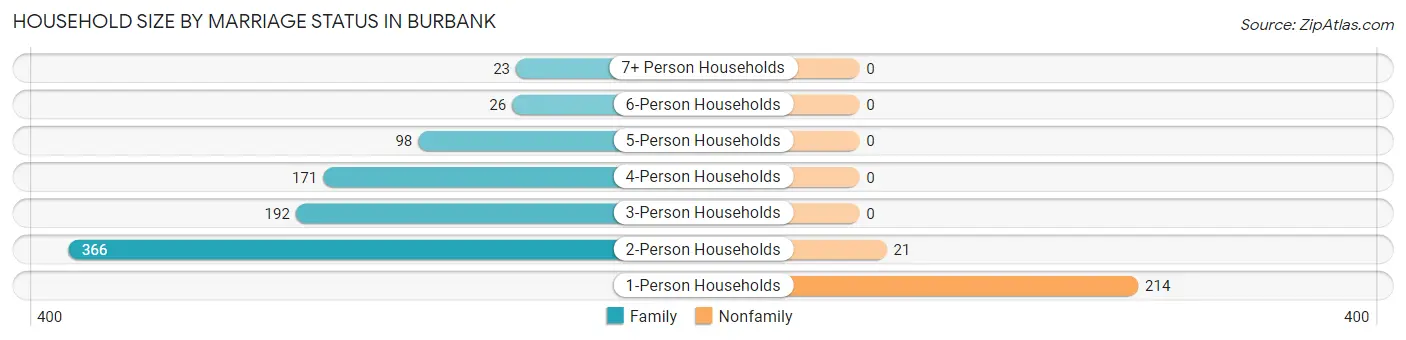
| Household Size | Family Households | Nonfamily Households |
| 1-Person Households | - | 214 (19.3%) |
| 2-Person Households | 366 (32.9%) | 21 (1.9%) |
| 3-Person Households | 192 (17.3%) | 0 (0.0%) |
| 4-Person Households | 171 (15.4%) | 0 (0.0%) |
| 5-Person Households | 98 (8.8%) | 0 (0.0%) |
| 6-Person Households | 26 (2.3%) | 0 (0.0%) |
| 7+ Person Households | 23 (2.1%) | 0 (0.0%) |
| Total | 876 (78.8%) | 235 (21.1%) |
Female Fertility in Burbank
Fertility by Age in Burbank
Average fertility rate in Burbank is 33.0 births per 1,000 women. Women in the age bracket of 20 to 34 years have the highest fertility rate with 88.0 births per 1,000 women. Women in the age bracket of 20 to 34 years acount for 100.0% of all women with births.
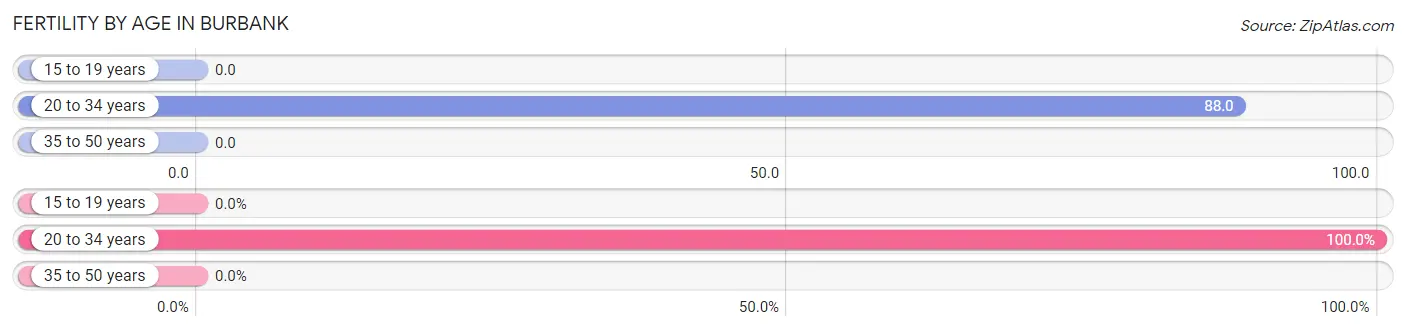
| Age Bracket | Women with Births | Births / 1,000 Women |
| 15 to 19 years | 0 (0.0%) | 0.0 |
| 20 to 34 years | 25 (100.0%) | 88.0 |
| 35 to 50 years | 0 (0.0%) | 0.0 |
| Total | 25 (100.0%) | 33.0 |
Fertility by Age by Marriage Status in Burbank
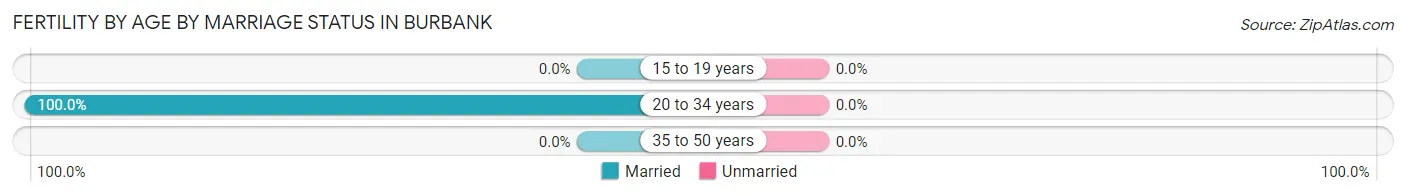
| Age Bracket | Married | Unmarried |
| 15 to 19 years | 0 (0.0%) | 0 (0.0%) |
| 20 to 34 years | 25 (100.0%) | 0 (0.0%) |
| 35 to 50 years | 0 (0.0%) | 0 (0.0%) |
| Total | 25 (100.0%) | 0 (0.0%) |
Fertility by Education in Burbank
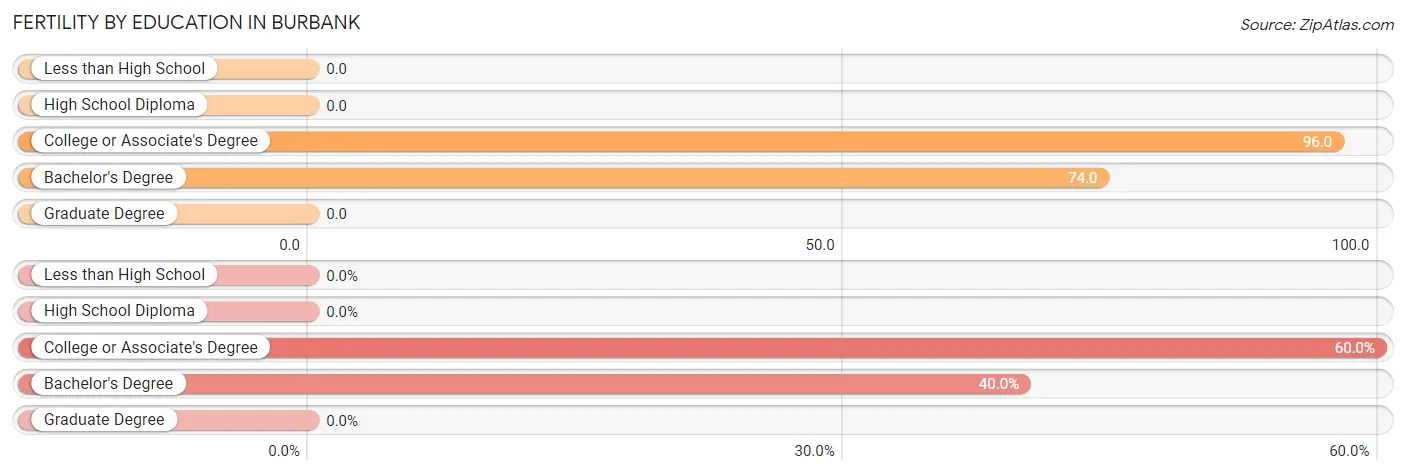
| Educational Attainment | Women with Births | Births / 1,000 Women |
| Less than High School | 0 (0.0%) | 0.0 |
| High School Diploma | 0 (0.0%) | 0.0 |
| College or Associate's Degree | 15 (60.0%) | 96.0 |
| Bachelor's Degree | 10 (40.0%) | 74.0 |
| Graduate Degree | 0 (0.0%) | 0.0 |
| Total | 25 (100.0%) | 33.0 |
Fertility by Education by Marriage Status in Burbank
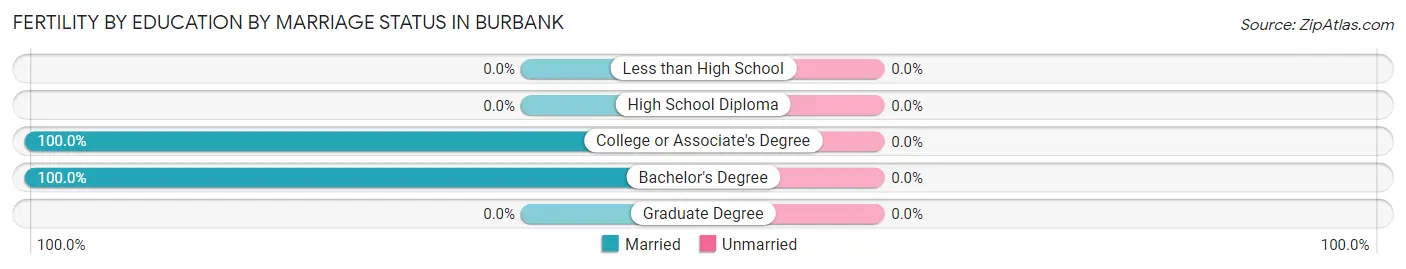
| Educational Attainment | Married | Unmarried |
| Less than High School | 0 (0.0%) | 0 (0.0%) |
| High School Diploma | 0 (0.0%) | 0 (0.0%) |
| College or Associate's Degree | 15 (100.0%) | 0 (0.0%) |
| Bachelor's Degree | 10 (100.0%) | 0 (0.0%) |
| Graduate Degree | 0 (0.0%) | 0 (0.0%) |
| Total | 25 (100.0%) | 0 (0.0%) |
Employment Characteristics in Burbank
Employment by Class of Employer in Burbank
Among the 1,311 employed individuals in Burbank, private company employees (789 | 60.2%), local government employees (160 | 12.2%), and state government employees (96 | 7.3%) make up the most common classes of employment.
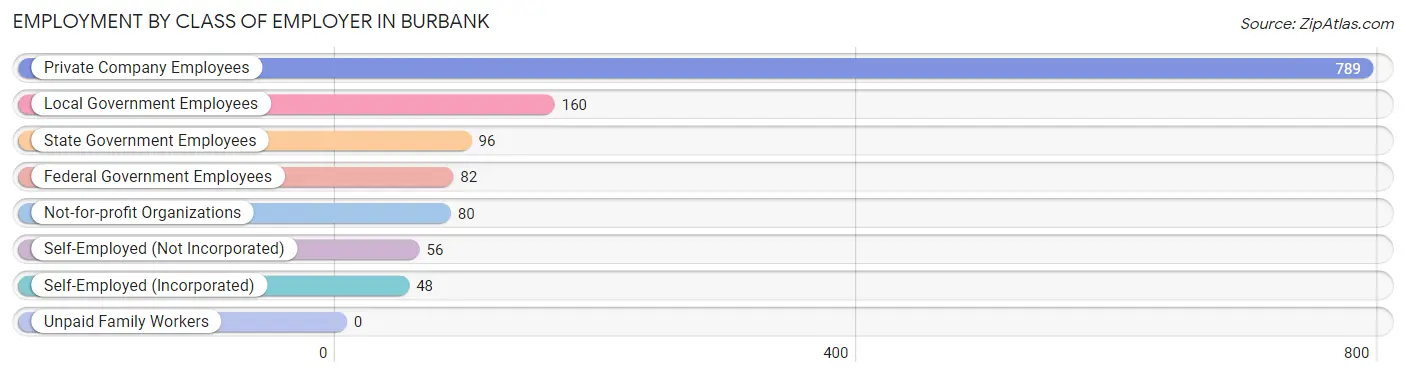
| Employer Class | # Employees | % Employees |
| Private Company Employees | 789 | 60.2% |
| Self-Employed (Incorporated) | 48 | 3.7% |
| Self-Employed (Not Incorporated) | 56 | 4.3% |
| Not-for-profit Organizations | 80 | 6.1% |
| Local Government Employees | 160 | 12.2% |
| State Government Employees | 96 | 7.3% |
| Federal Government Employees | 82 | 6.2% |
| Unpaid Family Workers | 0 | 0.0% |
| Total | 1,311 | 100.0% |
Employment Status by Age in Burbank
According to the labor force statistics for Burbank, out of the total population over 16 years of age (2,449), 62.0% or 1,518 individuals are in the labor force, with 10.9% or 165 of them unemployed. The age group with the highest labor force participation rate is 45 to 54 years, with 93.5% or 376 individuals in the labor force. Within the labor force, the 16 to 19 years age range has the highest percentage of unemployed individuals, with 40.4% or 23 of them being unemployed.
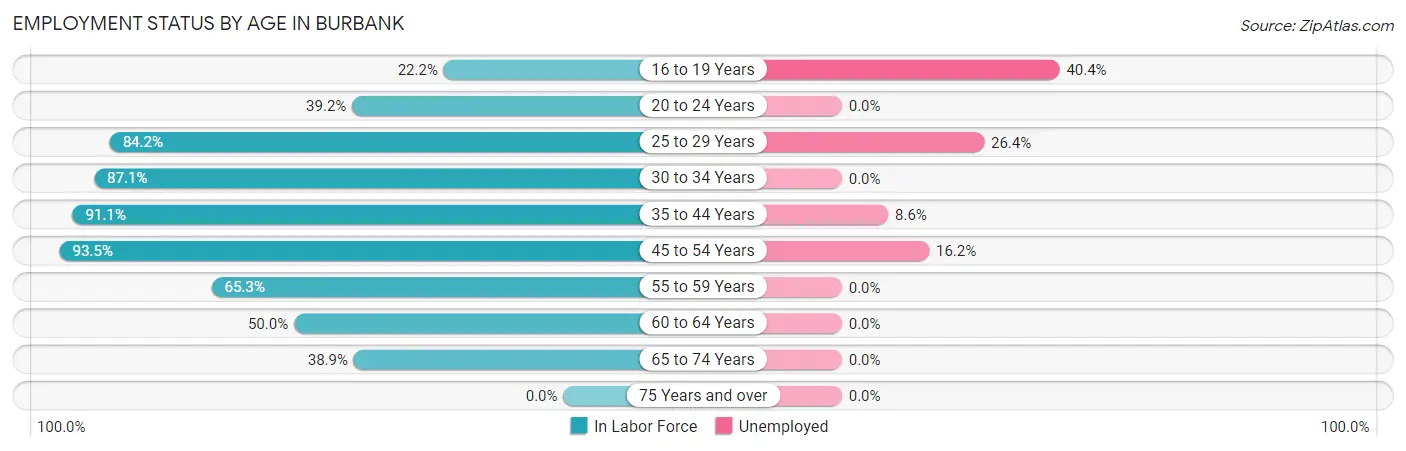
| Age Bracket | In Labor Force | Unemployed |
| 16 to 19 Years | 57 (22.2%) | 23 (40.4%) |
| 20 to 24 Years | 73 (39.2%) | 0 (0.0%) |
| 25 to 29 Years | 197 (84.2%) | 52 (26.4%) |
| 30 to 34 Years | 142 (87.1%) | 0 (0.0%) |
| 35 to 44 Years | 348 (91.1%) | 30 (8.6%) |
| 45 to 54 Years | 376 (93.5%) | 61 (16.2%) |
| 55 to 59 Years | 124 (65.3%) | 0 (0.0%) |
| 60 to 64 Years | 100 (50.0%) | 0 (0.0%) |
| 65 to 74 Years | 102 (38.9%) | 0 (0.0%) |
| 75 Years and over | 0 (0.0%) | 0 (0.0%) |
| Total | 1,518 (62.0%) | 165 (10.9%) |
Employment Status by Educational Attainment in Burbank
According to labor force statistics for Burbank, 81.9% of individuals (1,287) out of the total population between 25 and 64 years of age (1,571) are in the labor force, with 11.1% or 143 of them being unemployed. The group with the highest labor force participation rate are those with the educational attainment of less than high school, with 89.3% or 134 individuals in the labor force. Within the labor force, individuals with college / associate degree education have the highest percentage of unemployment, with 22.6% or 92 of them being unemployed.
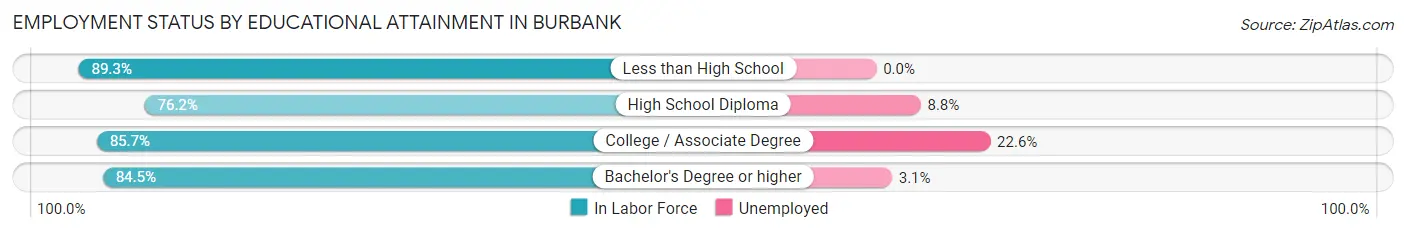
| Educational Attainment | In Labor Force | Unemployed |
| Less than High School | 134 (89.3%) | 0 (0.0%) |
| High School Diploma | 490 (76.2%) | 57 (8.8%) |
| College / Associate Degree | 407 (85.7%) | 107 (22.6%) |
| Bachelor's Degree or higher | 256 (84.5%) | 9 (3.1%) |
| Total | 1,287 (81.9%) | 174 (11.1%) |
Employment Occupations by Sex in Burbank
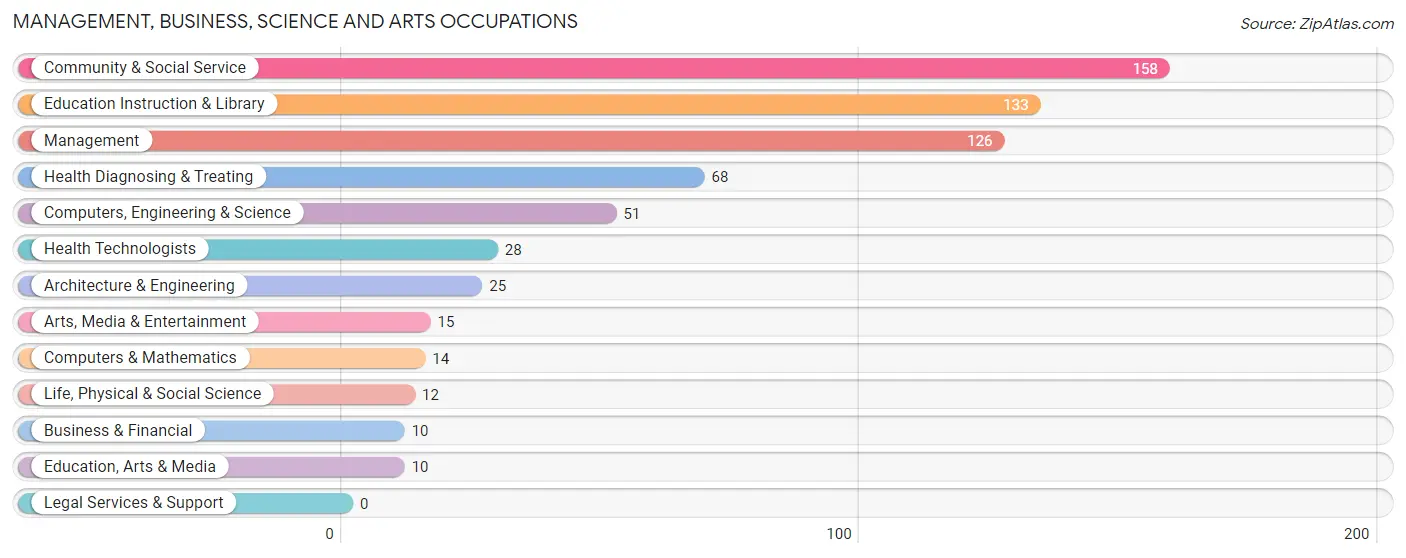
Management, Business, Science and Arts Occupations
The most common Management, Business, Science and Arts occupations in Burbank are Community & Social Service (158 | 11.7%), Education Instruction & Library (133 | 9.8%), Management (126 | 9.3%), Health Diagnosing & Treating (68 | 5.0%), and Computers, Engineering & Science (51 | 3.8%).
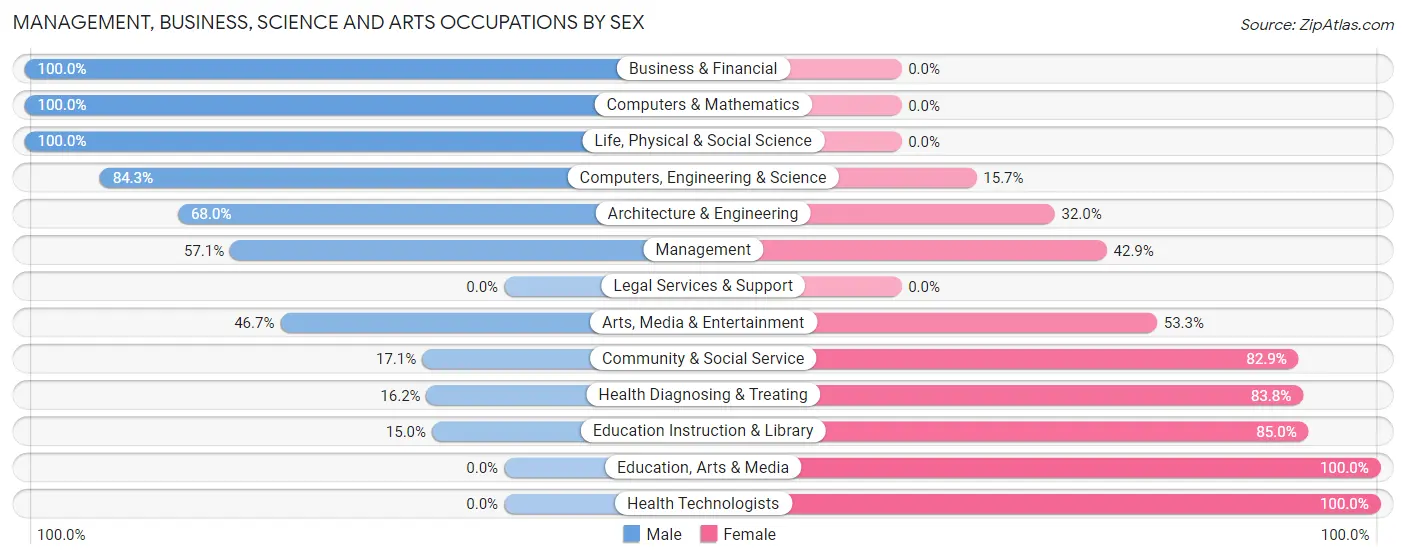
Management, Business, Science and Arts Occupations by Sex
Within the Management, Business, Science and Arts occupations in Burbank, the most male-oriented occupations are Business & Financial (100.0%), Computers & Mathematics (100.0%), and Life, Physical & Social Science (100.0%), while the most female-oriented occupations are Education, Arts & Media (100.0%), Health Technologists (100.0%), and Education Instruction & Library (85.0%).
| Occupation | Male | Female |
| Management | 72 (57.1%) | 54 (42.9%) |
| Business & Financial | 10 (100.0%) | 0 (0.0%) |
| Computers, Engineering & Science | 43 (84.3%) | 8 (15.7%) |
| Computers & Mathematics | 14 (100.0%) | 0 (0.0%) |
| Architecture & Engineering | 17 (68.0%) | 8 (32.0%) |
| Life, Physical & Social Science | 12 (100.0%) | 0 (0.0%) |
| Community & Social Service | 27 (17.1%) | 131 (82.9%) |
| Education, Arts & Media | 0 (0.0%) | 10 (100.0%) |
| Legal Services & Support | 0 (0.0%) | 0 (0.0%) |
| Education Instruction & Library | 20 (15.0%) | 113 (85.0%) |
| Arts, Media & Entertainment | 7 (46.7%) | 8 (53.3%) |
| Health Diagnosing & Treating | 11 (16.2%) | 57 (83.8%) |
| Health Technologists | 0 (0.0%) | 28 (100.0%) |
| Total (Category) | 163 (39.5%) | 250 (60.5%) |
| Total (Overall) | 779 (57.6%) | 574 (42.4%) |
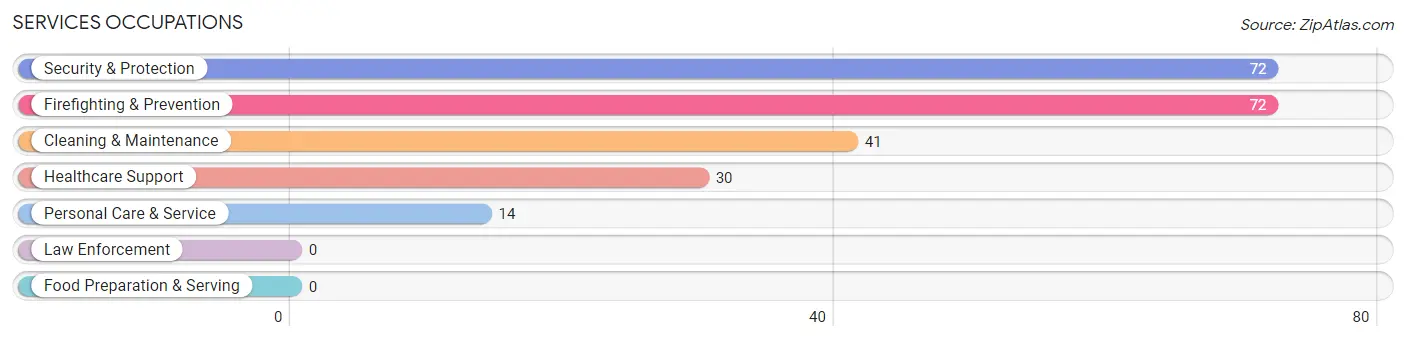
Services Occupations
The most common Services occupations in Burbank are Security & Protection (72 | 5.3%), Firefighting & Prevention (72 | 5.3%), Cleaning & Maintenance (41 | 3.0%), Healthcare Support (30 | 2.2%), and Personal Care & Service (14 | 1.0%).
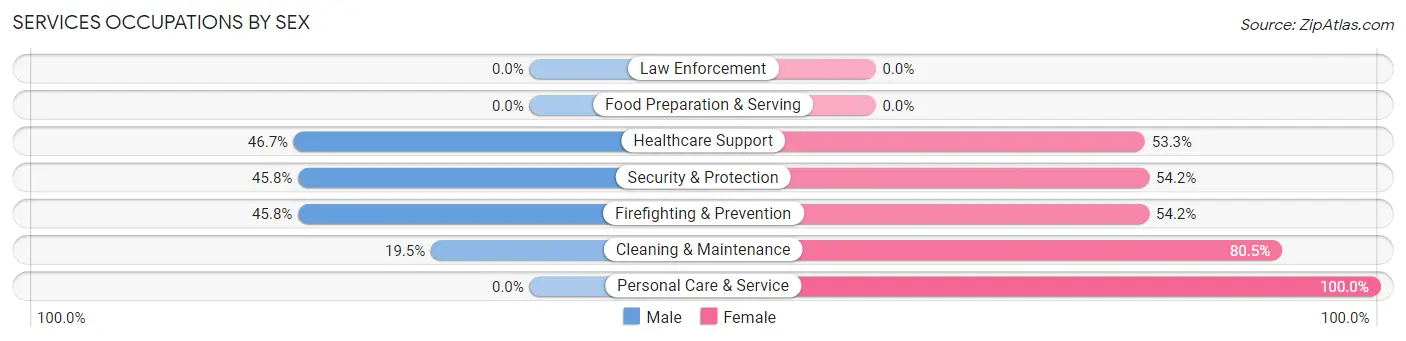
Services Occupations by Sex
Within the Services occupations in Burbank, the most male-oriented occupations are Healthcare Support (46.7%), Security & Protection (45.8%), and Firefighting & Prevention (45.8%), while the most female-oriented occupations are Personal Care & Service (100.0%), Cleaning & Maintenance (80.5%), and Security & Protection (54.2%).
| Occupation | Male | Female |
| Healthcare Support | 14 (46.7%) | 16 (53.3%) |
| Security & Protection | 33 (45.8%) | 39 (54.2%) |
| Firefighting & Prevention | 33 (45.8%) | 39 (54.2%) |
| Law Enforcement | 0 (0.0%) | 0 (0.0%) |
| Food Preparation & Serving | 0 (0.0%) | 0 (0.0%) |
| Cleaning & Maintenance | 8 (19.5%) | 33 (80.5%) |
| Personal Care & Service | 0 (0.0%) | 14 (100.0%) |
| Total (Category) | 55 (35.0%) | 102 (65.0%) |
| Total (Overall) | 779 (57.6%) | 574 (42.4%) |
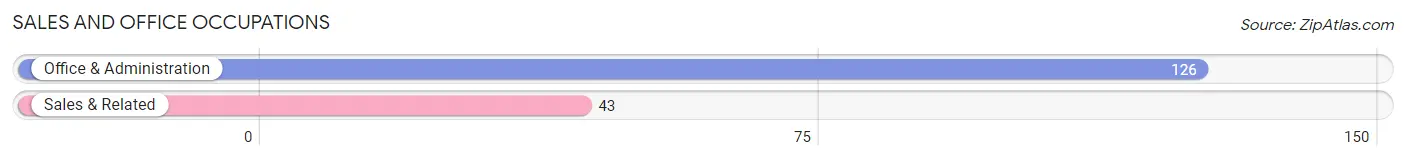
Sales and Office Occupations
The most common Sales and Office occupations in Burbank are Office & Administration (126 | 9.3%), and Sales & Related (43 | 3.2%).
Sales and Office Occupations by Sex
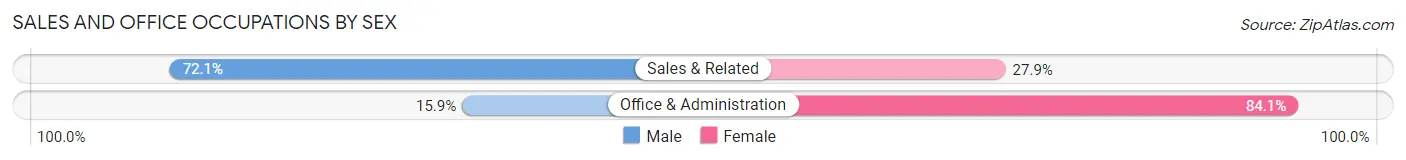
| Occupation | Male | Female |
| Sales & Related | 31 (72.1%) | 12 (27.9%) |
| Office & Administration | 20 (15.9%) | 106 (84.1%) |
| Total (Category) | 51 (30.2%) | 118 (69.8%) |
| Total (Overall) | 779 (57.6%) | 574 (42.4%) |
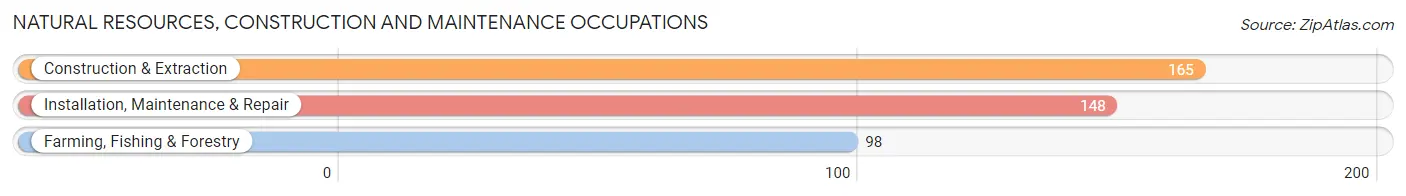
Natural Resources, Construction and Maintenance Occupations
The most common Natural Resources, Construction and Maintenance occupations in Burbank are Construction & Extraction (165 | 12.2%), Installation, Maintenance & Repair (148 | 10.9%), and Farming, Fishing & Forestry (98 | 7.2%).
Natural Resources, Construction and Maintenance Occupations by Sex
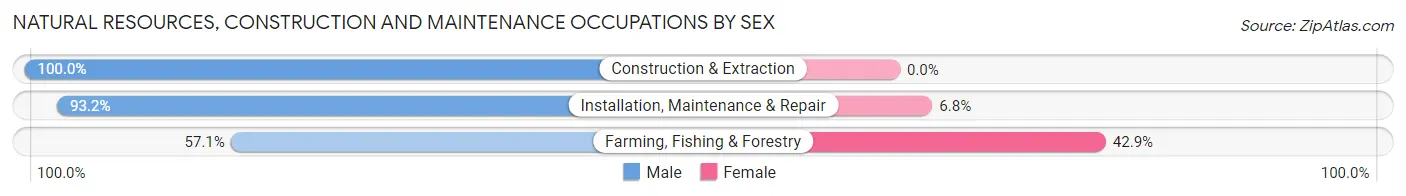
| Occupation | Male | Female |
| Farming, Fishing & Forestry | 56 (57.1%) | 42 (42.9%) |
| Construction & Extraction | 165 (100.0%) | 0 (0.0%) |
| Installation, Maintenance & Repair | 138 (93.2%) | 10 (6.8%) |
| Total (Category) | 359 (87.4%) | 52 (12.7%) |
| Total (Overall) | 779 (57.6%) | 574 (42.4%) |
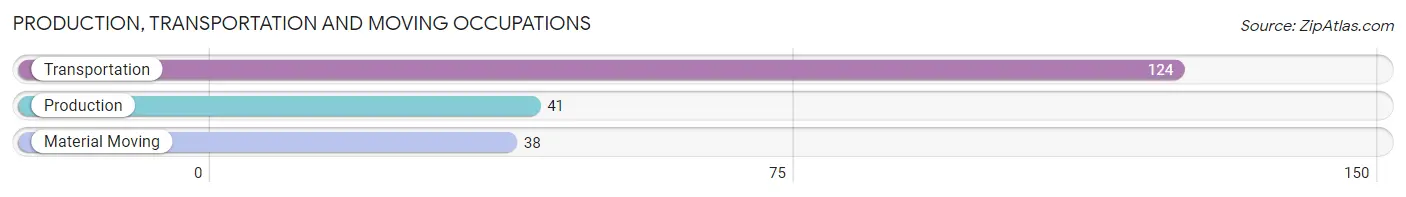
Production, Transportation and Moving Occupations
The most common Production, Transportation and Moving occupations in Burbank are Transportation (124 | 9.2%), Production (41 | 3.0%), and Material Moving (38 | 2.8%).
Production, Transportation and Moving Occupations by Sex
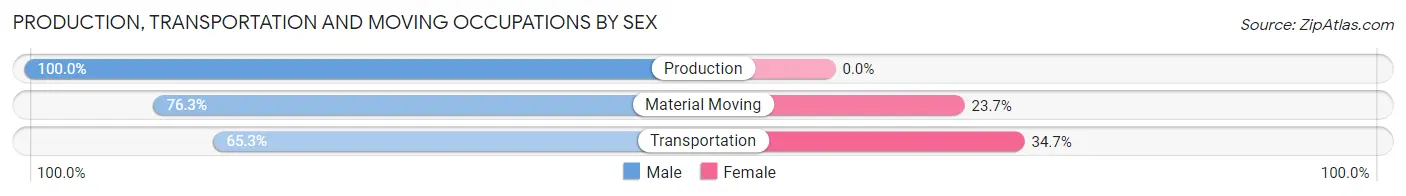
| Occupation | Male | Female |
| Production | 41 (100.0%) | 0 (0.0%) |
| Transportation | 81 (65.3%) | 43 (34.7%) |
| Material Moving | 29 (76.3%) | 9 (23.7%) |
| Total (Category) | 151 (74.4%) | 52 (25.6%) |
| Total (Overall) | 779 (57.6%) | 574 (42.4%) |
Employment Industries by Sex in Burbank
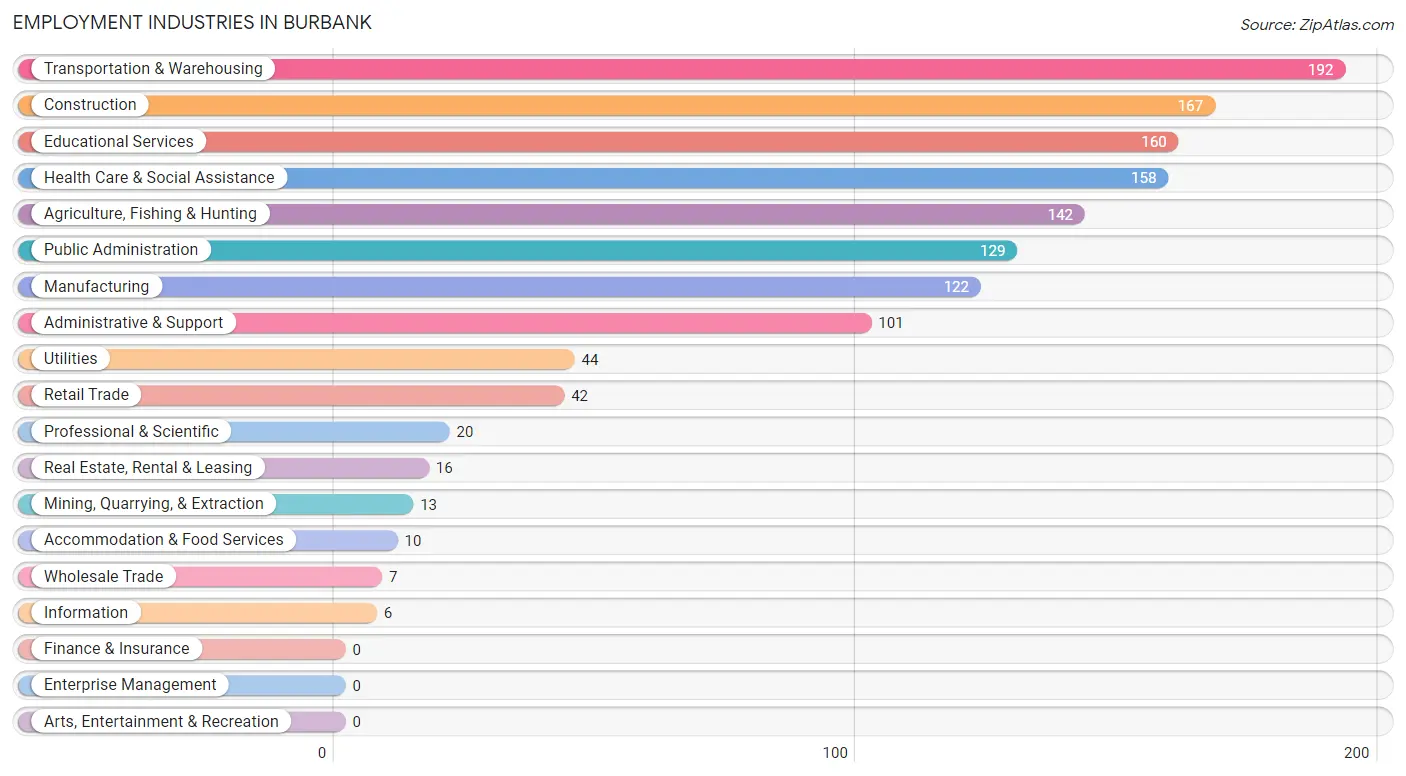
Employment Industries in Burbank
The major employment industries in Burbank include Transportation & Warehousing (192 | 14.2%), Construction (167 | 12.3%), Educational Services (160 | 11.8%), Health Care & Social Assistance (158 | 11.7%), and Agriculture, Fishing & Hunting (142 | 10.5%).
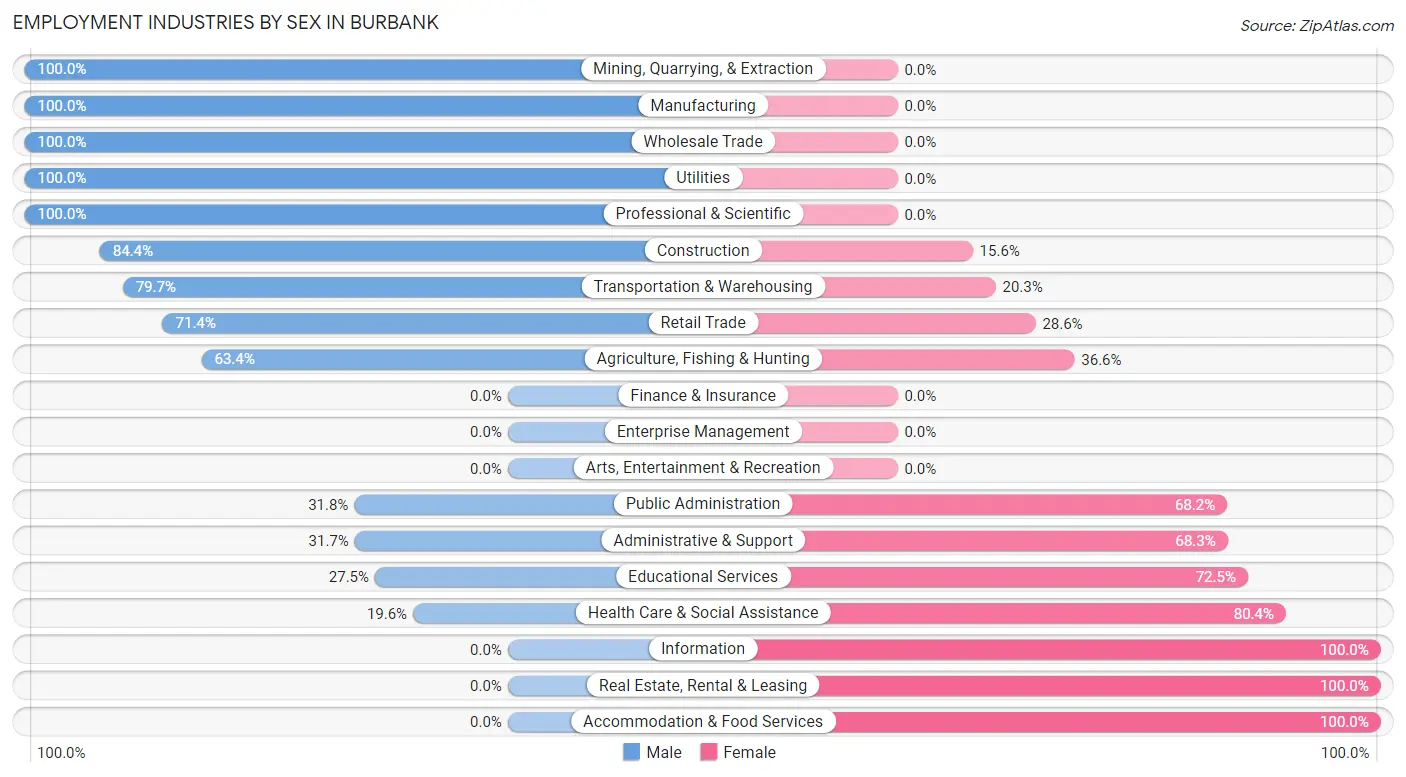
Employment Industries by Sex in Burbank
The Burbank industries that see more men than women are Mining, Quarrying, & Extraction (100.0%), Manufacturing (100.0%), and Wholesale Trade (100.0%), whereas the industries that tend to have a higher number of women are Information (100.0%), Real Estate, Rental & Leasing (100.0%), and Accommodation & Food Services (100.0%).
| Industry | Male | Female |
| Agriculture, Fishing & Hunting | 90 (63.4%) | 52 (36.6%) |
| Mining, Quarrying, & Extraction | 13 (100.0%) | 0 (0.0%) |
| Construction | 141 (84.4%) | 26 (15.6%) |
| Manufacturing | 122 (100.0%) | 0 (0.0%) |
| Wholesale Trade | 7 (100.0%) | 0 (0.0%) |
| Retail Trade | 30 (71.4%) | 12 (28.6%) |
| Transportation & Warehousing | 153 (79.7%) | 39 (20.3%) |
| Utilities | 44 (100.0%) | 0 (0.0%) |
| Information | 0 (0.0%) | 6 (100.0%) |
| Finance & Insurance | 0 (0.0%) | 0 (0.0%) |
| Real Estate, Rental & Leasing | 0 (0.0%) | 16 (100.0%) |
| Professional & Scientific | 20 (100.0%) | 0 (0.0%) |
| Enterprise Management | 0 (0.0%) | 0 (0.0%) |
| Administrative & Support | 32 (31.7%) | 69 (68.3%) |
| Educational Services | 44 (27.5%) | 116 (72.5%) |
| Health Care & Social Assistance | 31 (19.6%) | 127 (80.4%) |
| Arts, Entertainment & Recreation | 0 (0.0%) | 0 (0.0%) |
| Accommodation & Food Services | 0 (0.0%) | 10 (100.0%) |
| Public Administration | 41 (31.8%) | 88 (68.2%) |
| Total | 779 (57.6%) | 574 (42.4%) |
Education in Burbank
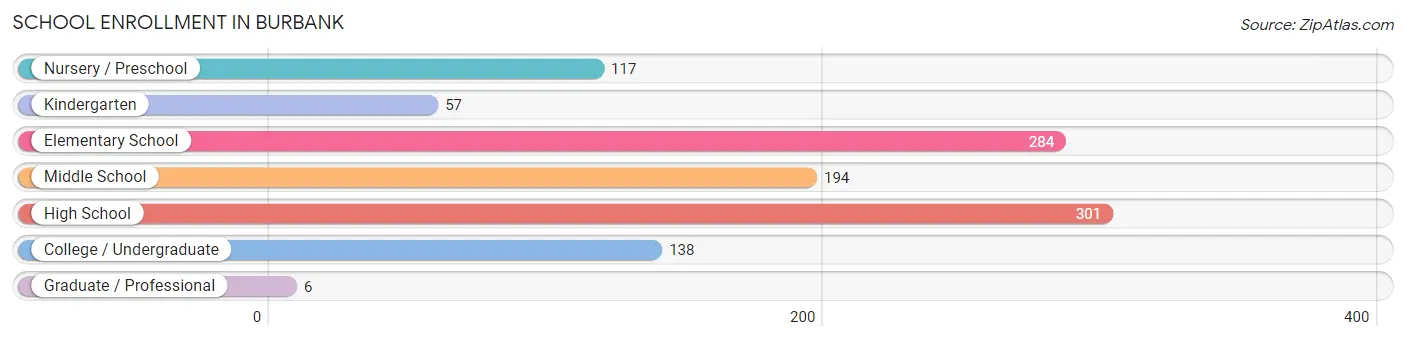
School Enrollment in Burbank
The most common levels of schooling among the 1,097 students in Burbank are high school (301 | 27.4%), elementary school (284 | 25.9%), and middle school (194 | 17.7%).
| School Level | # Students | % Students |
| Nursery / Preschool | 117 | 10.7% |
| Kindergarten | 57 | 5.2% |
| Elementary School | 284 | 25.9% |
| Middle School | 194 | 17.7% |
| High School | 301 | 27.4% |
| College / Undergraduate | 138 | 12.6% |
| Graduate / Professional | 6 | 0.5% |
| Total | 1,097 | 100.0% |
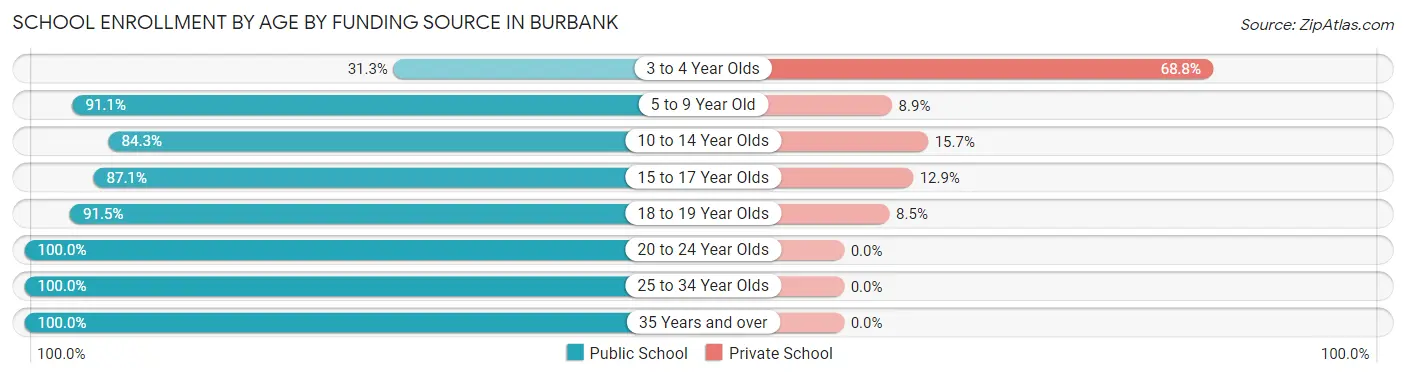
School Enrollment by Age by Funding Source in Burbank
Out of a total of 1,097 students who are enrolled in schools in Burbank, 118 (10.8%) attend a private institution, while the remaining 979 (89.2%) are enrolled in public schools. The age group of 3 to 4 year olds has the highest likelihood of being enrolled in private schools, with 11 (68.8% in the age bracket) enrolled. Conversely, the age group of 20 to 24 year olds has the lowest likelihood of being enrolled in a private school, with 81 (100.0% in the age bracket) attending a public institution.
| Age Bracket | Public School | Private School |
| 3 to 4 Year Olds | 5 (31.2%) | 11 (68.8%) |
| 5 to 9 Year Old | 326 (91.1%) | 32 (8.9%) |
| 10 to 14 Year Olds | 210 (84.3%) | 39 (15.7%) |
| 15 to 17 Year Olds | 183 (87.1%) | 27 (12.9%) |
| 18 to 19 Year Olds | 108 (91.5%) | 10 (8.5%) |
| 20 to 24 Year Olds | 81 (100.0%) | 0 (0.0%) |
| 25 to 34 Year Olds | 30 (100.0%) | 0 (0.0%) |
| 35 Years and over | 35 (100.0%) | 0 (0.0%) |
| Total | 979 (89.2%) | 118 (10.8%) |
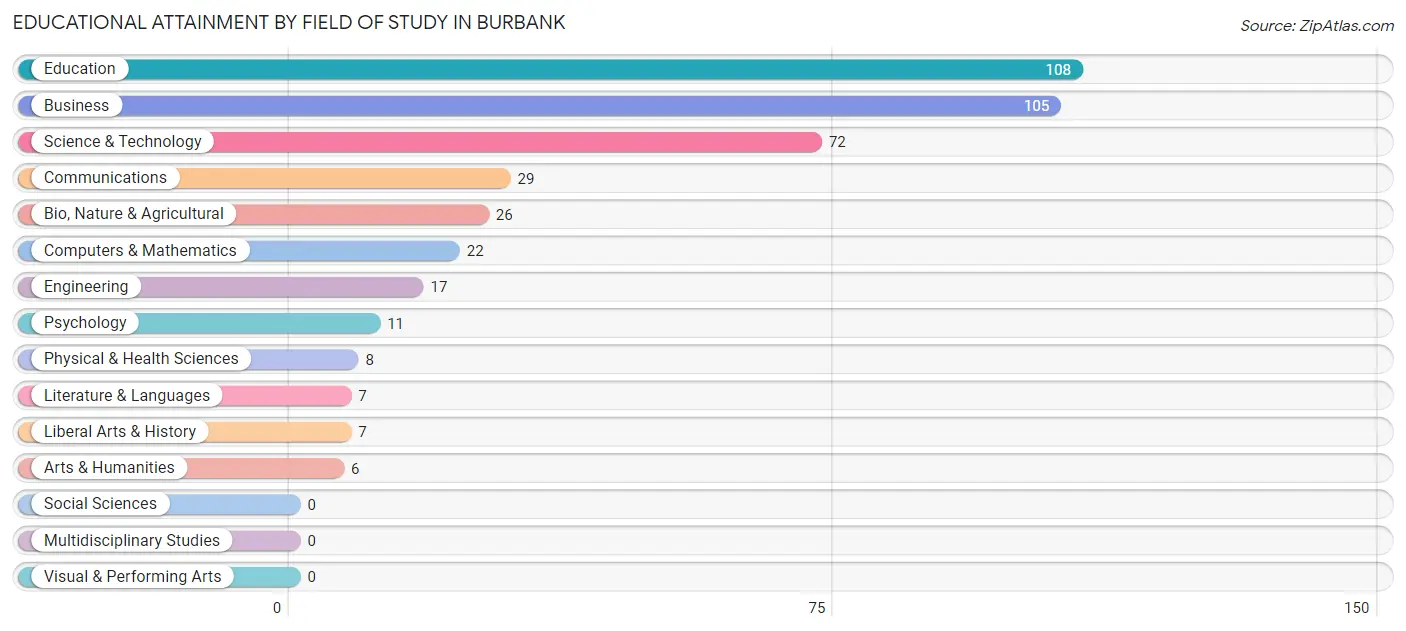
Educational Attainment by Field of Study in Burbank
Education (108 | 25.8%), business (105 | 25.1%), science & technology (72 | 17.2%), communications (29 | 6.9%), and bio, nature & agricultural (26 | 6.2%) are the most common fields of study among 418 individuals in Burbank who have obtained a bachelor's degree or higher.
| Field of Study | # Graduates | % Graduates |
| Computers & Mathematics | 22 | 5.3% |
| Bio, Nature & Agricultural | 26 | 6.2% |
| Physical & Health Sciences | 8 | 1.9% |
| Psychology | 11 | 2.6% |
| Social Sciences | 0 | 0.0% |
| Engineering | 17 | 4.1% |
| Multidisciplinary Studies | 0 | 0.0% |
| Science & Technology | 72 | 17.2% |
| Business | 105 | 25.1% |
| Education | 108 | 25.8% |
| Literature & Languages | 7 | 1.7% |
| Liberal Arts & History | 7 | 1.7% |
| Visual & Performing Arts | 0 | 0.0% |
| Communications | 29 | 6.9% |
| Arts & Humanities | 6 | 1.4% |
| Total | 418 | 100.0% |
Transportation & Commute in Burbank
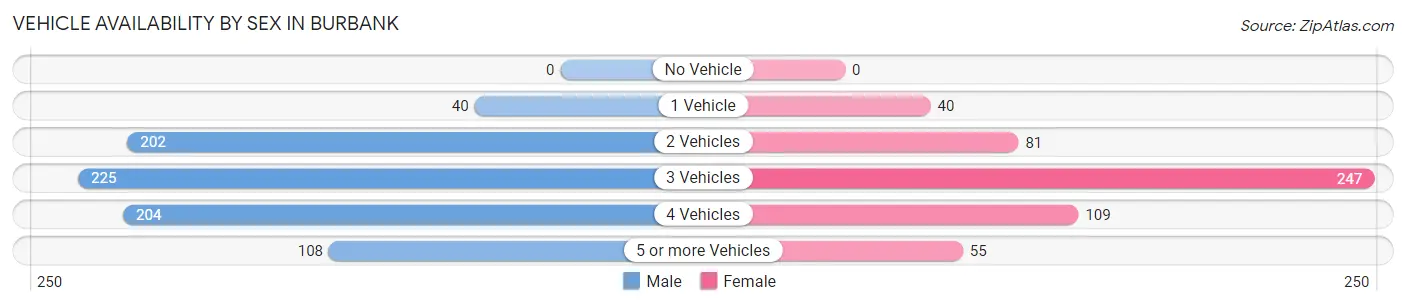
Vehicle Availability by Sex in Burbank
The most prevalent vehicle ownership categories in Burbank are males with 3 vehicles (225, accounting for 28.9%) and females with 3 vehicles (247, making up 42.3%).
| Vehicles Available | Male | Female |
| No Vehicle | 0 (0.0%) | 0 (0.0%) |
| 1 Vehicle | 40 (5.1%) | 40 (7.5%) |
| 2 Vehicles | 202 (25.9%) | 81 (15.2%) |
| 3 Vehicles | 225 (28.9%) | 247 (46.4%) |
| 4 Vehicles | 204 (26.2%) | 109 (20.5%) |
| 5 or more Vehicles | 108 (13.9%) | 55 (10.3%) |
| Total | 779 (100.0%) | 532 (100.0%) |
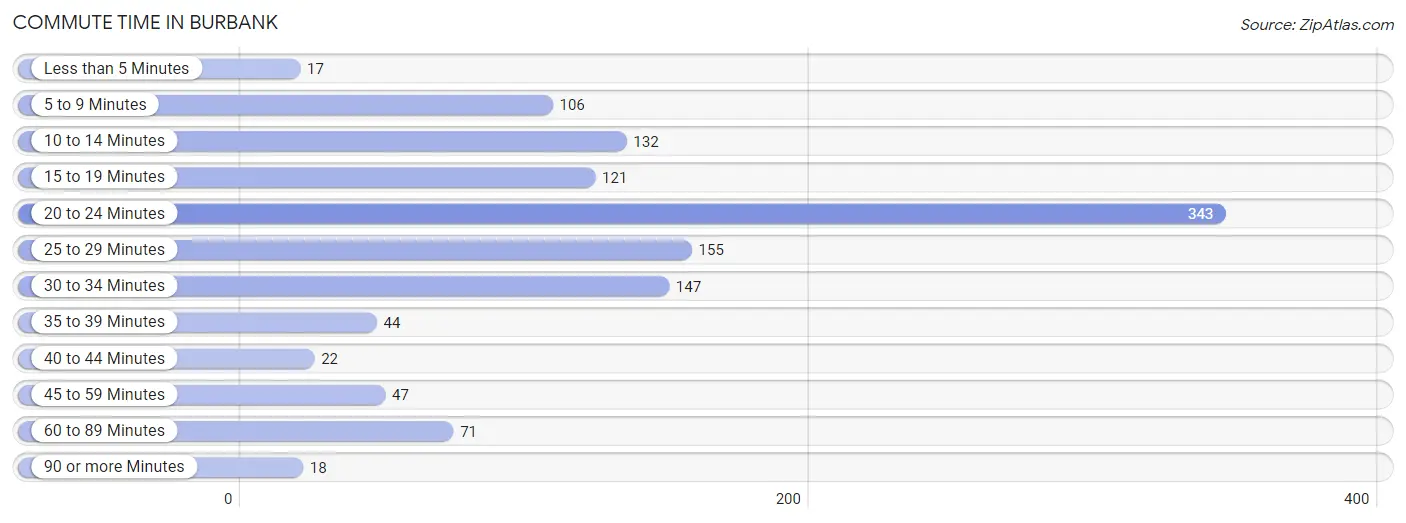
Commute Time in Burbank
The most frequently occuring commute durations in Burbank are 20 to 24 minutes (343 commuters, 28.1%), 25 to 29 minutes (155 commuters, 12.7%), and 30 to 34 minutes (147 commuters, 12.0%).
| Commute Time | # Commuters | % Commuters |
| Less than 5 Minutes | 17 | 1.4% |
| 5 to 9 Minutes | 106 | 8.7% |
| 10 to 14 Minutes | 132 | 10.8% |
| 15 to 19 Minutes | 121 | 9.9% |
| 20 to 24 Minutes | 343 | 28.1% |
| 25 to 29 Minutes | 155 | 12.7% |
| 30 to 34 Minutes | 147 | 12.0% |
| 35 to 39 Minutes | 44 | 3.6% |
| 40 to 44 Minutes | 22 | 1.8% |
| 45 to 59 Minutes | 47 | 3.8% |
| 60 to 89 Minutes | 71 | 5.8% |
| 90 or more Minutes | 18 | 1.5% |
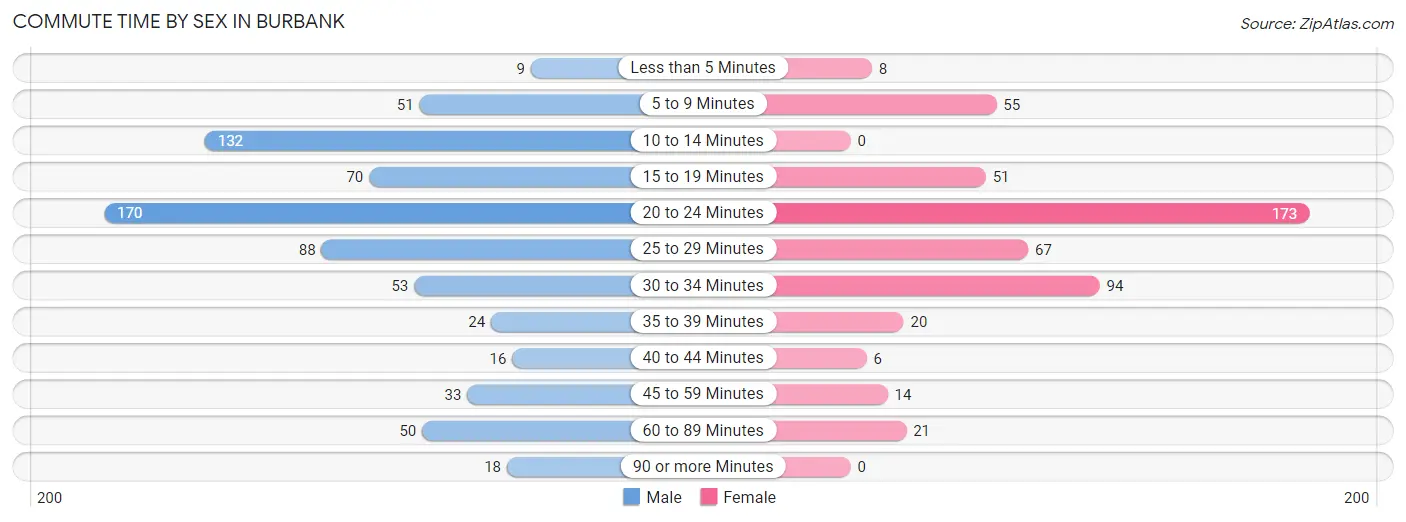
Commute Time by Sex in Burbank
The most common commute times in Burbank are 20 to 24 minutes (170 commuters, 23.8%) for males and 20 to 24 minutes (173 commuters, 34.0%) for females.
| Commute Time | Male | Female |
| Less than 5 Minutes | 9 (1.3%) | 8 (1.6%) |
| 5 to 9 Minutes | 51 (7.1%) | 55 (10.8%) |
| 10 to 14 Minutes | 132 (18.5%) | 0 (0.0%) |
| 15 to 19 Minutes | 70 (9.8%) | 51 (10.0%) |
| 20 to 24 Minutes | 170 (23.8%) | 173 (34.0%) |
| 25 to 29 Minutes | 88 (12.3%) | 67 (13.2%) |
| 30 to 34 Minutes | 53 (7.4%) | 94 (18.5%) |
| 35 to 39 Minutes | 24 (3.4%) | 20 (3.9%) |
| 40 to 44 Minutes | 16 (2.2%) | 6 (1.2%) |
| 45 to 59 Minutes | 33 (4.6%) | 14 (2.8%) |
| 60 to 89 Minutes | 50 (7.0%) | 21 (4.1%) |
| 90 or more Minutes | 18 (2.5%) | 0 (0.0%) |
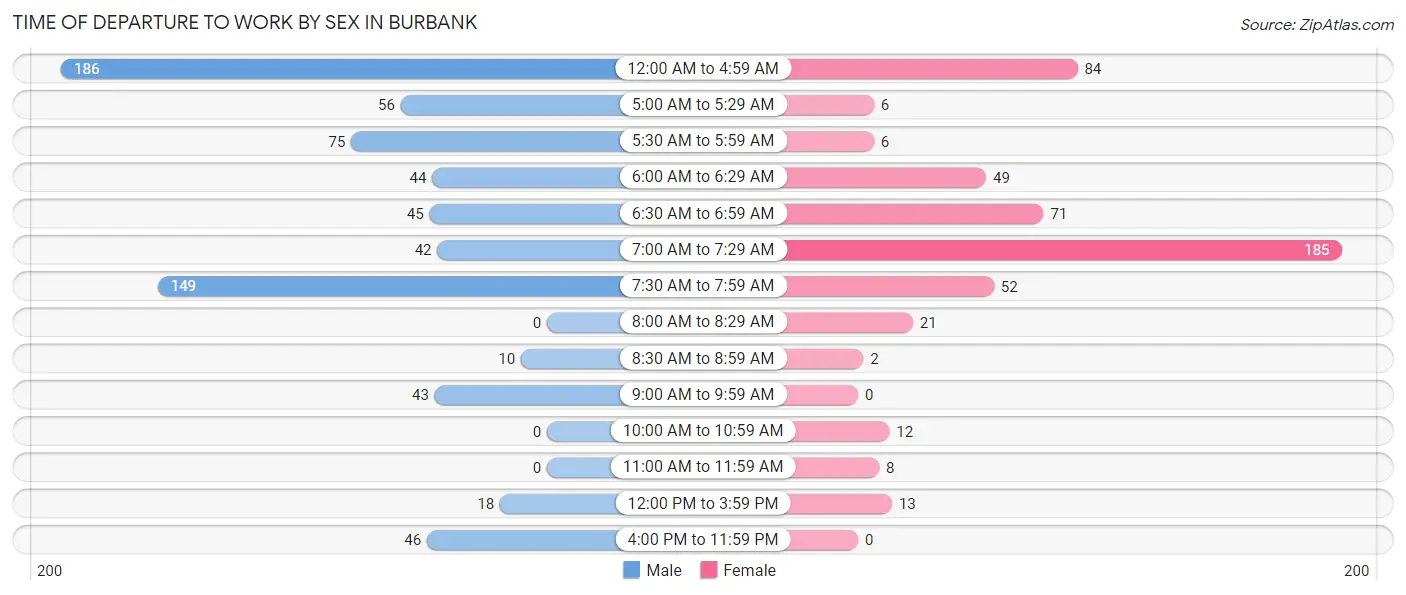
Time of Departure to Work by Sex in Burbank
The most frequent times of departure to work in Burbank are 12:00 AM to 4:59 AM (186, 26.1%) for males and 7:00 AM to 7:29 AM (185, 36.3%) for females.
| Time of Departure | Male | Female |
| 12:00 AM to 4:59 AM | 186 (26.1%) | 84 (16.5%) |
| 5:00 AM to 5:29 AM | 56 (7.8%) | 6 (1.2%) |
| 5:30 AM to 5:59 AM | 75 (10.5%) | 6 (1.2%) |
| 6:00 AM to 6:29 AM | 44 (6.2%) | 49 (9.6%) |
| 6:30 AM to 6:59 AM | 45 (6.3%) | 71 (14.0%) |
| 7:00 AM to 7:29 AM | 42 (5.9%) | 185 (36.3%) |
| 7:30 AM to 7:59 AM | 149 (20.9%) | 52 (10.2%) |
| 8:00 AM to 8:29 AM | 0 (0.0%) | 21 (4.1%) |
| 8:30 AM to 8:59 AM | 10 (1.4%) | 2 (0.4%) |
| 9:00 AM to 9:59 AM | 43 (6.0%) | 0 (0.0%) |
| 10:00 AM to 10:59 AM | 0 (0.0%) | 12 (2.4%) |
| 11:00 AM to 11:59 AM | 0 (0.0%) | 8 (1.6%) |
| 12:00 PM to 3:59 PM | 18 (2.5%) | 13 (2.5%) |
| 4:00 PM to 11:59 PM | 46 (6.4%) | 0 (0.0%) |
| Total | 714 (100.0%) | 509 (100.0%) |
Housing Occupancy in Burbank
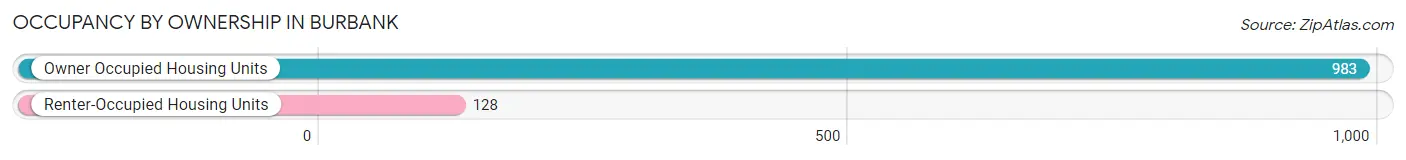
Occupancy by Ownership in Burbank
Of the total 1,111 dwellings in Burbank, owner-occupied units account for 983 (88.5%), while renter-occupied units make up 128 (11.5%).
| Occupancy | # Housing Units | % Housing Units |
| Owner Occupied Housing Units | 983 | 88.5% |
| Renter-Occupied Housing Units | 128 | 11.5% |
| Total Occupied Housing Units | 1,111 | 100.0% |
Occupancy by Household Size in Burbank
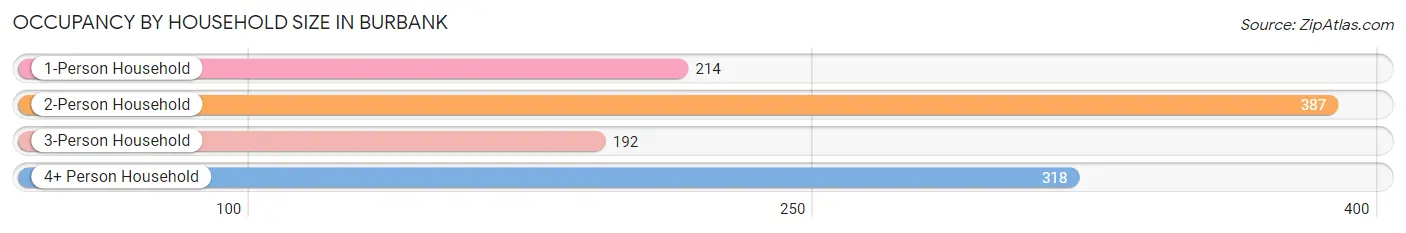
| Household Size | # Housing Units | % Housing Units |
| 1-Person Household | 214 | 19.3% |
| 2-Person Household | 387 | 34.8% |
| 3-Person Household | 192 | 17.3% |
| 4+ Person Household | 318 | 28.6% |
| Total Housing Units | 1,111 | 100.0% |
Occupancy by Ownership by Household Size in Burbank
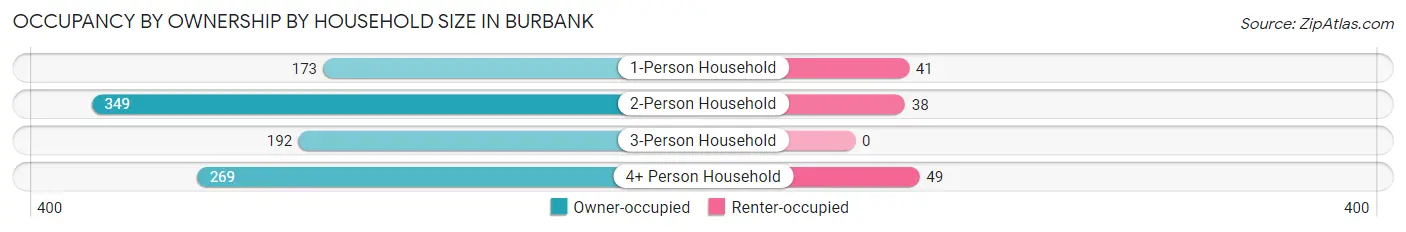
| Household Size | Owner-occupied | Renter-occupied |
| 1-Person Household | 173 (80.8%) | 41 (19.2%) |
| 2-Person Household | 349 (90.2%) | 38 (9.8%) |
| 3-Person Household | 192 (100.0%) | 0 (0.0%) |
| 4+ Person Household | 269 (84.6%) | 49 (15.4%) |
| Total Housing Units | 983 (88.5%) | 128 (11.5%) |
Occupancy by Educational Attainment in Burbank
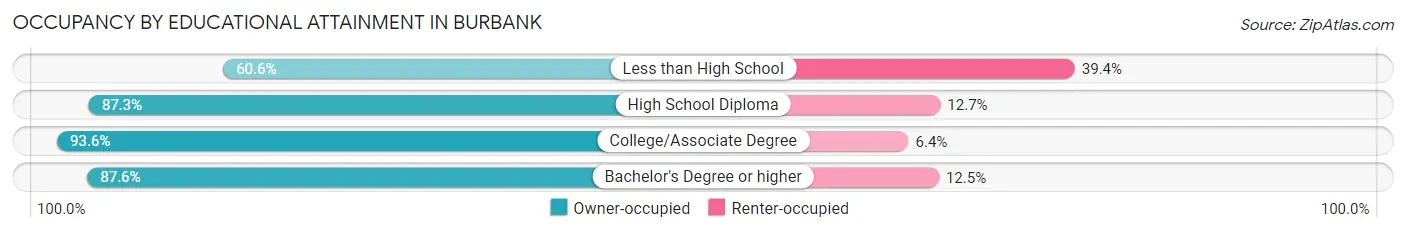
| Household Size | Owner-occupied | Renter-occupied |
| Less than High School | 20 (60.6%) | 13 (39.4%) |
| High School Diploma | 411 (87.3%) | 60 (12.7%) |
| College/Associate Degree | 320 (93.6%) | 22 (6.4%) |
| Bachelor's Degree or higher | 232 (87.5%) | 33 (12.4%) |
Occupancy by Age of Householder in Burbank
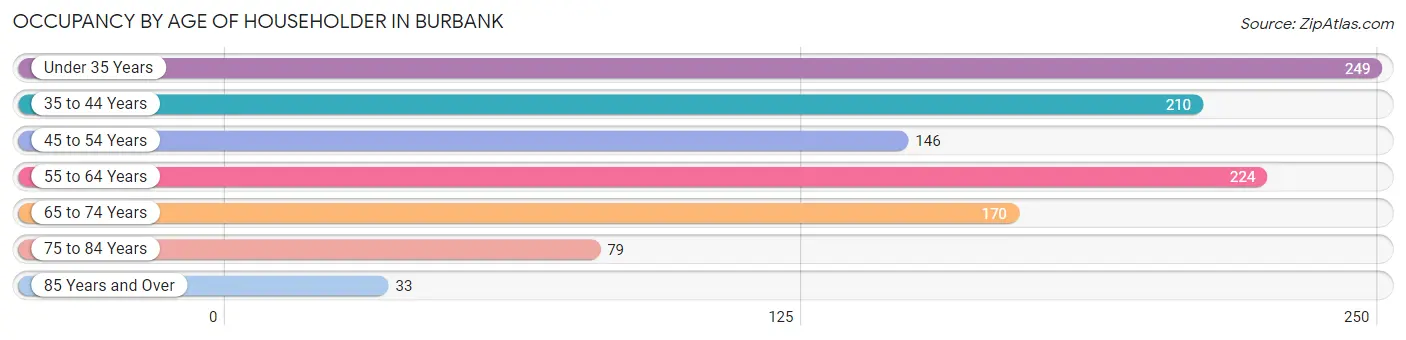
| Age Bracket | # Households | % Households |
| Under 35 Years | 249 | 22.4% |
| 35 to 44 Years | 210 | 18.9% |
| 45 to 54 Years | 146 | 13.1% |
| 55 to 64 Years | 224 | 20.2% |
| 65 to 74 Years | 170 | 15.3% |
| 75 to 84 Years | 79 | 7.1% |
| 85 Years and Over | 33 | 3.0% |
| Total | 1,111 | 100.0% |
Housing Finances in Burbank
Median Income by Occupancy in Burbank
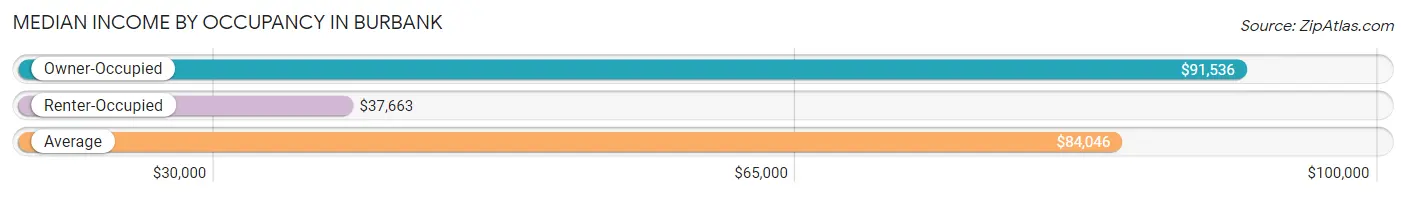
| Occupancy Type | # Households | Median Income |
| Owner-Occupied | 983 (88.5%) | $91,536 |
| Renter-Occupied | 128 (11.5%) | $37,663 |
| Average | 1,111 (100.0%) | $84,046 |
Occupancy by Householder Income Bracket in Burbank
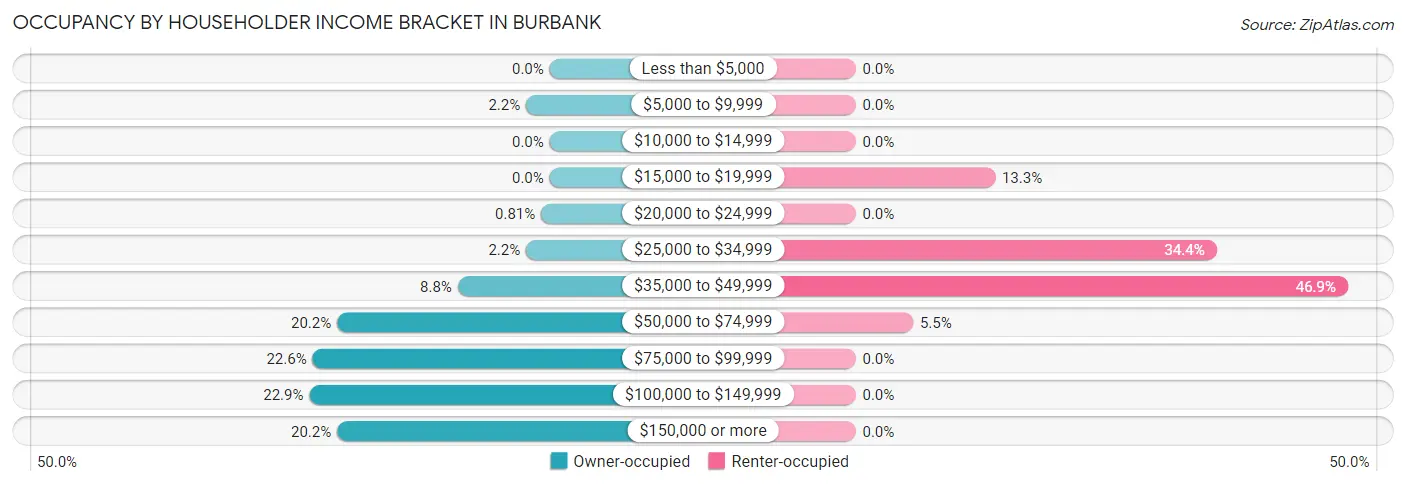
| Income Bracket | Owner-occupied | Renter-occupied |
| Less than $5,000 | 0 (0.0%) | 0 (0.0%) |
| $5,000 to $9,999 | 22 (2.2%) | 0 (0.0%) |
| $10,000 to $14,999 | 0 (0.0%) | 0 (0.0%) |
| $15,000 to $19,999 | 0 (0.0%) | 17 (13.3%) |
| $20,000 to $24,999 | 8 (0.8%) | 0 (0.0%) |
| $25,000 to $34,999 | 22 (2.2%) | 44 (34.4%) |
| $35,000 to $49,999 | 86 (8.7%) | 60 (46.9%) |
| $50,000 to $74,999 | 199 (20.2%) | 7 (5.5%) |
| $75,000 to $99,999 | 222 (22.6%) | 0 (0.0%) |
| $100,000 to $149,999 | 225 (22.9%) | 0 (0.0%) |
| $150,000 or more | 199 (20.2%) | 0 (0.0%) |
| Total | 983 (100.0%) | 128 (100.0%) |
Monthly Housing Cost Tiers in Burbank
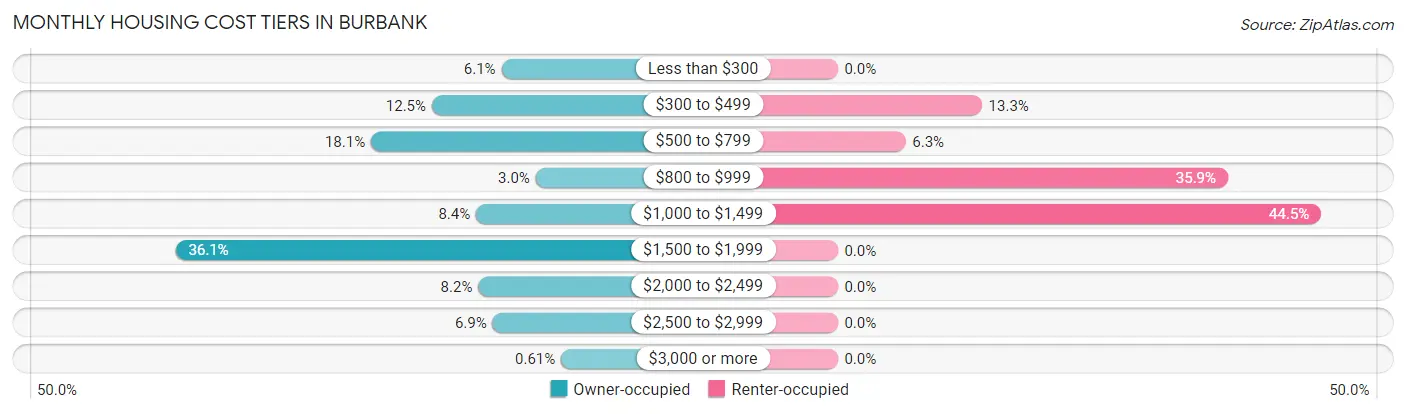
| Monthly Cost | Owner-occupied | Renter-occupied |
| Less than $300 | 60 (6.1%) | 0 (0.0%) |
| $300 to $499 | 123 (12.5%) | 17 (13.3%) |
| $500 to $799 | 178 (18.1%) | 8 (6.2%) |
| $800 to $999 | 29 (2.9%) | 46 (35.9%) |
| $1,000 to $1,499 | 83 (8.4%) | 57 (44.5%) |
| $1,500 to $1,999 | 355 (36.1%) | 0 (0.0%) |
| $2,000 to $2,499 | 81 (8.2%) | 0 (0.0%) |
| $2,500 to $2,999 | 68 (6.9%) | 0 (0.0%) |
| $3,000 or more | 6 (0.6%) | 0 (0.0%) |
| Total | 983 (100.0%) | 128 (100.0%) |
Physical Housing Characteristics in Burbank
Housing Structures in Burbank
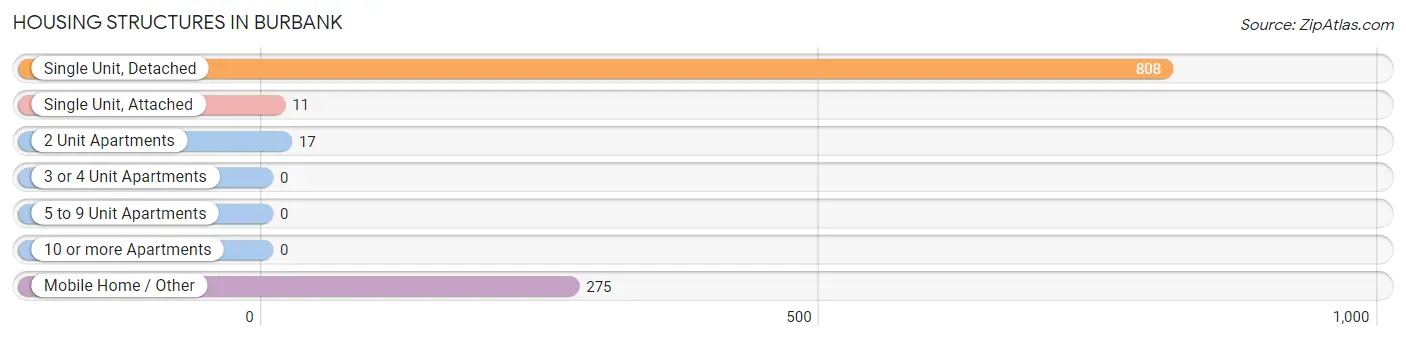
| Structure Type | # Housing Units | % Housing Units |
| Single Unit, Detached | 808 | 72.7% |
| Single Unit, Attached | 11 | 1.0% |
| 2 Unit Apartments | 17 | 1.5% |
| 3 or 4 Unit Apartments | 0 | 0.0% |
| 5 to 9 Unit Apartments | 0 | 0.0% |
| 10 or more Apartments | 0 | 0.0% |
| Mobile Home / Other | 275 | 24.7% |
| Total | 1,111 | 100.0% |
Housing Structures by Occupancy in Burbank
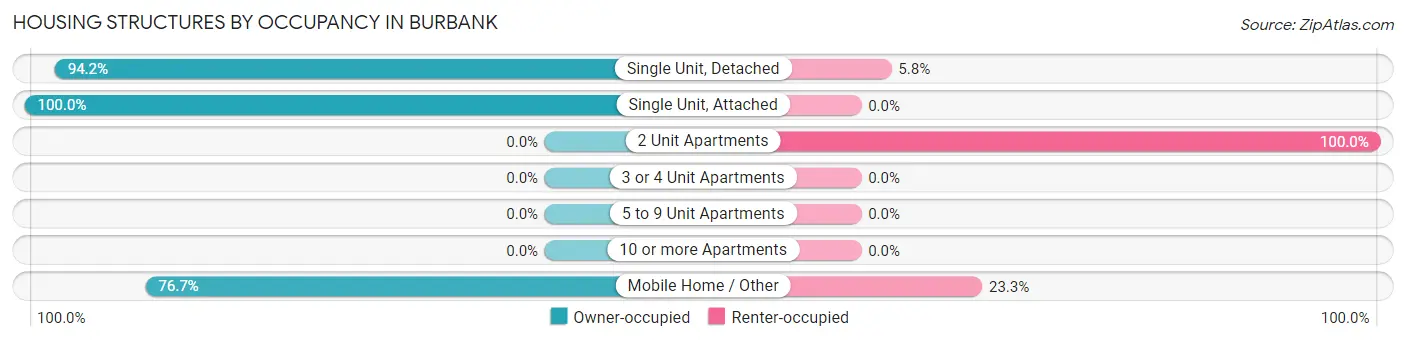
| Structure Type | Owner-occupied | Renter-occupied |
| Single Unit, Detached | 761 (94.2%) | 47 (5.8%) |
| Single Unit, Attached | 11 (100.0%) | 0 (0.0%) |
| 2 Unit Apartments | 0 (0.0%) | 17 (100.0%) |
| 3 or 4 Unit Apartments | 0 (0.0%) | 0 (0.0%) |
| 5 to 9 Unit Apartments | 0 (0.0%) | 0 (0.0%) |
| 10 or more Apartments | 0 (0.0%) | 0 (0.0%) |
| Mobile Home / Other | 211 (76.7%) | 64 (23.3%) |
| Total | 983 (88.5%) | 128 (11.5%) |
Housing Structures by Number of Rooms in Burbank
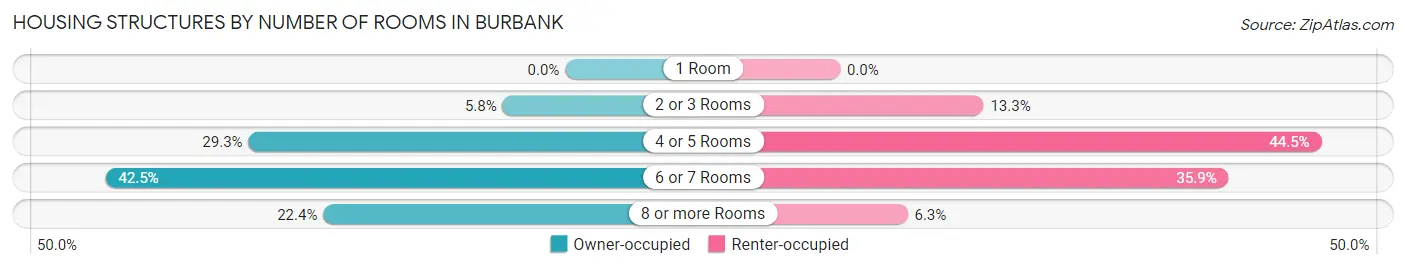
| Number of Rooms | Owner-occupied | Renter-occupied |
| 1 Room | 0 (0.0%) | 0 (0.0%) |
| 2 or 3 Rooms | 57 (5.8%) | 17 (13.3%) |
| 4 or 5 Rooms | 288 (29.3%) | 57 (44.5%) |
| 6 or 7 Rooms | 418 (42.5%) | 46 (35.9%) |
| 8 or more Rooms | 220 (22.4%) | 8 (6.2%) |
| Total | 983 (100.0%) | 128 (100.0%) |
Housing Structure by Heating Type in Burbank
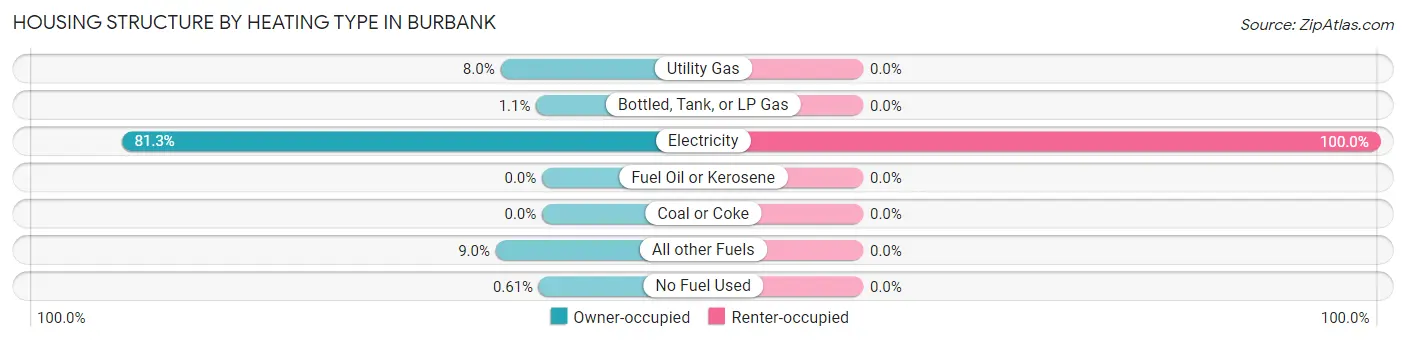
| Heating Type | Owner-occupied | Renter-occupied |
| Utility Gas | 79 (8.0%) | 0 (0.0%) |
| Bottled, Tank, or LP Gas | 11 (1.1%) | 0 (0.0%) |
| Electricity | 799 (81.3%) | 128 (100.0%) |
| Fuel Oil or Kerosene | 0 (0.0%) | 0 (0.0%) |
| Coal or Coke | 0 (0.0%) | 0 (0.0%) |
| All other Fuels | 88 (8.9%) | 0 (0.0%) |
| No Fuel Used | 6 (0.6%) | 0 (0.0%) |
| Total | 983 (100.0%) | 128 (100.0%) |
Household Vehicle Usage in Burbank
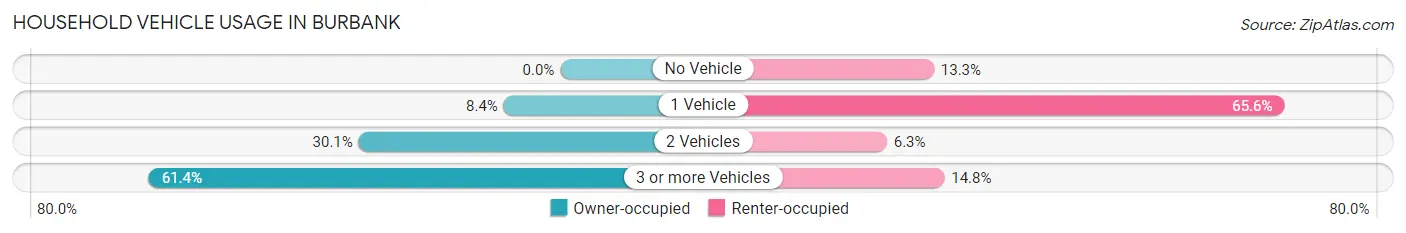
| Vehicles per Household | Owner-occupied | Renter-occupied |
| No Vehicle | 0 (0.0%) | 17 (13.3%) |
| 1 Vehicle | 83 (8.4%) | 84 (65.6%) |
| 2 Vehicles | 296 (30.1%) | 8 (6.2%) |
| 3 or more Vehicles | 604 (61.4%) | 19 (14.8%) |
| Total | 983 (100.0%) | 128 (100.0%) |
Real Estate & Mortgages in Burbank
Real Estate and Mortgage Overview in Burbank
| Characteristic | Without Mortgage | With Mortgage |
| Housing Units | 402 | 581 |
| Median Property Value | $233,300 | $332,200 |
| Median Household Income | $61,250 | $169 |
| Monthly Housing Costs | $553 | $6 |
| Real Estate Taxes | $2,574 | $0 |
Property Value by Mortgage Status in Burbank
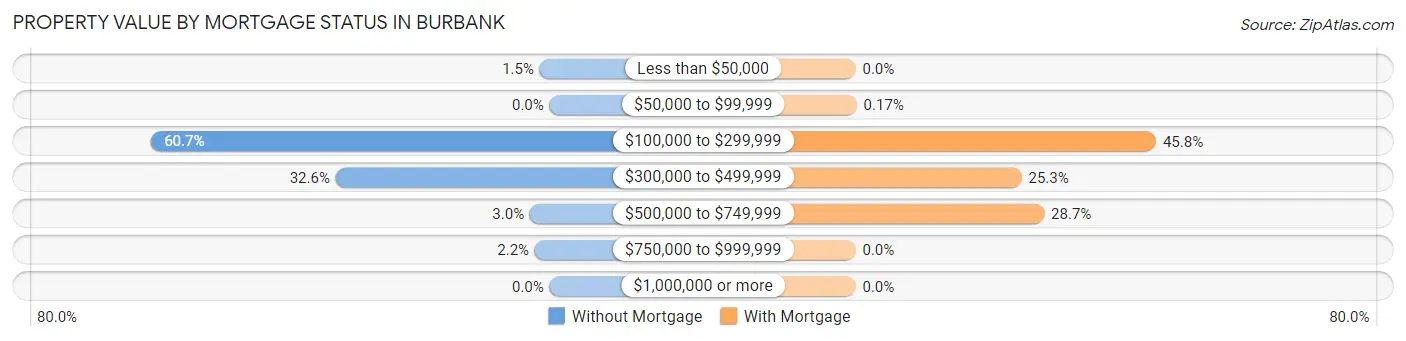
| Property Value | Without Mortgage | With Mortgage |
| Less than $50,000 | 6 (1.5%) | 0 (0.0%) |
| $50,000 to $99,999 | 0 (0.0%) | 1 (0.2%) |
| $100,000 to $299,999 | 244 (60.7%) | 266 (45.8%) |
| $300,000 to $499,999 | 131 (32.6%) | 147 (25.3%) |
| $500,000 to $749,999 | 12 (3.0%) | 167 (28.7%) |
| $750,000 to $999,999 | 9 (2.2%) | 0 (0.0%) |
| $1,000,000 or more | 0 (0.0%) | 0 (0.0%) |
| Total | 402 (100.0%) | 581 (100.0%) |
Household Income by Mortgage Status in Burbank
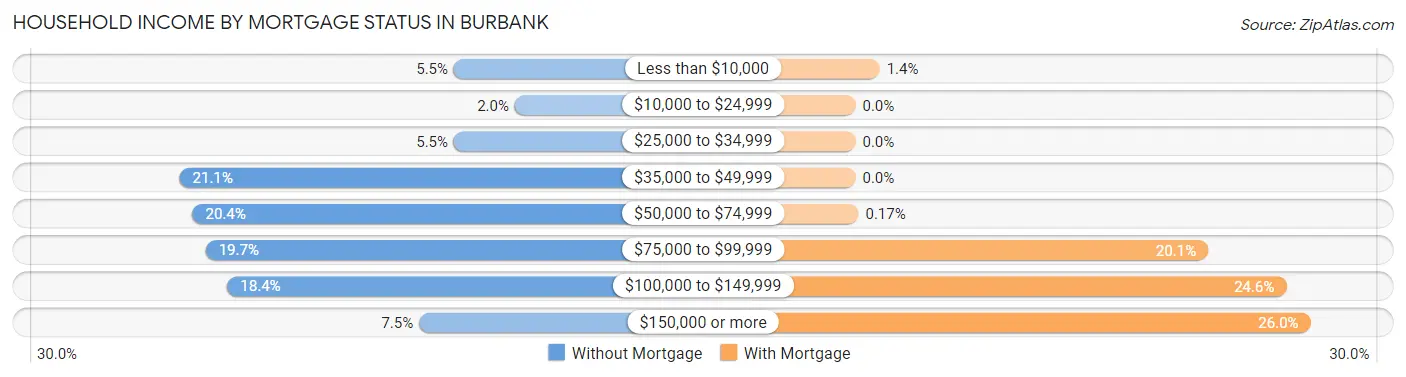
| Household Income | Without Mortgage | With Mortgage |
| Less than $10,000 | 22 (5.5%) | 8 (1.4%) |
| $10,000 to $24,999 | 8 (2.0%) | 0 (0.0%) |
| $25,000 to $34,999 | 22 (5.5%) | 0 (0.0%) |
| $35,000 to $49,999 | 85 (21.1%) | 0 (0.0%) |
| $50,000 to $74,999 | 82 (20.4%) | 1 (0.2%) |
| $75,000 to $99,999 | 79 (19.7%) | 117 (20.1%) |
| $100,000 to $149,999 | 74 (18.4%) | 143 (24.6%) |
| $150,000 or more | 30 (7.5%) | 151 (26.0%) |
| Total | 402 (100.0%) | 581 (100.0%) |
Property Value to Household Income Ratio in Burbank
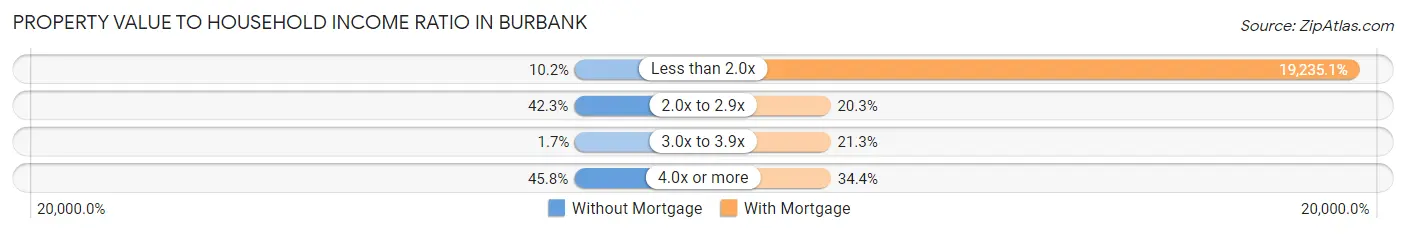
| Value-to-Income Ratio | Without Mortgage | With Mortgage |
| Less than 2.0x | 41 (10.2%) | 111,756 (19,235.1%) |
| 2.0x to 2.9x | 170 (42.3%) | 118 (20.3%) |
| 3.0x to 3.9x | 7 (1.7%) | 124 (21.3%) |
| 4.0x or more | 184 (45.8%) | 200 (34.4%) |
| Total | 402 (100.0%) | 581 (100.0%) |
Real Estate Taxes by Mortgage Status in Burbank
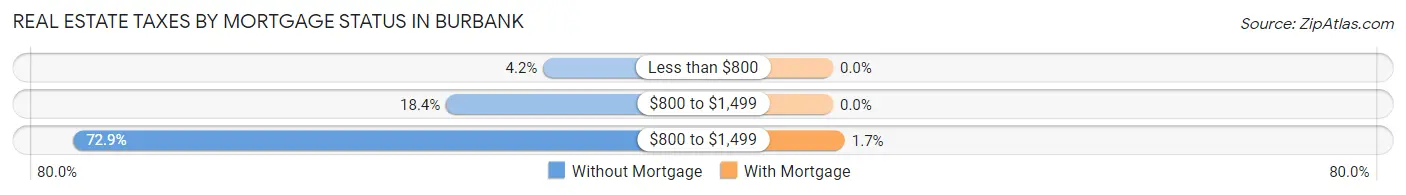
| Property Taxes | Without Mortgage | With Mortgage |
| Less than $800 | 17 (4.2%) | 0 (0.0%) |
| $800 to $1,499 | 74 (18.4%) | 0 (0.0%) |
| $800 to $1,499 | 293 (72.9%) | 10 (1.7%) |
| Total | 402 (100.0%) | 581 (100.0%) |
Health & Disability in Burbank
Health Insurance Coverage by Age in Burbank
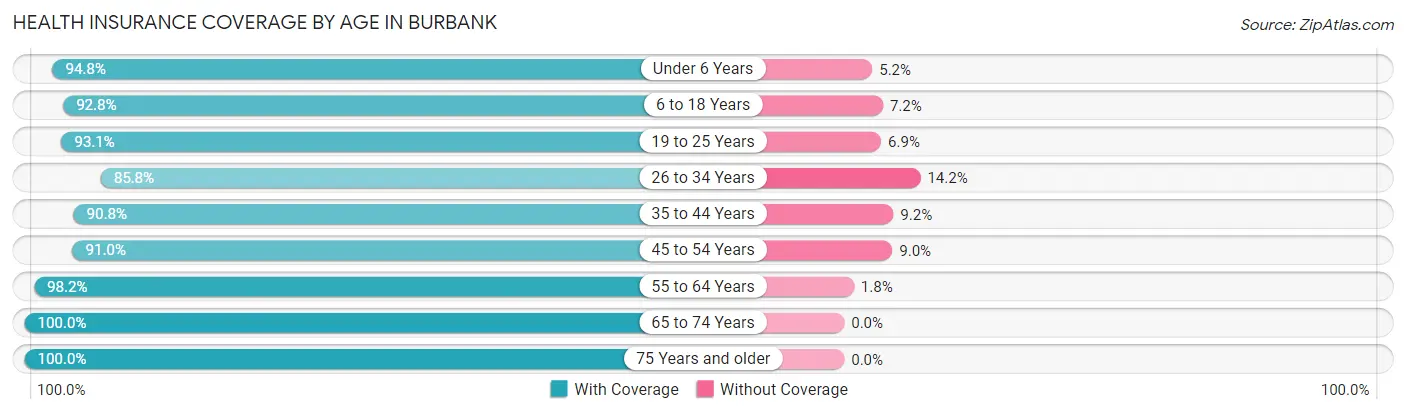
| Age Bracket | With Coverage | Without Coverage |
| Under 6 Years | 363 (94.8%) | 20 (5.2%) |
| 6 to 18 Years | 708 (92.8%) | 55 (7.2%) |
| 19 to 25 Years | 244 (93.1%) | 18 (6.9%) |
| 26 to 34 Years | 314 (85.8%) | 52 (14.2%) |
| 35 to 44 Years | 347 (90.8%) | 35 (9.2%) |
| 45 to 54 Years | 366 (91.0%) | 36 (9.0%) |
| 55 to 64 Years | 383 (98.2%) | 7 (1.8%) |
| 65 to 74 Years | 262 (100.0%) | 0 (0.0%) |
| 75 Years and older | 173 (100.0%) | 0 (0.0%) |
| Total | 3,160 (93.4%) | 223 (6.6%) |
Health Insurance Coverage by Citizenship Status in Burbank
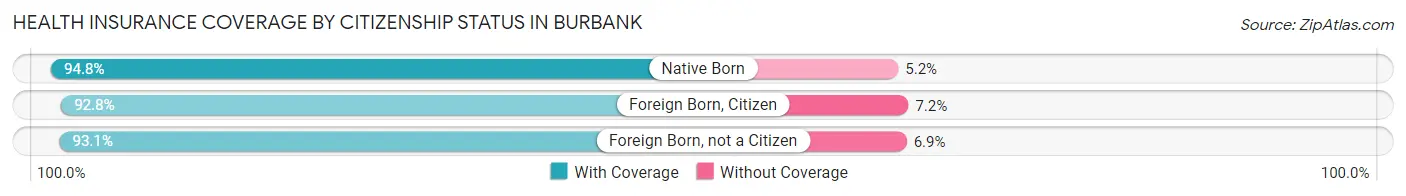
| Citizenship Status | With Coverage | Without Coverage |
| Native Born | 363 (94.8%) | 20 (5.2%) |
| Foreign Born, Citizen | 708 (92.8%) | 55 (7.2%) |
| Foreign Born, not a Citizen | 244 (93.1%) | 18 (6.9%) |
Health Insurance Coverage by Household Income in Burbank
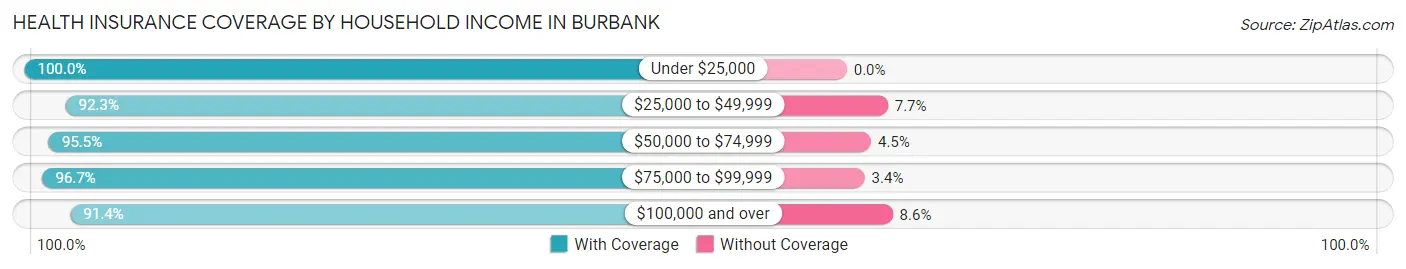
| Household Income | With Coverage | Without Coverage |
| Under $25,000 | 73 (100.0%) | 0 (0.0%) |
| $25,000 to $49,999 | 733 (92.3%) | 61 (7.7%) |
| $50,000 to $74,999 | 610 (95.5%) | 29 (4.5%) |
| $75,000 to $99,999 | 520 (96.7%) | 18 (3.4%) |
| $100,000 and over | 1,224 (91.4%) | 115 (8.6%) |
Public vs Private Health Insurance Coverage by Age in Burbank
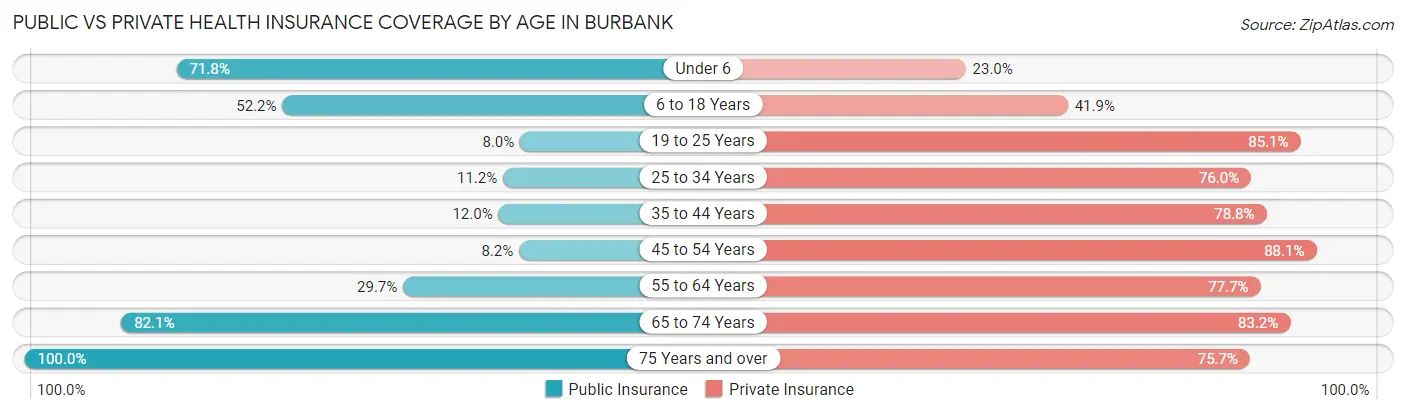
| Age Bracket | Public Insurance | Private Insurance |
| Under 6 | 275 (71.8%) | 88 (23.0%) |
| 6 to 18 Years | 398 (52.2%) | 320 (41.9%) |
| 19 to 25 Years | 21 (8.0%) | 223 (85.1%) |
| 25 to 34 Years | 41 (11.2%) | 278 (76.0%) |
| 35 to 44 Years | 46 (12.0%) | 301 (78.8%) |
| 45 to 54 Years | 33 (8.2%) | 354 (88.1%) |
| 55 to 64 Years | 116 (29.7%) | 303 (77.7%) |
| 65 to 74 Years | 215 (82.1%) | 218 (83.2%) |
| 75 Years and over | 173 (100.0%) | 131 (75.7%) |
| Total | 1,318 (39.0%) | 2,216 (65.5%) |
Disability Status by Sex by Age in Burbank
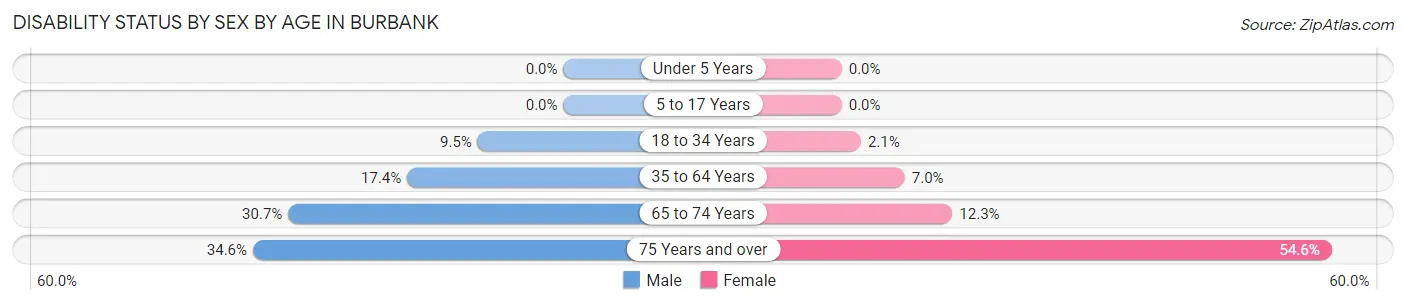
| Age Bracket | Male | Female |
| Under 5 Years | 0 (0.0%) | 0 (0.0%) |
| 5 to 17 Years | 0 (0.0%) | 0 (0.0%) |
| 18 to 34 Years | 33 (9.5%) | 8 (2.1%) |
| 35 to 64 Years | 115 (17.4%) | 36 (7.0%) |
| 65 to 74 Years | 38 (30.6%) | 17 (12.3%) |
| 75 Years and over | 37 (34.6%) | 36 (54.5%) |
Disability Class by Sex by Age in Burbank
Disability Class: Hearing Difficulty
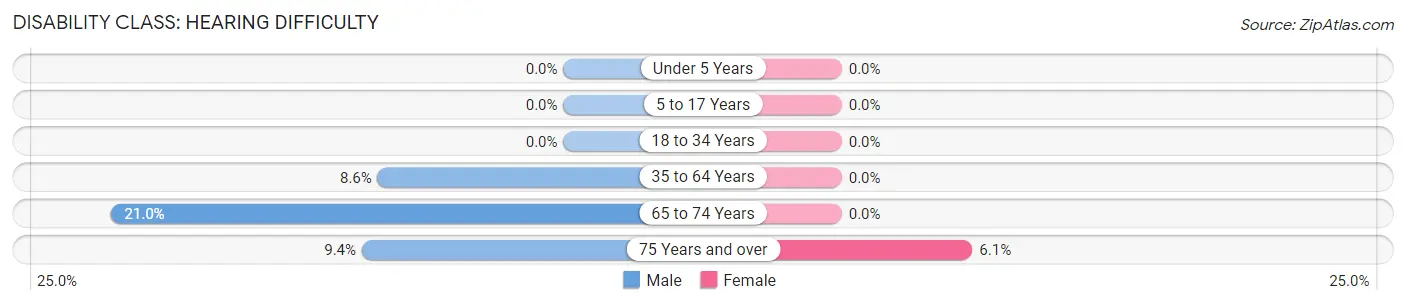
| Age Bracket | Male | Female |
| Under 5 Years | 0 (0.0%) | 0 (0.0%) |
| 5 to 17 Years | 0 (0.0%) | 0 (0.0%) |
| 18 to 34 Years | 0 (0.0%) | 0 (0.0%) |
| 35 to 64 Years | 57 (8.6%) | 0 (0.0%) |
| 65 to 74 Years | 26 (21.0%) | 0 (0.0%) |
| 75 Years and over | 10 (9.3%) | 4 (6.1%) |
Disability Class: Vision Difficulty
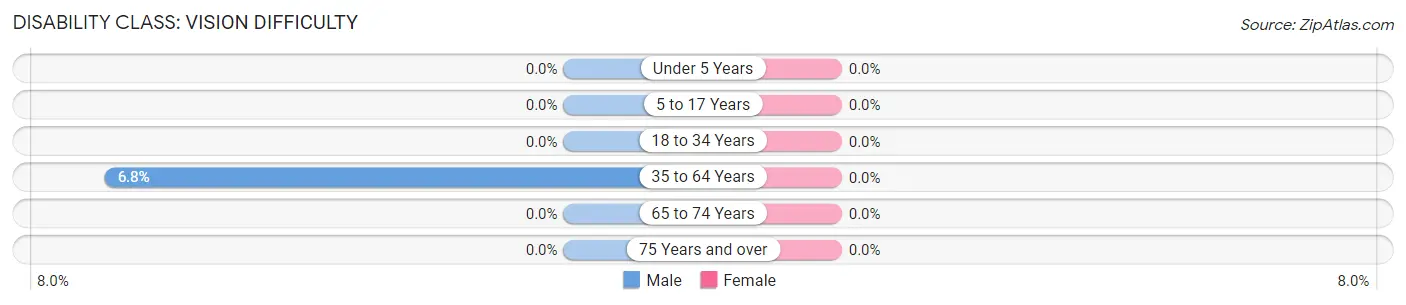
| Age Bracket | Male | Female |
| Under 5 Years | 0 (0.0%) | 0 (0.0%) |
| 5 to 17 Years | 0 (0.0%) | 0 (0.0%) |
| 18 to 34 Years | 0 (0.0%) | 0 (0.0%) |
| 35 to 64 Years | 45 (6.8%) | 0 (0.0%) |
| 65 to 74 Years | 0 (0.0%) | 0 (0.0%) |
| 75 Years and over | 0 (0.0%) | 0 (0.0%) |
Disability Class: Cognitive Difficulty
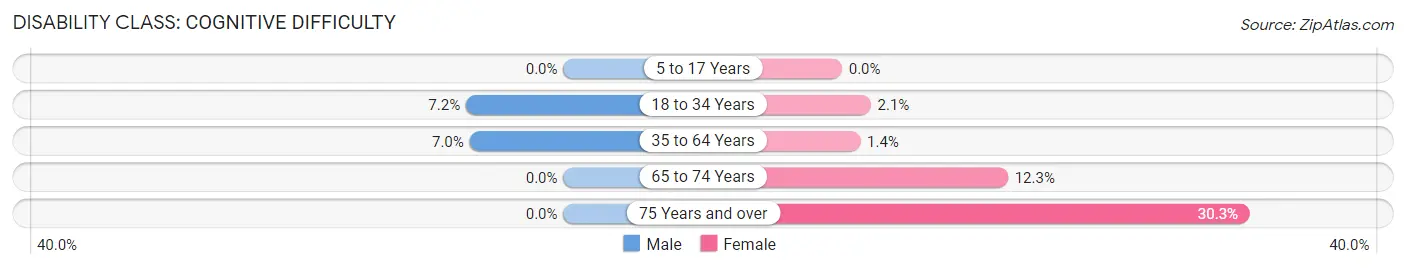
| Age Bracket | Male | Female |
| 5 to 17 Years | 0 (0.0%) | 0 (0.0%) |
| 18 to 34 Years | 25 (7.2%) | 8 (2.1%) |
| 35 to 64 Years | 46 (7.0%) | 7 (1.4%) |
| 65 to 74 Years | 0 (0.0%) | 17 (12.3%) |
| 75 Years and over | 0 (0.0%) | 20 (30.3%) |
Disability Class: Ambulatory Difficulty
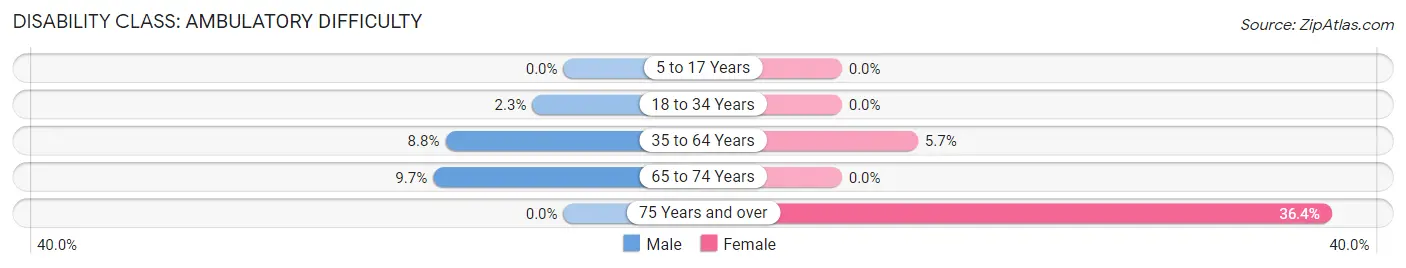
| Age Bracket | Male | Female |
| 5 to 17 Years | 0 (0.0%) | 0 (0.0%) |
| 18 to 34 Years | 8 (2.3%) | 0 (0.0%) |
| 35 to 64 Years | 58 (8.8%) | 29 (5.7%) |
| 65 to 74 Years | 12 (9.7%) | 0 (0.0%) |
| 75 Years and over | 0 (0.0%) | 24 (36.4%) |
Disability Class: Self-Care Difficulty
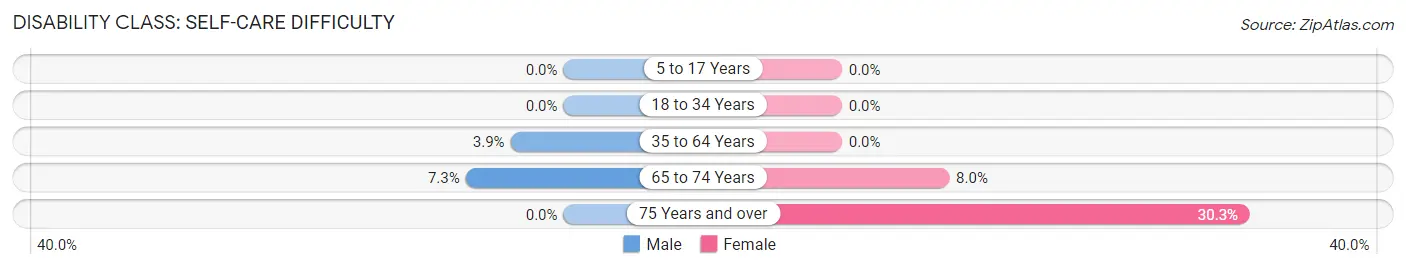
| Age Bracket | Male | Female |
| 5 to 17 Years | 0 (0.0%) | 0 (0.0%) |
| 18 to 34 Years | 0 (0.0%) | 0 (0.0%) |
| 35 to 64 Years | 26 (3.9%) | 0 (0.0%) |
| 65 to 74 Years | 9 (7.3%) | 11 (8.0%) |
| 75 Years and over | 0 (0.0%) | 20 (30.3%) |
Technology Access in Burbank
Computing Device Access in Burbank
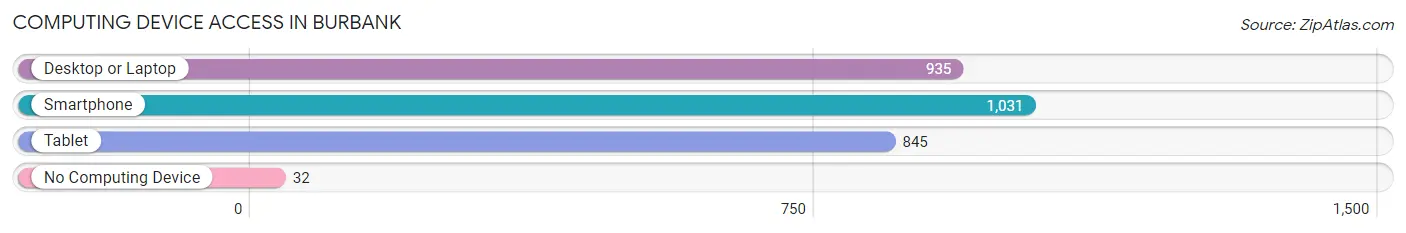
| Device Type | # Households | % Households |
| Desktop or Laptop | 935 | 84.2% |
| Smartphone | 1,031 | 92.8% |
| Tablet | 845 | 76.1% |
| No Computing Device | 32 | 2.9% |
| Total | 1,111 | 100.0% |
Internet Access in Burbank
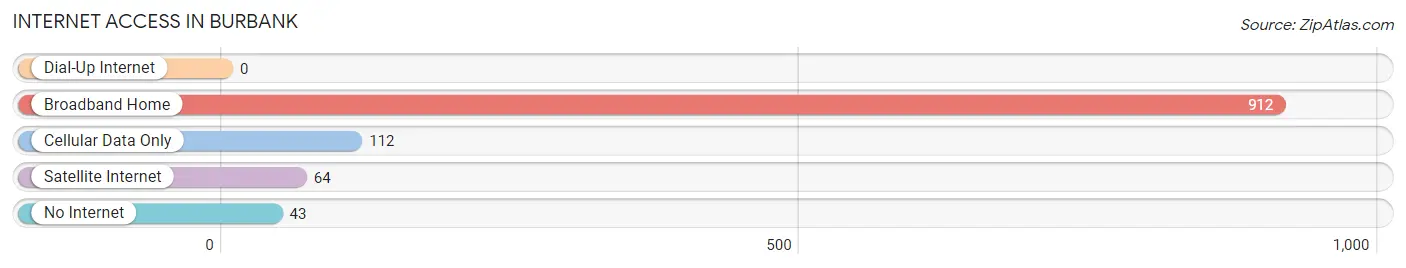
| Internet Type | # Households | % Households |
| Dial-Up Internet | 0 | 0.0% |
| Broadband Home | 912 | 82.1% |
| Cellular Data Only | 112 | 10.1% |
| Satellite Internet | 64 | 5.8% |
| No Internet | 43 | 3.9% |
| Total | 1,111 | 100.0% |
Burbank Summary
Burbank, Washington is a small city located in the southeastern part of the state, in the county of Walla Walla. It is situated on the banks of the Snake River, and is home to a population of approximately 1,500 people. The city is known for its agricultural heritage, and is home to a variety of businesses, including a winery, a brewery, and a distillery.
History
The area that is now Burbank was first settled in the late 1800s by settlers from the Midwest. The city was originally known as "Burbank Station," and was named after the nearby Burbank Ranch. The city was officially incorporated in 1909, and was named after the nearby Burbank Ranch.
The city was originally a farming community, and the main crops grown were wheat, barley, and oats. The city also had a thriving dairy industry, and was home to several cheese factories. In the early 1900s, the city began to diversify its economy, and began to attract businesses such as a winery, a brewery, and a distillery.
Geography
Burbank is located in the southeastern part of the state, in the county of Walla Walla. The city is situated on the banks of the Snake River, and is surrounded by rolling hills and farmland. The city is located approximately 30 miles from the state capital of Olympia, and is approximately 90 miles from the city of Spokane.
The climate in Burbank is generally mild, with temperatures ranging from the mid-30s in the winter to the mid-80s in the summer. The city receives an average of 16 inches of precipitation per year, and is known for its sunny days and mild temperatures.
Economy
Burbank is home to a variety of businesses, including a winery, a brewery, and a distillery. The city is also home to several agricultural businesses, including a dairy farm, a grain elevator, and a feed mill. The city is also home to several retail stores, restaurants, and other businesses.
The city is also home to several manufacturing businesses, including a furniture factory, a metal fabrication plant, and a plastics factory. The city is also home to several technology companies, including a software development firm and a web design firm.
Demographics
As of the 2010 census, the population of Burbank was 1,500. The racial makeup of the city was 94.2% White, 0.7% African American, 0.7% Native American, 0.7% Asian, 0.7% from other races, and 2.7% from two or more races. Hispanic or Latino of any race were 2.7% of the population.
The median income for a household in the city was $41,250, and the median income for a family was $50,000. The per capita income for the city was $20,000. About 11.7% of families and 14.3% of the population were below the poverty line, including 18.2% of those under age 18 and 8.3% of those age 65 or over.
Common Questions
What is Per Capita Income in Burbank?
Per Capita income in Burbank is $31,030.
What is the Median Family Income in Burbank?
Median Family Income in Burbank is $92,286.
What is the Median Household income in Burbank?
Median Household Income in Burbank is $84,046.
What is Income or Wage Gap in Burbank?
Income or Wage Gap in Burbank is 53.4%.
Women in Burbank earn 46.6 cents for every dollar earned by a man.
What is Inequality or Gini Index in Burbank?
Inequality or Gini Index in Burbank is 0.31.
What is the Total Population of Burbank?
Total Population of Burbank is 3,383.
What is the Total Male Population of Burbank?
Total Male Population of Burbank is 1,887.
What is the Total Female Population of Burbank?
Total Female Population of Burbank is 1,496.
What is the Ratio of Males per 100 Females in Burbank?
There are 126.14 Males per 100 Females in Burbank.
What is the Ratio of Females per 100 Males in Burbank?
There are 79.28 Females per 100 Males in Burbank.
What is the Median Population Age in Burbank?
Median Population Age in Burbank is 32.0 Years.
What is the Average Family Size in Burbank
Average Family Size in Burbank is 3.5 People.
What is the Average Household Size in Burbank
Average Household Size in Burbank is 3.0 People.
How Large is the Labor Force in Burbank?
There are 1,518 People in the Labor Forcein in Burbank.
What is the Percentage of People in the Labor Force in Burbank?
62.0% of People are in the Labor Force in Burbank.
What is the Unemployment Rate in Burbank?
Unemployment Rate in Burbank is 10.9%.