Humptulips, WA Map & Demographics
Humptulips Map
Humptulips Overview
$29,535
PER CAPITA INCOME
0.53
INEQUALITY / GINI INDEX
245
TOTAL POPULATION
133
MALE POPULATION
112
FEMALE POPULATION
118.75
MALES / 100 FEMALES
84.21
FEMALES / 100 MALES
55.6
MEDIAN AGE
3.8
AVG FAMILY SIZE
2.6
AVG HOUSEHOLD SIZE
78
LABOR FORCE [ PEOPLE ]
42.6%
PERCENT IN LABOR FORCE
6.4%
UNEMPLOYMENT RATE
Humptulips Zip Codes
Humptulips Area Codes
Income in Humptulips
Income Overview in Humptulips
| Characteristic | Number | Measure |
| Per Capita Income | 245 | $29,535 |
| Median Family Income | 53 | $0 |
| Mean Family Income | 53 | $122,694 |
| Median Household Income | 95 | $0 |
| Mean Household Income | 95 | $80,403 |
| Income Deficit | 53 | $0 |
| Wage / Income Gap (%) | 245 | 0.00% |
| Wage / Income Gap ($) | 245 | 100.00¢ per $1 |
| Gini / Inequality Index | 245 | 0.53 |
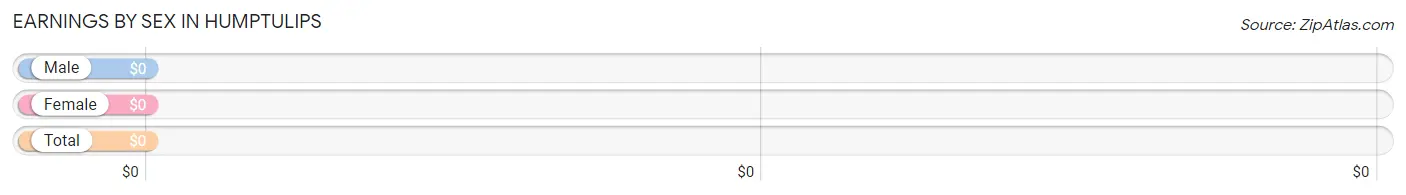
Earnings by Sex in Humptulips
| Sex | Number | Average Earnings |
| Male | 42 (53.8%) | $0 |
| Female | 36 (46.2%) | $0 |
| Total | 78 (100.0%) | $0 |
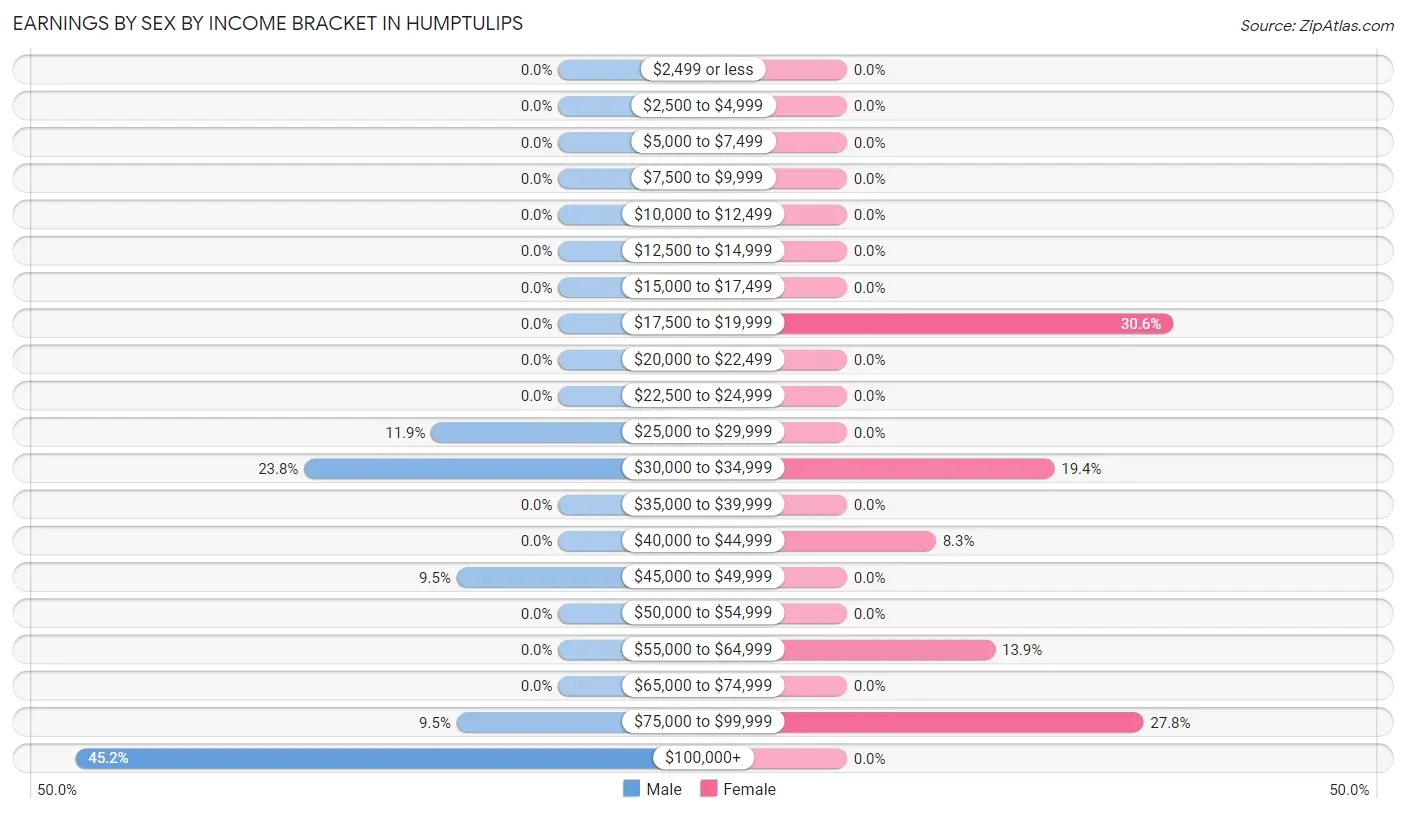
Earnings by Sex by Income Bracket in Humptulips
The most common earnings brackets in Humptulips are $100,000+ for men (19 | 45.2%) and $17,500 to $19,999 for women (11 | 30.6%).
| Income | Male | Female |
| $2,499 or less | 0 (0.0%) | 0 (0.0%) |
| $2,500 to $4,999 | 0 (0.0%) | 0 (0.0%) |
| $5,000 to $7,499 | 0 (0.0%) | 0 (0.0%) |
| $7,500 to $9,999 | 0 (0.0%) | 0 (0.0%) |
| $10,000 to $12,499 | 0 (0.0%) | 0 (0.0%) |
| $12,500 to $14,999 | 0 (0.0%) | 0 (0.0%) |
| $15,000 to $17,499 | 0 (0.0%) | 0 (0.0%) |
| $17,500 to $19,999 | 0 (0.0%) | 11 (30.6%) |
| $20,000 to $22,499 | 0 (0.0%) | 0 (0.0%) |
| $22,500 to $24,999 | 0 (0.0%) | 0 (0.0%) |
| $25,000 to $29,999 | 5 (11.9%) | 0 (0.0%) |
| $30,000 to $34,999 | 10 (23.8%) | 7 (19.4%) |
| $35,000 to $39,999 | 0 (0.0%) | 0 (0.0%) |
| $40,000 to $44,999 | 0 (0.0%) | 3 (8.3%) |
| $45,000 to $49,999 | 4 (9.5%) | 0 (0.0%) |
| $50,000 to $54,999 | 0 (0.0%) | 0 (0.0%) |
| $55,000 to $64,999 | 0 (0.0%) | 5 (13.9%) |
| $65,000 to $74,999 | 0 (0.0%) | 0 (0.0%) |
| $75,000 to $99,999 | 4 (9.5%) | 10 (27.8%) |
| $100,000+ | 19 (45.2%) | 0 (0.0%) |
| Total | 42 (100.0%) | 36 (100.0%) |
Earnings by Sex by Educational Attainment in Humptulips
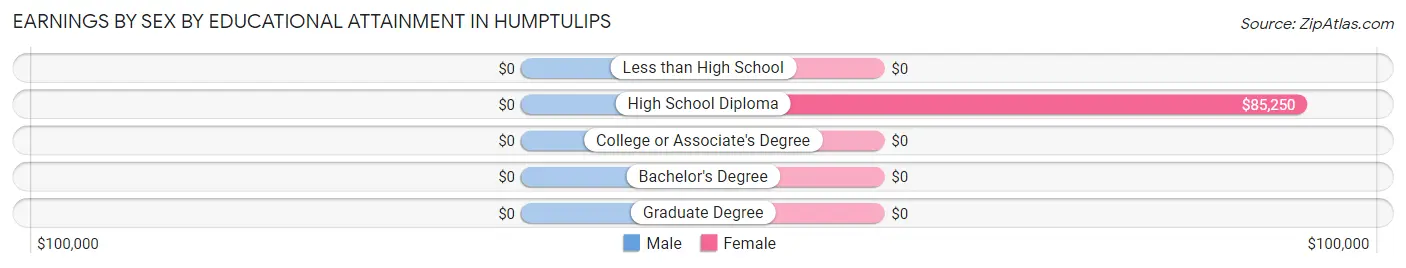
| Educational Attainment | Male Income | Female Income |
| Less than High School | - | - |
| High School Diploma | - | - |
| College or Associate's Degree | - | - |
| Bachelor's Degree | - | - |
| Graduate Degree | - | - |
| Total | - | - |
Family Income in Humptulips
Family Income Brackets in Humptulips
According to the Humptulips family income data, there are 23 families falling into the $200,000+ income range, which is the most common income bracket and makes up 43.4% of all families.
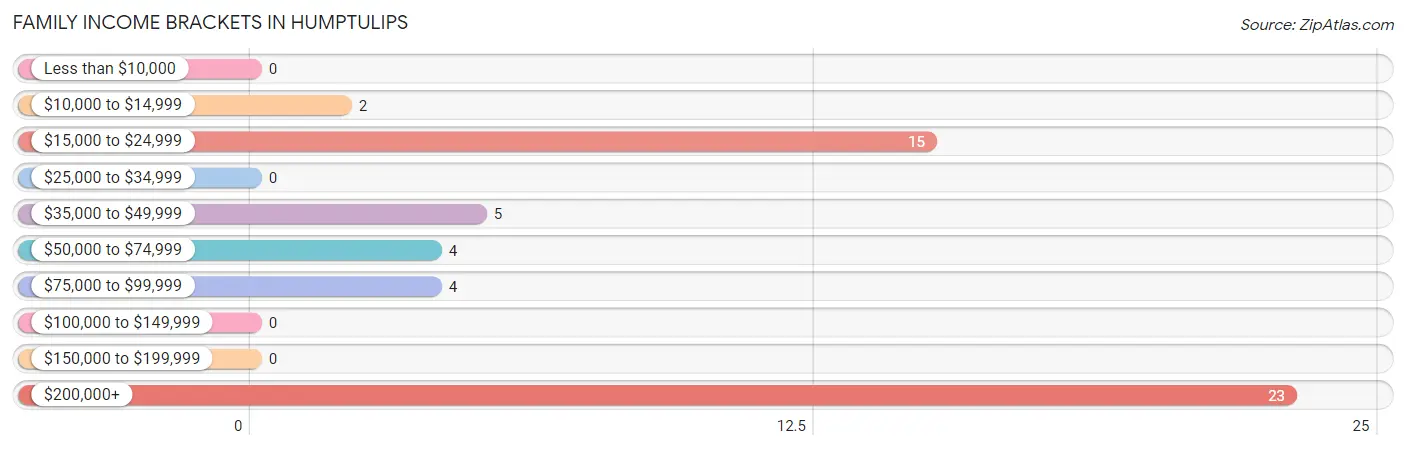
| Income Bracket | # Families | % Families |
| Less than $10,000 | 0 | 0.0% |
| $10,000 to $14,999 | 2 | 3.8% |
| $15,000 to $24,999 | 15 | 28.3% |
| $25,000 to $34,999 | 0 | 0.0% |
| $35,000 to $49,999 | 5 | 9.4% |
| $50,000 to $74,999 | 4 | 7.5% |
| $75,000 to $99,999 | 4 | 7.5% |
| $100,000 to $149,999 | 0 | 0.0% |
| $150,000 to $199,999 | 0 | 0.0% |
| $200,000+ | 23 | 43.4% |
Family Income by Famaliy Size in Humptulips
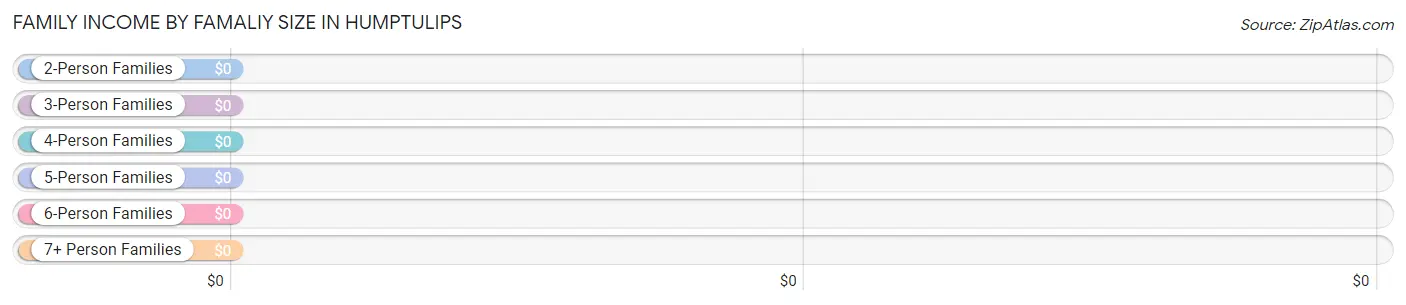
| Income Bracket | # Families | Median Income |
| 2-Person Families | 27 (50.9%) | $0 |
| 3-Person Families | 4 (7.5%) | $0 |
| 4-Person Families | 4 (7.5%) | $0 |
| 5-Person Families | 3 (5.7%) | $0 |
| 6-Person Families | 15 (28.3%) | $0 |
| 7+ Person Families | 0 (0.0%) | $0 |
| Total | 53 (100.0%) | $0 |
Family Income by Number of Earners in Humptulips
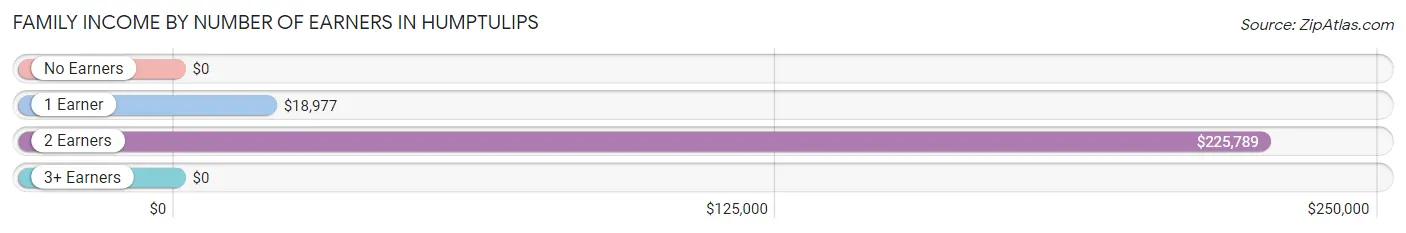
| Number of Earners | # Families | Median Income |
| No Earners | 10 (18.9%) | $0 |
| 1 Earner | 13 (24.5%) | $18,977 |
| 2 Earners | 26 (49.1%) | $225,789 |
| 3+ Earners | 4 (7.5%) | $0 |
| Total | 53 (100.0%) | $0 |
Household Income in Humptulips
Household Income Brackets in Humptulips
With 35 households falling in the category, the $15,000 to $24,999 income range is the most frequent in Humptulips, accounting for 36.8% of all households.
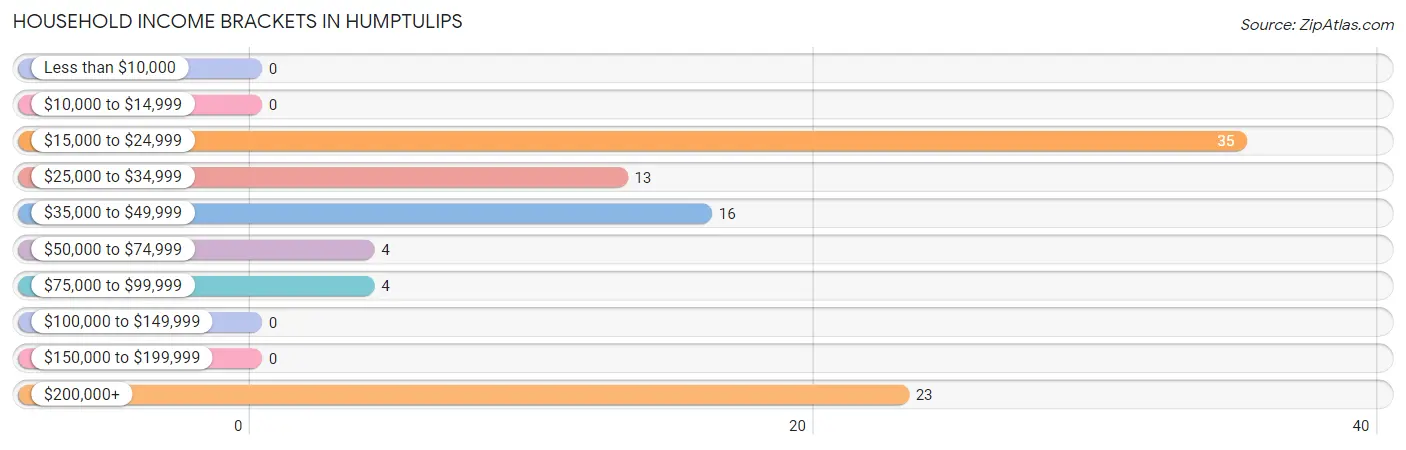
| Income Bracket | # Households | % Households |
| Less than $10,000 | 0 | 0.0% |
| $10,000 to $14,999 | 0 | 0.0% |
| $15,000 to $24,999 | 35 | 36.8% |
| $25,000 to $34,999 | 13 | 13.7% |
| $35,000 to $49,999 | 16 | 16.8% |
| $50,000 to $74,999 | 4 | 4.2% |
| $75,000 to $99,999 | 4 | 4.2% |
| $100,000 to $149,999 | 0 | 0.0% |
| $150,000 to $199,999 | 0 | 0.0% |
| $200,000+ | 23 | 24.2% |
Household Income by Householder Age in Humptulips
The median household income in Humptulips is $0, with the highest median household income of $27,955 found in the 45 to 64 years age bracket for the primary householder. A total of 26 households (27.4%) fall into this category.
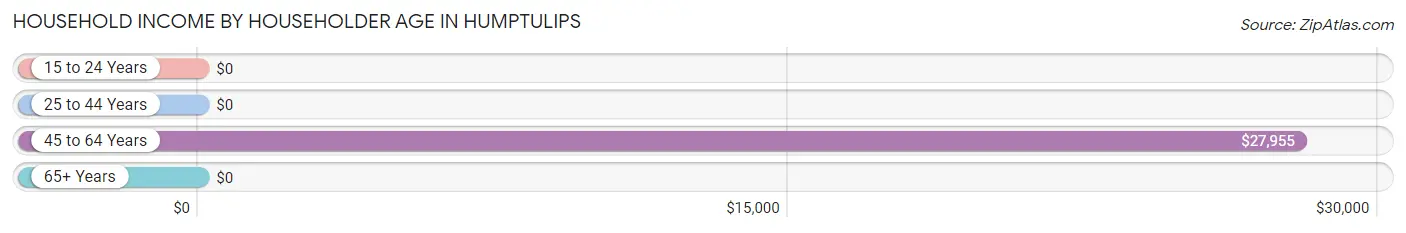
| Income Bracket | # Households | Median Income |
| 15 to 24 Years | 0 (0.0%) | $0 |
| 25 to 44 Years | 7 (7.4%) | $0 |
| 45 to 64 Years | 26 (27.4%) | $27,955 |
| 65+ Years | 62 (65.3%) | $0 |
| Total | 95 (100.0%) | $0 |
Poverty in Humptulips
Income Below Poverty by Sex and Age in Humptulips
With 24.1% poverty level for males and 54.5% for females among the residents of Humptulips, 6 to 11 year old males and under 5 year old females are the most vulnerable to poverty, with 12 males (60.0%) and 12 females (80.0%) in their respective age groups living below the poverty level.
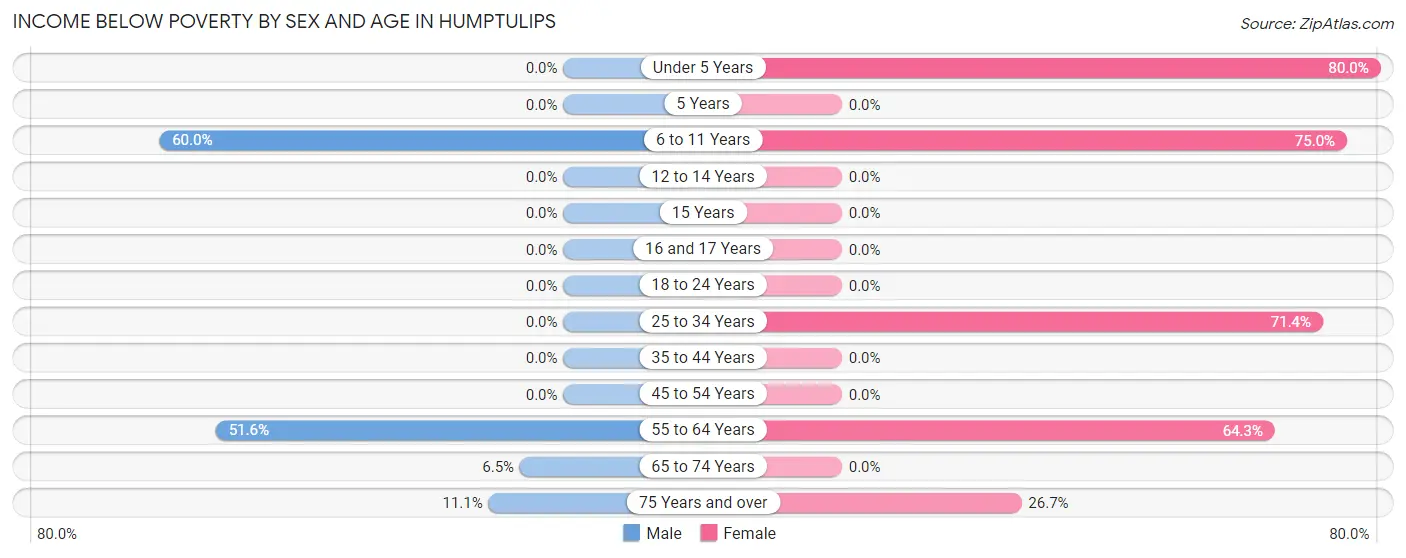
| Age Bracket | Male | Female |
| Under 5 Years | 0 (0.0%) | 12 (80.0%) |
| 5 Years | 0 (0.0%) | 0 (0.0%) |
| 6 to 11 Years | 12 (60.0%) | 12 (75.0%) |
| 12 to 14 Years | 0 (0.0%) | 0 (0.0%) |
| 15 Years | 0 (0.0%) | 0 (0.0%) |
| 16 and 17 Years | 0 (0.0%) | 0 (0.0%) |
| 18 to 24 Years | 0 (0.0%) | 0 (0.0%) |
| 25 to 34 Years | 0 (0.0%) | 15 (71.4%) |
| 35 to 44 Years | 0 (0.0%) | 0 (0.0%) |
| 45 to 54 Years | 0 (0.0%) | 0 (0.0%) |
| 55 to 64 Years | 16 (51.6%) | 18 (64.3%) |
| 65 to 74 Years | 2 (6.5%) | 0 (0.0%) |
| 75 Years and over | 2 (11.1%) | 4 (26.7%) |
| Total | 32 (24.1%) | 61 (54.5%) |
Income Above Poverty by Sex and Age in Humptulips
According to the poverty statistics in Humptulips, males aged 12 to 14 years and females aged 12 to 14 years are the age groups that are most secure financially, with 100.0% of males and 100.0% of females in these age groups living above the poverty line.
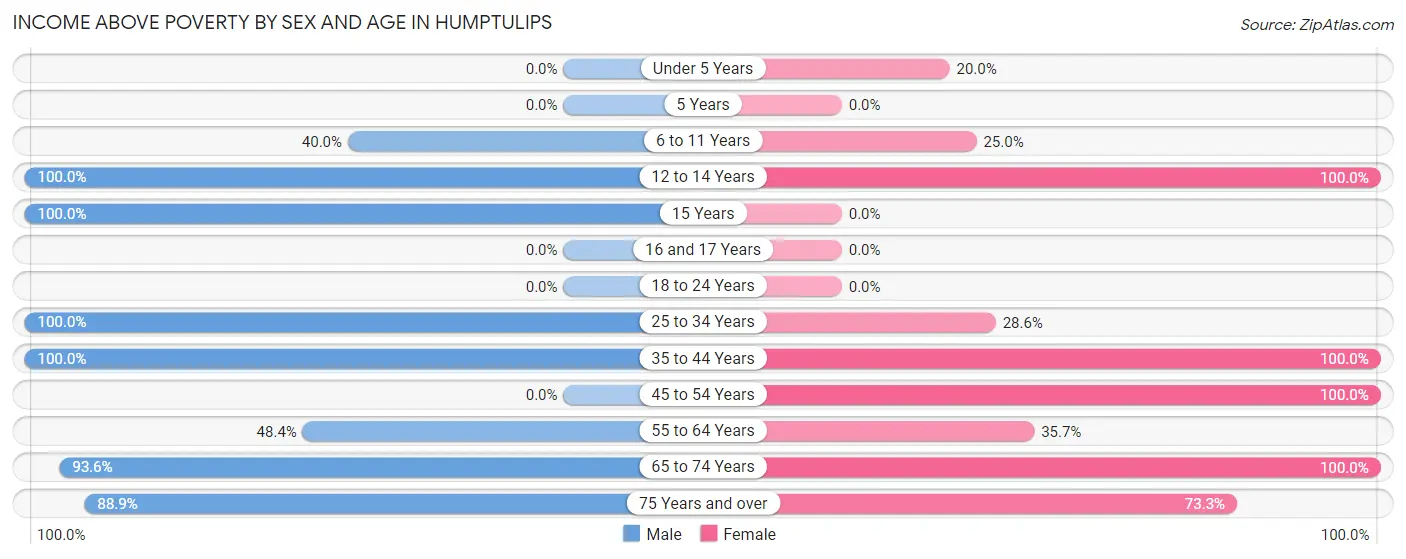
| Age Bracket | Male | Female |
| Under 5 Years | 0 (0.0%) | 3 (20.0%) |
| 5 Years | 0 (0.0%) | 0 (0.0%) |
| 6 to 11 Years | 8 (40.0%) | 4 (25.0%) |
| 12 to 14 Years | 3 (100.0%) | 3 (100.0%) |
| 15 Years | 5 (100.0%) | 0 (0.0%) |
| 16 and 17 Years | 0 (0.0%) | 0 (0.0%) |
| 18 to 24 Years | 0 (0.0%) | 0 (0.0%) |
| 25 to 34 Years | 11 (100.0%) | 6 (28.6%) |
| 35 to 44 Years | 14 (100.0%) | 4 (100.0%) |
| 45 to 54 Years | 0 (0.0%) | 4 (100.0%) |
| 55 to 64 Years | 15 (48.4%) | 10 (35.7%) |
| 65 to 74 Years | 29 (93.5%) | 6 (100.0%) |
| 75 Years and over | 16 (88.9%) | 11 (73.3%) |
| Total | 101 (75.9%) | 51 (45.5%) |
Income Below Poverty Among Married-Couple Families in Humptulips
The poverty statistics for married-couple families in Humptulips show that 27.1% or 13 of the total 48 families live below the poverty line. Families with 3 or 4 children have the highest poverty rate of 61.1%, comprising of 11 families. On the other hand, families with no children have the lowest poverty rate of 6.7%, which includes 2 families.
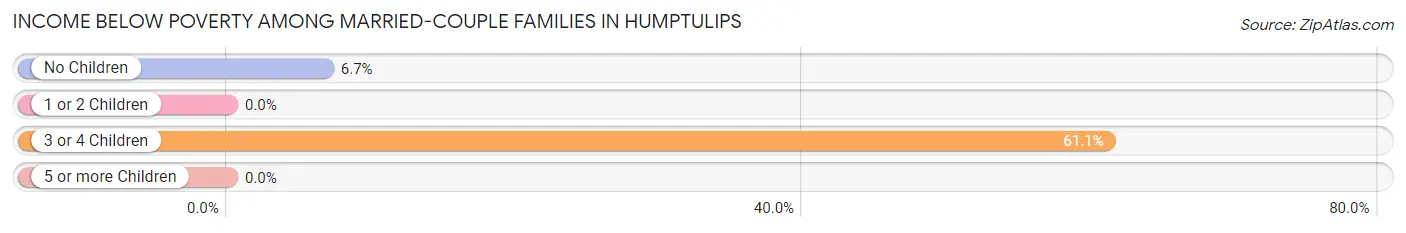
| Children | Above Poverty | Below Poverty |
| No Children | 28 (93.3%) | 2 (6.7%) |
| 1 or 2 Children | 0 (0.0%) | 0 (0.0%) |
| 3 or 4 Children | 7 (38.9%) | 11 (61.1%) |
| 5 or more Children | 0 (0.0%) | 0 (0.0%) |
| Total | 35 (72.9%) | 13 (27.1%) |
Income Below Poverty Among Single-Parent Households in Humptulips
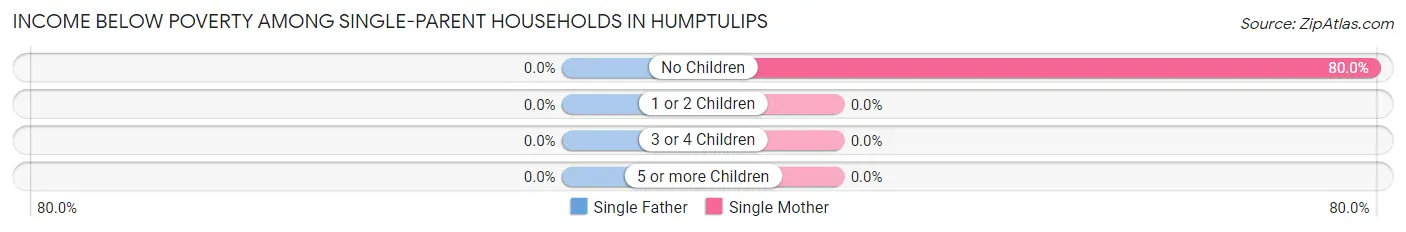
| Children | Single Father | Single Mother |
| No Children | 0 (0.0%) | 4 (80.0%) |
| 1 or 2 Children | 0 (0.0%) | 0 (0.0%) |
| 3 or 4 Children | 0 (0.0%) | 0 (0.0%) |
| 5 or more Children | 0 (0.0%) | 0 (0.0%) |
| Total | 0 (0.0%) | 4 (80.0%) |
Income Below Poverty Among Married-Couple vs Single-Parent Households in Humptulips
The poverty data for Humptulips shows that 13 of the married-couple family households (27.1%) and 4 of the single-parent households (80.0%) are living below the poverty level. Within the married-couple family households, those with 3 or 4 children have the highest poverty rate, with 11 households (61.1%) falling below the poverty line. Among the single-parent households, those with no children have the highest poverty rate, with 4 household (80.0%) living below poverty.
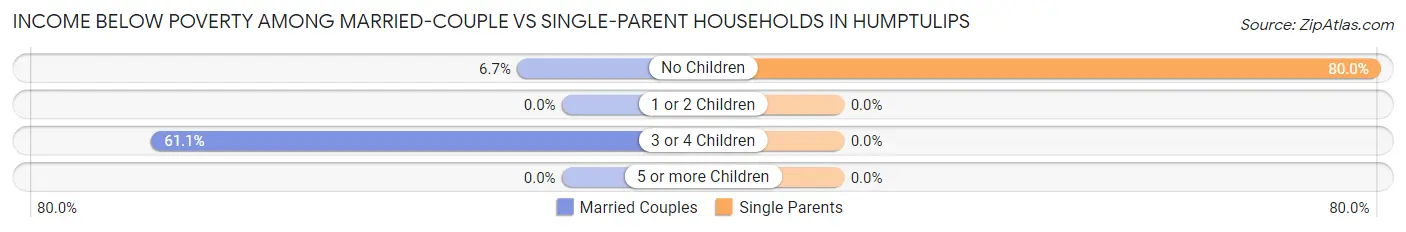
| Children | Married-Couple Families | Single-Parent Households |
| No Children | 2 (6.7%) | 4 (80.0%) |
| 1 or 2 Children | 0 (0.0%) | 0 (0.0%) |
| 3 or 4 Children | 11 (61.1%) | 0 (0.0%) |
| 5 or more Children | 0 (0.0%) | 0 (0.0%) |
| Total | 13 (27.1%) | 4 (80.0%) |
Race in Humptulips
The most populous races in Humptulips are White / Caucasian (203 | 82.9%), Two or more Races (36 | 14.7%), and Hispanic or Latino (25 | 10.2%).
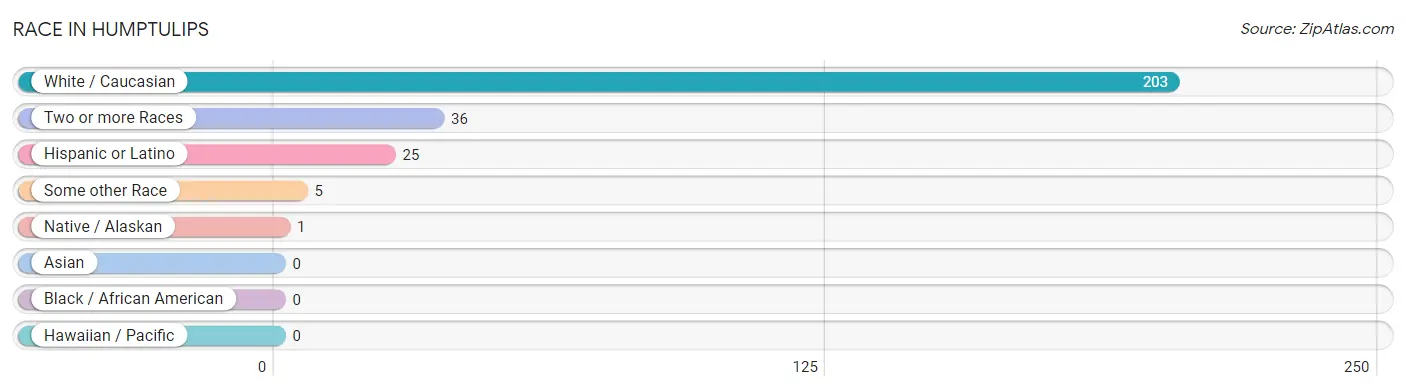
| Race | # Population | % Population |
| Asian | 0 | 0.0% |
| Black / African American | 0 | 0.0% |
| Hawaiian / Pacific | 0 | 0.0% |
| Hispanic or Latino | 25 | 10.2% |
| Native / Alaskan | 1 | 0.4% |
| White / Caucasian | 203 | 82.9% |
| Two or more Races | 36 | 14.7% |
| Some other Race | 5 | 2.0% |
| Total | 245 | 100.0% |
Ancestry in Humptulips
The most populous ancestries reported in Humptulips are German (106 | 43.3%), Irish (94 | 38.4%), Mexican (24 | 9.8%), Swedish (15 | 6.1%), and Dutch (13 | 5.3%), together accounting for 102.9% of all Humptulips residents.
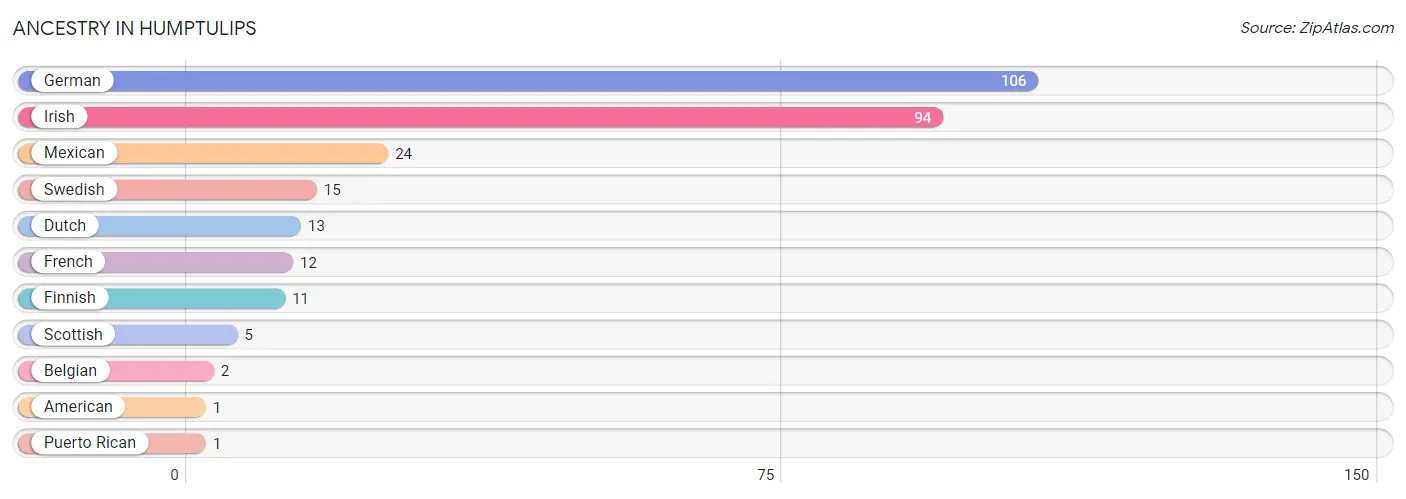
| Ancestry | # Population | % Population |
| American | 1 | 0.4% |
| Belgian | 2 | 0.8% |
| Dutch | 13 | 5.3% |
| Finnish | 11 | 4.5% |
| French | 12 | 4.9% |
| German | 106 | 43.3% |
| Irish | 94 | 38.4% |
| Mexican | 24 | 9.8% |
| Puerto Rican | 1 | 0.4% |
| Scottish | 5 | 2.0% |
| Swedish | 15 | 6.1% | View All 11 Rows |
Immigrants in Humptulips
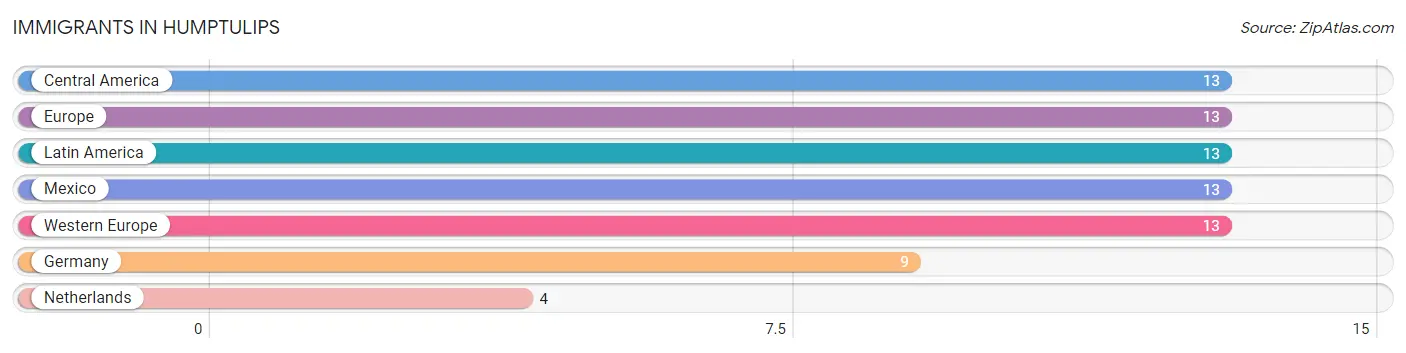
The most numerous immigrant groups reported in Humptulips came from Central America (13 | 5.3%), Europe (13 | 5.3%), Latin America (13 | 5.3%), Mexico (13 | 5.3%), and Western Europe (13 | 5.3%), together accounting for 26.6% of all Humptulips residents.
| Immigration Origin | # Population | % Population |
| Central America | 13 | 5.3% |
| Europe | 13 | 5.3% |
| Germany | 9 | 3.7% |
| Latin America | 13 | 5.3% |
| Mexico | 13 | 5.3% |
| Netherlands | 4 | 1.6% |
| Western Europe | 13 | 5.3% | View All 7 Rows |
Sex and Age in Humptulips
Sex and Age in Humptulips
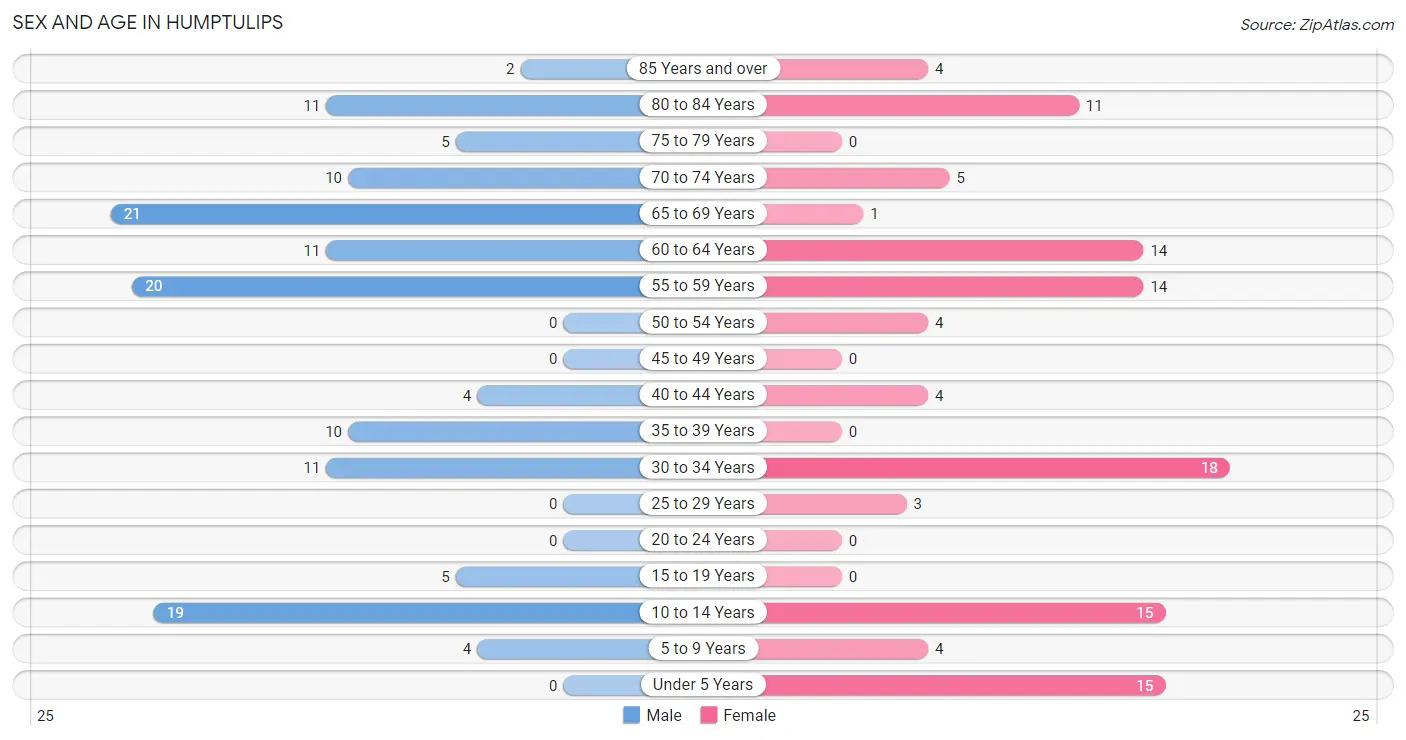
The most populous age groups in Humptulips are 65 to 69 Years (21 | 15.8%) for men and 30 to 34 Years (18 | 16.1%) for women.
| Age Bracket | Male | Female |
| Under 5 Years | 0 (0.0%) | 15 (13.4%) |
| 5 to 9 Years | 4 (3.0%) | 4 (3.6%) |
| 10 to 14 Years | 19 (14.3%) | 15 (13.4%) |
| 15 to 19 Years | 5 (3.8%) | 0 (0.0%) |
| 20 to 24 Years | 0 (0.0%) | 0 (0.0%) |
| 25 to 29 Years | 0 (0.0%) | 3 (2.7%) |
| 30 to 34 Years | 11 (8.3%) | 18 (16.1%) |
| 35 to 39 Years | 10 (7.5%) | 0 (0.0%) |
| 40 to 44 Years | 4 (3.0%) | 4 (3.6%) |
| 45 to 49 Years | 0 (0.0%) | 0 (0.0%) |
| 50 to 54 Years | 0 (0.0%) | 4 (3.6%) |
| 55 to 59 Years | 20 (15.0%) | 14 (12.5%) |
| 60 to 64 Years | 11 (8.3%) | 14 (12.5%) |
| 65 to 69 Years | 21 (15.8%) | 1 (0.9%) |
| 70 to 74 Years | 10 (7.5%) | 5 (4.5%) |
| 75 to 79 Years | 5 (3.8%) | 0 (0.0%) |
| 80 to 84 Years | 11 (8.3%) | 11 (9.8%) |
| 85 Years and over | 2 (1.5%) | 4 (3.6%) |
| Total | 133 (100.0%) | 112 (100.0%) |
Families and Households in Humptulips
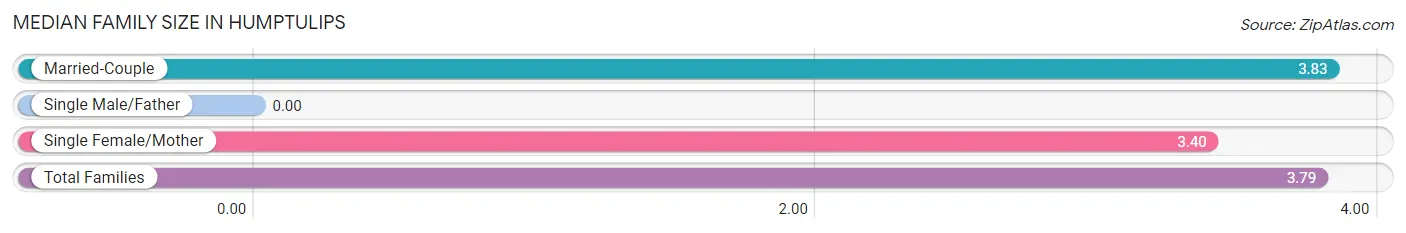
Median Family Size in Humptulips
| Family Type | # Families | Family Size |
| Married-Couple | 48 (90.6%) | 3.83 |
| Single Male/Father | 0 (0.0%) | - |
| Single Female/Mother | 5 (9.4%) | 3.40 |
| Total Families | 53 (100.0%) | 3.79 |
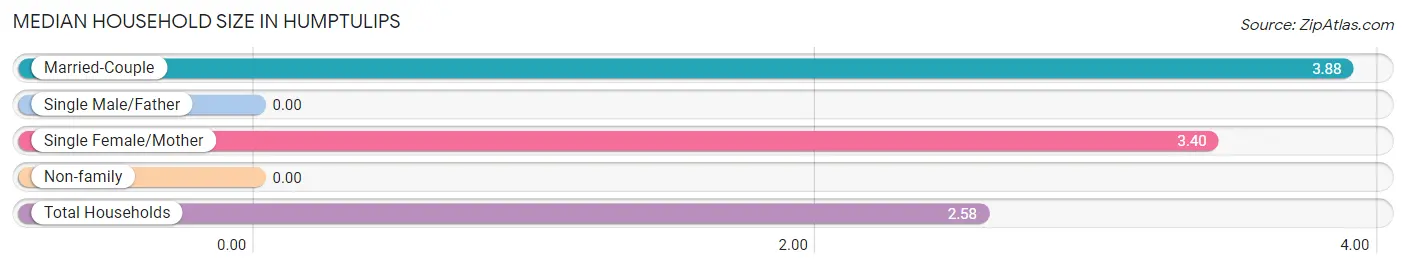
Median Household Size in Humptulips
| Household Type | # Households | Household Size |
| Married-Couple | 48 (50.5%) | 3.88 |
| Single Male/Father | 0 (0.0%) | - |
| Single Female/Mother | 5 (5.3%) | 3.40 |
| Non-family | 42 (44.2%) | - |
| Total Households | 95 (100.0%) | 2.58 |
Household Size by Marriage Status in Humptulips
Out of a total of 95 households in Humptulips, 53 (55.8%) are family households, while 42 (44.2%) are nonfamily households. The most numerous type of family households are 2-person households, comprising 25, and the most common type of nonfamily households are 1-person households, comprising 42.
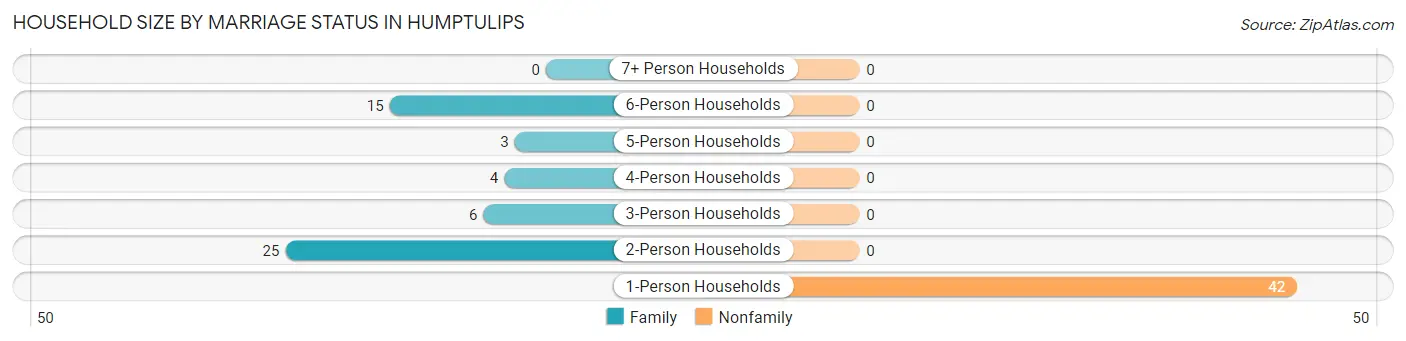
| Household Size | Family Households | Nonfamily Households |
| 1-Person Households | - | 42 (44.2%) |
| 2-Person Households | 25 (26.3%) | 0 (0.0%) |
| 3-Person Households | 6 (6.3%) | 0 (0.0%) |
| 4-Person Households | 4 (4.2%) | 0 (0.0%) |
| 5-Person Households | 3 (3.2%) | 0 (0.0%) |
| 6-Person Households | 15 (15.8%) | 0 (0.0%) |
| 7+ Person Households | 0 (0.0%) | 0 (0.0%) |
| Total | 53 (55.8%) | 42 (44.2%) |
Female Fertility in Humptulips
Fertility by Age in Humptulips
| Age Bracket | Women with Births | Births / 1,000 Women |
| 15 to 19 years | 0 (0.0%) | 0.0 |
| 20 to 34 years | 0 (0.0%) | 0.0 |
| 35 to 50 years | 0 (0.0%) | 0.0 |
| Total | 0 (0.0%) | 0.0 |
Fertility by Age by Marriage Status in Humptulips
| Age Bracket | Married | Unmarried |
| 15 to 19 years | 0 (0.0%) | 0 (0.0%) |
| 20 to 34 years | 0 (0.0%) | 0 (0.0%) |
| 35 to 50 years | 0 (0.0%) | 0 (0.0%) |
| Total | 0 (0.0%) | 0 (0.0%) |
Fertility by Education in Humptulips
| Educational Attainment | Women with Births | Births / 1,000 Women |
| Less than High School | 0 (0.0%) | 0.0 |
| High School Diploma | 0 (0.0%) | 0.0 |
| College or Associate's Degree | 0 (0.0%) | 0.0 |
| Bachelor's Degree | 0 (0.0%) | 0.0 |
| Graduate Degree | 0 (0.0%) | 0.0 |
| Total | 0 (0.0%) | 0.0 |
Fertility by Education by Marriage Status in Humptulips
| Educational Attainment | Married | Unmarried |
| Less than High School | 0 (0.0%) | 0 (0.0%) |
| High School Diploma | 0 (0.0%) | 0 (0.0%) |
| College or Associate's Degree | 0 (0.0%) | 0 (0.0%) |
| Bachelor's Degree | 0 (0.0%) | 0 (0.0%) |
| Graduate Degree | 0 (0.0%) | 0 (0.0%) |
| Total | 0 (0.0%) | 0 (0.0%) |
Employment Characteristics in Humptulips
Employment by Class of Employer in Humptulips
Among the 73 employed individuals in Humptulips, private company employees (62 | 84.9%), state government employees (4 | 5.5%), and federal government employees (4 | 5.5%) make up the most common classes of employment.
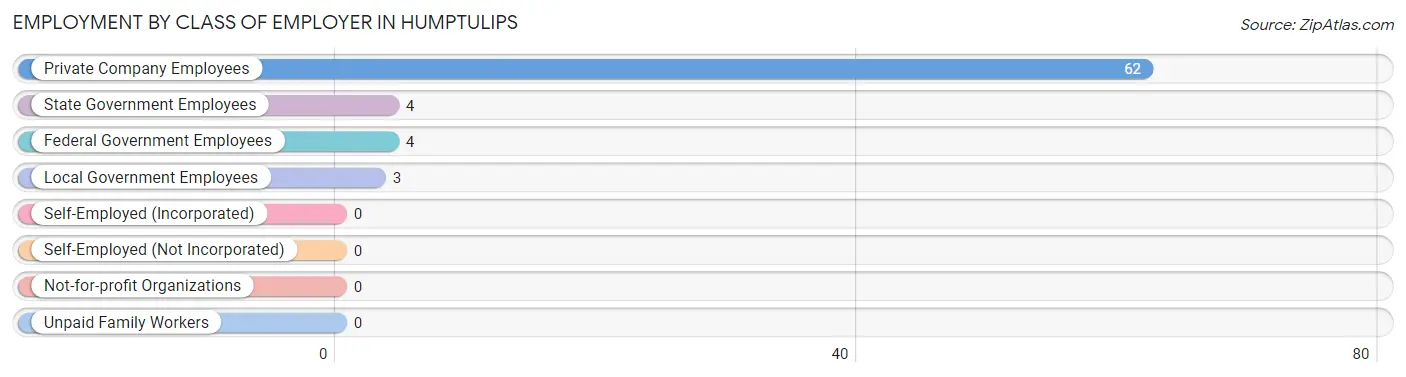
| Employer Class | # Employees | % Employees |
| Private Company Employees | 62 | 84.9% |
| Self-Employed (Incorporated) | 0 | 0.0% |
| Self-Employed (Not Incorporated) | 0 | 0.0% |
| Not-for-profit Organizations | 0 | 0.0% |
| Local Government Employees | 3 | 4.1% |
| State Government Employees | 4 | 5.5% |
| Federal Government Employees | 4 | 5.5% |
| Unpaid Family Workers | 0 | 0.0% |
| Total | 73 | 100.0% |
Employment Status by Age in Humptulips
According to the labor force statistics for Humptulips, out of the total population over 16 years of age (183), 42.6% or 78 individuals are in the labor force, with 6.4% or 5 of them unemployed. The age group with the highest labor force participation rate is 25 to 29 years, with 100.0% or 3 individuals in the labor force. Within the labor force, the 30 to 34 years age range has the highest percentage of unemployed individuals, with 62.5% or 5 of them being unemployed.
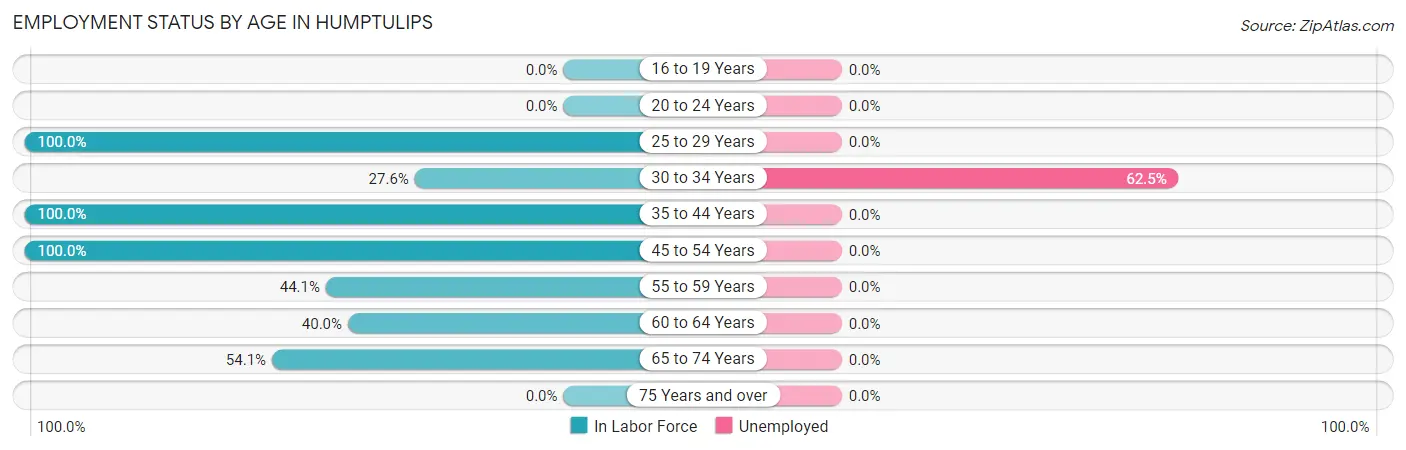
| Age Bracket | In Labor Force | Unemployed |
| 16 to 19 Years | 0 (0.0%) | 0 (0.0%) |
| 20 to 24 Years | 0 (0.0%) | 0 (0.0%) |
| 25 to 29 Years | 3 (100.0%) | 0 (0.0%) |
| 30 to 34 Years | 8 (27.6%) | 5 (62.5%) |
| 35 to 44 Years | 18 (100.0%) | 0 (0.0%) |
| 45 to 54 Years | 4 (100.0%) | 0 (0.0%) |
| 55 to 59 Years | 15 (44.1%) | 0 (0.0%) |
| 60 to 64 Years | 10 (40.0%) | 0 (0.0%) |
| 65 to 74 Years | 20 (54.1%) | 0 (0.0%) |
| 75 Years and over | 0 (0.0%) | 0 (0.0%) |
| Total | 78 (42.6%) | 5 (6.4%) |
Employment Status by Educational Attainment in Humptulips
According to labor force statistics for Humptulips, 51.3% of individuals (58) out of the total population between 25 and 64 years of age (113) are in the labor force, with 8.6% or 5 of them being unemployed. The group with the highest labor force participation rate are those with the educational attainment of bachelor's degree or higher, with 100.0% or 18 individuals in the labor force. Within the labor force, individuals with college / associate degree education have the highest percentage of unemployment, with 55.6% or 5 of them being unemployed.
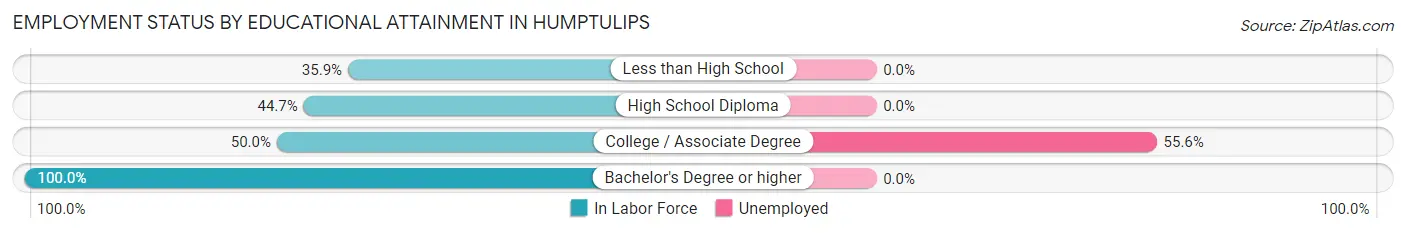
| Educational Attainment | In Labor Force | Unemployed |
| Less than High School | 14 (35.9%) | 0 (0.0%) |
| High School Diploma | 17 (44.7%) | 0 (0.0%) |
| College / Associate Degree | 9 (50.0%) | 10 (55.6%) |
| Bachelor's Degree or higher | 18 (100.0%) | 0 (0.0%) |
| Total | 58 (51.3%) | 10 (8.6%) |
Employment Occupations by Sex in Humptulips
Management, Business, Science and Arts Occupations
The most common Management, Business, Science and Arts occupations in Humptulips are Management (11 | 15.1%), Community & Social Service (3 | 4.1%), and Education Instruction & Library (3 | 4.1%).
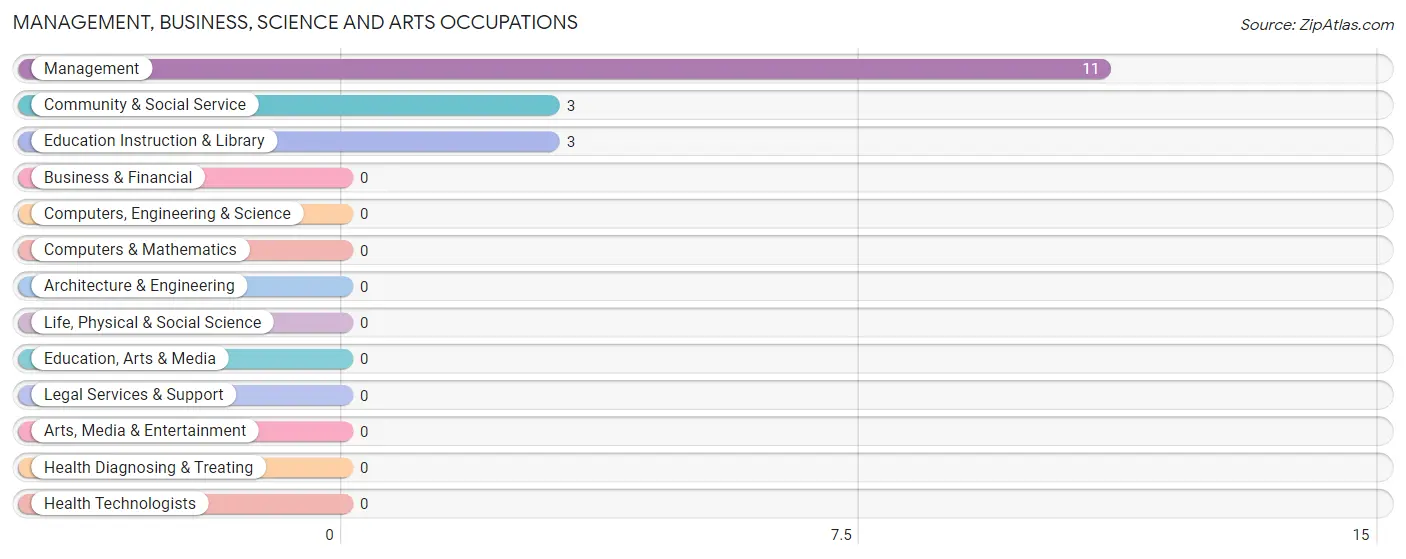
Management, Business, Science and Arts Occupations by Sex
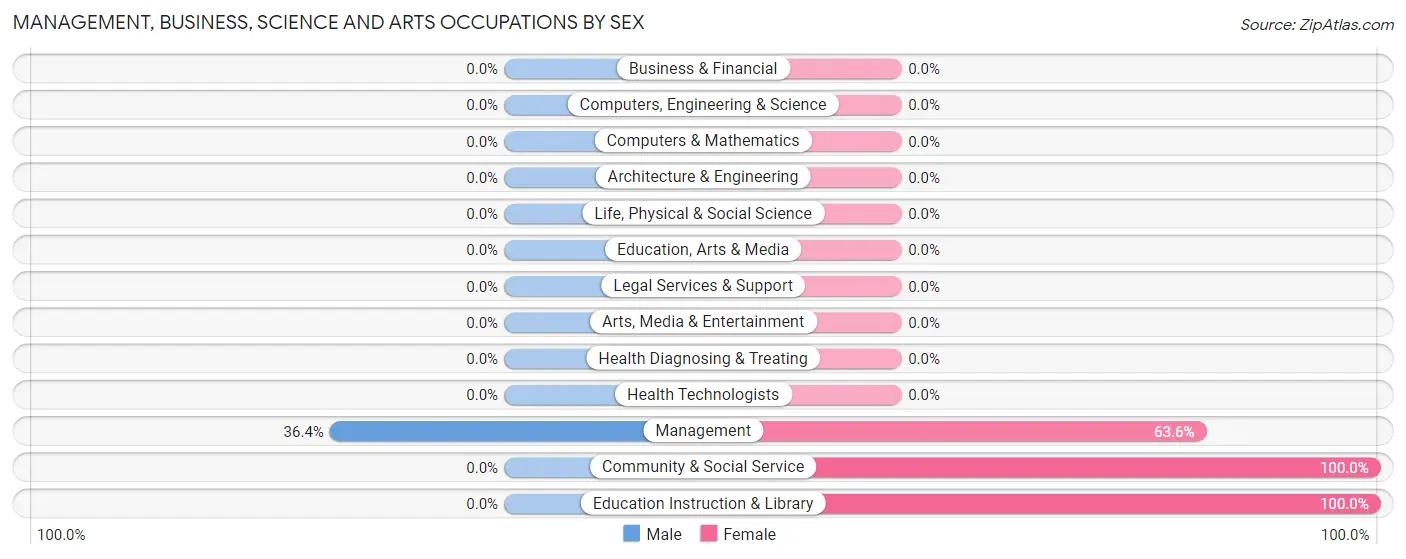
| Occupation | Male | Female |
| Management | 4 (36.4%) | 7 (63.6%) |
| Business & Financial | 0 (0.0%) | 0 (0.0%) |
| Computers, Engineering & Science | 0 (0.0%) | 0 (0.0%) |
| Computers & Mathematics | 0 (0.0%) | 0 (0.0%) |
| Architecture & Engineering | 0 (0.0%) | 0 (0.0%) |
| Life, Physical & Social Science | 0 (0.0%) | 0 (0.0%) |
| Community & Social Service | 0 (0.0%) | 3 (100.0%) |
| Education, Arts & Media | 0 (0.0%) | 0 (0.0%) |
| Legal Services & Support | 0 (0.0%) | 0 (0.0%) |
| Education Instruction & Library | 0 (0.0%) | 3 (100.0%) |
| Arts, Media & Entertainment | 0 (0.0%) | 0 (0.0%) |
| Health Diagnosing & Treating | 0 (0.0%) | 0 (0.0%) |
| Health Technologists | 0 (0.0%) | 0 (0.0%) |
| Total (Category) | 4 (28.6%) | 10 (71.4%) |
| Total (Overall) | 37 (50.7%) | 36 (49.3%) |
Services Occupations
The most common Services occupations in Humptulips are , and Cleaning & Maintenance (11 | 15.1%).
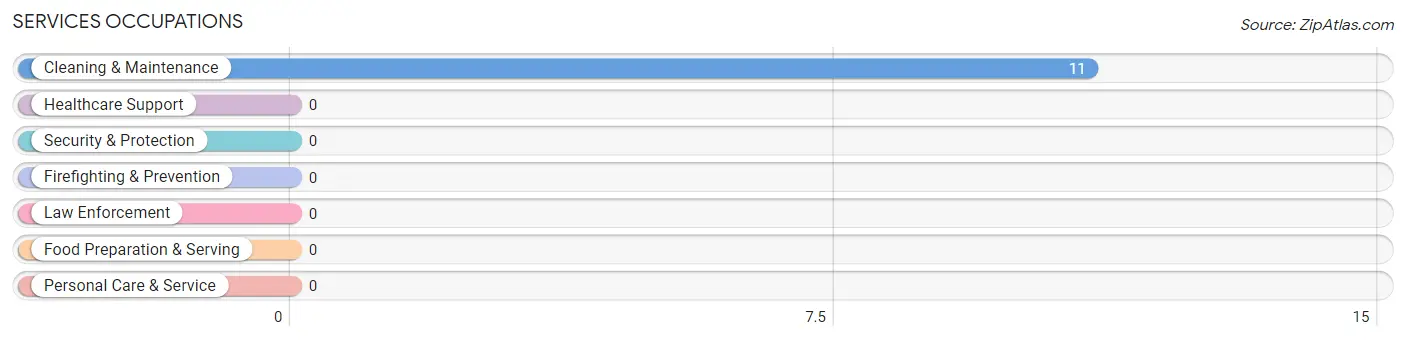
Services Occupations by Sex
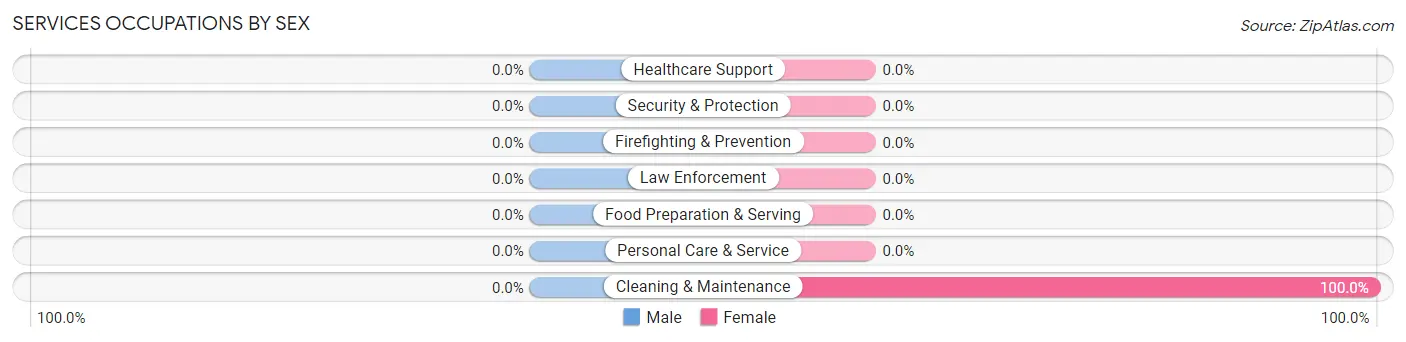
| Occupation | Male | Female |
| Healthcare Support | 0 (0.0%) | 0 (0.0%) |
| Security & Protection | 0 (0.0%) | 0 (0.0%) |
| Firefighting & Prevention | 0 (0.0%) | 0 (0.0%) |
| Law Enforcement | 0 (0.0%) | 0 (0.0%) |
| Food Preparation & Serving | 0 (0.0%) | 0 (0.0%) |
| Cleaning & Maintenance | 0 (0.0%) | 11 (100.0%) |
| Personal Care & Service | 0 (0.0%) | 0 (0.0%) |
| Total (Category) | 0 (0.0%) | 11 (100.0%) |
| Total (Overall) | 37 (50.7%) | 36 (49.3%) |
Sales and Office Occupations
The most common Sales and Office occupations in Humptulips are Office & Administration (11 | 15.1%), and Sales & Related (4 | 5.5%).
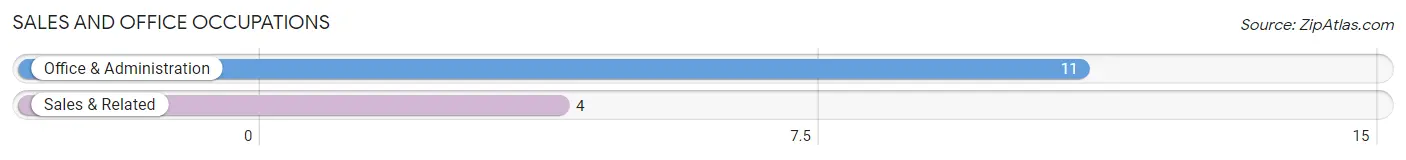
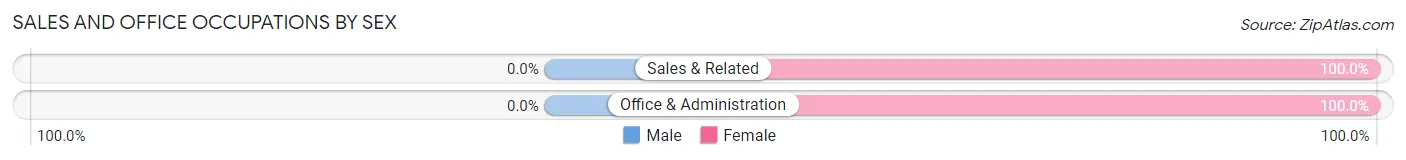
Sales and Office Occupations by Sex
| Occupation | Male | Female |
| Sales & Related | 0 (0.0%) | 4 (100.0%) |
| Office & Administration | 0 (0.0%) | 11 (100.0%) |
| Total (Category) | 0 (0.0%) | 15 (100.0%) |
| Total (Overall) | 37 (50.7%) | 36 (49.3%) |
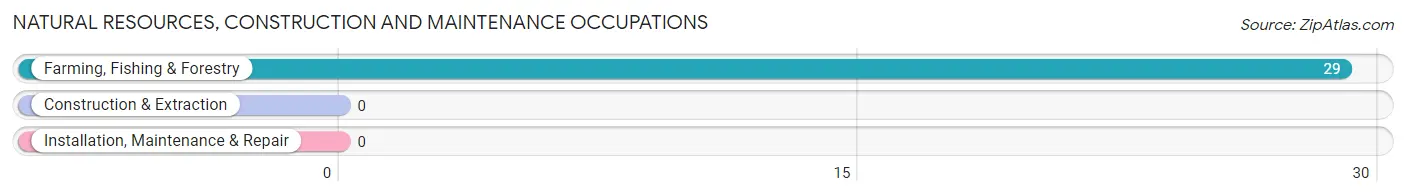
Natural Resources, Construction and Maintenance Occupations
The most common Natural Resources, Construction and Maintenance occupations in Humptulips are , and Farming, Fishing & Forestry (29 | 39.7%).
Natural Resources, Construction and Maintenance Occupations by Sex
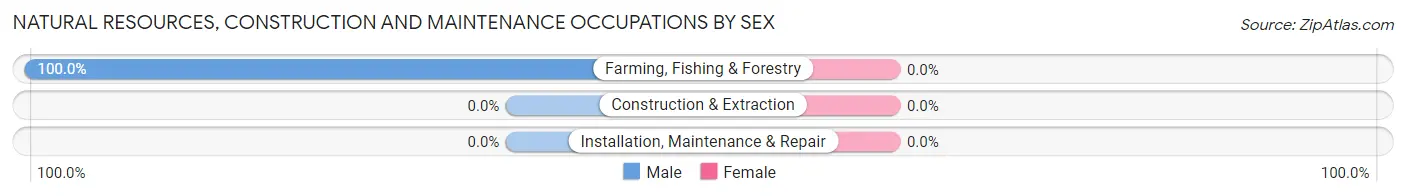
| Occupation | Male | Female |
| Farming, Fishing & Forestry | 29 (100.0%) | 0 (0.0%) |
| Construction & Extraction | 0 (0.0%) | 0 (0.0%) |
| Installation, Maintenance & Repair | 0 (0.0%) | 0 (0.0%) |
| Total (Category) | 29 (100.0%) | 0 (0.0%) |
| Total (Overall) | 37 (50.7%) | 36 (49.3%) |
Production, Transportation and Moving Occupations
The most common Production, Transportation and Moving occupations in Humptulips are , and Production (4 | 5.5%).
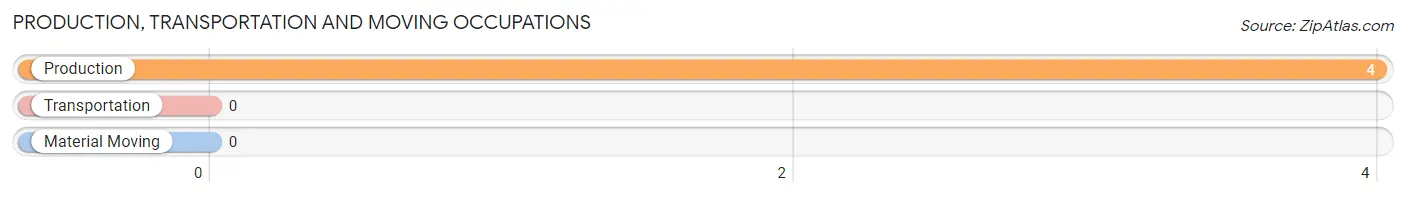
Production, Transportation and Moving Occupations by Sex
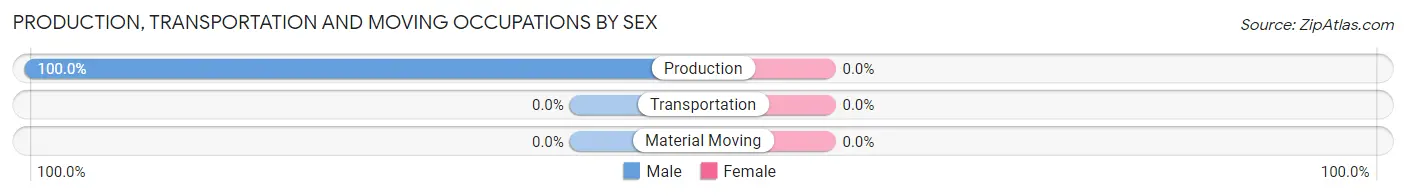
| Occupation | Male | Female |
| Production | 4 (100.0%) | 0 (0.0%) |
| Transportation | 0 (0.0%) | 0 (0.0%) |
| Material Moving | 0 (0.0%) | 0 (0.0%) |
| Total (Category) | 4 (100.0%) | 0 (0.0%) |
| Total (Overall) | 37 (50.7%) | 36 (49.3%) |
Employment Industries by Sex in Humptulips
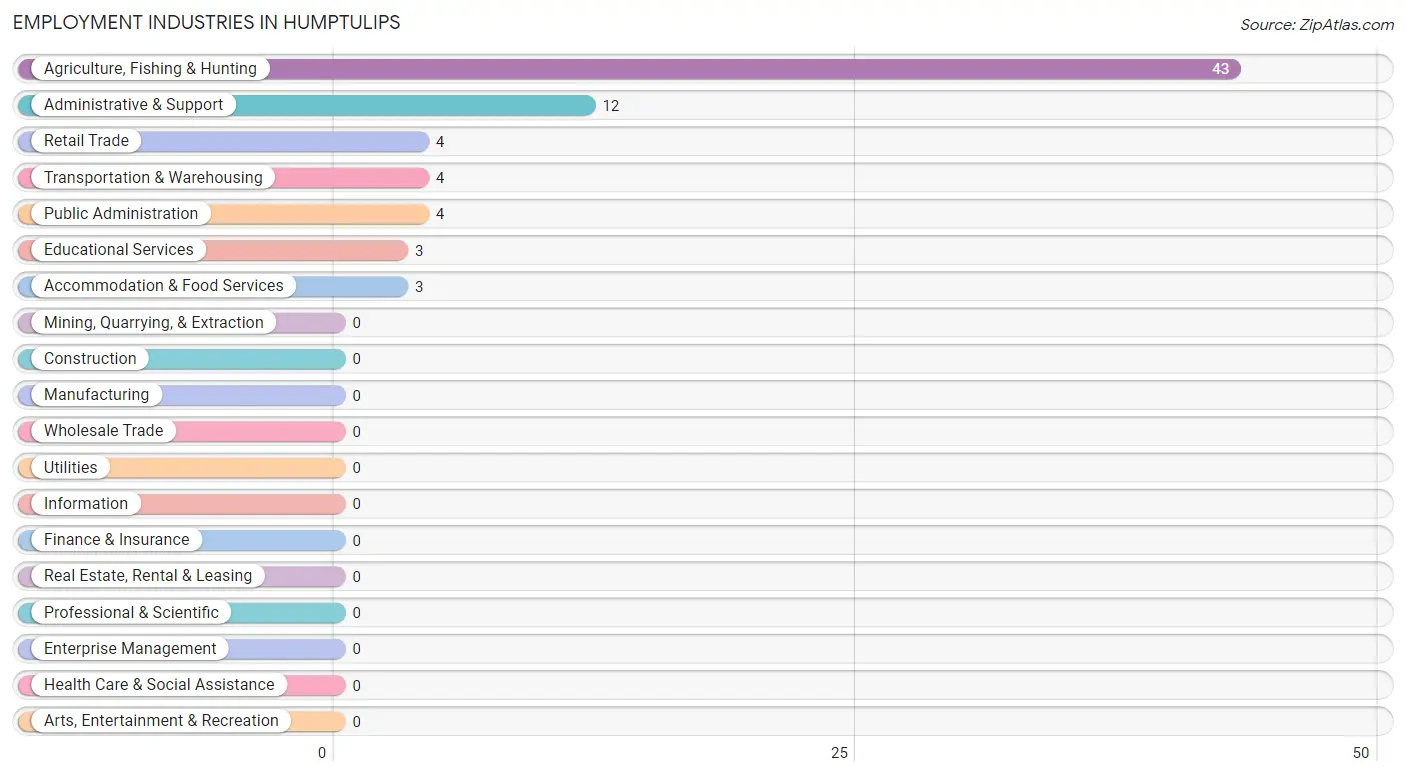
Employment Industries in Humptulips
The major employment industries in Humptulips include Agriculture, Fishing & Hunting (43 | 58.9%), Administrative & Support (12 | 16.4%), Retail Trade (4 | 5.5%), Transportation & Warehousing (4 | 5.5%), and Public Administration (4 | 5.5%).
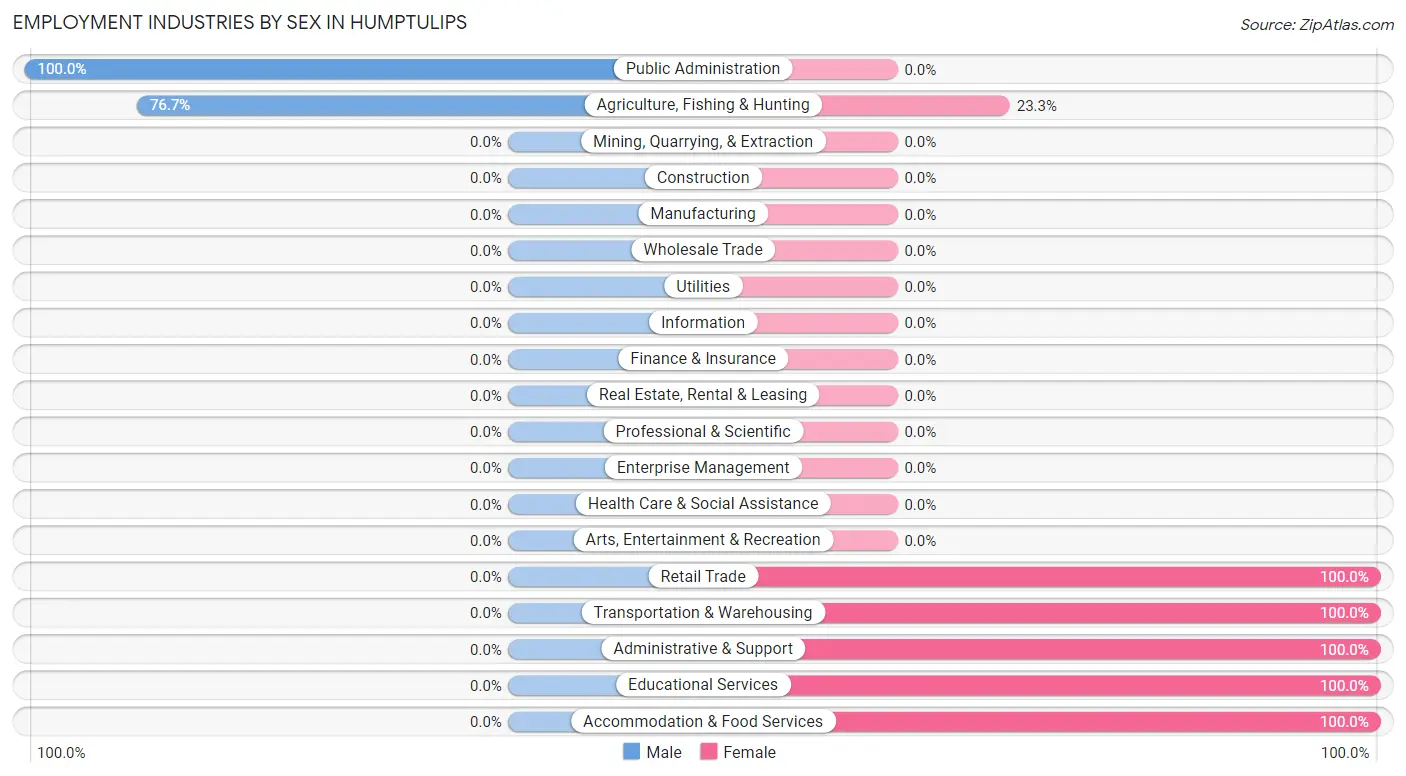
Employment Industries by Sex in Humptulips
The Humptulips industries that see more men than women are Public Administration (100.0%), and Agriculture, Fishing & Hunting (76.7%), whereas the industries that tend to have a higher number of women are Retail Trade (100.0%), Transportation & Warehousing (100.0%), and Administrative & Support (100.0%).
| Industry | Male | Female |
| Agriculture, Fishing & Hunting | 33 (76.7%) | 10 (23.3%) |
| Mining, Quarrying, & Extraction | 0 (0.0%) | 0 (0.0%) |
| Construction | 0 (0.0%) | 0 (0.0%) |
| Manufacturing | 0 (0.0%) | 0 (0.0%) |
| Wholesale Trade | 0 (0.0%) | 0 (0.0%) |
| Retail Trade | 0 (0.0%) | 4 (100.0%) |
| Transportation & Warehousing | 0 (0.0%) | 4 (100.0%) |
| Utilities | 0 (0.0%) | 0 (0.0%) |
| Information | 0 (0.0%) | 0 (0.0%) |
| Finance & Insurance | 0 (0.0%) | 0 (0.0%) |
| Real Estate, Rental & Leasing | 0 (0.0%) | 0 (0.0%) |
| Professional & Scientific | 0 (0.0%) | 0 (0.0%) |
| Enterprise Management | 0 (0.0%) | 0 (0.0%) |
| Administrative & Support | 0 (0.0%) | 12 (100.0%) |
| Educational Services | 0 (0.0%) | 3 (100.0%) |
| Health Care & Social Assistance | 0 (0.0%) | 0 (0.0%) |
| Arts, Entertainment & Recreation | 0 (0.0%) | 0 (0.0%) |
| Accommodation & Food Services | 0 (0.0%) | 3 (100.0%) |
| Public Administration | 4 (100.0%) | 0 (0.0%) |
| Total | 37 (50.7%) | 36 (49.3%) |
Education in Humptulips
School Enrollment in Humptulips
The most common levels of schooling among the 47 students in Humptulips are middle school (35 | 74.5%), elementary school (8 | 17.0%), and kindergarten (4 | 8.5%).
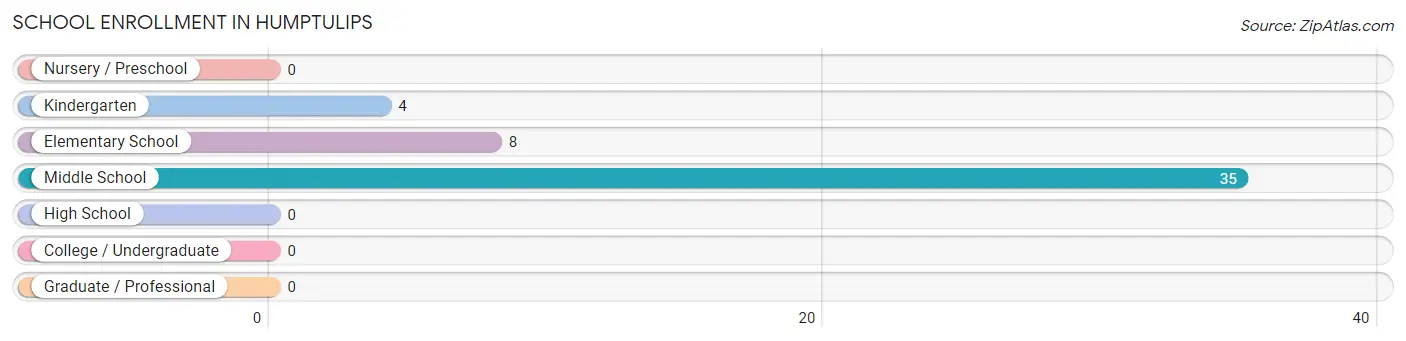
| School Level | # Students | % Students |
| Nursery / Preschool | 0 | 0.0% |
| Kindergarten | 4 | 8.5% |
| Elementary School | 8 | 17.0% |
| Middle School | 35 | 74.5% |
| High School | 0 | 0.0% |
| College / Undergraduate | 0 | 0.0% |
| Graduate / Professional | 0 | 0.0% |
| Total | 47 | 100.0% |
School Enrollment by Age by Funding Source in Humptulips
Out of a total of 47 students who are enrolled in schools in Humptulips, 5 (10.6%) attend a private institution, while the remaining 42 (89.4%) are enrolled in public schools. The age group of 15 to 17 year olds has the highest likelihood of being enrolled in private schools, with 5 (100.0% in the age bracket) enrolled. Conversely, the age group of 5 to 9 year old has the lowest likelihood of being enrolled in a private school, with 8 (100.0% in the age bracket) attending a public institution.
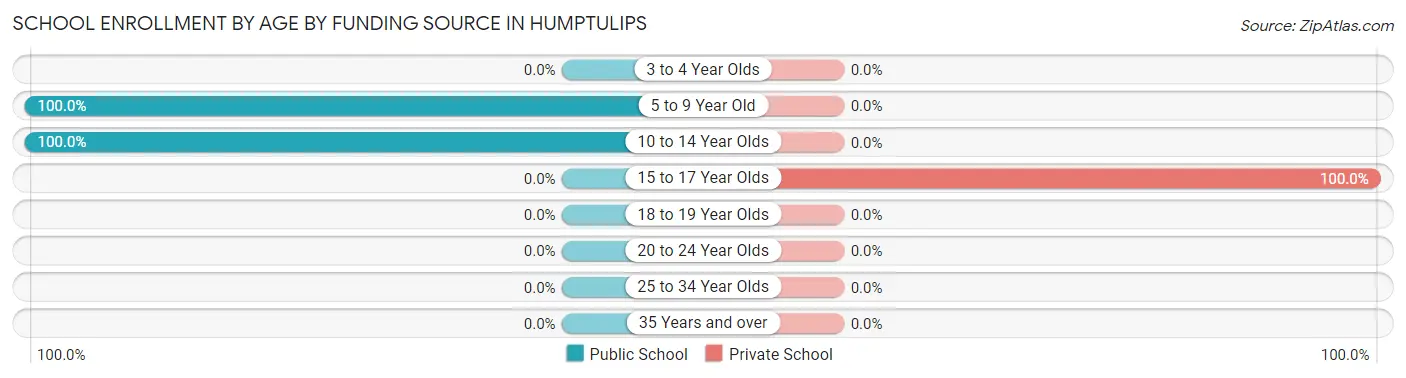
| Age Bracket | Public School | Private School |
| 3 to 4 Year Olds | 0 (0.0%) | 0 (0.0%) |
| 5 to 9 Year Old | 8 (100.0%) | 0 (0.0%) |
| 10 to 14 Year Olds | 34 (100.0%) | 0 (0.0%) |
| 15 to 17 Year Olds | 0 (0.0%) | 5 (100.0%) |
| 18 to 19 Year Olds | 0 (0.0%) | 0 (0.0%) |
| 20 to 24 Year Olds | 0 (0.0%) | 0 (0.0%) |
| 25 to 34 Year Olds | 0 (0.0%) | 0 (0.0%) |
| 35 Years and over | 0 (0.0%) | 0 (0.0%) |
| Total | 42 (89.4%) | 5 (10.6%) |
Educational Attainment by Field of Study in Humptulips
Arts & humanities (11 | 40.7%), engineering (9 | 33.3%), multidisciplinary studies (4 | 14.8%), and education (3 | 11.1%) are the most common fields of study among 27 individuals in Humptulips who have obtained a bachelor's degree or higher.
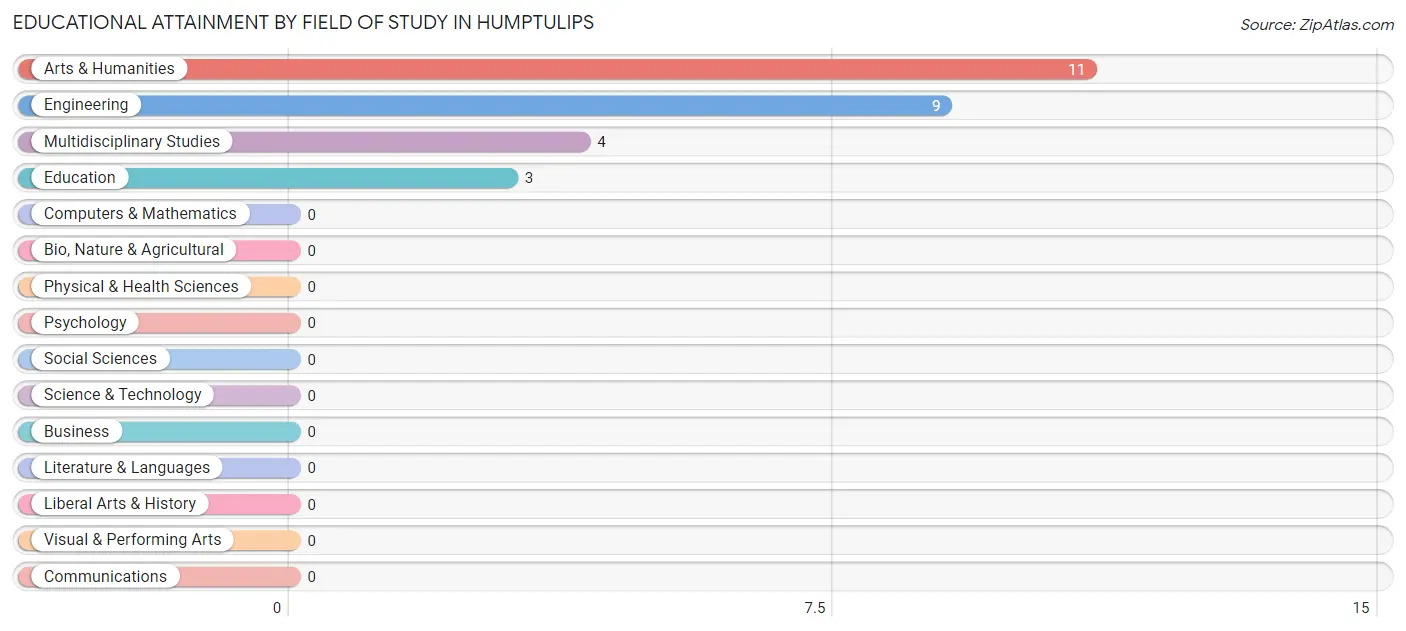
| Field of Study | # Graduates | % Graduates |
| Computers & Mathematics | 0 | 0.0% |
| Bio, Nature & Agricultural | 0 | 0.0% |
| Physical & Health Sciences | 0 | 0.0% |
| Psychology | 0 | 0.0% |
| Social Sciences | 0 | 0.0% |
| Engineering | 9 | 33.3% |
| Multidisciplinary Studies | 4 | 14.8% |
| Science & Technology | 0 | 0.0% |
| Business | 0 | 0.0% |
| Education | 3 | 11.1% |
| Literature & Languages | 0 | 0.0% |
| Liberal Arts & History | 0 | 0.0% |
| Visual & Performing Arts | 0 | 0.0% |
| Communications | 0 | 0.0% |
| Arts & Humanities | 11 | 40.7% |
| Total | 27 | 100.0% |
Transportation & Commute in Humptulips
Vehicle Availability by Sex in Humptulips
The most prevalent vehicle ownership categories in Humptulips are males with 2 vehicles (33, accounting for 89.2%) and females with 2 vehicles (18, making up 91.7%).
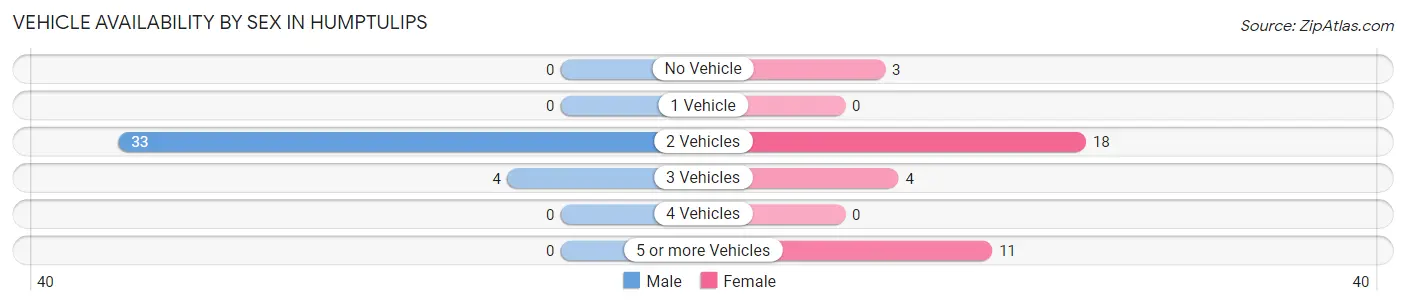
| Vehicles Available | Male | Female |
| No Vehicle | 0 (0.0%) | 3 (8.3%) |
| 1 Vehicle | 0 (0.0%) | 0 (0.0%) |
| 2 Vehicles | 33 (89.2%) | 18 (50.0%) |
| 3 Vehicles | 4 (10.8%) | 4 (11.1%) |
| 4 Vehicles | 0 (0.0%) | 0 (0.0%) |
| 5 or more Vehicles | 0 (0.0%) | 11 (30.6%) |
| Total | 37 (100.0%) | 36 (100.0%) |
Commute Time in Humptulips
The most frequently occuring commute durations in Humptulips are 5 to 9 minutes (19 commuters, 26.4%), less than 5 minutes (18 commuters, 25.0%), and 90 or more minutes (13 commuters, 18.1%).
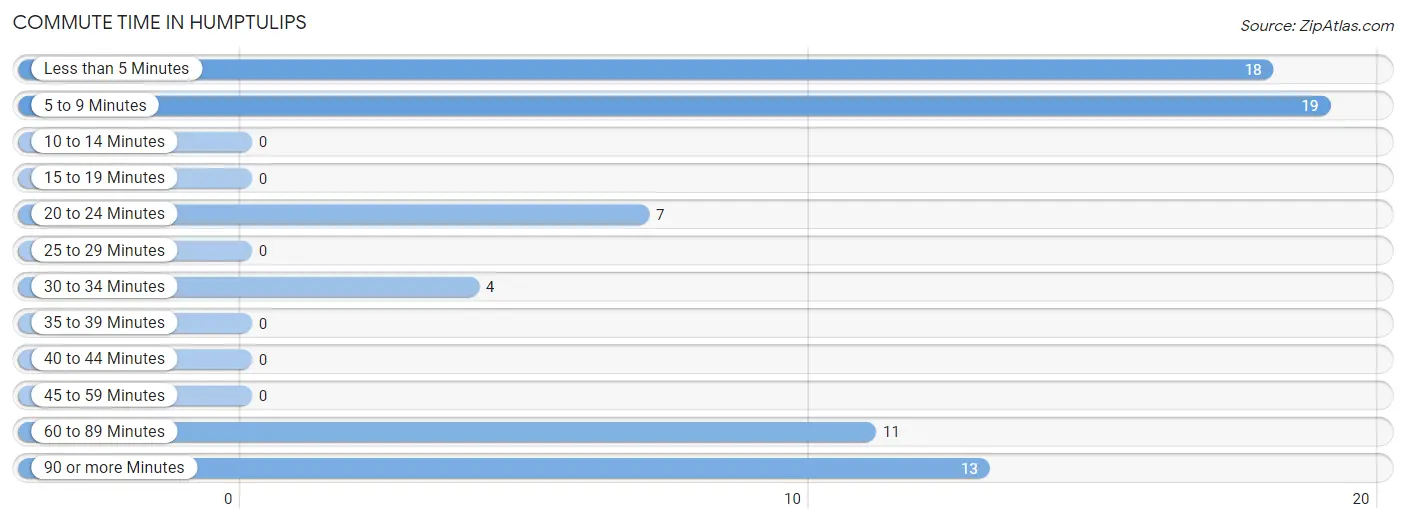
| Commute Time | # Commuters | % Commuters |
| Less than 5 Minutes | 18 | 25.0% |
| 5 to 9 Minutes | 19 | 26.4% |
| 10 to 14 Minutes | 0 | 0.0% |
| 15 to 19 Minutes | 0 | 0.0% |
| 20 to 24 Minutes | 7 | 9.7% |
| 25 to 29 Minutes | 0 | 0.0% |
| 30 to 34 Minutes | 4 | 5.6% |
| 35 to 39 Minutes | 0 | 0.0% |
| 40 to 44 Minutes | 0 | 0.0% |
| 45 to 59 Minutes | 0 | 0.0% |
| 60 to 89 Minutes | 11 | 15.3% |
| 90 or more Minutes | 13 | 18.1% |
Commute Time by Sex in Humptulips
The most common commute times in Humptulips are 5 to 9 minutes (19 commuters, 51.3%) for males and less than 5 minutes (14 commuters, 40.0%) for females.
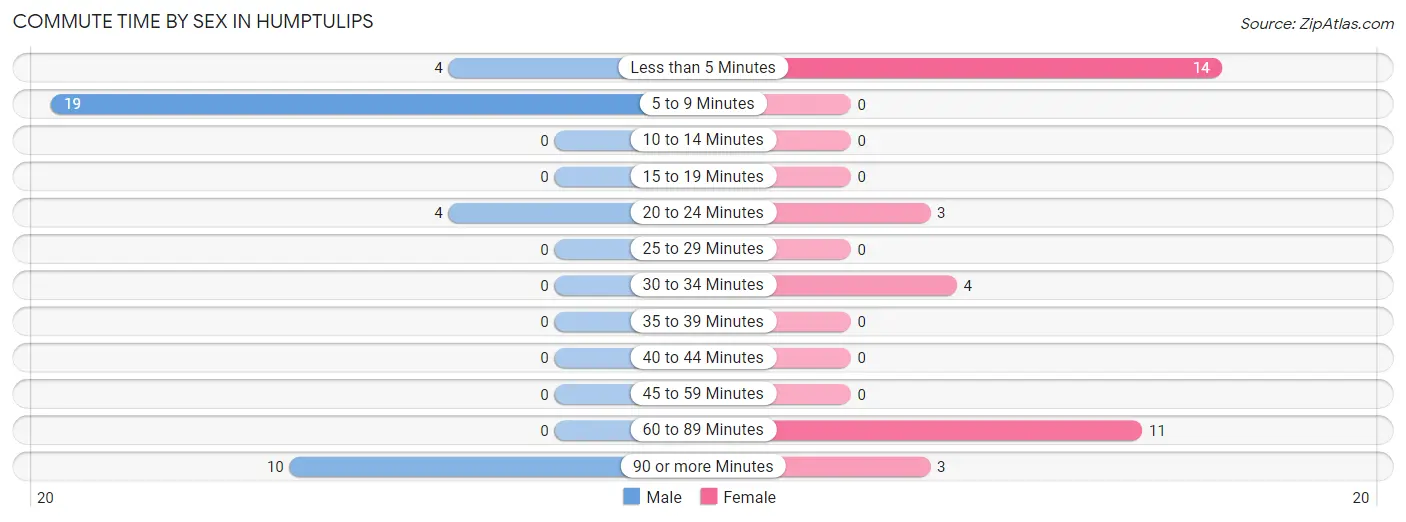
| Commute Time | Male | Female |
| Less than 5 Minutes | 4 (10.8%) | 14 (40.0%) |
| 5 to 9 Minutes | 19 (51.3%) | 0 (0.0%) |
| 10 to 14 Minutes | 0 (0.0%) | 0 (0.0%) |
| 15 to 19 Minutes | 0 (0.0%) | 0 (0.0%) |
| 20 to 24 Minutes | 4 (10.8%) | 3 (8.6%) |
| 25 to 29 Minutes | 0 (0.0%) | 0 (0.0%) |
| 30 to 34 Minutes | 0 (0.0%) | 4 (11.4%) |
| 35 to 39 Minutes | 0 (0.0%) | 0 (0.0%) |
| 40 to 44 Minutes | 0 (0.0%) | 0 (0.0%) |
| 45 to 59 Minutes | 0 (0.0%) | 0 (0.0%) |
| 60 to 89 Minutes | 0 (0.0%) | 11 (31.4%) |
| 90 or more Minutes | 10 (27.0%) | 3 (8.6%) |
Time of Departure to Work by Sex in Humptulips
The most frequent times of departure to work in Humptulips are 12:00 AM to 4:59 AM (19, 51.3%) for males and 7:00 AM to 7:29 AM (14, 40.0%) for females.
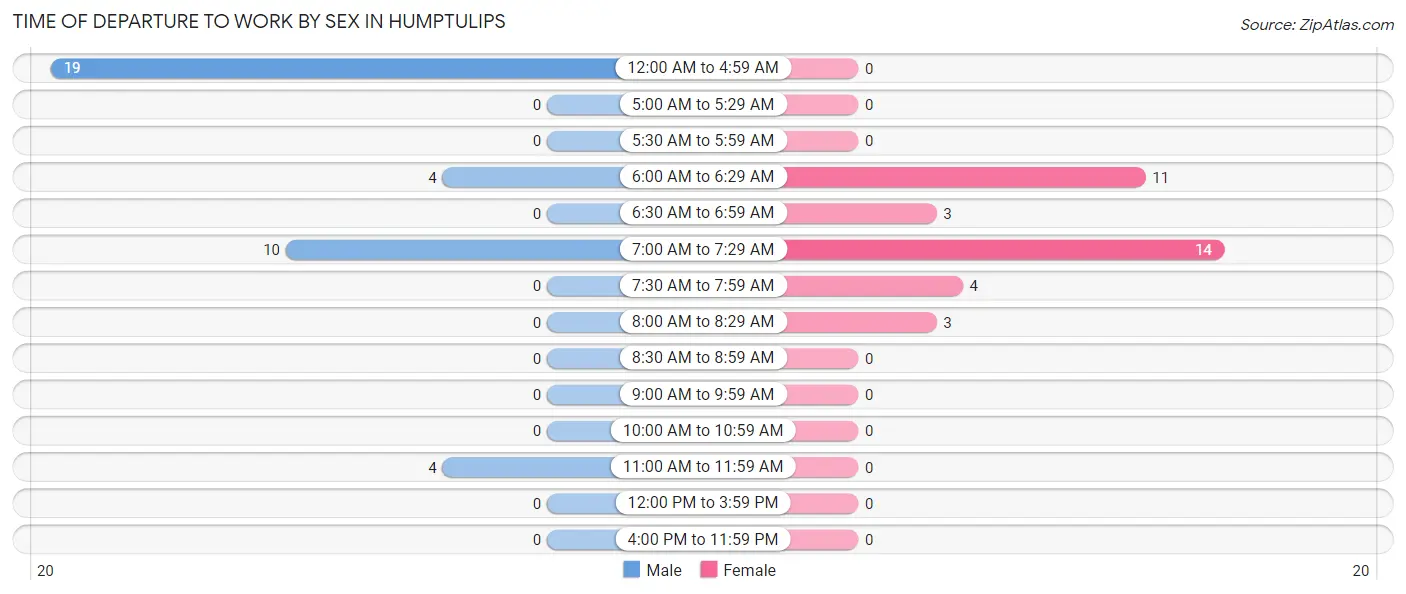
| Time of Departure | Male | Female |
| 12:00 AM to 4:59 AM | 19 (51.3%) | 0 (0.0%) |
| 5:00 AM to 5:29 AM | 0 (0.0%) | 0 (0.0%) |
| 5:30 AM to 5:59 AM | 0 (0.0%) | 0 (0.0%) |
| 6:00 AM to 6:29 AM | 4 (10.8%) | 11 (31.4%) |
| 6:30 AM to 6:59 AM | 0 (0.0%) | 3 (8.6%) |
| 7:00 AM to 7:29 AM | 10 (27.0%) | 14 (40.0%) |
| 7:30 AM to 7:59 AM | 0 (0.0%) | 4 (11.4%) |
| 8:00 AM to 8:29 AM | 0 (0.0%) | 3 (8.6%) |
| 8:30 AM to 8:59 AM | 0 (0.0%) | 0 (0.0%) |
| 9:00 AM to 9:59 AM | 0 (0.0%) | 0 (0.0%) |
| 10:00 AM to 10:59 AM | 0 (0.0%) | 0 (0.0%) |
| 11:00 AM to 11:59 AM | 4 (10.8%) | 0 (0.0%) |
| 12:00 PM to 3:59 PM | 0 (0.0%) | 0 (0.0%) |
| 4:00 PM to 11:59 PM | 0 (0.0%) | 0 (0.0%) |
| Total | 37 (100.0%) | 35 (100.0%) |
Housing Occupancy in Humptulips
Occupancy by Ownership in Humptulips
Of the total 95 dwellings in Humptulips, owner-occupied units account for 78 (82.1%), while renter-occupied units make up 17 (17.9%).
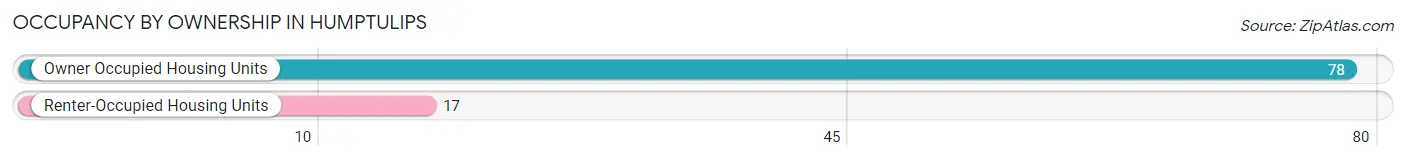
| Occupancy | # Housing Units | % Housing Units |
| Owner Occupied Housing Units | 78 | 82.1% |
| Renter-Occupied Housing Units | 17 | 17.9% |
| Total Occupied Housing Units | 95 | 100.0% |
Occupancy by Household Size in Humptulips
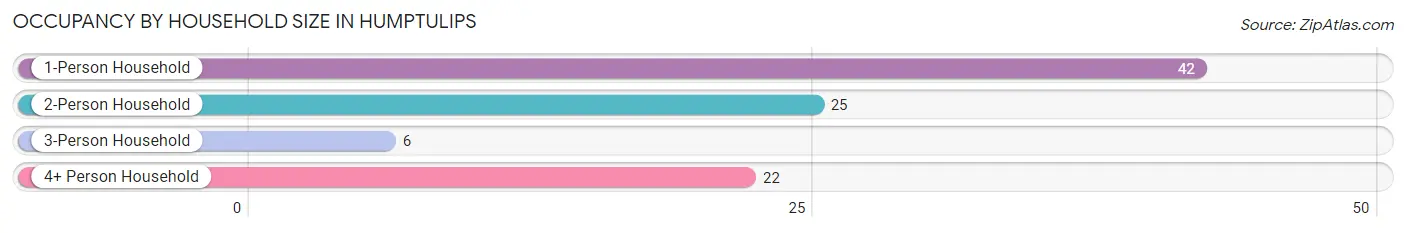
| Household Size | # Housing Units | % Housing Units |
| 1-Person Household | 42 | 44.2% |
| 2-Person Household | 25 | 26.3% |
| 3-Person Household | 6 | 6.3% |
| 4+ Person Household | 22 | 23.2% |
| Total Housing Units | 95 | 100.0% |
Occupancy by Ownership by Household Size in Humptulips
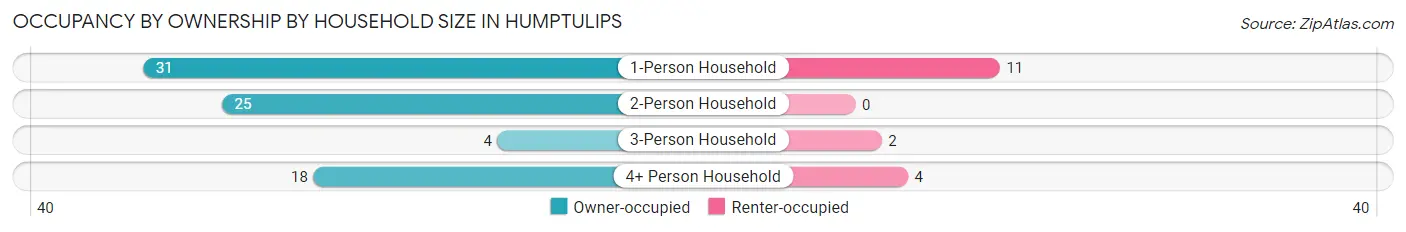
| Household Size | Owner-occupied | Renter-occupied |
| 1-Person Household | 31 (73.8%) | 11 (26.2%) |
| 2-Person Household | 25 (100.0%) | 0 (0.0%) |
| 3-Person Household | 4 (66.7%) | 2 (33.3%) |
| 4+ Person Household | 18 (81.8%) | 4 (18.2%) |
| Total Housing Units | 78 (82.1%) | 17 (17.9%) |
Occupancy by Educational Attainment in Humptulips
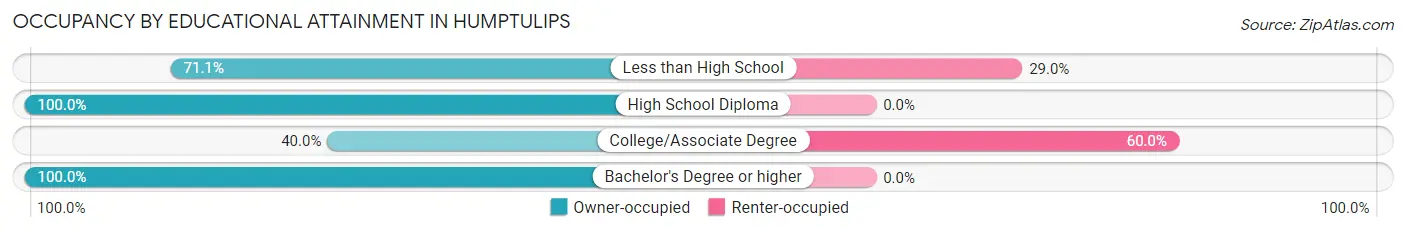
| Household Size | Owner-occupied | Renter-occupied |
| Less than High School | 27 (71.1%) | 11 (28.9%) |
| High School Diploma | 38 (100.0%) | 0 (0.0%) |
| College/Associate Degree | 4 (40.0%) | 6 (60.0%) |
| Bachelor's Degree or higher | 9 (100.0%) | 0 (0.0%) |
Occupancy by Age of Householder in Humptulips
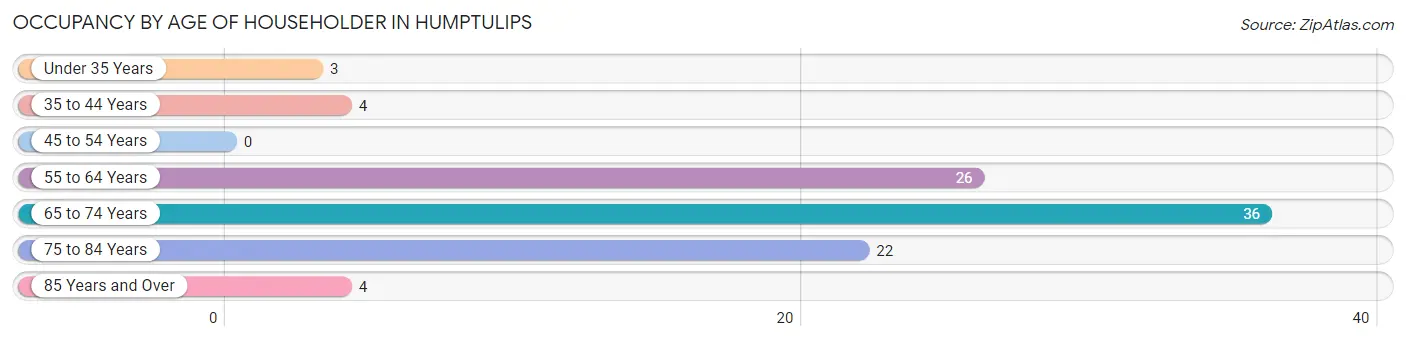
| Age Bracket | # Households | % Households |
| Under 35 Years | 3 | 3.2% |
| 35 to 44 Years | 4 | 4.2% |
| 45 to 54 Years | 0 | 0.0% |
| 55 to 64 Years | 26 | 27.4% |
| 65 to 74 Years | 36 | 37.9% |
| 75 to 84 Years | 22 | 23.2% |
| 85 Years and Over | 4 | 4.2% |
| Total | 95 | 100.0% |
Housing Finances in Humptulips
Median Income by Occupancy in Humptulips
| Occupancy Type | # Households | Median Income |
| Owner-Occupied | 78 (82.1%) | $0 |
| Renter-Occupied | 17 (17.9%) | $0 |
| Average | 95 (100.0%) | $0 |
Occupancy by Householder Income Bracket in Humptulips
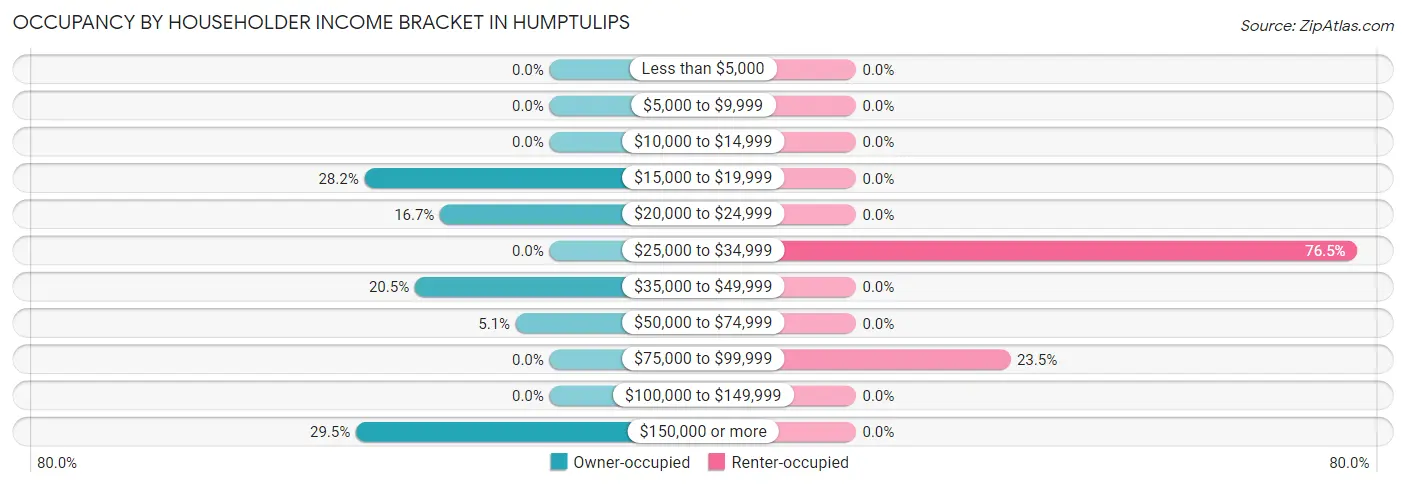
| Income Bracket | Owner-occupied | Renter-occupied |
| Less than $5,000 | 0 (0.0%) | 0 (0.0%) |
| $5,000 to $9,999 | 0 (0.0%) | 0 (0.0%) |
| $10,000 to $14,999 | 0 (0.0%) | 0 (0.0%) |
| $15,000 to $19,999 | 22 (28.2%) | 0 (0.0%) |
| $20,000 to $24,999 | 13 (16.7%) | 0 (0.0%) |
| $25,000 to $34,999 | 0 (0.0%) | 13 (76.5%) |
| $35,000 to $49,999 | 16 (20.5%) | 0 (0.0%) |
| $50,000 to $74,999 | 4 (5.1%) | 0 (0.0%) |
| $75,000 to $99,999 | 0 (0.0%) | 4 (23.5%) |
| $100,000 to $149,999 | 0 (0.0%) | 0 (0.0%) |
| $150,000 or more | 23 (29.5%) | 0 (0.0%) |
| Total | 78 (100.0%) | 17 (100.0%) |
Monthly Housing Cost Tiers in Humptulips
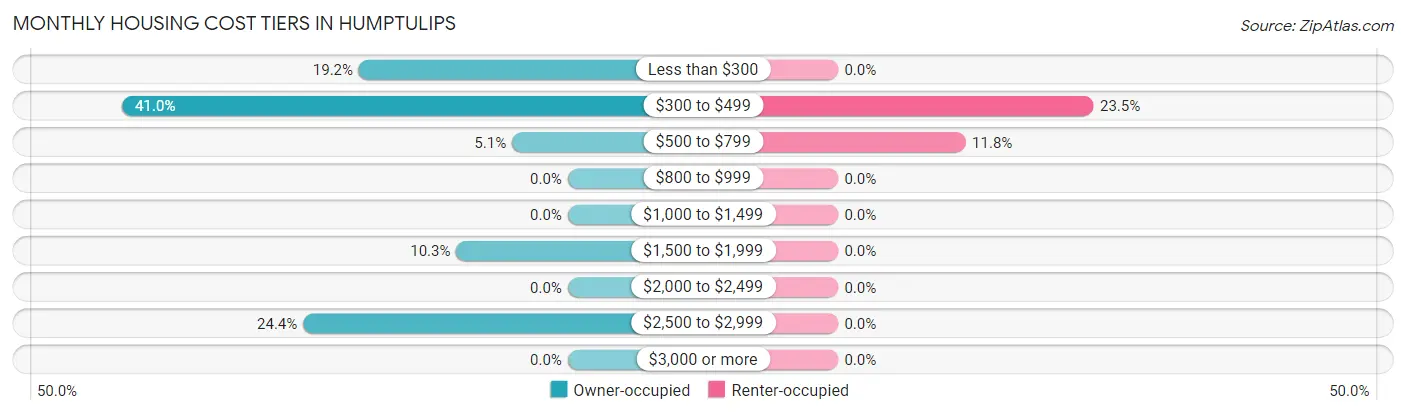
| Monthly Cost | Owner-occupied | Renter-occupied |
| Less than $300 | 15 (19.2%) | 0 (0.0%) |
| $300 to $499 | 32 (41.0%) | 4 (23.5%) |
| $500 to $799 | 4 (5.1%) | 2 (11.8%) |
| $800 to $999 | 0 (0.0%) | 0 (0.0%) |
| $1,000 to $1,499 | 0 (0.0%) | 0 (0.0%) |
| $1,500 to $1,999 | 8 (10.3%) | 0 (0.0%) |
| $2,000 to $2,499 | 0 (0.0%) | 0 (0.0%) |
| $2,500 to $2,999 | 19 (24.4%) | 0 (0.0%) |
| $3,000 or more | 0 (0.0%) | 0 (0.0%) |
| Total | 78 (100.0%) | 17 (100.0%) |
Physical Housing Characteristics in Humptulips
Housing Structures in Humptulips
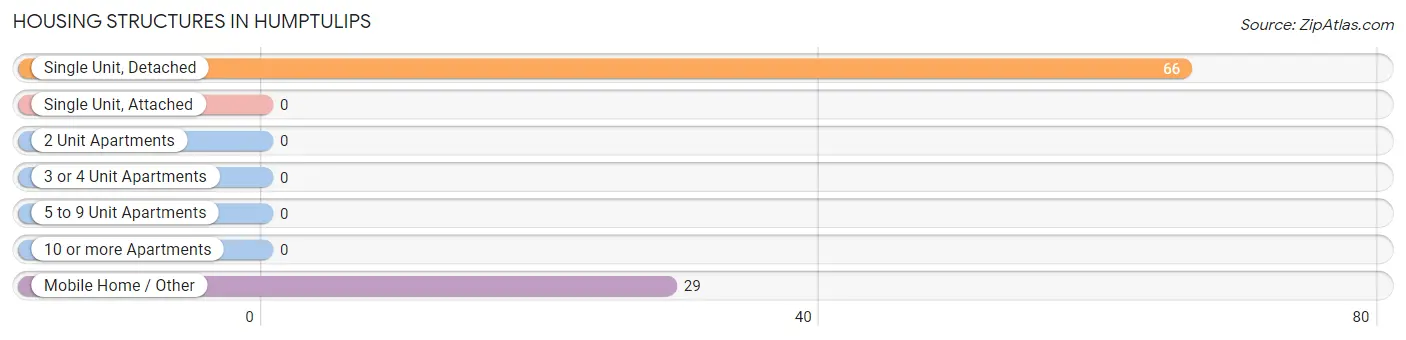
| Structure Type | # Housing Units | % Housing Units |
| Single Unit, Detached | 66 | 69.5% |
| Single Unit, Attached | 0 | 0.0% |
| 2 Unit Apartments | 0 | 0.0% |
| 3 or 4 Unit Apartments | 0 | 0.0% |
| 5 to 9 Unit Apartments | 0 | 0.0% |
| 10 or more Apartments | 0 | 0.0% |
| Mobile Home / Other | 29 | 30.5% |
| Total | 95 | 100.0% |
Housing Structures by Occupancy in Humptulips
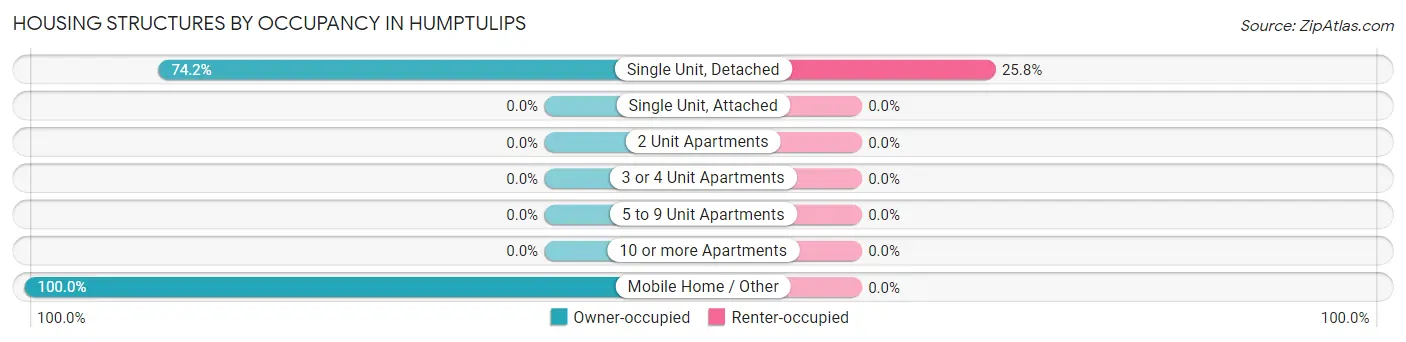
| Structure Type | Owner-occupied | Renter-occupied |
| Single Unit, Detached | 49 (74.2%) | 17 (25.8%) |
| Single Unit, Attached | 0 (0.0%) | 0 (0.0%) |
| 2 Unit Apartments | 0 (0.0%) | 0 (0.0%) |
| 3 or 4 Unit Apartments | 0 (0.0%) | 0 (0.0%) |
| 5 to 9 Unit Apartments | 0 (0.0%) | 0 (0.0%) |
| 10 or more Apartments | 0 (0.0%) | 0 (0.0%) |
| Mobile Home / Other | 29 (100.0%) | 0 (0.0%) |
| Total | 78 (82.1%) | 17 (17.9%) |
Housing Structures by Number of Rooms in Humptulips
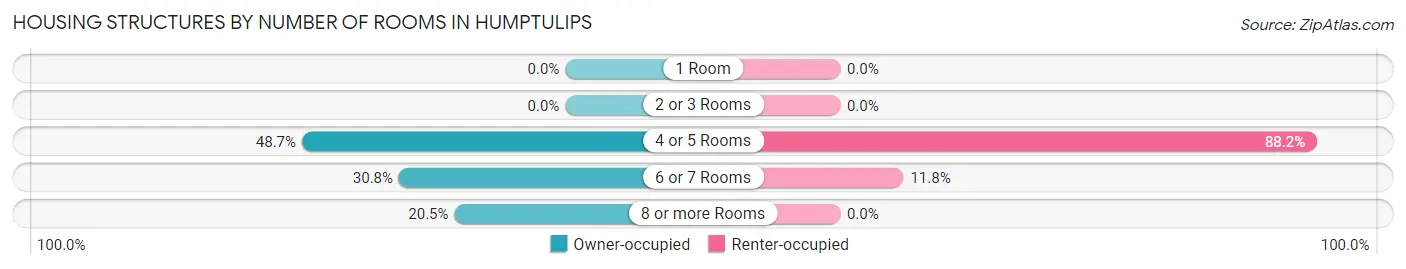
| Number of Rooms | Owner-occupied | Renter-occupied |
| 1 Room | 0 (0.0%) | 0 (0.0%) |
| 2 or 3 Rooms | 0 (0.0%) | 0 (0.0%) |
| 4 or 5 Rooms | 38 (48.7%) | 15 (88.2%) |
| 6 or 7 Rooms | 24 (30.8%) | 2 (11.8%) |
| 8 or more Rooms | 16 (20.5%) | 0 (0.0%) |
| Total | 78 (100.0%) | 17 (100.0%) |
Housing Structure by Heating Type in Humptulips
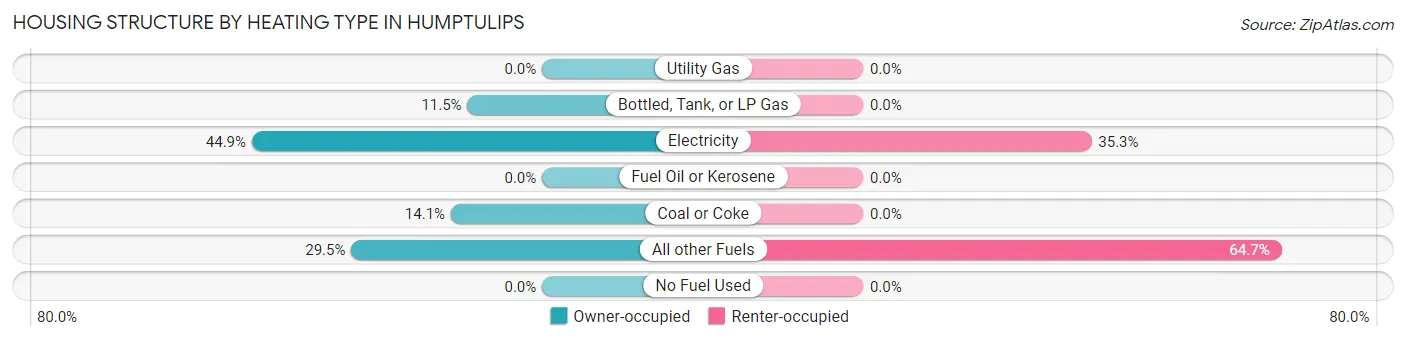
| Heating Type | Owner-occupied | Renter-occupied |
| Utility Gas | 0 (0.0%) | 0 (0.0%) |
| Bottled, Tank, or LP Gas | 9 (11.5%) | 0 (0.0%) |
| Electricity | 35 (44.9%) | 6 (35.3%) |
| Fuel Oil or Kerosene | 0 (0.0%) | 0 (0.0%) |
| Coal or Coke | 11 (14.1%) | 0 (0.0%) |
| All other Fuels | 23 (29.5%) | 11 (64.7%) |
| No Fuel Used | 0 (0.0%) | 0 (0.0%) |
| Total | 78 (100.0%) | 17 (100.0%) |
Household Vehicle Usage in Humptulips
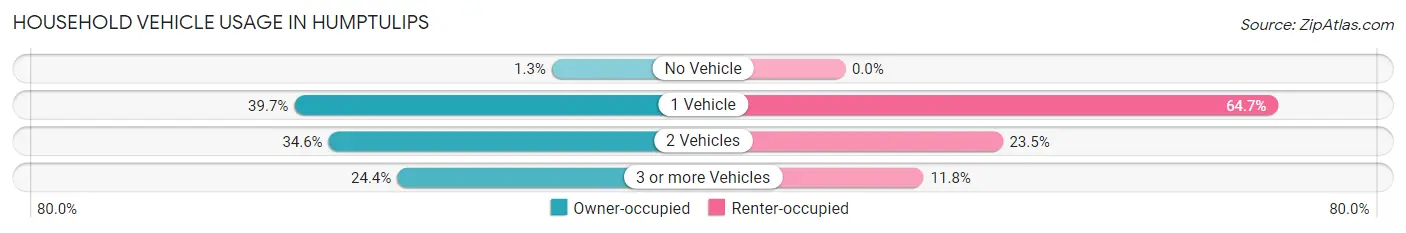
| Vehicles per Household | Owner-occupied | Renter-occupied |
| No Vehicle | 1 (1.3%) | 0 (0.0%) |
| 1 Vehicle | 31 (39.7%) | 11 (64.7%) |
| 2 Vehicles | 27 (34.6%) | 4 (23.5%) |
| 3 or more Vehicles | 19 (24.4%) | 2 (11.8%) |
| Total | 78 (100.0%) | 17 (100.0%) |
Real Estate & Mortgages in Humptulips
Real Estate and Mortgage Overview in Humptulips
| Characteristic | Without Mortgage | With Mortgage |
| Housing Units | 51 | 27 |
| Median Property Value | $202,300 | $572,400 |
| Median Household Income | $20,673 | $23 |
| Monthly Housing Costs | $348 | $0 |
| Real Estate Taxes | $1,300 | $0 |
Property Value by Mortgage Status in Humptulips
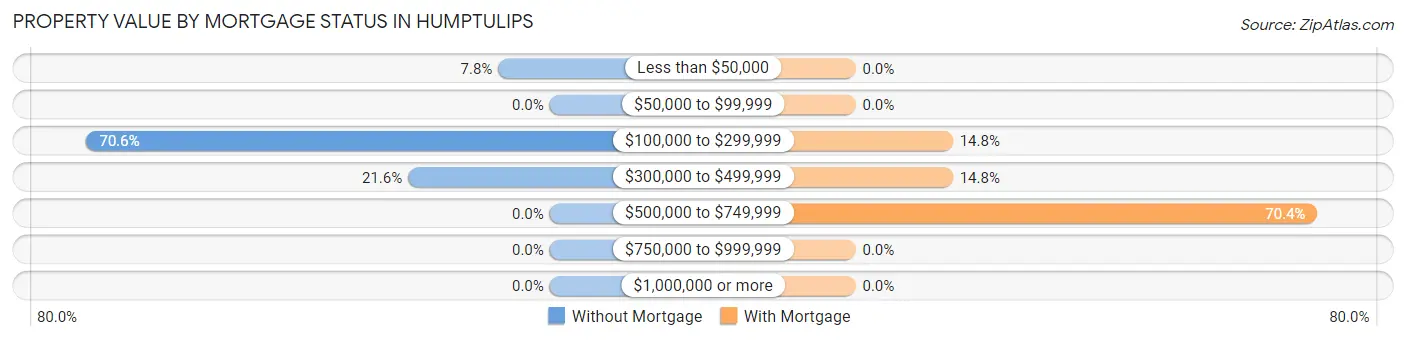
| Property Value | Without Mortgage | With Mortgage |
| Less than $50,000 | 4 (7.8%) | 0 (0.0%) |
| $50,000 to $99,999 | 0 (0.0%) | 0 (0.0%) |
| $100,000 to $299,999 | 36 (70.6%) | 4 (14.8%) |
| $300,000 to $499,999 | 11 (21.6%) | 4 (14.8%) |
| $500,000 to $749,999 | 0 (0.0%) | 19 (70.4%) |
| $750,000 to $999,999 | 0 (0.0%) | 0 (0.0%) |
| $1,000,000 or more | 0 (0.0%) | 0 (0.0%) |
| Total | 51 (100.0%) | 27 (100.0%) |
Household Income by Mortgage Status in Humptulips
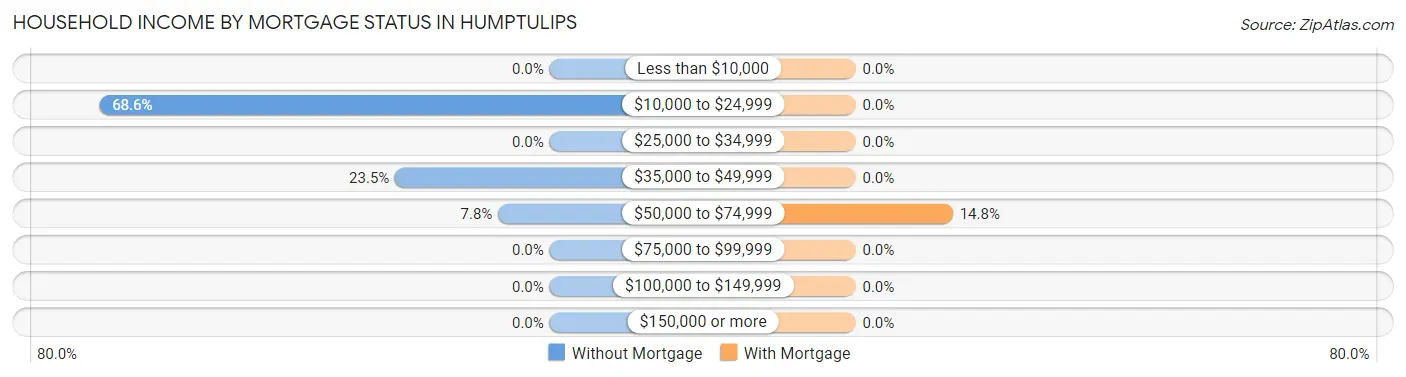
| Household Income | Without Mortgage | With Mortgage |
| Less than $10,000 | 0 (0.0%) | 0 (0.0%) |
| $10,000 to $24,999 | 35 (68.6%) | 0 (0.0%) |
| $25,000 to $34,999 | 0 (0.0%) | 0 (0.0%) |
| $35,000 to $49,999 | 12 (23.5%) | 0 (0.0%) |
| $50,000 to $74,999 | 4 (7.8%) | 4 (14.8%) |
| $75,000 to $99,999 | 0 (0.0%) | 0 (0.0%) |
| $100,000 to $149,999 | 0 (0.0%) | 0 (0.0%) |
| $150,000 or more | 0 (0.0%) | 0 (0.0%) |
| Total | 51 (100.0%) | 27 (100.0%) |
Property Value to Household Income Ratio in Humptulips
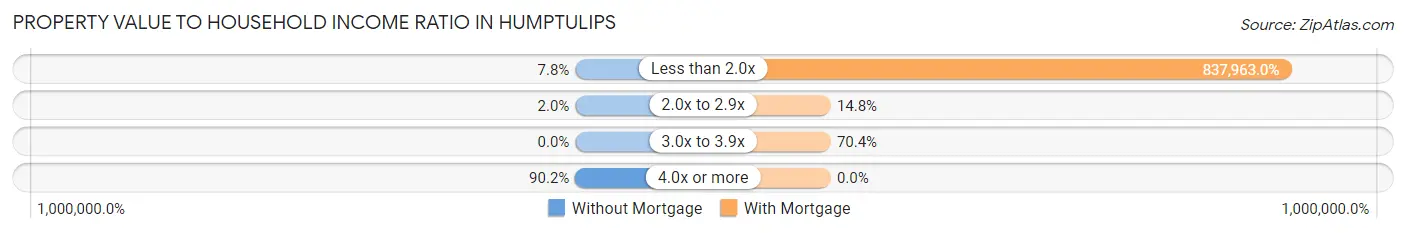
| Value-to-Income Ratio | Without Mortgage | With Mortgage |
| Less than 2.0x | 4 (7.8%) | 226,250 (837,963.0%) |
| 2.0x to 2.9x | 1 (2.0%) | 4 (14.8%) |
| 3.0x to 3.9x | 0 (0.0%) | 19 (70.4%) |
| 4.0x or more | 46 (90.2%) | 0 (0.0%) |
| Total | 51 (100.0%) | 27 (100.0%) |
Real Estate Taxes by Mortgage Status in Humptulips
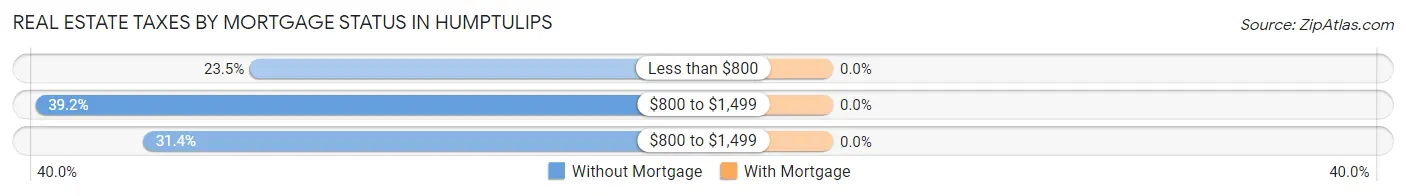
| Property Taxes | Without Mortgage | With Mortgage |
| Less than $800 | 12 (23.5%) | 0 (0.0%) |
| $800 to $1,499 | 20 (39.2%) | 0 (0.0%) |
| $800 to $1,499 | 16 (31.4%) | 0 (0.0%) |
| Total | 51 (100.0%) | 27 (100.0%) |
Health & Disability in Humptulips
Health Insurance Coverage by Age in Humptulips
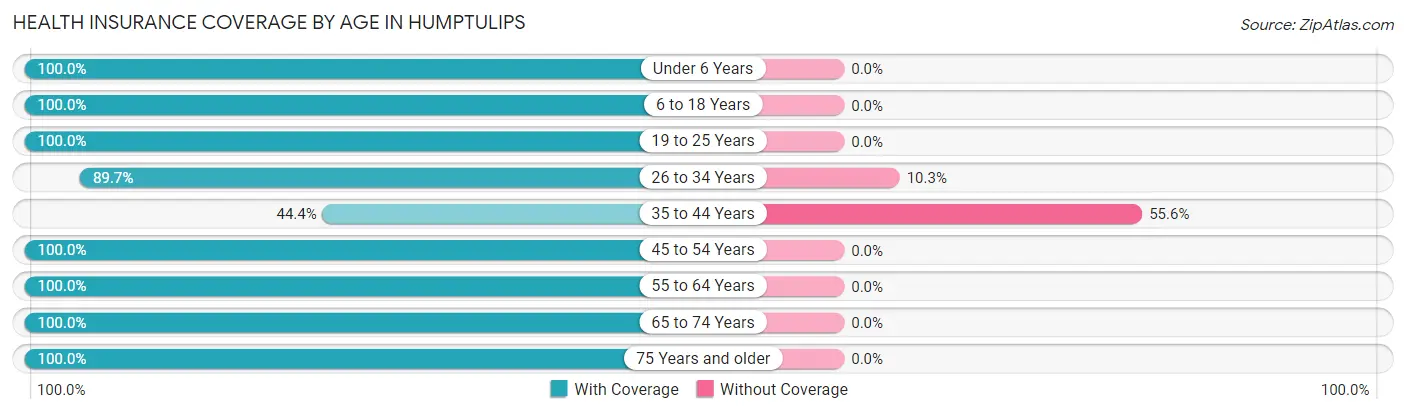
| Age Bracket | With Coverage | Without Coverage |
| Under 6 Years | 15 (100.0%) | 0 (0.0%) |
| 6 to 18 Years | 47 (100.0%) | 0 (0.0%) |
| 19 to 25 Years | 3 (100.0%) | 0 (0.0%) |
| 26 to 34 Years | 26 (89.7%) | 3 (10.3%) |
| 35 to 44 Years | 8 (44.4%) | 10 (55.6%) |
| 45 to 54 Years | 4 (100.0%) | 0 (0.0%) |
| 55 to 64 Years | 59 (100.0%) | 0 (0.0%) |
| 65 to 74 Years | 37 (100.0%) | 0 (0.0%) |
| 75 Years and older | 33 (100.0%) | 0 (0.0%) |
| Total | 232 (94.7%) | 13 (5.3%) |
Health Insurance Coverage by Citizenship Status in Humptulips
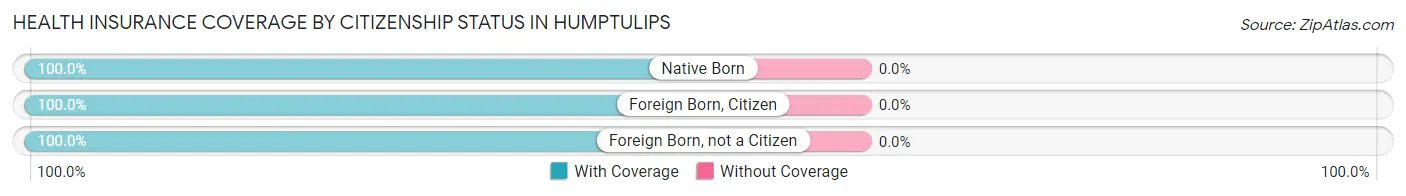
| Citizenship Status | With Coverage | Without Coverage |
| Native Born | 15 (100.0%) | 0 (0.0%) |
| Foreign Born, Citizen | 47 (100.0%) | 0 (0.0%) |
| Foreign Born, not a Citizen | 3 (100.0%) | 0 (0.0%) |
Health Insurance Coverage by Household Income in Humptulips
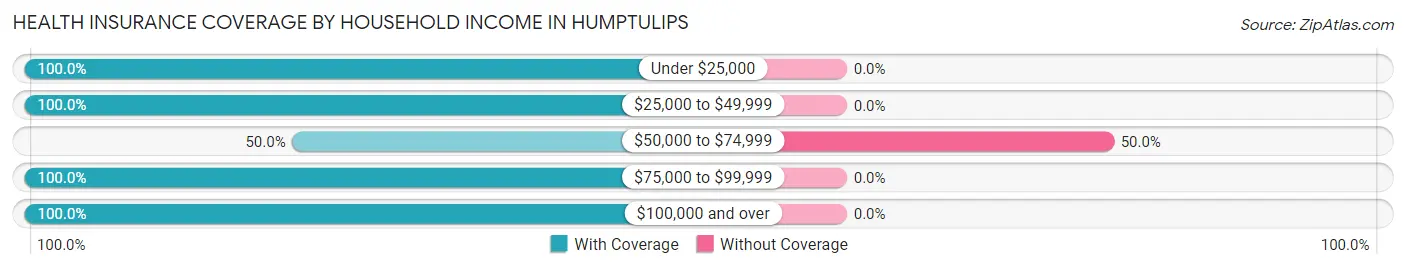
| Household Income | With Coverage | Without Coverage |
| Under $25,000 | 106 (100.0%) | 0 (0.0%) |
| $25,000 to $49,999 | 42 (100.0%) | 0 (0.0%) |
| $50,000 to $74,999 | 13 (50.0%) | 13 (50.0%) |
| $75,000 to $99,999 | 23 (100.0%) | 0 (0.0%) |
| $100,000 and over | 48 (100.0%) | 0 (0.0%) |
Public vs Private Health Insurance Coverage by Age in Humptulips
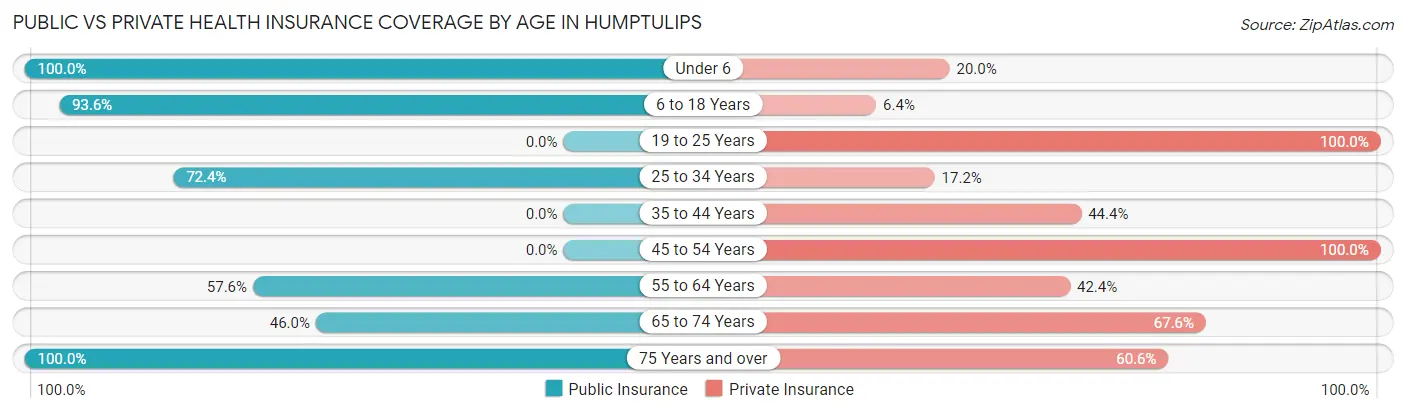
| Age Bracket | Public Insurance | Private Insurance |
| Under 6 | 15 (100.0%) | 3 (20.0%) |
| 6 to 18 Years | 44 (93.6%) | 3 (6.4%) |
| 19 to 25 Years | 0 (0.0%) | 3 (100.0%) |
| 25 to 34 Years | 21 (72.4%) | 5 (17.2%) |
| 35 to 44 Years | 0 (0.0%) | 8 (44.4%) |
| 45 to 54 Years | 0 (0.0%) | 4 (100.0%) |
| 55 to 64 Years | 34 (57.6%) | 25 (42.4%) |
| 65 to 74 Years | 17 (46.0%) | 25 (67.6%) |
| 75 Years and over | 33 (100.0%) | 20 (60.6%) |
| Total | 164 (66.9%) | 96 (39.2%) |
Disability Status by Sex by Age in Humptulips
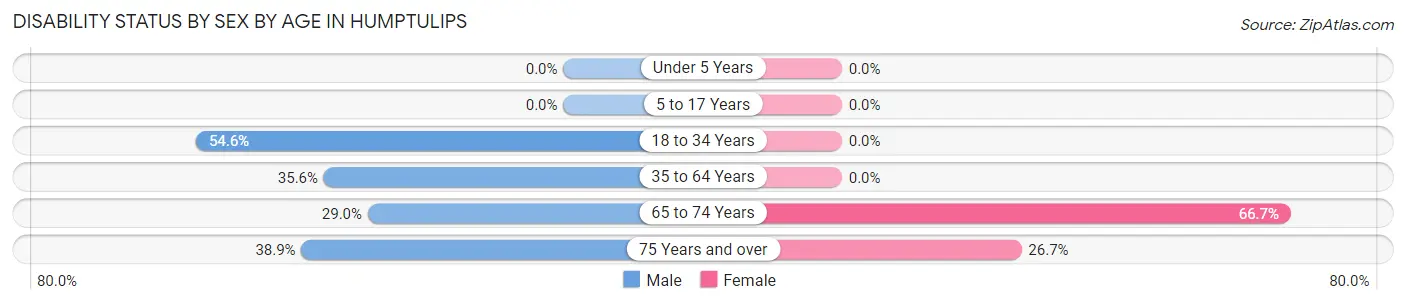
| Age Bracket | Male | Female |
| Under 5 Years | 0 (0.0%) | 0 (0.0%) |
| 5 to 17 Years | 0 (0.0%) | 0 (0.0%) |
| 18 to 34 Years | 6 (54.5%) | 0 (0.0%) |
| 35 to 64 Years | 16 (35.6%) | 0 (0.0%) |
| 65 to 74 Years | 9 (29.0%) | 4 (66.7%) |
| 75 Years and over | 7 (38.9%) | 4 (26.7%) |
Disability Class by Sex by Age in Humptulips
Disability Class: Hearing Difficulty
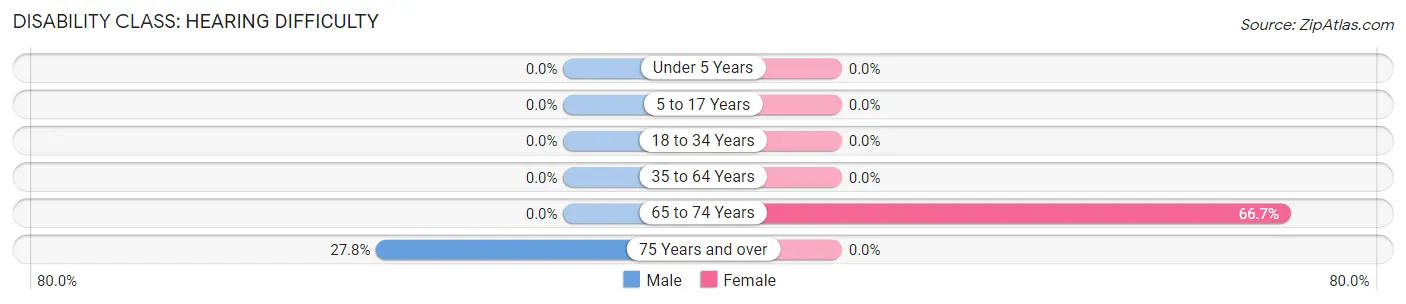
| Age Bracket | Male | Female |
| Under 5 Years | 0 (0.0%) | 0 (0.0%) |
| 5 to 17 Years | 0 (0.0%) | 0 (0.0%) |
| 18 to 34 Years | 0 (0.0%) | 0 (0.0%) |
| 35 to 64 Years | 0 (0.0%) | 0 (0.0%) |
| 65 to 74 Years | 0 (0.0%) | 4 (66.7%) |
| 75 Years and over | 5 (27.8%) | 0 (0.0%) |
Disability Class: Vision Difficulty
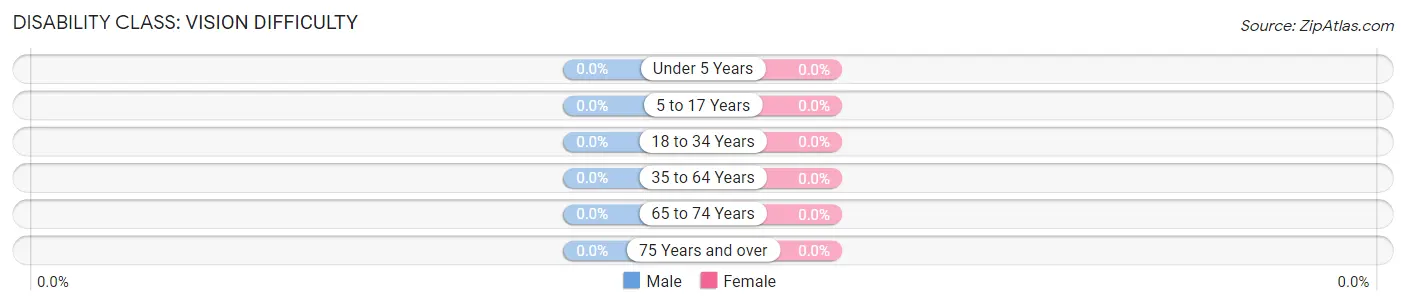
| Age Bracket | Male | Female |
| Under 5 Years | 0 (0.0%) | 0 (0.0%) |
| 5 to 17 Years | 0 (0.0%) | 0 (0.0%) |
| 18 to 34 Years | 0 (0.0%) | 0 (0.0%) |
| 35 to 64 Years | 0 (0.0%) | 0 (0.0%) |
| 65 to 74 Years | 0 (0.0%) | 0 (0.0%) |
| 75 Years and over | 0 (0.0%) | 0 (0.0%) |
Disability Class: Cognitive Difficulty
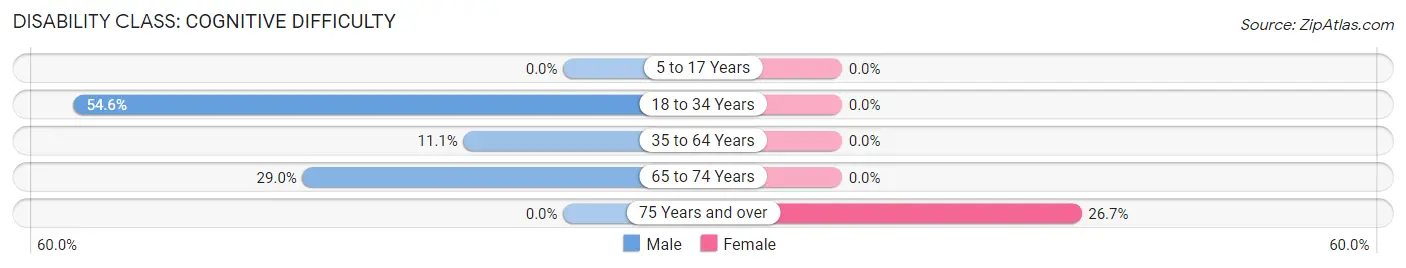
| Age Bracket | Male | Female |
| 5 to 17 Years | 0 (0.0%) | 0 (0.0%) |
| 18 to 34 Years | 6 (54.5%) | 0 (0.0%) |
| 35 to 64 Years | 5 (11.1%) | 0 (0.0%) |
| 65 to 74 Years | 9 (29.0%) | 0 (0.0%) |
| 75 Years and over | 0 (0.0%) | 4 (26.7%) |
Disability Class: Ambulatory Difficulty
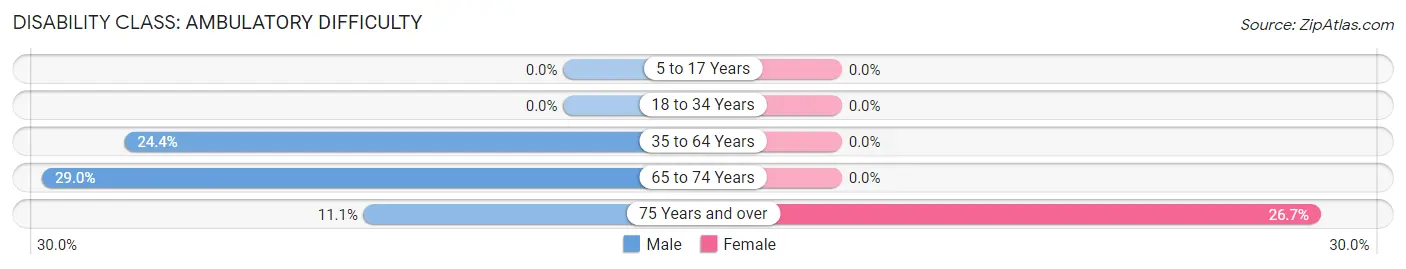
| Age Bracket | Male | Female |
| 5 to 17 Years | 0 (0.0%) | 0 (0.0%) |
| 18 to 34 Years | 0 (0.0%) | 0 (0.0%) |
| 35 to 64 Years | 11 (24.4%) | 0 (0.0%) |
| 65 to 74 Years | 9 (29.0%) | 0 (0.0%) |
| 75 Years and over | 2 (11.1%) | 4 (26.7%) |
Disability Class: Self-Care Difficulty
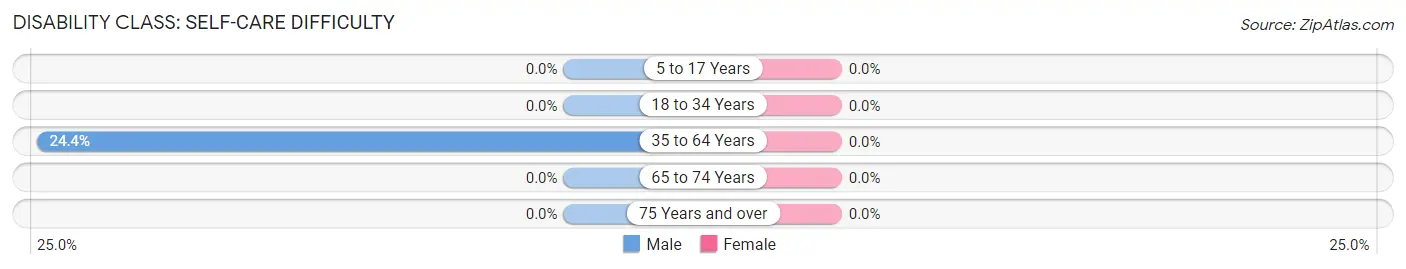
| Age Bracket | Male | Female |
| 5 to 17 Years | 0 (0.0%) | 0 (0.0%) |
| 18 to 34 Years | 0 (0.0%) | 0 (0.0%) |
| 35 to 64 Years | 11 (24.4%) | 0 (0.0%) |
| 65 to 74 Years | 0 (0.0%) | 0 (0.0%) |
| 75 Years and over | 0 (0.0%) | 0 (0.0%) |
Technology Access in Humptulips
Computing Device Access in Humptulips
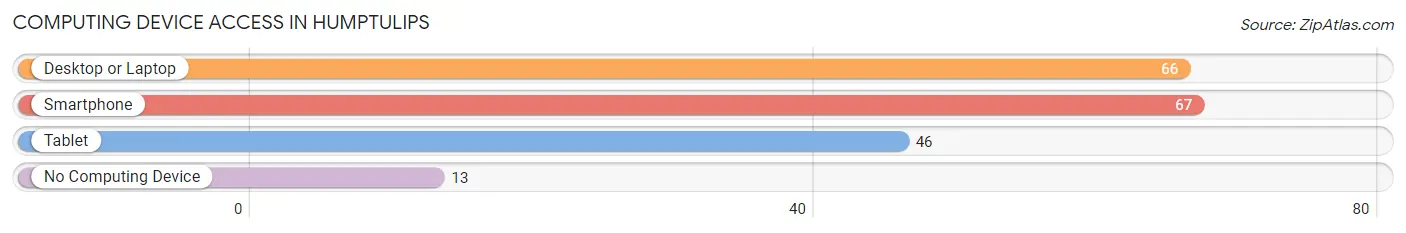
| Device Type | # Households | % Households |
| Desktop or Laptop | 66 | 69.5% |
| Smartphone | 67 | 70.5% |
| Tablet | 46 | 48.4% |
| No Computing Device | 13 | 13.7% |
| Total | 95 | 100.0% |
Internet Access in Humptulips
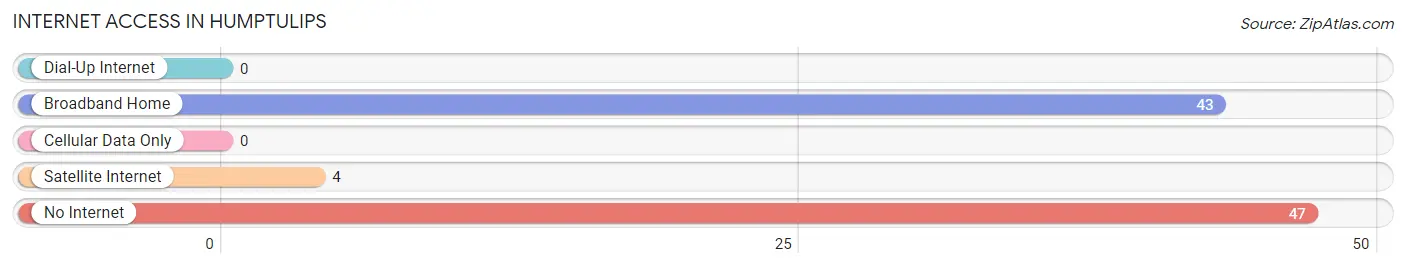
| Internet Type | # Households | % Households |
| Dial-Up Internet | 0 | 0.0% |
| Broadband Home | 43 | 45.3% |
| Cellular Data Only | 0 | 0.0% |
| Satellite Internet | 4 | 4.2% |
| No Internet | 47 | 49.5% |
| Total | 95 | 100.0% |
Humptulips Summary
Humptulips, Washington is a small town located in Grays Harbor County, in the western part of the state. It is situated on the Humptulips River, about 10 miles east of the Pacific Ocean. The town was founded in 1853 and is named after the Humptulips River, which was named by the local Native American tribes. The population of Humptulips was 1,093 as of the 2010 census.
Geography
Humptulips is located at 47°45'N, 123°45'W, at an elevation of approximately 200 feet. The town is situated in a valley surrounded by hills and mountains. The Humptulips River runs through the town, and the nearby Humptulips Bay is part of the Pacific Ocean. The town is located in the Olympic Mountains, and is about 10 miles east of the Pacific Ocean.
Climate
Humptulips has a temperate climate, with mild winters and warm summers. The average annual temperature is around 50°F, and the average annual precipitation is around 40 inches.
Economy
The economy of Humptulips is largely based on agriculture and forestry. The town is home to several farms, and the surrounding area is heavily forested. The town also has a small fishing industry, and there are several small businesses in the area.
Demographics
As of the 2010 census, the population of Humptulips was 1,093. The racial makeup of the town was 94.3% White, 0.7% Native American, 0.3% Asian, 0.2% African American, 0.1% Pacific Islander, and 4.4% from other races. The median household income was $37,917, and the median family income was $45,625.
Education
Humptulips is served by the Humptulips School District, which includes an elementary school, a middle school, and a high school. The town also has a public library.
Conclusion
Humptulips, Washington is a small town located in Grays Harbor County, in the western part of the state. It is situated on the Humptulips River, about 10 miles east of the Pacific Ocean. The town was founded in 1853 and is named after the Humptulips River, which was named by the local Native American tribes. The economy of Humptulips is largely based on agriculture and forestry, and the town is home to several farms and small businesses. The population of Humptulips was 1,093 as of the 2010 census, and the town is served by the Humptulips School District.
Common Questions
What is Per Capita Income in Humptulips?
Per Capita income in Humptulips is $29,535.
What is Inequality or Gini Index in Humptulips?
Inequality or Gini Index in Humptulips is 0.53.
What is the Total Population of Humptulips?
Total Population of Humptulips is 245.
What is the Total Male Population of Humptulips?
Total Male Population of Humptulips is 133.
What is the Total Female Population of Humptulips?
Total Female Population of Humptulips is 112.
What is the Ratio of Males per 100 Females in Humptulips?
There are 118.75 Males per 100 Females in Humptulips.
What is the Ratio of Females per 100 Males in Humptulips?
There are 84.21 Females per 100 Males in Humptulips.
What is the Median Population Age in Humptulips?
Median Population Age in Humptulips is 55.6 Years.
What is the Average Family Size in Humptulips
Average Family Size in Humptulips is 3.8 People.
What is the Average Household Size in Humptulips
Average Household Size in Humptulips is 2.6 People.
How Large is the Labor Force in Humptulips?
There are 78 People in the Labor Forcein in Humptulips.
What is the Percentage of People in the Labor Force in Humptulips?
42.6% of People are in the Labor Force in Humptulips.
What is the Unemployment Rate in Humptulips?
Unemployment Rate in Humptulips is 6.4%.