Centerville, WA Map & Demographics
Centerville Map
Centerville Overview
$56,666
PER CAPITA INCOME
$157,500
AVG FAMILY INCOME
$118,500
AVG HOUSEHOLD INCOME
0.35
INEQUALITY / GINI INDEX
113
TOTAL POPULATION
49
MALE POPULATION
64
FEMALE POPULATION
76.56
MALES / 100 FEMALES
130.61
FEMALES / 100 MALES
59.1
MEDIAN AGE
2.3
AVG FAMILY SIZE
2.1
AVG HOUSEHOLD SIZE
83
LABOR FORCE [ PEOPLE ]
75.5%
PERCENT IN LABOR FORCE
19.3%
UNEMPLOYMENT RATE
Centerville Zip Codes
Centerville Area Codes
Income in Centerville
Income Overview in Centerville
Per Capita Income in Centerville is $56,666, while median incomes of families and households are $157,500 and $118,500 respectively.
| Characteristic | Number | Measure |
| Per Capita Income | 113 | $56,666 |
| Median Family Income | 46 | $157,500 |
| Mean Family Income | 46 | $154,680 |
| Median Household Income | 54 | $118,500 |
| Mean Household Income | 54 | $135,146 |
| Income Deficit | 46 | $0 |
| Wage / Income Gap (%) | 113 | 0.00% |
| Wage / Income Gap ($) | 113 | 100.00¢ per $1 |
| Gini / Inequality Index | 113 | 0.35 |
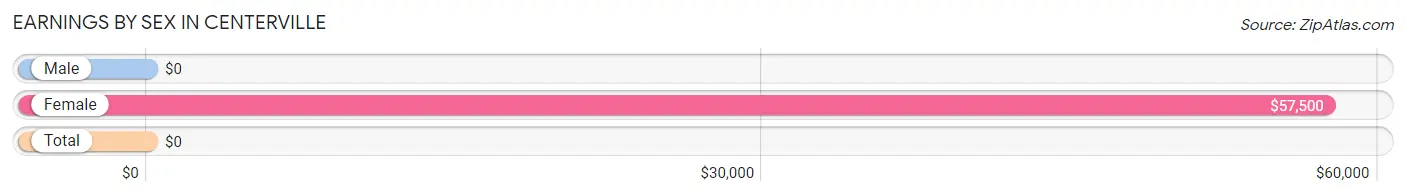
Earnings by Sex in Centerville
| Sex | Number | Average Earnings |
| Male | 40 (46.5%) | $0 |
| Female | 46 (53.5%) | $57,500 |
| Total | 86 (100.0%) | $0 |
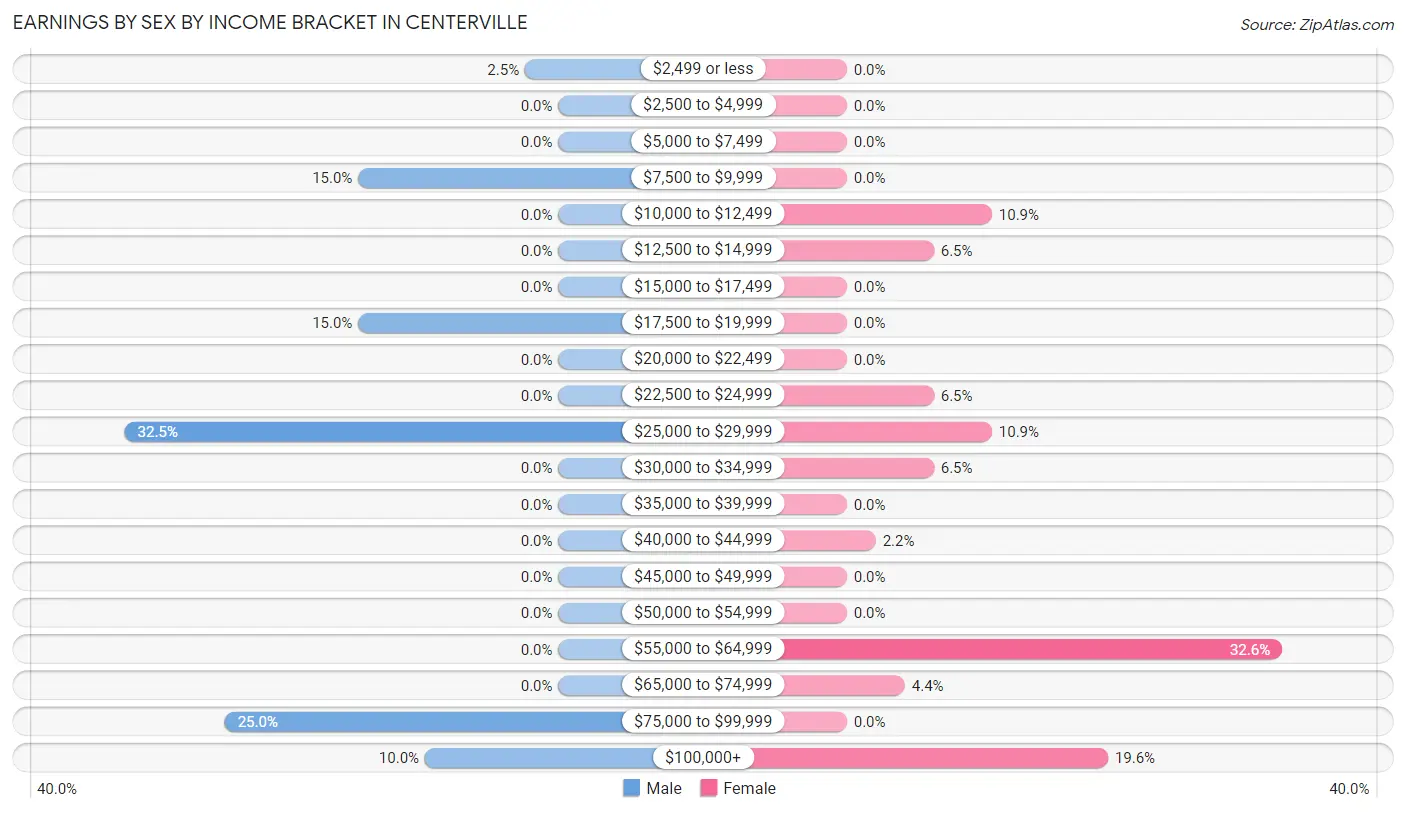
Earnings by Sex by Income Bracket in Centerville
The most common earnings brackets in Centerville are $25,000 to $29,999 for men (13 | 32.5%) and $55,000 to $64,999 for women (15 | 32.6%).
| Income | Male | Female |
| $2,499 or less | 1 (2.5%) | 0 (0.0%) |
| $2,500 to $4,999 | 0 (0.0%) | 0 (0.0%) |
| $5,000 to $7,499 | 0 (0.0%) | 0 (0.0%) |
| $7,500 to $9,999 | 6 (15.0%) | 0 (0.0%) |
| $10,000 to $12,499 | 0 (0.0%) | 5 (10.9%) |
| $12,500 to $14,999 | 0 (0.0%) | 3 (6.5%) |
| $15,000 to $17,499 | 0 (0.0%) | 0 (0.0%) |
| $17,500 to $19,999 | 6 (15.0%) | 0 (0.0%) |
| $20,000 to $22,499 | 0 (0.0%) | 0 (0.0%) |
| $22,500 to $24,999 | 0 (0.0%) | 3 (6.5%) |
| $25,000 to $29,999 | 13 (32.5%) | 5 (10.9%) |
| $30,000 to $34,999 | 0 (0.0%) | 3 (6.5%) |
| $35,000 to $39,999 | 0 (0.0%) | 0 (0.0%) |
| $40,000 to $44,999 | 0 (0.0%) | 1 (2.2%) |
| $45,000 to $49,999 | 0 (0.0%) | 0 (0.0%) |
| $50,000 to $54,999 | 0 (0.0%) | 0 (0.0%) |
| $55,000 to $64,999 | 0 (0.0%) | 15 (32.6%) |
| $65,000 to $74,999 | 0 (0.0%) | 2 (4.3%) |
| $75,000 to $99,999 | 10 (25.0%) | 0 (0.0%) |
| $100,000+ | 4 (10.0%) | 9 (19.6%) |
| Total | 40 (100.0%) | 46 (100.0%) |
Earnings by Sex by Educational Attainment in Centerville
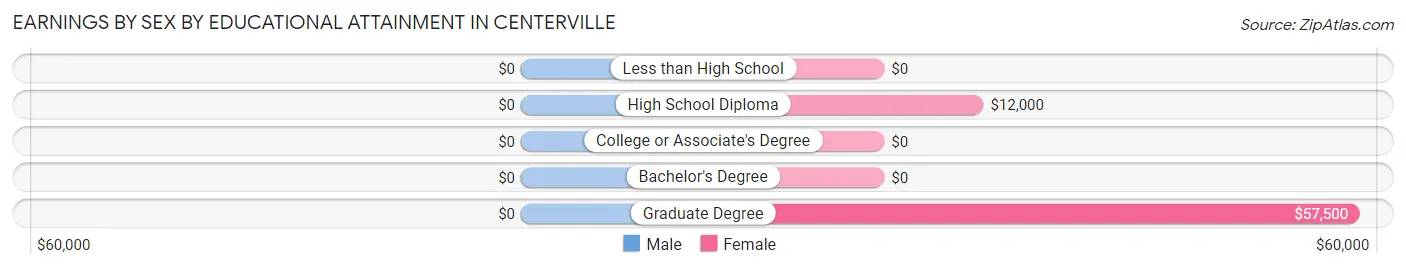
| Educational Attainment | Male Income | Female Income |
| Less than High School | - | - |
| High School Diploma | - | - |
| College or Associate's Degree | - | - |
| Bachelor's Degree | - | - |
| Graduate Degree | - | - |
| Total | - | - |
Family Income in Centerville
Family Income Brackets in Centerville
According to the Centerville family income data, there are 13 families falling into the $150,000 to $199,999 income range, which is the most common income bracket and makes up 28.3% of all families.
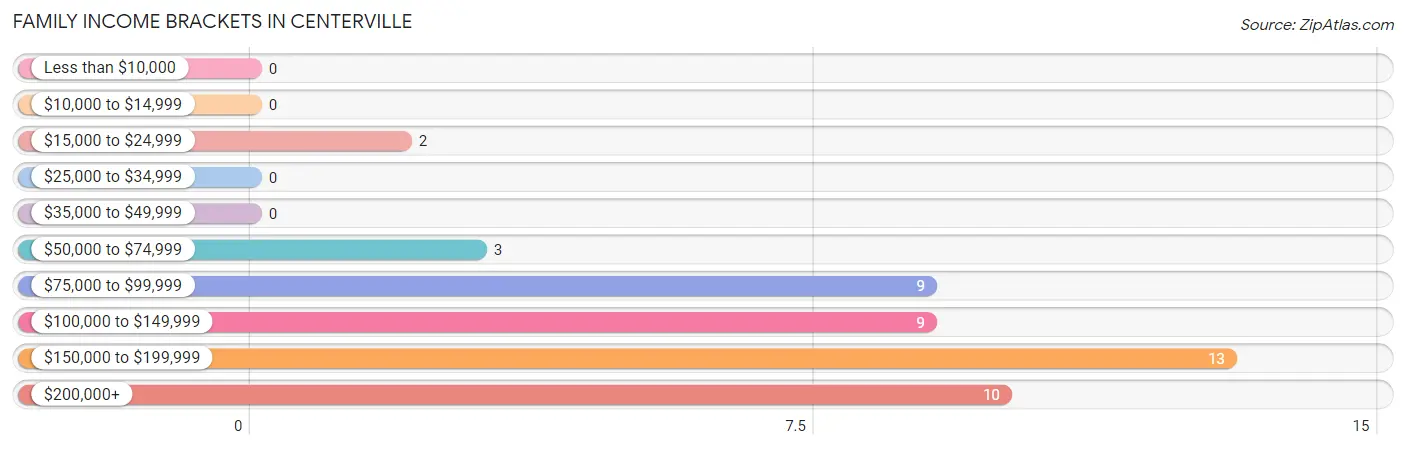
| Income Bracket | # Families | % Families |
| Less than $10,000 | 0 | 0.0% |
| $10,000 to $14,999 | 0 | 0.0% |
| $15,000 to $24,999 | 2 | 4.3% |
| $25,000 to $34,999 | 0 | 0.0% |
| $35,000 to $49,999 | 0 | 0.0% |
| $50,000 to $74,999 | 3 | 6.5% |
| $75,000 to $99,999 | 9 | 19.6% |
| $100,000 to $149,999 | 9 | 19.6% |
| $150,000 to $199,999 | 13 | 28.3% |
| $200,000+ | 10 | 21.7% |
Family Income by Famaliy Size in Centerville
2-person families (39 | 84.8%) account for the highest median family income in Centerville with $180,288 per family, while 2-person families (39 | 84.8%) have the highest median income of $90,144 per family member.
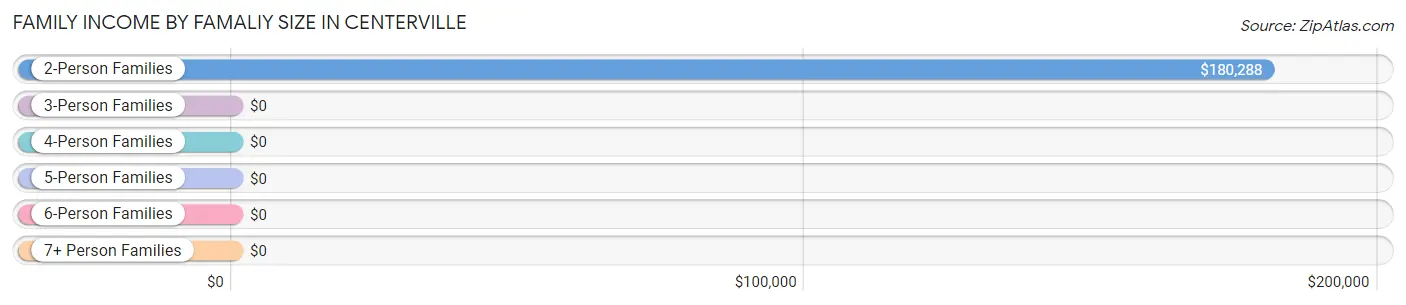
| Income Bracket | # Families | Median Income |
| 2-Person Families | 39 (84.8%) | $180,288 |
| 3-Person Families | 7 (15.2%) | $0 |
| 4-Person Families | 0 (0.0%) | $0 |
| 5-Person Families | 0 (0.0%) | $0 |
| 6-Person Families | 0 (0.0%) | $0 |
| 7+ Person Families | 0 (0.0%) | $0 |
| Total | 46 (100.0%) | $157,500 |
Family Income by Number of Earners in Centerville
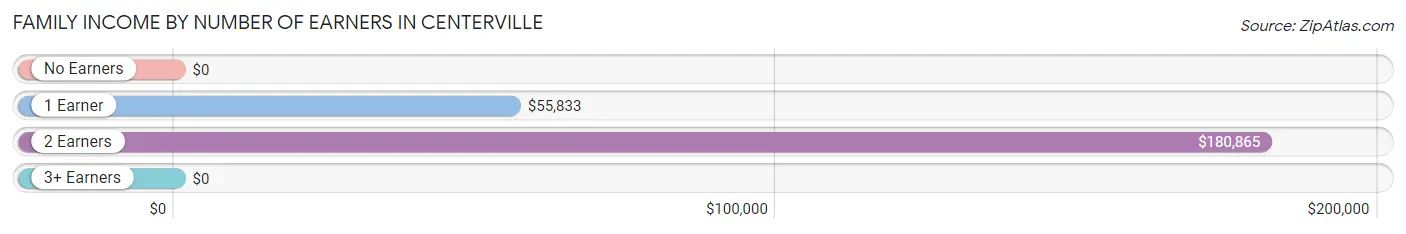
| Number of Earners | # Families | Median Income |
| No Earners | 0 (0.0%) | $0 |
| 1 Earner | 6 (13.0%) | $55,833 |
| 2 Earners | 37 (80.4%) | $180,865 |
| 3+ Earners | 3 (6.5%) | $0 |
| Total | 46 (100.0%) | $157,500 |
Household Income in Centerville
Household Income Brackets in Centerville
With 13 households falling in the category, the $150,000 to $199,999 income range is the most frequent in Centerville, accounting for 24.1% of all households.
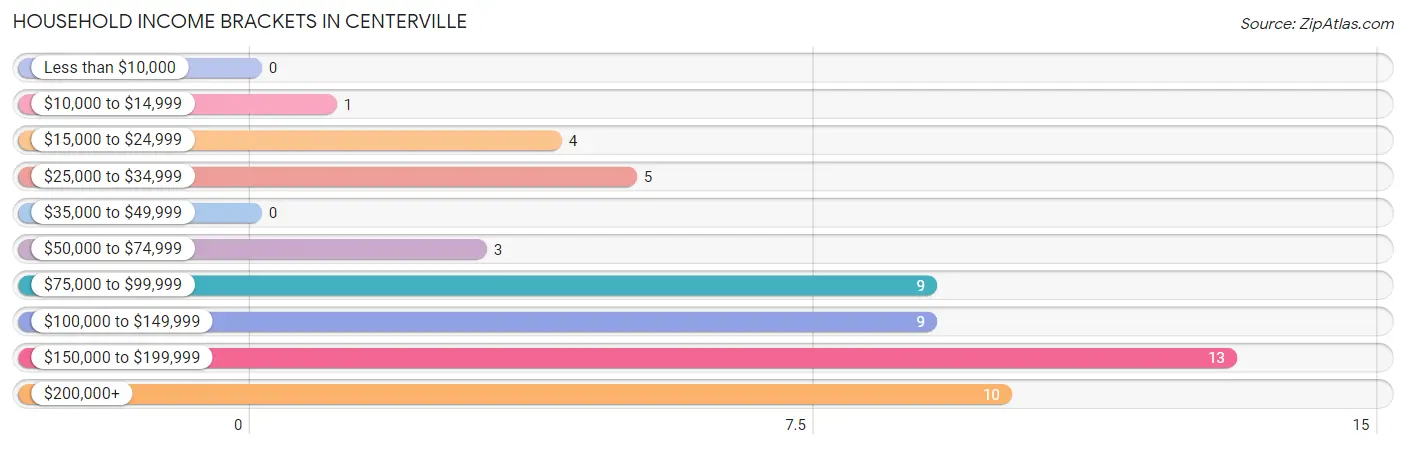
| Income Bracket | # Households | % Households |
| Less than $10,000 | 0 | 0.0% |
| $10,000 to $14,999 | 1 | 1.9% |
| $15,000 to $24,999 | 4 | 7.4% |
| $25,000 to $34,999 | 5 | 9.3% |
| $35,000 to $49,999 | 0 | 0.0% |
| $50,000 to $74,999 | 3 | 5.6% |
| $75,000 to $99,999 | 9 | 16.7% |
| $100,000 to $149,999 | 9 | 16.7% |
| $150,000 to $199,999 | 13 | 24.1% |
| $200,000+ | 10 | 18.5% |
Household Income by Householder Age in Centerville
The median household income in Centerville is $118,500, with the highest median household income of $180,673 found in the 45 to 64 years age bracket for the primary householder. A total of 35 households (64.8%) fall into this category.
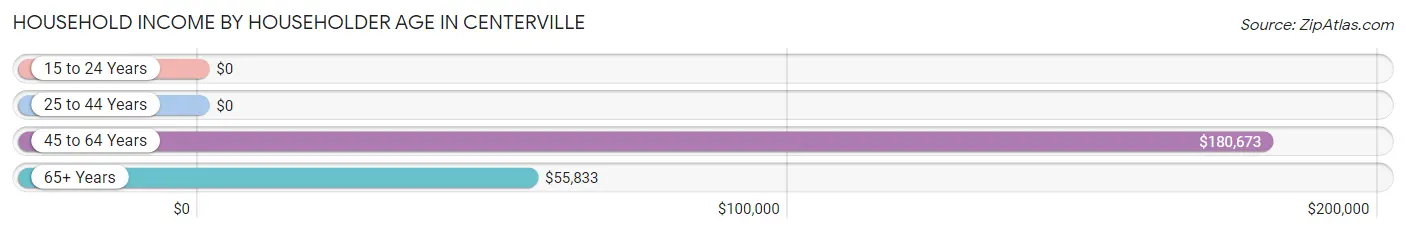
| Income Bracket | # Households | Median Income |
| 15 to 24 Years | 0 (0.0%) | $0 |
| 25 to 44 Years | 5 (9.3%) | $0 |
| 45 to 64 Years | 35 (64.8%) | $180,673 |
| 65+ Years | 14 (25.9%) | $55,833 |
| Total | 54 (100.0%) | $118,500 |
Poverty in Centerville
Income Below Poverty by Sex and Age in Centerville
With 6.1% poverty level for males and 18.8% for females among the residents of Centerville, 5 year old males and 16 and 17 year old females are the most vulnerable to poverty, with 3 males (100.0%) and 9 females (100.0%) in their respective age groups living below the poverty level.
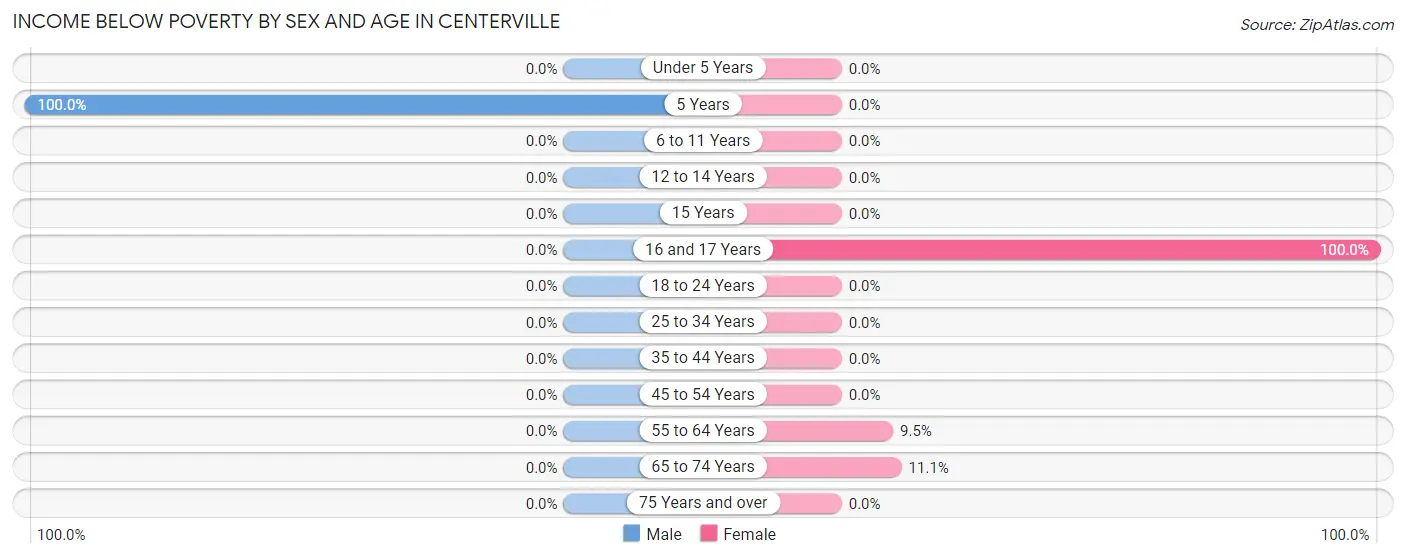
| Age Bracket | Male | Female |
| Under 5 Years | 0 (0.0%) | 0 (0.0%) |
| 5 Years | 3 (100.0%) | 0 (0.0%) |
| 6 to 11 Years | 0 (0.0%) | 0 (0.0%) |
| 12 to 14 Years | 0 (0.0%) | 0 (0.0%) |
| 15 Years | 0 (0.0%) | 0 (0.0%) |
| 16 and 17 Years | 0 (0.0%) | 9 (100.0%) |
| 18 to 24 Years | 0 (0.0%) | 0 (0.0%) |
| 25 to 34 Years | 0 (0.0%) | 0 (0.0%) |
| 35 to 44 Years | 0 (0.0%) | 0 (0.0%) |
| 45 to 54 Years | 0 (0.0%) | 0 (0.0%) |
| 55 to 64 Years | 0 (0.0%) | 2 (9.5%) |
| 65 to 74 Years | 0 (0.0%) | 1 (11.1%) |
| 75 Years and over | 0 (0.0%) | 0 (0.0%) |
| Total | 3 (6.1%) | 12 (18.8%) |
Income Above Poverty by Sex and Age in Centerville
According to the poverty statistics in Centerville, males aged 16 and 17 years and females aged 25 to 34 years are the age groups that are most secure financially, with 100.0% of males and 100.0% of females in these age groups living above the poverty line.
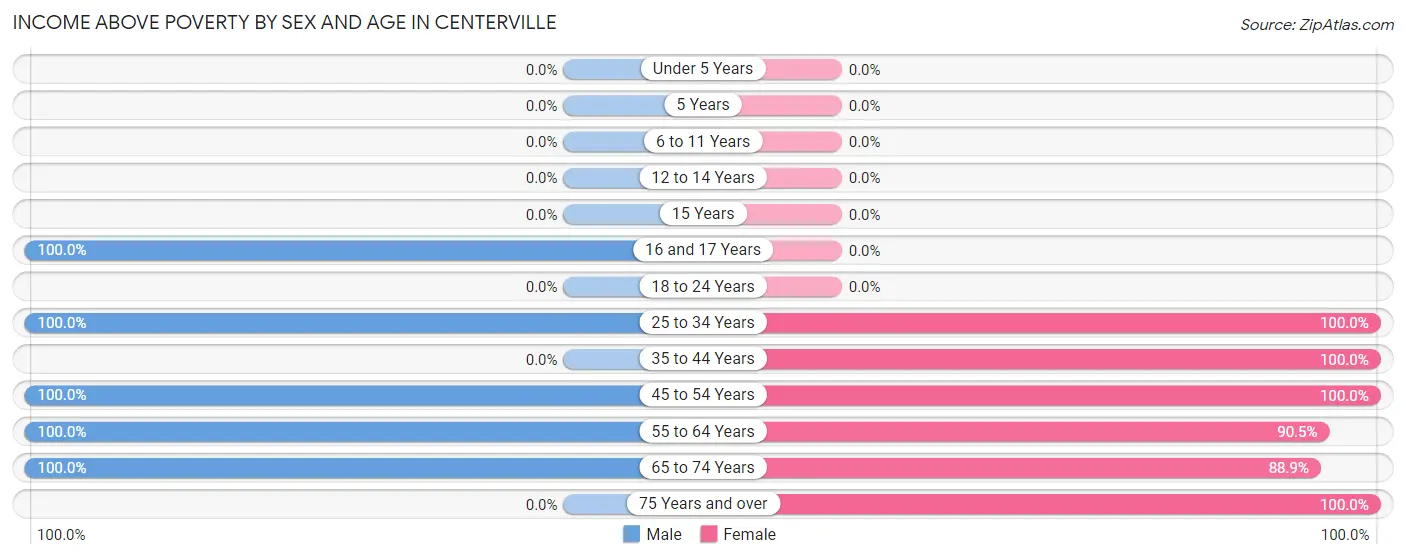
| Age Bracket | Male | Female |
| Under 5 Years | 0 (0.0%) | 0 (0.0%) |
| 5 Years | 0 (0.0%) | 0 (0.0%) |
| 6 to 11 Years | 0 (0.0%) | 0 (0.0%) |
| 12 to 14 Years | 0 (0.0%) | 0 (0.0%) |
| 15 Years | 0 (0.0%) | 0 (0.0%) |
| 16 and 17 Years | 6 (100.0%) | 0 (0.0%) |
| 18 to 24 Years | 0 (0.0%) | 0 (0.0%) |
| 25 to 34 Years | 5 (100.0%) | 5 (100.0%) |
| 35 to 44 Years | 0 (0.0%) | 3 (100.0%) |
| 45 to 54 Years | 4 (100.0%) | 12 (100.0%) |
| 55 to 64 Years | 26 (100.0%) | 19 (90.5%) |
| 65 to 74 Years | 5 (100.0%) | 8 (88.9%) |
| 75 Years and over | 0 (0.0%) | 5 (100.0%) |
| Total | 46 (93.9%) | 52 (81.2%) |
Income Below Poverty Among Married-Couple Families in Centerville
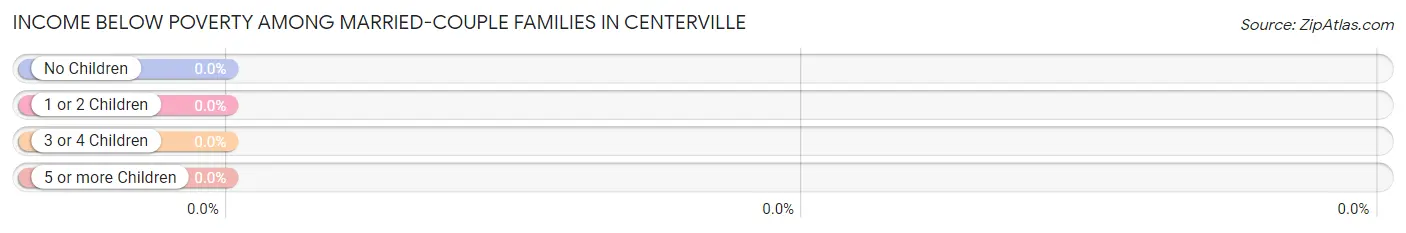
| Children | Above Poverty | Below Poverty |
| No Children | 39 (100.0%) | 0 (0.0%) |
| 1 or 2 Children | 2 (100.0%) | 0 (0.0%) |
| 3 or 4 Children | 0 (0.0%) | 0 (0.0%) |
| 5 or more Children | 0 (0.0%) | 0 (0.0%) |
| Total | 41 (100.0%) | 0 (0.0%) |
Income Below Poverty Among Single-Parent Households in Centerville
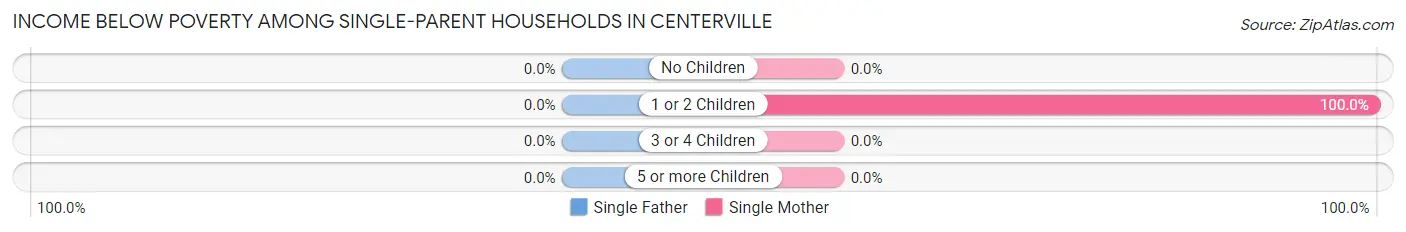
| Children | Single Father | Single Mother |
| No Children | 0 (0.0%) | 0 (0.0%) |
| 1 or 2 Children | 0 (0.0%) | 2 (100.0%) |
| 3 or 4 Children | 0 (0.0%) | 0 (0.0%) |
| 5 or more Children | 0 (0.0%) | 0 (0.0%) |
| Total | 0 (0.0%) | 2 (40.0%) |
Income Below Poverty Among Married-Couple vs Single-Parent Households in Centerville
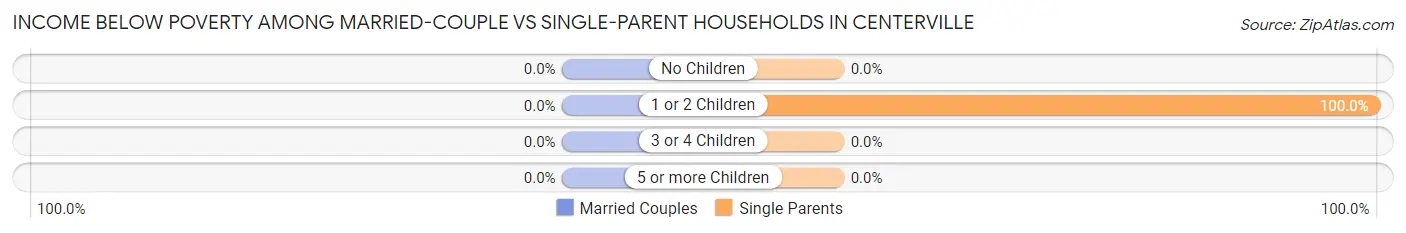
| Children | Married-Couple Families | Single-Parent Households |
| No Children | 0 (0.0%) | 0 (0.0%) |
| 1 or 2 Children | 0 (0.0%) | 2 (100.0%) |
| 3 or 4 Children | 0 (0.0%) | 0 (0.0%) |
| 5 or more Children | 0 (0.0%) | 0 (0.0%) |
| Total | 0 (0.0%) | 2 (40.0%) |
Race in Centerville
The most populous races in Centerville are White / Caucasian (106 | 93.8%), and Two or more Races (7 | 6.2%).
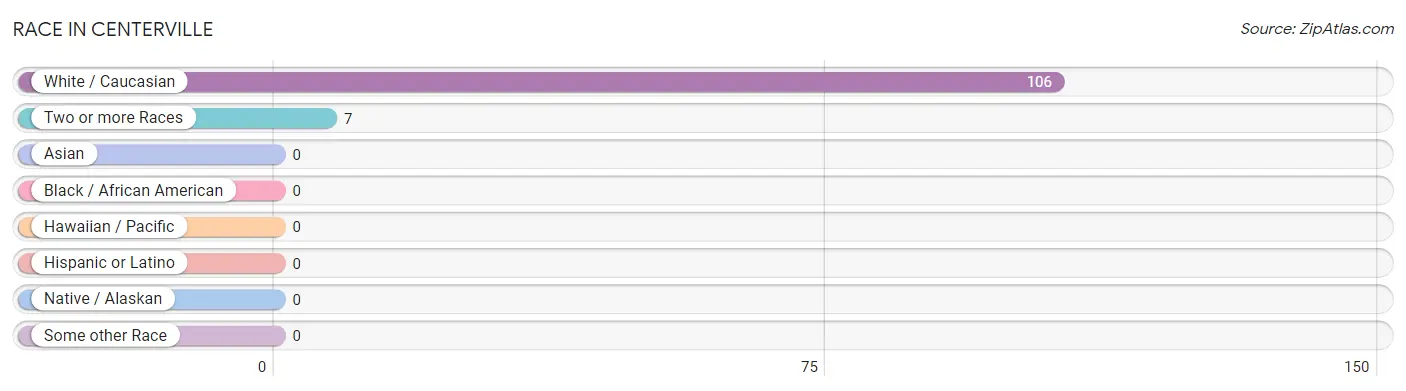
| Race | # Population | % Population |
| Asian | 0 | 0.0% |
| Black / African American | 0 | 0.0% |
| Hawaiian / Pacific | 0 | 0.0% |
| Hispanic or Latino | 0 | 0.0% |
| Native / Alaskan | 0 | 0.0% |
| White / Caucasian | 106 | 93.8% |
| Two or more Races | 7 | 6.2% |
| Some other Race | 0 | 0.0% |
| Total | 113 | 100.0% |
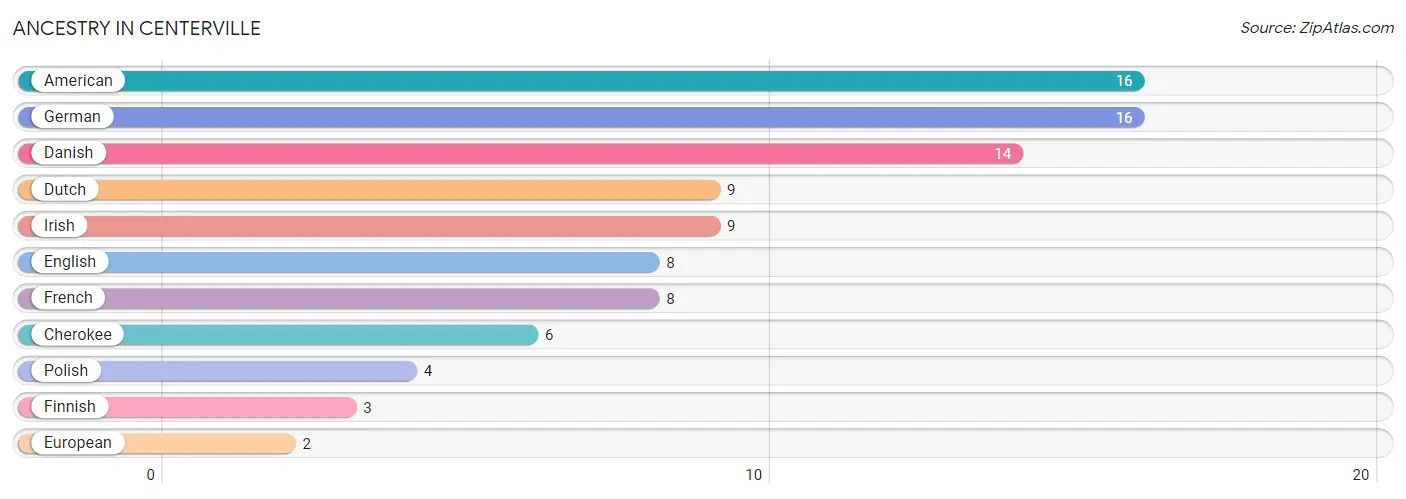
Ancestry in Centerville
The most populous ancestries reported in Centerville are American (16 | 14.2%), German (16 | 14.2%), Danish (14 | 12.4%), Dutch (9 | 8.0%), and Irish (9 | 8.0%), together accounting for 56.6% of all Centerville residents.
| Ancestry | # Population | % Population |
| American | 16 | 14.2% |
| Cherokee | 6 | 5.3% |
| Danish | 14 | 12.4% |
| Dutch | 9 | 8.0% |
| English | 8 | 7.1% |
| European | 2 | 1.8% |
| Finnish | 3 | 2.6% |
| French | 8 | 7.1% |
| German | 16 | 14.2% |
| Irish | 9 | 8.0% |
| Polish | 4 | 3.5% | View All 11 Rows |
Immigrants in Centerville
The most numerous immigrant groups reported in Centerville came from , and Oceania (3 | 2.6%), together accounting for 2.6% of all Centerville residents.

| Immigration Origin | # Population | % Population |
| Oceania | 3 | 2.6% | View All 1 Rows |
Sex and Age in Centerville
Sex and Age in Centerville
The most populous age groups in Centerville are 60 to 64 Years (22 | 44.9%) for men and 55 to 59 Years (14 | 21.9%) for women.
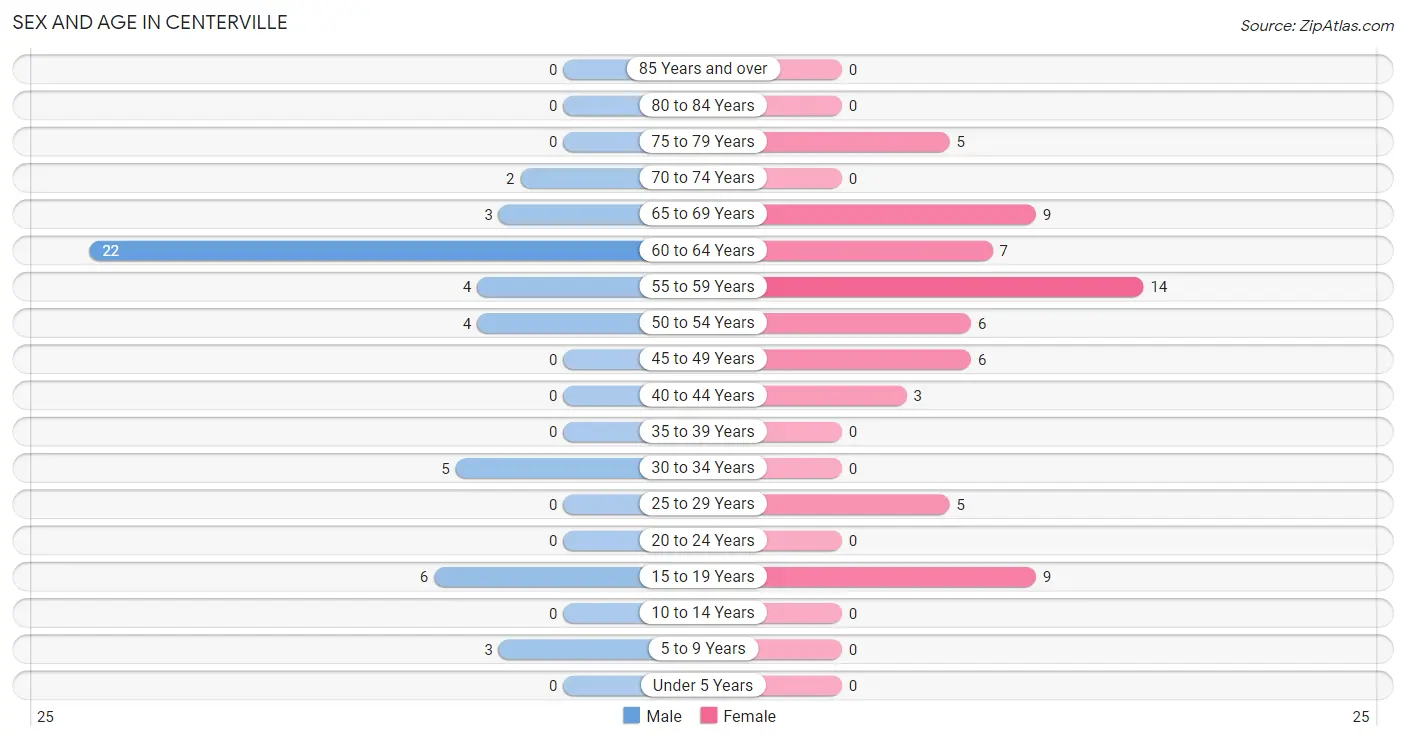
| Age Bracket | Male | Female |
| Under 5 Years | 0 (0.0%) | 0 (0.0%) |
| 5 to 9 Years | 3 (6.1%) | 0 (0.0%) |
| 10 to 14 Years | 0 (0.0%) | 0 (0.0%) |
| 15 to 19 Years | 6 (12.2%) | 9 (14.1%) |
| 20 to 24 Years | 0 (0.0%) | 0 (0.0%) |
| 25 to 29 Years | 0 (0.0%) | 5 (7.8%) |
| 30 to 34 Years | 5 (10.2%) | 0 (0.0%) |
| 35 to 39 Years | 0 (0.0%) | 0 (0.0%) |
| 40 to 44 Years | 0 (0.0%) | 3 (4.7%) |
| 45 to 49 Years | 0 (0.0%) | 6 (9.4%) |
| 50 to 54 Years | 4 (8.2%) | 6 (9.4%) |
| 55 to 59 Years | 4 (8.2%) | 14 (21.9%) |
| 60 to 64 Years | 22 (44.9%) | 7 (10.9%) |
| 65 to 69 Years | 3 (6.1%) | 9 (14.1%) |
| 70 to 74 Years | 2 (4.1%) | 0 (0.0%) |
| 75 to 79 Years | 0 (0.0%) | 5 (7.8%) |
| 80 to 84 Years | 0 (0.0%) | 0 (0.0%) |
| 85 Years and over | 0 (0.0%) | 0 (0.0%) |
| Total | 49 (100.0%) | 64 (100.0%) |
Families and Households in Centerville
Median Family Size in Centerville
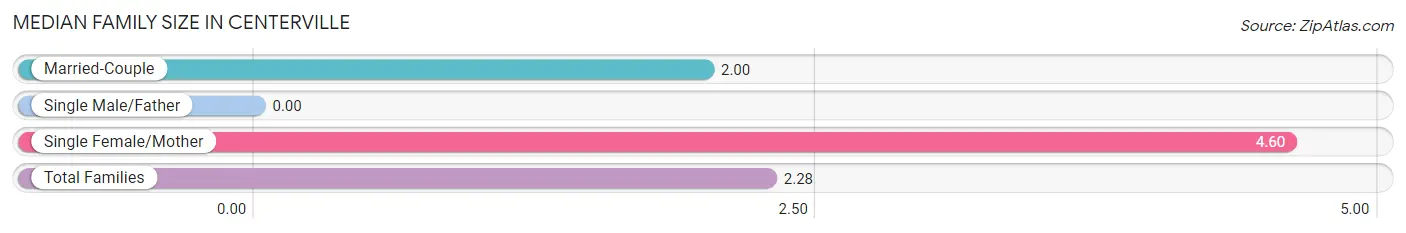
| Family Type | # Families | Family Size |
| Married-Couple | 41 (89.1%) | 2.00 |
| Single Male/Father | 0 (0.0%) | - |
| Single Female/Mother | 5 (10.9%) | 4.60 |
| Total Families | 46 (100.0%) | 2.28 |
Median Household Size in Centerville
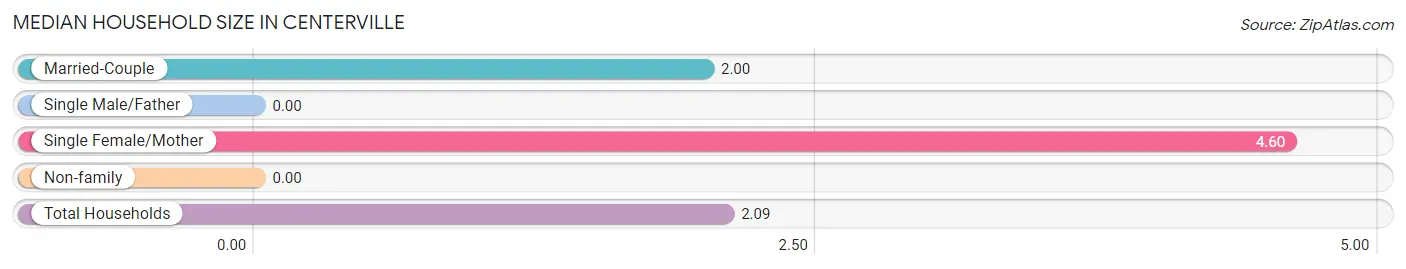
| Household Type | # Households | Household Size |
| Married-Couple | 41 (75.9%) | 2.00 |
| Single Male/Father | 0 (0.0%) | - |
| Single Female/Mother | 5 (9.3%) | 4.60 |
| Non-family | 8 (14.8%) | - |
| Total Households | 54 (100.0%) | 2.09 |
Household Size by Marriage Status in Centerville
Out of a total of 54 households in Centerville, 46 (85.2%) are family households, while 8 (14.8%) are nonfamily households. The most numerous type of family households are 2-person households, comprising 39, and the most common type of nonfamily households are 1-person households, comprising 8.
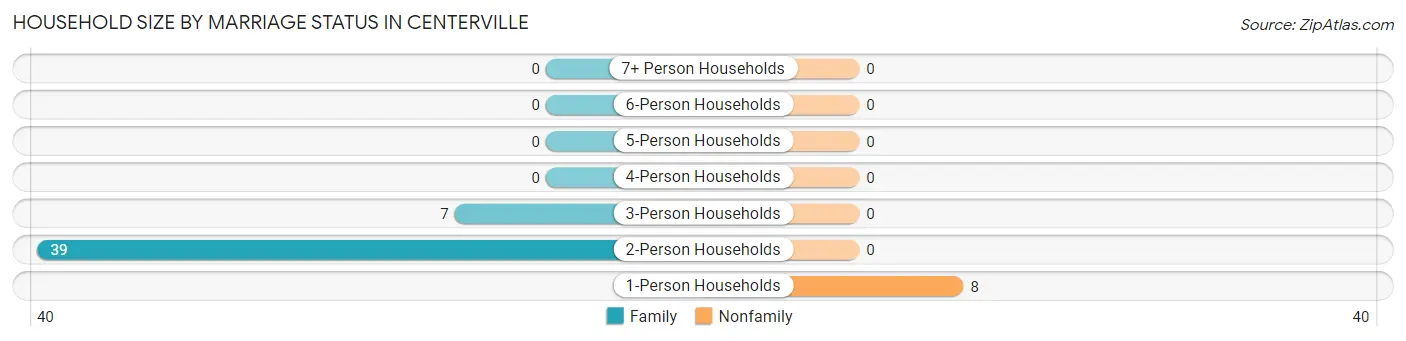
| Household Size | Family Households | Nonfamily Households |
| 1-Person Households | - | 8 (14.8%) |
| 2-Person Households | 39 (72.2%) | 0 (0.0%) |
| 3-Person Households | 7 (13.0%) | 0 (0.0%) |
| 4-Person Households | 0 (0.0%) | 0 (0.0%) |
| 5-Person Households | 0 (0.0%) | 0 (0.0%) |
| 6-Person Households | 0 (0.0%) | 0 (0.0%) |
| 7+ Person Households | 0 (0.0%) | 0 (0.0%) |
| Total | 46 (85.2%) | 8 (14.8%) |
Female Fertility in Centerville
Fertility by Age in Centerville
| Age Bracket | Women with Births | Births / 1,000 Women |
| 15 to 19 years | 0 (0.0%) | 0.0 |
| 20 to 34 years | 0 (0.0%) | 0.0 |
| 35 to 50 years | 0 (0.0%) | 0.0 |
| Total | 0 (0.0%) | 0.0 |
Fertility by Age by Marriage Status in Centerville
| Age Bracket | Married | Unmarried |
| 15 to 19 years | 0 (0.0%) | 0 (0.0%) |
| 20 to 34 years | 0 (0.0%) | 0 (0.0%) |
| 35 to 50 years | 0 (0.0%) | 0 (0.0%) |
| Total | 0 (0.0%) | 0 (0.0%) |
Fertility by Education in Centerville
| Educational Attainment | Women with Births | Births / 1,000 Women |
| Less than High School | 0 (0.0%) | 0.0 |
| High School Diploma | 0 (0.0%) | 0.0 |
| College or Associate's Degree | 0 (0.0%) | 0.0 |
| Bachelor's Degree | 0 (0.0%) | 0.0 |
| Graduate Degree | 0 (0.0%) | 0.0 |
| Total | 0 (0.0%) | 0.0 |
Fertility by Education by Marriage Status in Centerville
| Educational Attainment | Married | Unmarried |
| Less than High School | 0 (0.0%) | 0 (0.0%) |
| High School Diploma | 0 (0.0%) | 0 (0.0%) |
| College or Associate's Degree | 0 (0.0%) | 0 (0.0%) |
| Bachelor's Degree | 0 (0.0%) | 0 (0.0%) |
| Graduate Degree | 0 (0.0%) | 0 (0.0%) |
| Total | 0 (0.0%) | 0 (0.0%) |
Employment Characteristics in Centerville
Employment by Class of Employer in Centerville
Among the 63 employed individuals in Centerville, private company employees (22 | 34.9%), local government employees (14 | 22.2%), and not-for-profit organizations (9 | 14.3%) make up the most common classes of employment.
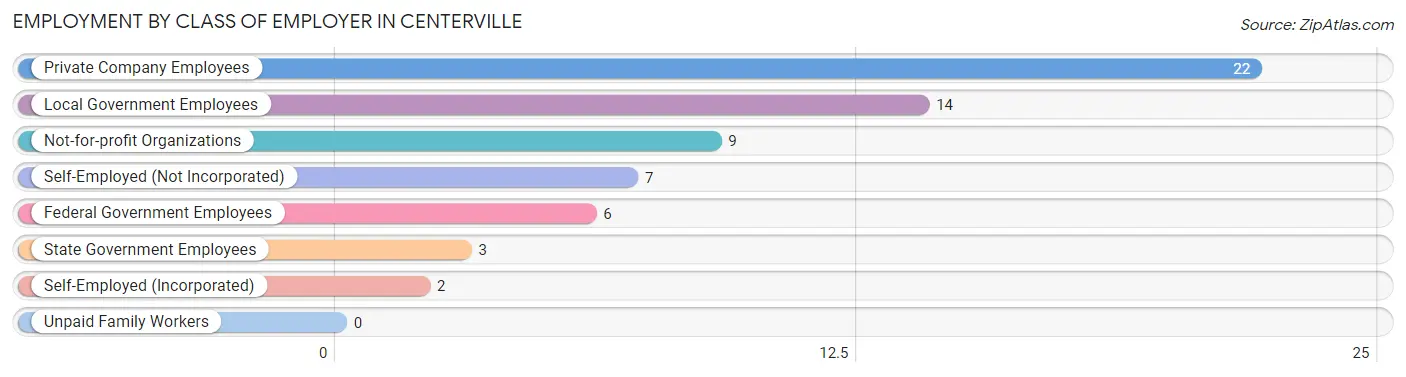
| Employer Class | # Employees | % Employees |
| Private Company Employees | 22 | 34.9% |
| Self-Employed (Incorporated) | 2 | 3.2% |
| Self-Employed (Not Incorporated) | 7 | 11.1% |
| Not-for-profit Organizations | 9 | 14.3% |
| Local Government Employees | 14 | 22.2% |
| State Government Employees | 3 | 4.8% |
| Federal Government Employees | 6 | 9.5% |
| Unpaid Family Workers | 0 | 0.0% |
| Total | 63 | 100.0% |
Employment Status by Age in Centerville
According to the labor force statistics for Centerville, out of the total population over 16 years of age (110), 75.5% or 83 individuals are in the labor force, with 19.3% or 16 of them unemployed. The age group with the highest labor force participation rate is 25 to 29 years, with 100.0% or 5 individuals in the labor force. Within the labor force, the 60 to 64 years age range has the highest percentage of unemployed individuals, with 44.8% or 13 of them being unemployed.
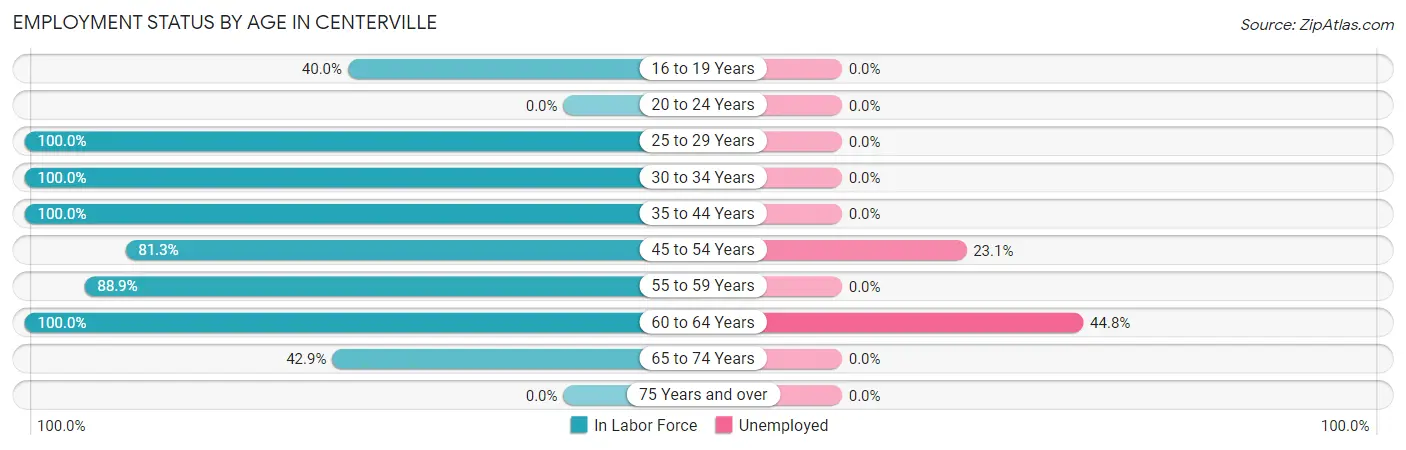
| Age Bracket | In Labor Force | Unemployed |
| 16 to 19 Years | 6 (40.0%) | 0 (0.0%) |
| 20 to 24 Years | 0 (0.0%) | 0 (0.0%) |
| 25 to 29 Years | 5 (100.0%) | 0 (0.0%) |
| 30 to 34 Years | 5 (100.0%) | 0 (0.0%) |
| 35 to 44 Years | 3 (100.0%) | 0 (0.0%) |
| 45 to 54 Years | 13 (81.3%) | 3 (23.1%) |
| 55 to 59 Years | 16 (88.9%) | 0 (0.0%) |
| 60 to 64 Years | 29 (100.0%) | 13 (44.8%) |
| 65 to 74 Years | 6 (42.9%) | 0 (0.0%) |
| 75 Years and over | 0 (0.0%) | 0 (0.0%) |
| Total | 83 (75.5%) | 16 (19.3%) |
Employment Status by Educational Attainment in Centerville
According to labor force statistics for Centerville, 93.4% of individuals (71) out of the total population between 25 and 64 years of age (76) are in the labor force, with 22.5% or 16 of them being unemployed. The group with the highest labor force participation rate are those with the educational attainment of college / associate degree, with 100.0% or 31 individuals in the labor force. Within the labor force, individuals with bachelor's degree or higher education have the highest percentage of unemployment, with 59.1% or 13 of them being unemployed.
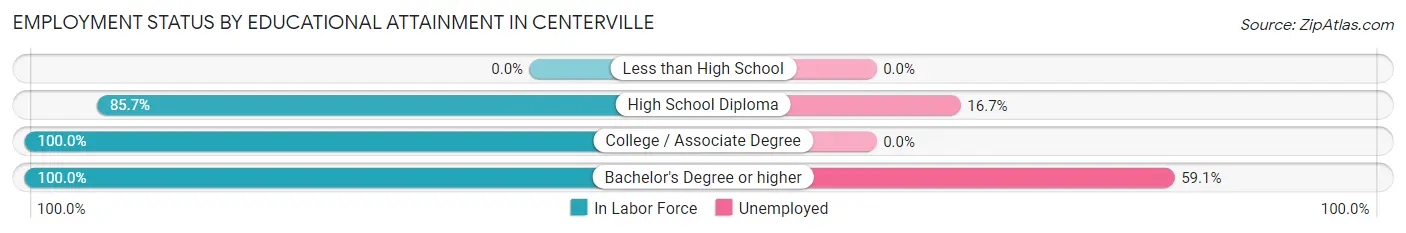
| Educational Attainment | In Labor Force | Unemployed |
| Less than High School | 0 (0.0%) | 0 (0.0%) |
| High School Diploma | 18 (85.7%) | 4 (16.7%) |
| College / Associate Degree | 31 (100.0%) | 0 (0.0%) |
| Bachelor's Degree or higher | 22 (100.0%) | 13 (59.1%) |
| Total | 71 (93.4%) | 17 (22.5%) |
Employment Occupations by Sex in Centerville
Management, Business, Science and Arts Occupations
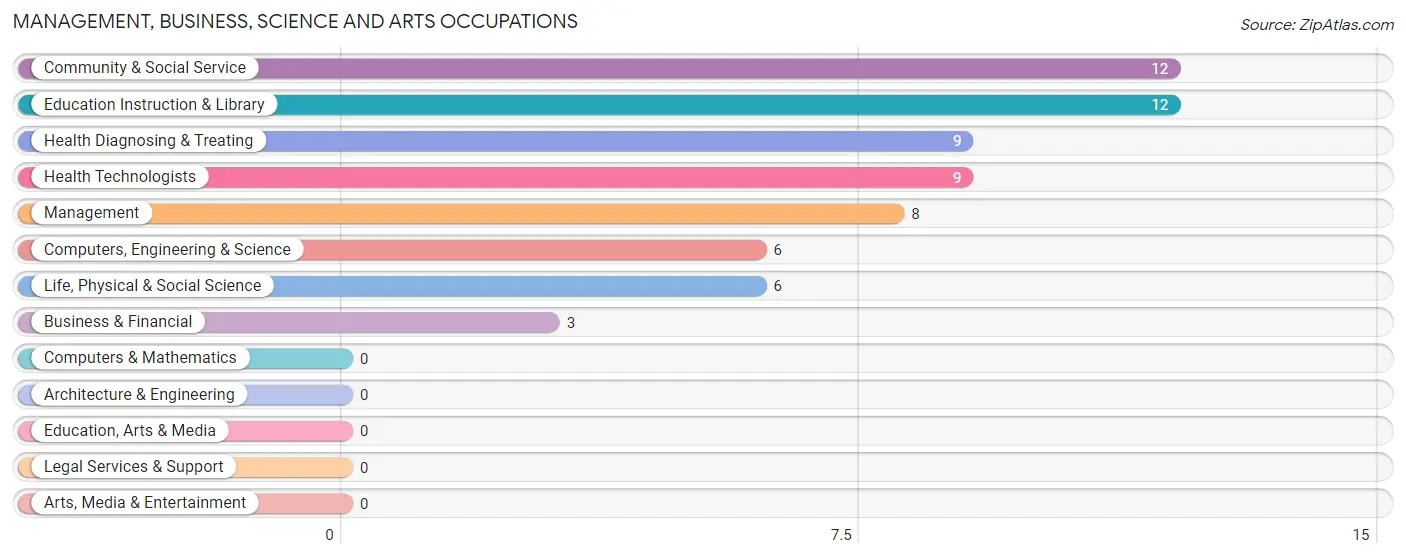
The most common Management, Business, Science and Arts occupations in Centerville are Community & Social Service (12 | 17.9%), Education Instruction & Library (12 | 17.9%), Health Diagnosing & Treating (9 | 13.4%), Health Technologists (9 | 13.4%), and Management (8 | 11.9%).
Management, Business, Science and Arts Occupations by Sex
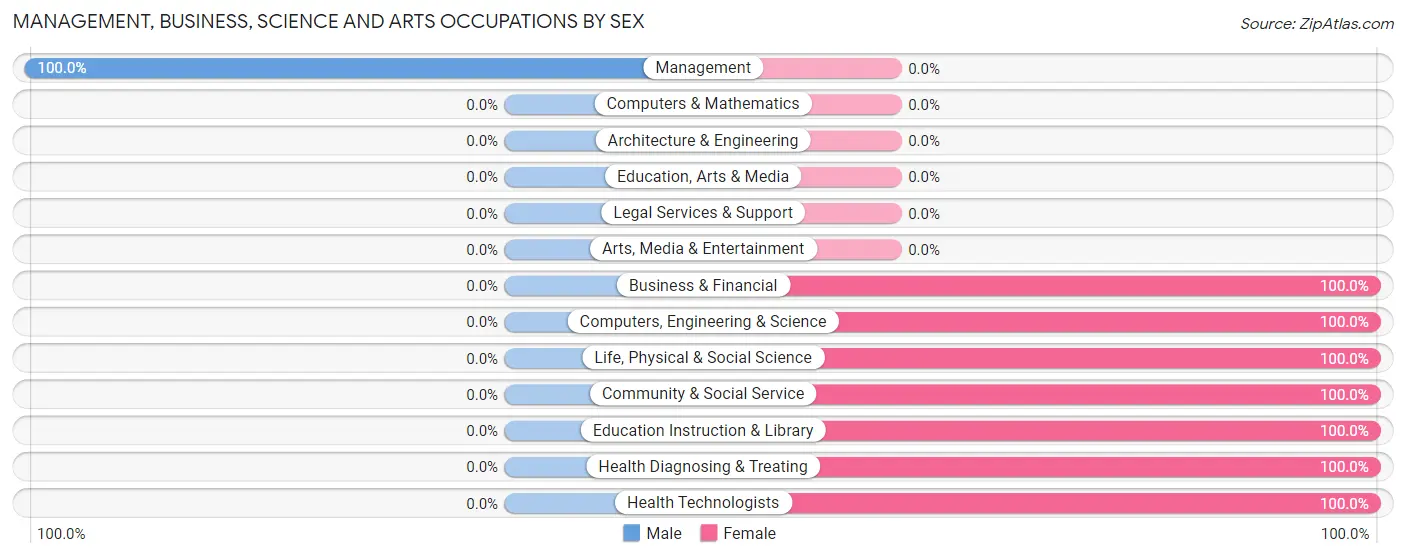
| Occupation | Male | Female |
| Management | 8 (100.0%) | 0 (0.0%) |
| Business & Financial | 0 (0.0%) | 3 (100.0%) |
| Computers, Engineering & Science | 0 (0.0%) | 6 (100.0%) |
| Computers & Mathematics | 0 (0.0%) | 0 (0.0%) |
| Architecture & Engineering | 0 (0.0%) | 0 (0.0%) |
| Life, Physical & Social Science | 0 (0.0%) | 6 (100.0%) |
| Community & Social Service | 0 (0.0%) | 12 (100.0%) |
| Education, Arts & Media | 0 (0.0%) | 0 (0.0%) |
| Legal Services & Support | 0 (0.0%) | 0 (0.0%) |
| Education Instruction & Library | 0 (0.0%) | 12 (100.0%) |
| Arts, Media & Entertainment | 0 (0.0%) | 0 (0.0%) |
| Health Diagnosing & Treating | 0 (0.0%) | 9 (100.0%) |
| Health Technologists | 0 (0.0%) | 9 (100.0%) |
| Total (Category) | 8 (21.0%) | 30 (78.9%) |
| Total (Overall) | 27 (40.3%) | 40 (59.7%) |
Services Occupations
The most common Services occupations in Centerville are Healthcare Support (5 | 7.5%), and Personal Care & Service (2 | 3.0%).
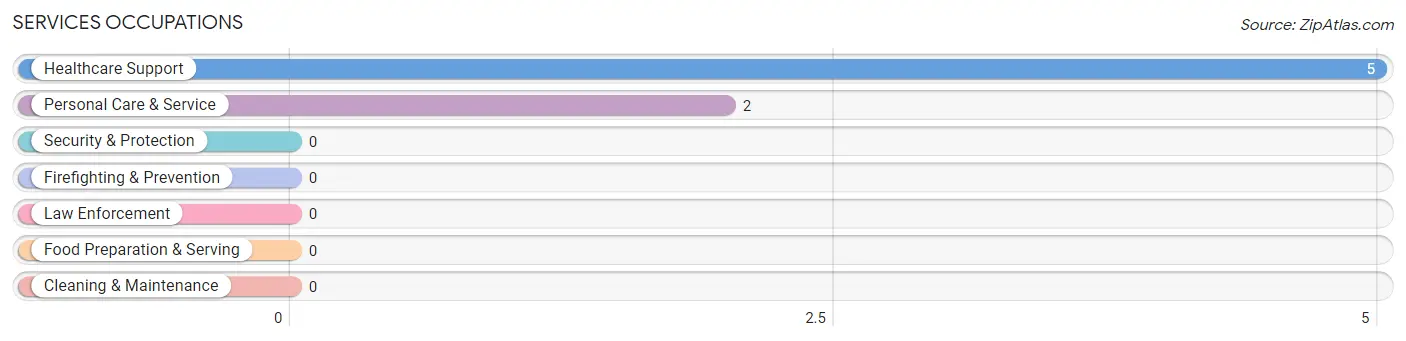
Services Occupations by Sex
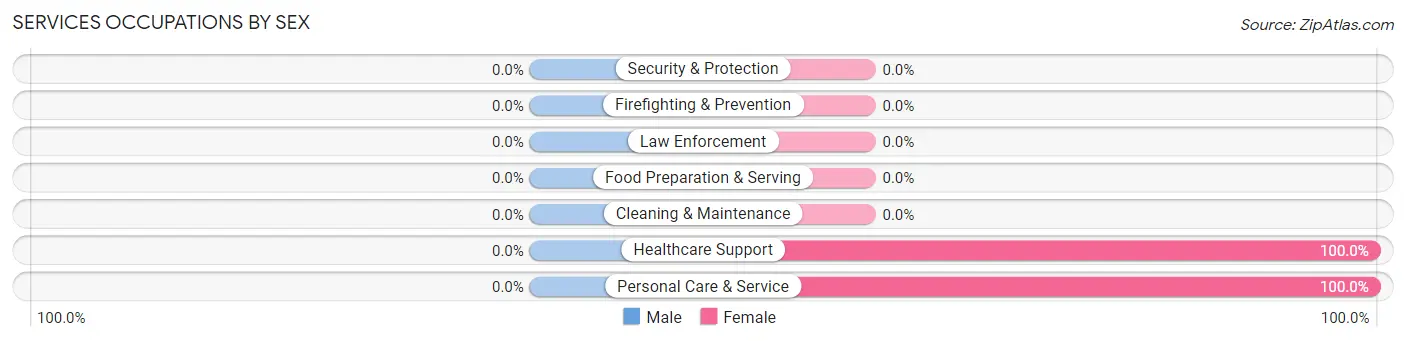
| Occupation | Male | Female |
| Healthcare Support | 0 (0.0%) | 5 (100.0%) |
| Security & Protection | 0 (0.0%) | 0 (0.0%) |
| Firefighting & Prevention | 0 (0.0%) | 0 (0.0%) |
| Law Enforcement | 0 (0.0%) | 0 (0.0%) |
| Food Preparation & Serving | 0 (0.0%) | 0 (0.0%) |
| Cleaning & Maintenance | 0 (0.0%) | 0 (0.0%) |
| Personal Care & Service | 0 (0.0%) | 2 (100.0%) |
| Total (Category) | 0 (0.0%) | 7 (100.0%) |
| Total (Overall) | 27 (40.3%) | 40 (59.7%) |
Sales and Office Occupations
The most common Sales and Office occupations in Centerville are , and Sales & Related (3 | 4.5%).

Sales and Office Occupations by Sex

| Occupation | Male | Female |
| Sales & Related | 0 (0.0%) | 3 (100.0%) |
| Office & Administration | 0 (0.0%) | 0 (0.0%) |
| Total (Category) | 0 (0.0%) | 3 (100.0%) |
| Total (Overall) | 27 (40.3%) | 40 (59.7%) |
Natural Resources, Construction and Maintenance Occupations
The most common Natural Resources, Construction and Maintenance occupations in Centerville are , and Farming, Fishing & Forestry (11 | 16.4%).

Natural Resources, Construction and Maintenance Occupations by Sex

| Occupation | Male | Female |
| Farming, Fishing & Forestry | 11 (100.0%) | 0 (0.0%) |
| Construction & Extraction | 0 (0.0%) | 0 (0.0%) |
| Installation, Maintenance & Repair | 0 (0.0%) | 0 (0.0%) |
| Total (Category) | 11 (100.0%) | 0 (0.0%) |
| Total (Overall) | 27 (40.3%) | 40 (59.7%) |
Production, Transportation and Moving Occupations
The most common Production, Transportation and Moving occupations in Centerville are Material Moving (6 | 9.0%), and Transportation (2 | 3.0%).
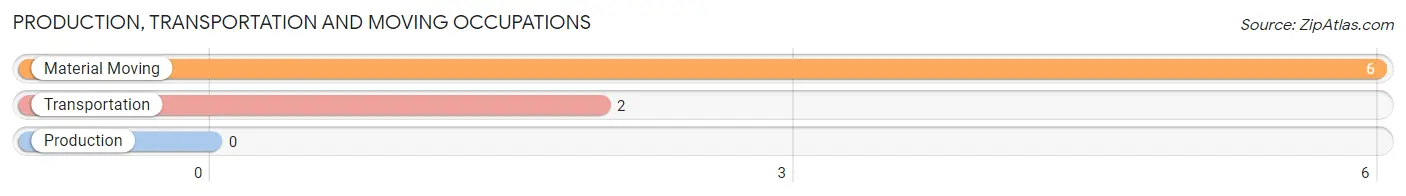
Production, Transportation and Moving Occupations by Sex
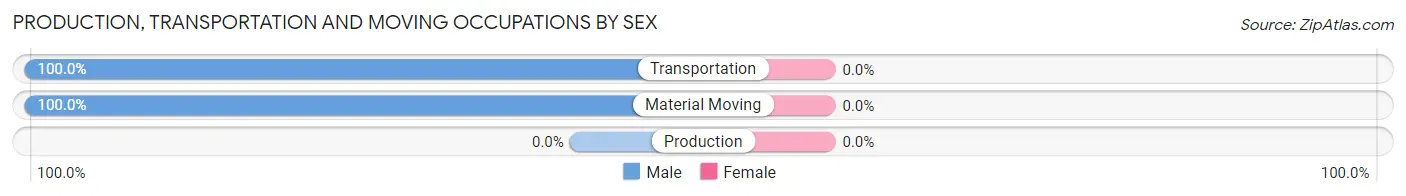
| Occupation | Male | Female |
| Production | 0 (0.0%) | 0 (0.0%) |
| Transportation | 2 (100.0%) | 0 (0.0%) |
| Material Moving | 6 (100.0%) | 0 (0.0%) |
| Total (Category) | 8 (100.0%) | 0 (0.0%) |
| Total (Overall) | 27 (40.3%) | 40 (59.7%) |
Employment Industries by Sex in Centerville
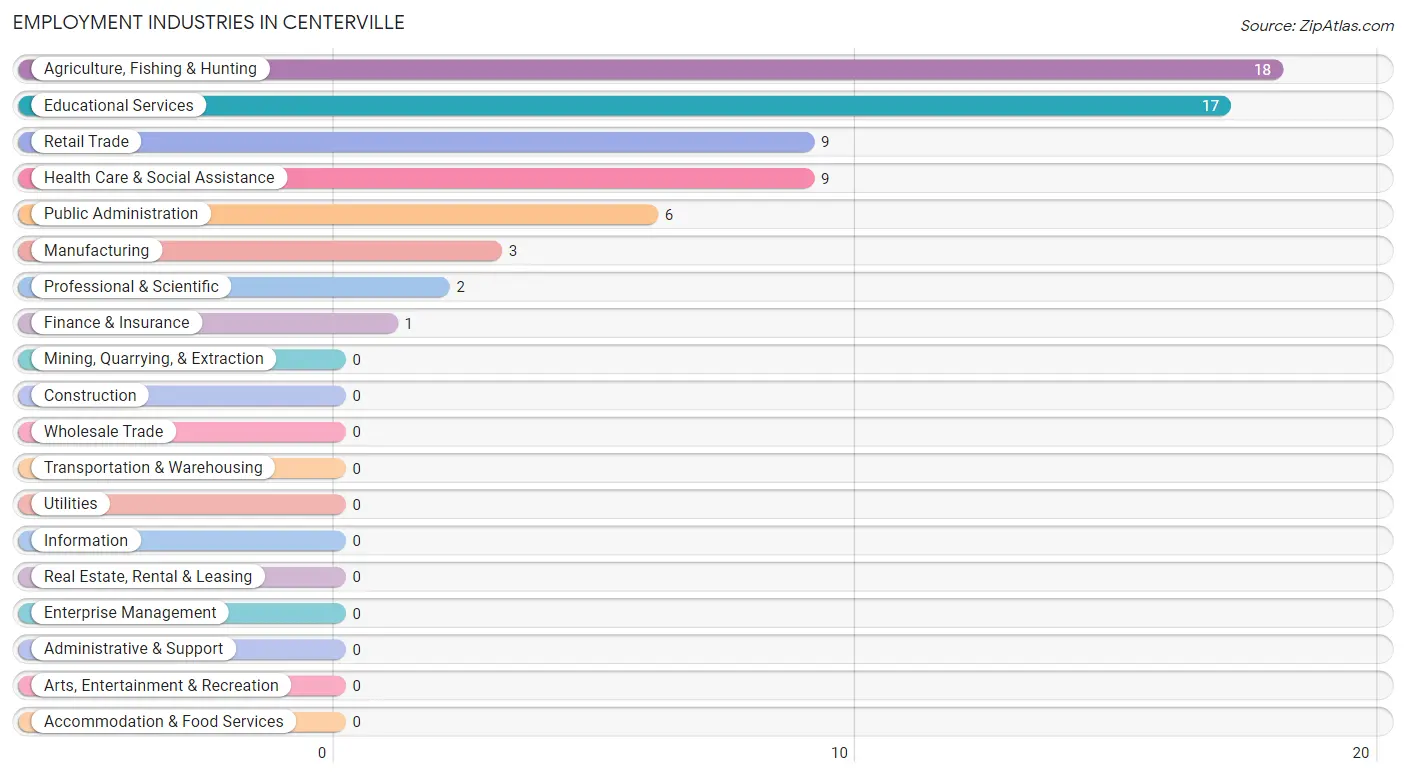
Employment Industries in Centerville
The major employment industries in Centerville include Agriculture, Fishing & Hunting (18 | 26.9%), Educational Services (17 | 25.4%), Retail Trade (9 | 13.4%), Health Care & Social Assistance (9 | 13.4%), and Public Administration (6 | 9.0%).
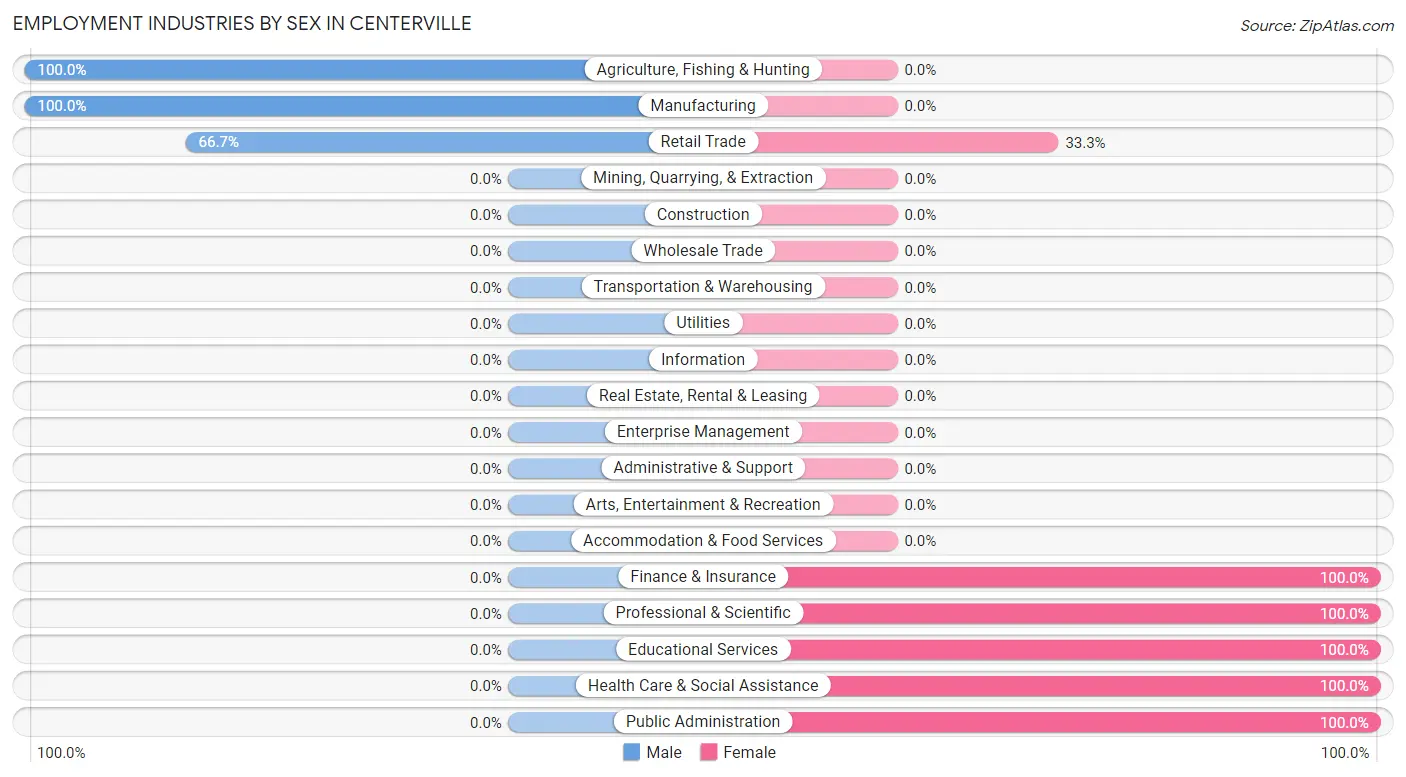
Employment Industries by Sex in Centerville
The Centerville industries that see more men than women are Agriculture, Fishing & Hunting (100.0%), Manufacturing (100.0%), and Retail Trade (66.7%), whereas the industries that tend to have a higher number of women are Finance & Insurance (100.0%), Professional & Scientific (100.0%), and Educational Services (100.0%).
| Industry | Male | Female |
| Agriculture, Fishing & Hunting | 18 (100.0%) | 0 (0.0%) |
| Mining, Quarrying, & Extraction | 0 (0.0%) | 0 (0.0%) |
| Construction | 0 (0.0%) | 0 (0.0%) |
| Manufacturing | 3 (100.0%) | 0 (0.0%) |
| Wholesale Trade | 0 (0.0%) | 0 (0.0%) |
| Retail Trade | 6 (66.7%) | 3 (33.3%) |
| Transportation & Warehousing | 0 (0.0%) | 0 (0.0%) |
| Utilities | 0 (0.0%) | 0 (0.0%) |
| Information | 0 (0.0%) | 0 (0.0%) |
| Finance & Insurance | 0 (0.0%) | 1 (100.0%) |
| Real Estate, Rental & Leasing | 0 (0.0%) | 0 (0.0%) |
| Professional & Scientific | 0 (0.0%) | 2 (100.0%) |
| Enterprise Management | 0 (0.0%) | 0 (0.0%) |
| Administrative & Support | 0 (0.0%) | 0 (0.0%) |
| Educational Services | 0 (0.0%) | 17 (100.0%) |
| Health Care & Social Assistance | 0 (0.0%) | 9 (100.0%) |
| Arts, Entertainment & Recreation | 0 (0.0%) | 0 (0.0%) |
| Accommodation & Food Services | 0 (0.0%) | 0 (0.0%) |
| Public Administration | 0 (0.0%) | 6 (100.0%) |
| Total | 27 (40.3%) | 40 (59.7%) |
Education in Centerville
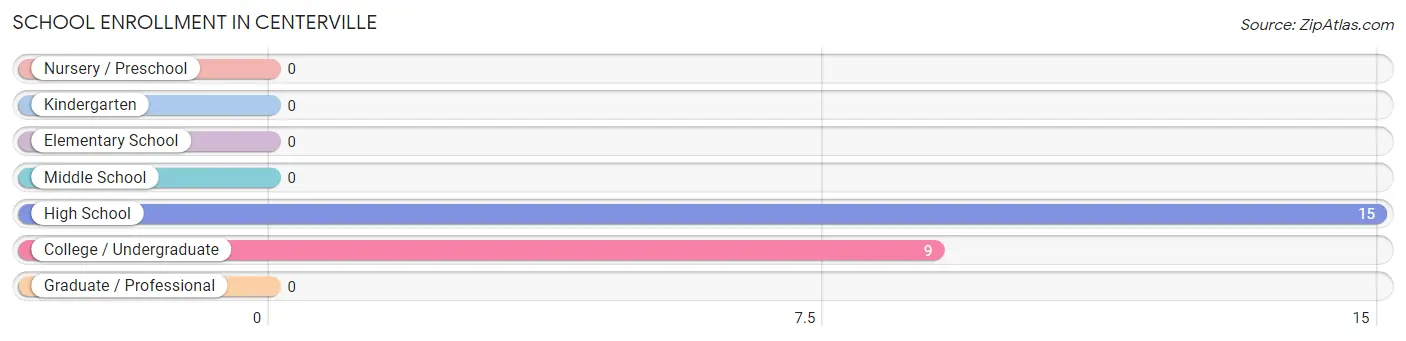
School Enrollment in Centerville
The most common levels of schooling among the 24 students in Centerville are high school (15 | 62.5%), and college / undergraduate (9 | 37.5%).
| School Level | # Students | % Students |
| Nursery / Preschool | 0 | 0.0% |
| Kindergarten | 0 | 0.0% |
| Elementary School | 0 | 0.0% |
| Middle School | 0 | 0.0% |
| High School | 15 | 62.5% |
| College / Undergraduate | 9 | 37.5% |
| Graduate / Professional | 0 | 0.0% |
| Total | 24 | 100.0% |
School Enrollment by Age by Funding Source in Centerville
Out of a total of 24 students who are enrolled in schools in Centerville, 9 (37.5%) attend a private institution, while the remaining 15 (62.5%) are enrolled in public schools. The age group of 35 years and over has the highest likelihood of being enrolled in private schools, with 9 (100.0% in the age bracket) enrolled. Conversely, the age group of 15 to 17 year olds has the lowest likelihood of being enrolled in a private school, with 15 (100.0% in the age bracket) attending a public institution.
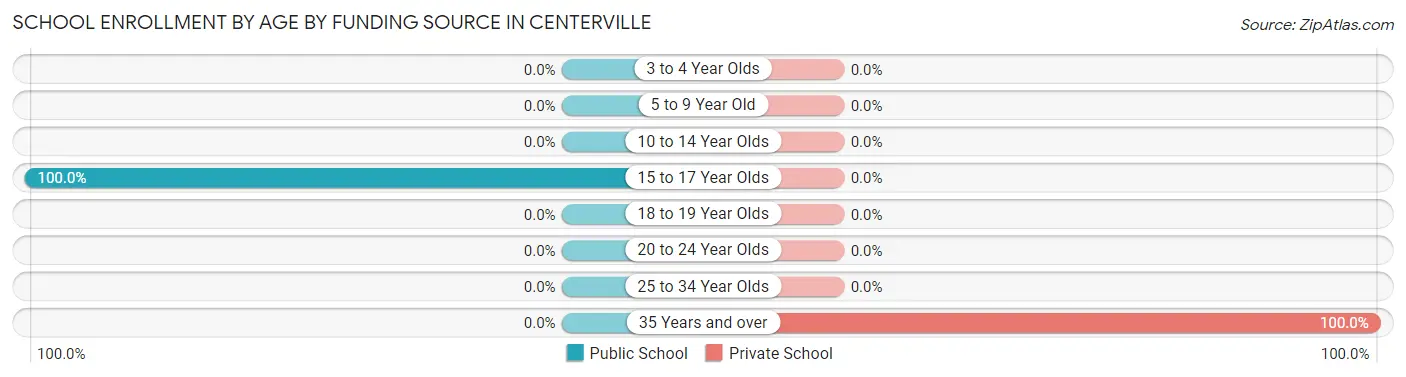
| Age Bracket | Public School | Private School |
| 3 to 4 Year Olds | 0 (0.0%) | 0 (0.0%) |
| 5 to 9 Year Old | 0 (0.0%) | 0 (0.0%) |
| 10 to 14 Year Olds | 0 (0.0%) | 0 (0.0%) |
| 15 to 17 Year Olds | 15 (100.0%) | 0 (0.0%) |
| 18 to 19 Year Olds | 0 (0.0%) | 0 (0.0%) |
| 20 to 24 Year Olds | 0 (0.0%) | 0 (0.0%) |
| 25 to 34 Year Olds | 0 (0.0%) | 0 (0.0%) |
| 35 Years and over | 0 (0.0%) | 9 (100.0%) |
| Total | 15 (62.5%) | 9 (37.5%) |
Educational Attainment by Field of Study in Centerville
Social sciences (13 | 46.4%), education (9 | 32.1%), visual & performing arts (3 | 10.7%), business (2 | 7.1%), and arts & humanities (1 | 3.6%) are the most common fields of study among 28 individuals in Centerville who have obtained a bachelor's degree or higher.
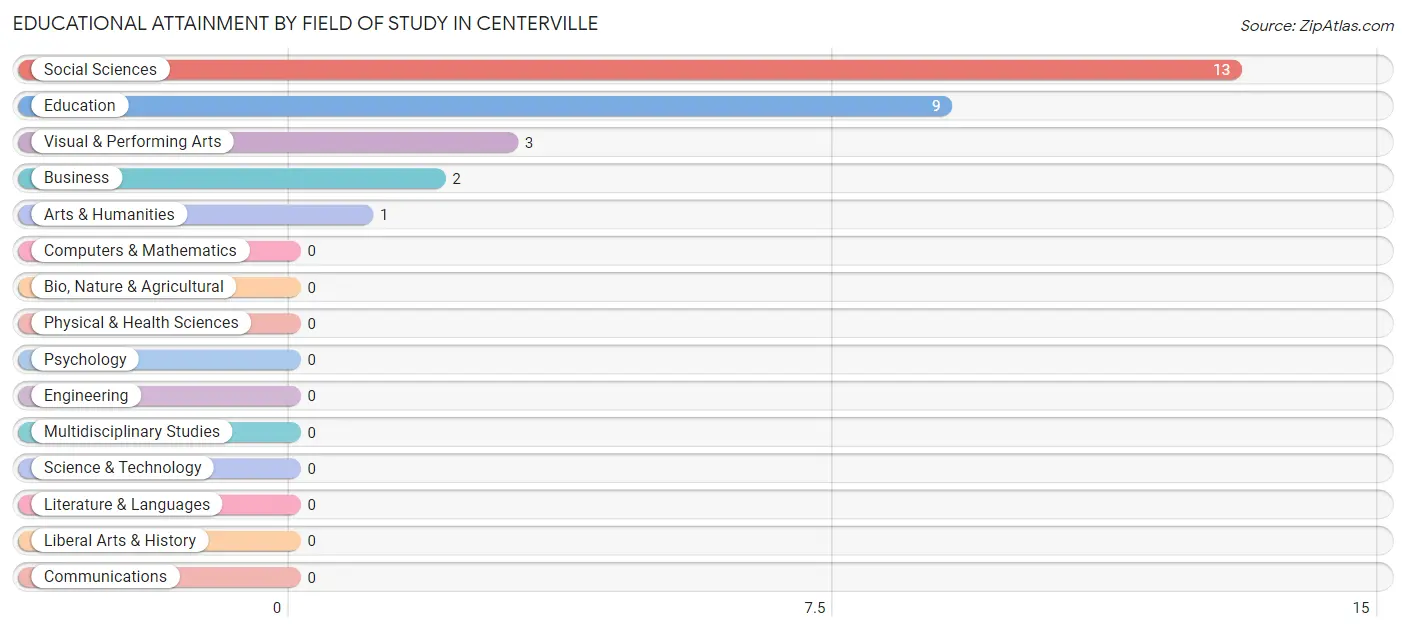
| Field of Study | # Graduates | % Graduates |
| Computers & Mathematics | 0 | 0.0% |
| Bio, Nature & Agricultural | 0 | 0.0% |
| Physical & Health Sciences | 0 | 0.0% |
| Psychology | 0 | 0.0% |
| Social Sciences | 13 | 46.4% |
| Engineering | 0 | 0.0% |
| Multidisciplinary Studies | 0 | 0.0% |
| Science & Technology | 0 | 0.0% |
| Business | 2 | 7.1% |
| Education | 9 | 32.1% |
| Literature & Languages | 0 | 0.0% |
| Liberal Arts & History | 0 | 0.0% |
| Visual & Performing Arts | 3 | 10.7% |
| Communications | 0 | 0.0% |
| Arts & Humanities | 1 | 3.6% |
| Total | 28 | 100.0% |
Transportation & Commute in Centerville
Vehicle Availability by Sex in Centerville
The most prevalent vehicle ownership categories in Centerville are males with 3 vehicles (21, accounting for 77.8%) and females with 3 vehicles (15, making up 58.3%).
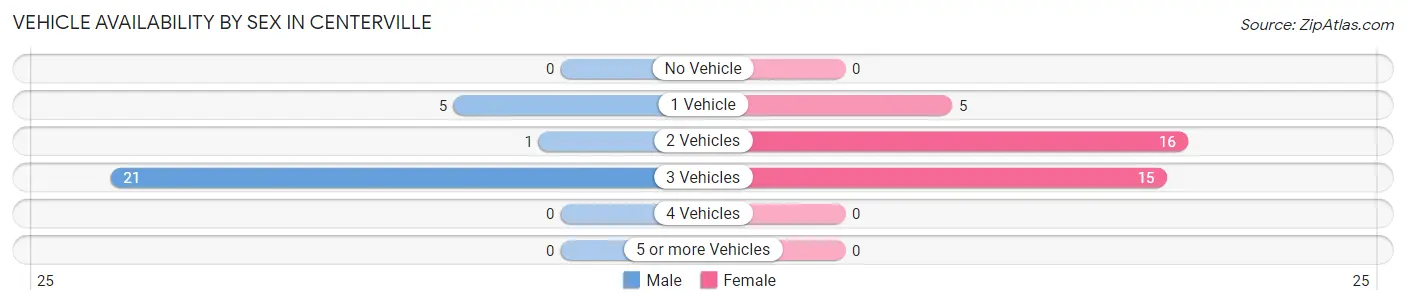
| Vehicles Available | Male | Female |
| No Vehicle | 0 (0.0%) | 0 (0.0%) |
| 1 Vehicle | 5 (18.5%) | 5 (13.9%) |
| 2 Vehicles | 1 (3.7%) | 16 (44.4%) |
| 3 Vehicles | 21 (77.8%) | 15 (41.7%) |
| 4 Vehicles | 0 (0.0%) | 0 (0.0%) |
| 5 or more Vehicles | 0 (0.0%) | 0 (0.0%) |
| Total | 27 (100.0%) | 36 (100.0%) |
Commute Time in Centerville
The most frequently occuring commute durations in Centerville are 15 to 19 minutes (32 commuters, 59.3%), 10 to 14 minutes (6 commuters, 11.1%), and 20 to 24 minutes (6 commuters, 11.1%).
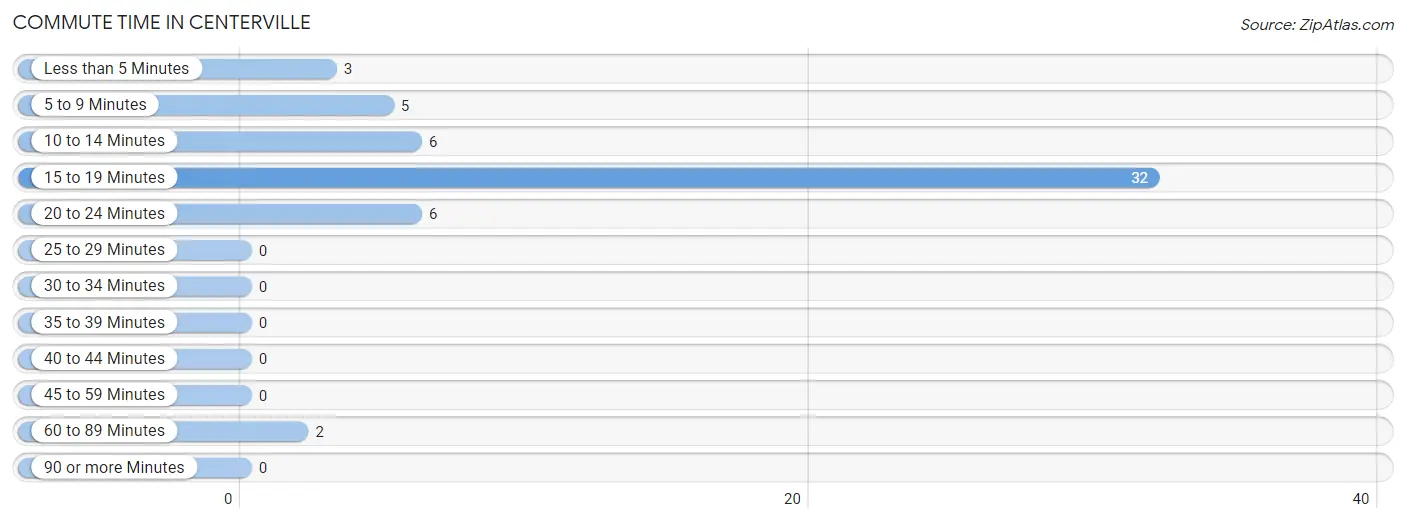
| Commute Time | # Commuters | % Commuters |
| Less than 5 Minutes | 3 | 5.6% |
| 5 to 9 Minutes | 5 | 9.3% |
| 10 to 14 Minutes | 6 | 11.1% |
| 15 to 19 Minutes | 32 | 59.3% |
| 20 to 24 Minutes | 6 | 11.1% |
| 25 to 29 Minutes | 0 | 0.0% |
| 30 to 34 Minutes | 0 | 0.0% |
| 35 to 39 Minutes | 0 | 0.0% |
| 40 to 44 Minutes | 0 | 0.0% |
| 45 to 59 Minutes | 0 | 0.0% |
| 60 to 89 Minutes | 2 | 3.7% |
| 90 or more Minutes | 0 | 0.0% |
Commute Time by Sex in Centerville
The most common commute times in Centerville are 15 to 19 minutes (9 commuters, 40.9%) for males and 15 to 19 minutes (23 commuters, 71.9%) for females.
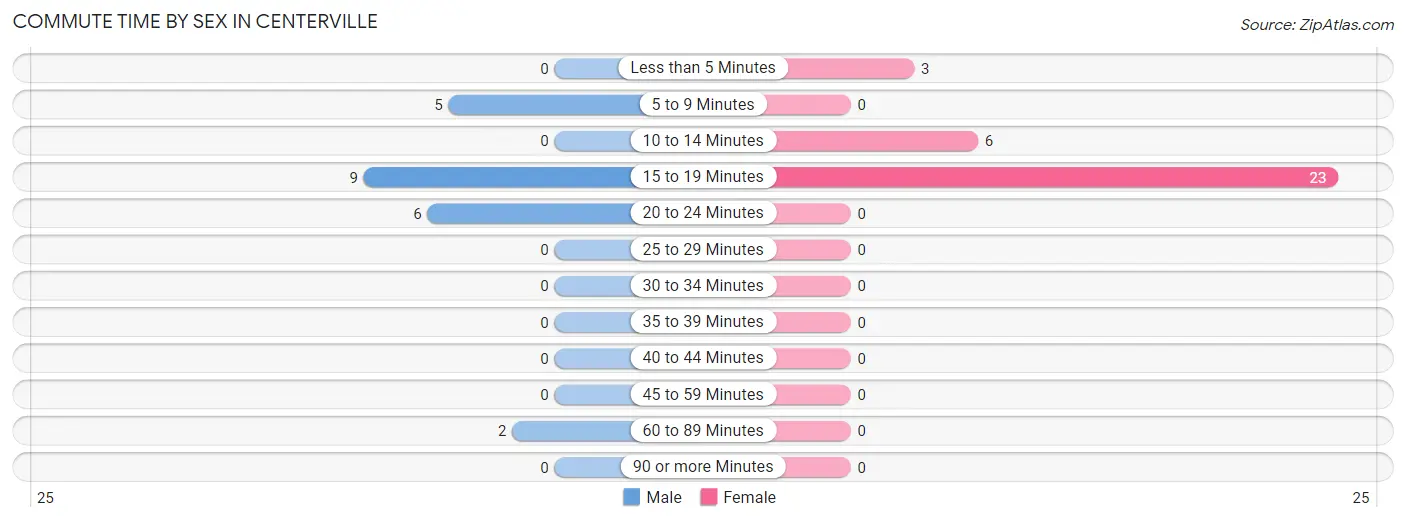
| Commute Time | Male | Female |
| Less than 5 Minutes | 0 (0.0%) | 3 (9.4%) |
| 5 to 9 Minutes | 5 (22.7%) | 0 (0.0%) |
| 10 to 14 Minutes | 0 (0.0%) | 6 (18.8%) |
| 15 to 19 Minutes | 9 (40.9%) | 23 (71.9%) |
| 20 to 24 Minutes | 6 (27.3%) | 0 (0.0%) |
| 25 to 29 Minutes | 0 (0.0%) | 0 (0.0%) |
| 30 to 34 Minutes | 0 (0.0%) | 0 (0.0%) |
| 35 to 39 Minutes | 0 (0.0%) | 0 (0.0%) |
| 40 to 44 Minutes | 0 (0.0%) | 0 (0.0%) |
| 45 to 59 Minutes | 0 (0.0%) | 0 (0.0%) |
| 60 to 89 Minutes | 2 (9.1%) | 0 (0.0%) |
| 90 or more Minutes | 0 (0.0%) | 0 (0.0%) |
Time of Departure to Work by Sex in Centerville
The most frequent times of departure to work in Centerville are 7:00 AM to 7:29 AM (6, 27.3%) for males and 6:30 AM to 6:59 AM (21, 65.6%) for females.
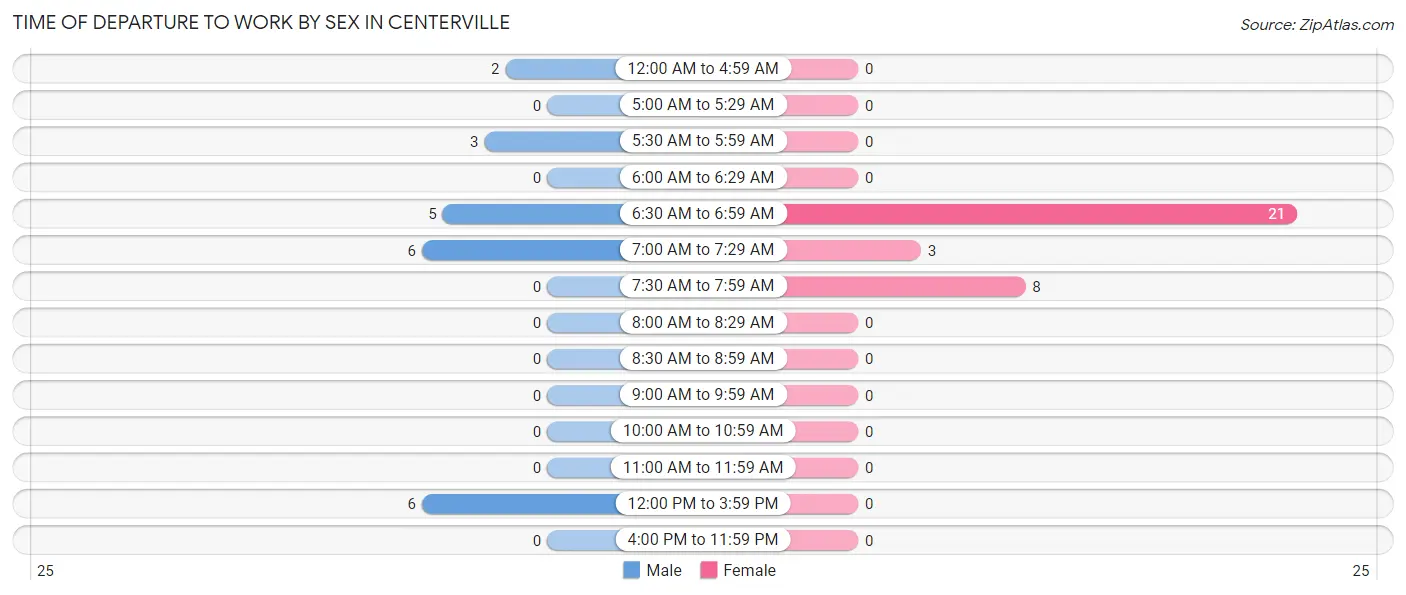
| Time of Departure | Male | Female |
| 12:00 AM to 4:59 AM | 2 (9.1%) | 0 (0.0%) |
| 5:00 AM to 5:29 AM | 0 (0.0%) | 0 (0.0%) |
| 5:30 AM to 5:59 AM | 3 (13.6%) | 0 (0.0%) |
| 6:00 AM to 6:29 AM | 0 (0.0%) | 0 (0.0%) |
| 6:30 AM to 6:59 AM | 5 (22.7%) | 21 (65.6%) |
| 7:00 AM to 7:29 AM | 6 (27.3%) | 3 (9.4%) |
| 7:30 AM to 7:59 AM | 0 (0.0%) | 8 (25.0%) |
| 8:00 AM to 8:29 AM | 0 (0.0%) | 0 (0.0%) |
| 8:30 AM to 8:59 AM | 0 (0.0%) | 0 (0.0%) |
| 9:00 AM to 9:59 AM | 0 (0.0%) | 0 (0.0%) |
| 10:00 AM to 10:59 AM | 0 (0.0%) | 0 (0.0%) |
| 11:00 AM to 11:59 AM | 0 (0.0%) | 0 (0.0%) |
| 12:00 PM to 3:59 PM | 6 (27.3%) | 0 (0.0%) |
| 4:00 PM to 11:59 PM | 0 (0.0%) | 0 (0.0%) |
| Total | 22 (100.0%) | 32 (100.0%) |
Housing Occupancy in Centerville
Occupancy by Ownership in Centerville
Of the total 54 dwellings in Centerville, owner-occupied units account for 48 (88.9%), while renter-occupied units make up 6 (11.1%).
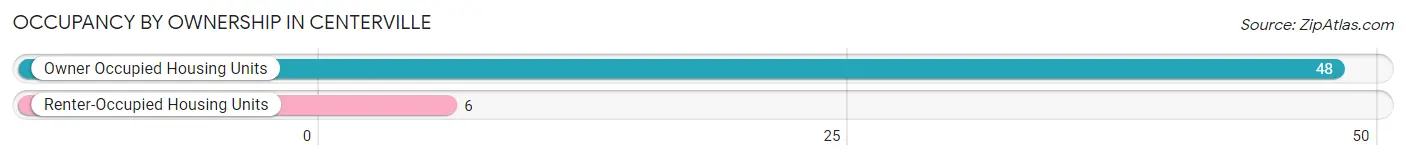
| Occupancy | # Housing Units | % Housing Units |
| Owner Occupied Housing Units | 48 | 88.9% |
| Renter-Occupied Housing Units | 6 | 11.1% |
| Total Occupied Housing Units | 54 | 100.0% |
Occupancy by Household Size in Centerville
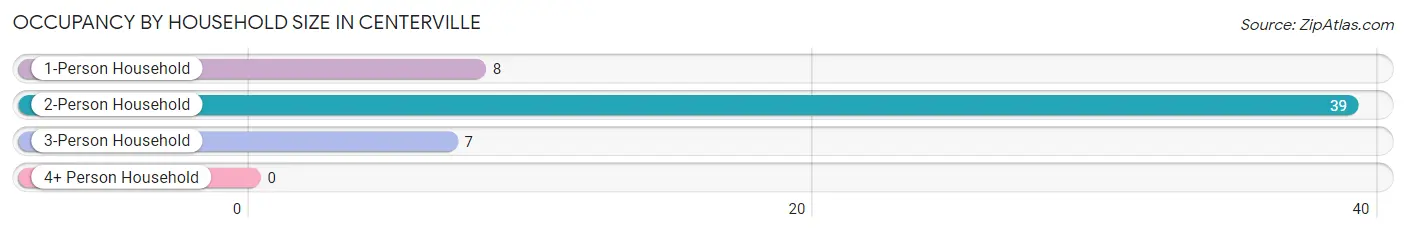
| Household Size | # Housing Units | % Housing Units |
| 1-Person Household | 8 | 14.8% |
| 2-Person Household | 39 | 72.2% |
| 3-Person Household | 7 | 13.0% |
| 4+ Person Household | 0 | 0.0% |
| Total Housing Units | 54 | 100.0% |
Occupancy by Ownership by Household Size in Centerville
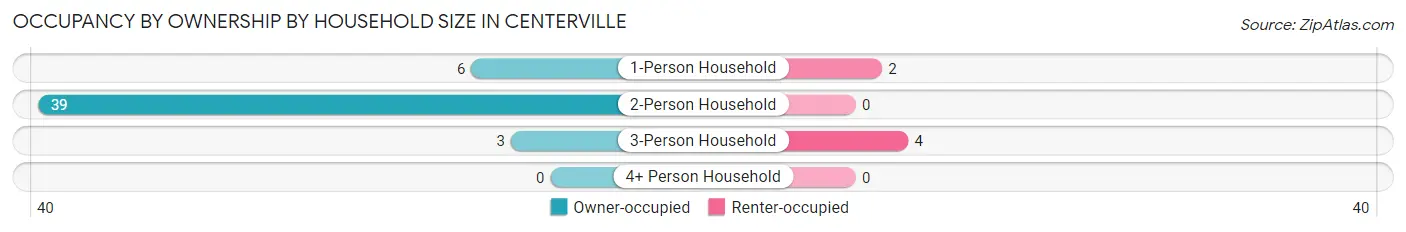
| Household Size | Owner-occupied | Renter-occupied |
| 1-Person Household | 6 (75.0%) | 2 (25.0%) |
| 2-Person Household | 39 (100.0%) | 0 (0.0%) |
| 3-Person Household | 3 (42.9%) | 4 (57.1%) |
| 4+ Person Household | 0 (0.0%) | 0 (0.0%) |
| Total Housing Units | 48 (88.9%) | 6 (11.1%) |
Occupancy by Educational Attainment in Centerville
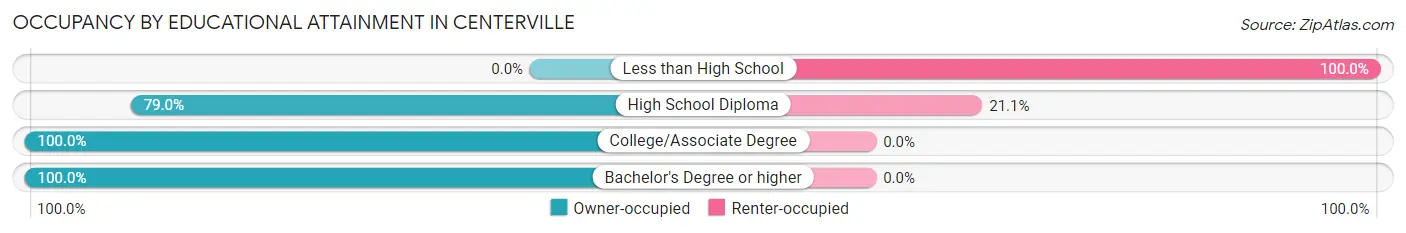
| Household Size | Owner-occupied | Renter-occupied |
| Less than High School | 0 (0.0%) | 2 (100.0%) |
| High School Diploma | 15 (78.9%) | 4 (21.0%) |
| College/Associate Degree | 15 (100.0%) | 0 (0.0%) |
| Bachelor's Degree or higher | 18 (100.0%) | 0 (0.0%) |
Occupancy by Age of Householder in Centerville
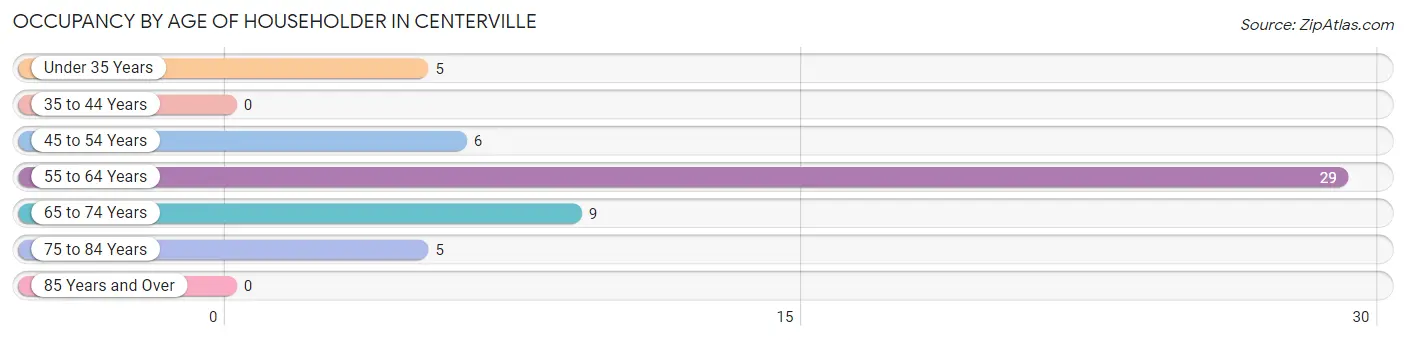
| Age Bracket | # Households | % Households |
| Under 35 Years | 5 | 9.3% |
| 35 to 44 Years | 0 | 0.0% |
| 45 to 54 Years | 6 | 11.1% |
| 55 to 64 Years | 29 | 53.7% |
| 65 to 74 Years | 9 | 16.7% |
| 75 to 84 Years | 5 | 9.3% |
| 85 Years and Over | 0 | 0.0% |
| Total | 54 | 100.0% |
Housing Finances in Centerville
Median Income by Occupancy in Centerville
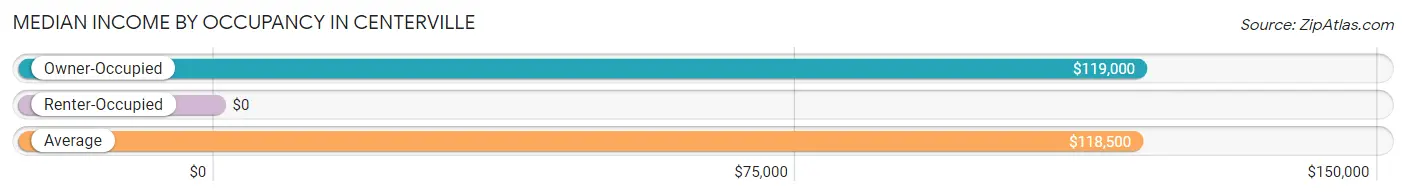
| Occupancy Type | # Households | Median Income |
| Owner-Occupied | 48 (88.9%) | $119,000 |
| Renter-Occupied | 6 (11.1%) | $0 |
| Average | 54 (100.0%) | $118,500 |
Occupancy by Householder Income Bracket in Centerville
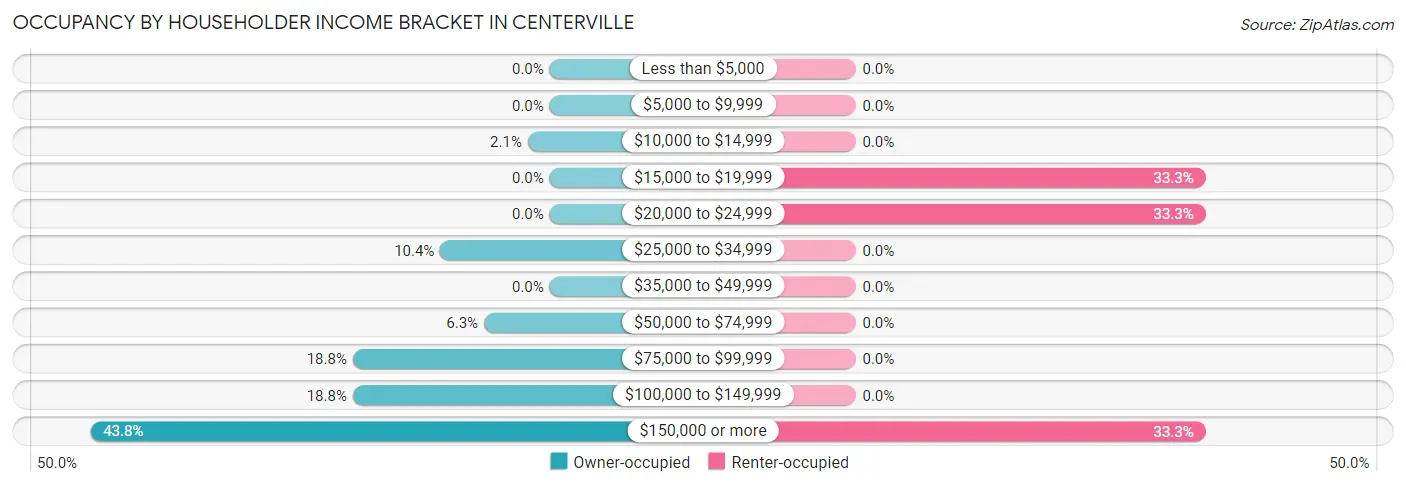
| Income Bracket | Owner-occupied | Renter-occupied |
| Less than $5,000 | 0 (0.0%) | 0 (0.0%) |
| $5,000 to $9,999 | 0 (0.0%) | 0 (0.0%) |
| $10,000 to $14,999 | 1 (2.1%) | 0 (0.0%) |
| $15,000 to $19,999 | 0 (0.0%) | 2 (33.3%) |
| $20,000 to $24,999 | 0 (0.0%) | 2 (33.3%) |
| $25,000 to $34,999 | 5 (10.4%) | 0 (0.0%) |
| $35,000 to $49,999 | 0 (0.0%) | 0 (0.0%) |
| $50,000 to $74,999 | 3 (6.2%) | 0 (0.0%) |
| $75,000 to $99,999 | 9 (18.8%) | 0 (0.0%) |
| $100,000 to $149,999 | 9 (18.8%) | 0 (0.0%) |
| $150,000 or more | 21 (43.8%) | 2 (33.3%) |
| Total | 48 (100.0%) | 6 (100.0%) |
Monthly Housing Cost Tiers in Centerville
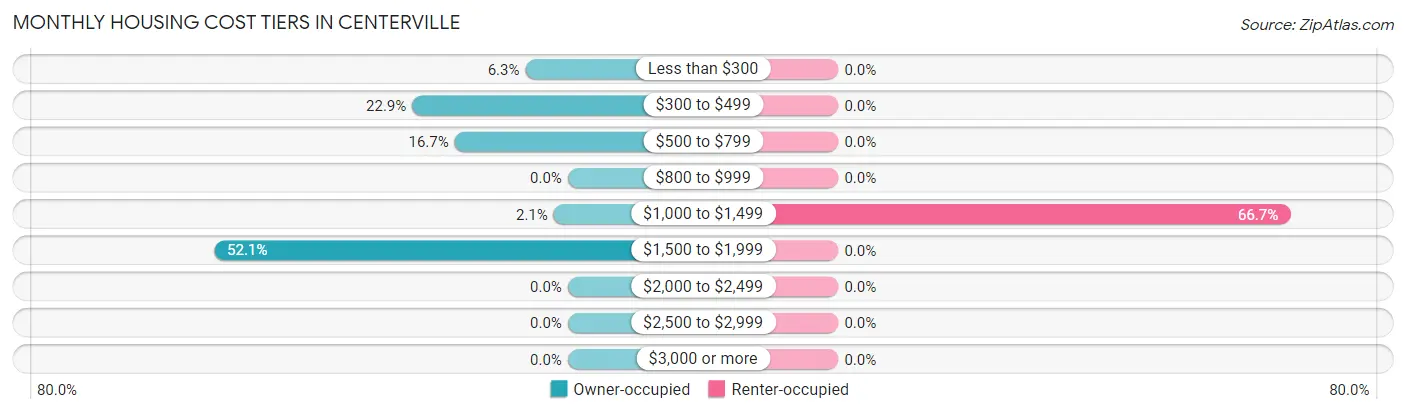
| Monthly Cost | Owner-occupied | Renter-occupied |
| Less than $300 | 3 (6.2%) | 0 (0.0%) |
| $300 to $499 | 11 (22.9%) | 0 (0.0%) |
| $500 to $799 | 8 (16.7%) | 0 (0.0%) |
| $800 to $999 | 0 (0.0%) | 0 (0.0%) |
| $1,000 to $1,499 | 1 (2.1%) | 4 (66.7%) |
| $1,500 to $1,999 | 25 (52.1%) | 0 (0.0%) |
| $2,000 to $2,499 | 0 (0.0%) | 0 (0.0%) |
| $2,500 to $2,999 | 0 (0.0%) | 0 (0.0%) |
| $3,000 or more | 0 (0.0%) | 0 (0.0%) |
| Total | 48 (100.0%) | 6 (100.0%) |
Physical Housing Characteristics in Centerville
Housing Structures in Centerville
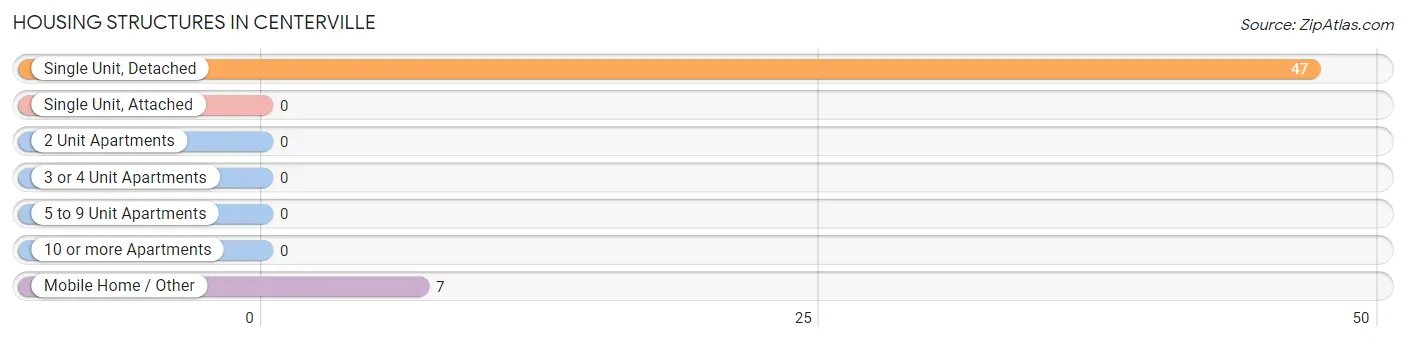
| Structure Type | # Housing Units | % Housing Units |
| Single Unit, Detached | 47 | 87.0% |
| Single Unit, Attached | 0 | 0.0% |
| 2 Unit Apartments | 0 | 0.0% |
| 3 or 4 Unit Apartments | 0 | 0.0% |
| 5 to 9 Unit Apartments | 0 | 0.0% |
| 10 or more Apartments | 0 | 0.0% |
| Mobile Home / Other | 7 | 13.0% |
| Total | 54 | 100.0% |
Housing Structures by Occupancy in Centerville
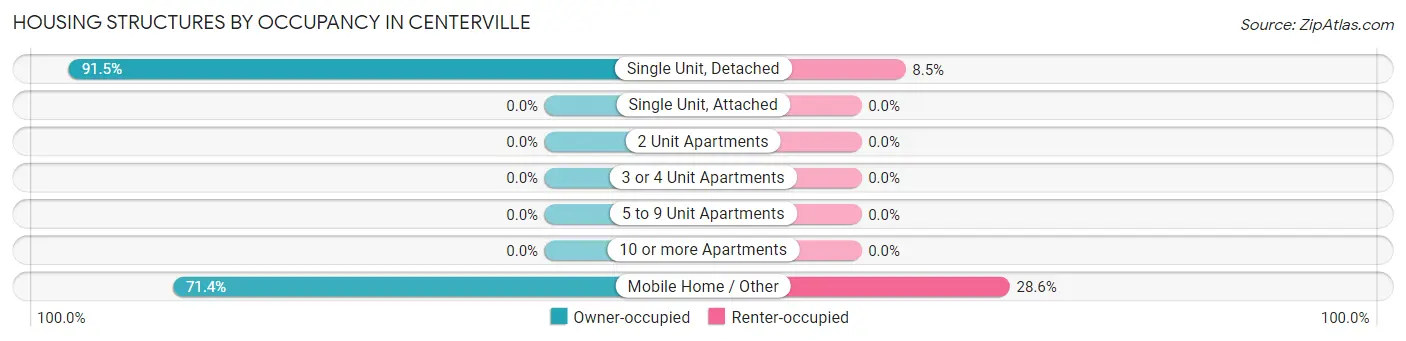
| Structure Type | Owner-occupied | Renter-occupied |
| Single Unit, Detached | 43 (91.5%) | 4 (8.5%) |
| Single Unit, Attached | 0 (0.0%) | 0 (0.0%) |
| 2 Unit Apartments | 0 (0.0%) | 0 (0.0%) |
| 3 or 4 Unit Apartments | 0 (0.0%) | 0 (0.0%) |
| 5 to 9 Unit Apartments | 0 (0.0%) | 0 (0.0%) |
| 10 or more Apartments | 0 (0.0%) | 0 (0.0%) |
| Mobile Home / Other | 5 (71.4%) | 2 (28.6%) |
| Total | 48 (88.9%) | 6 (11.1%) |
Housing Structures by Number of Rooms in Centerville
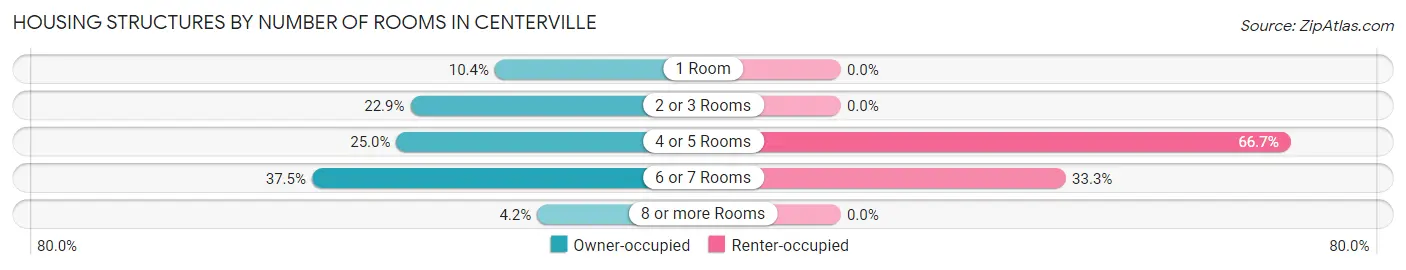
| Number of Rooms | Owner-occupied | Renter-occupied |
| 1 Room | 5 (10.4%) | 0 (0.0%) |
| 2 or 3 Rooms | 11 (22.9%) | 0 (0.0%) |
| 4 or 5 Rooms | 12 (25.0%) | 4 (66.7%) |
| 6 or 7 Rooms | 18 (37.5%) | 2 (33.3%) |
| 8 or more Rooms | 2 (4.2%) | 0 (0.0%) |
| Total | 48 (100.0%) | 6 (100.0%) |
Housing Structure by Heating Type in Centerville
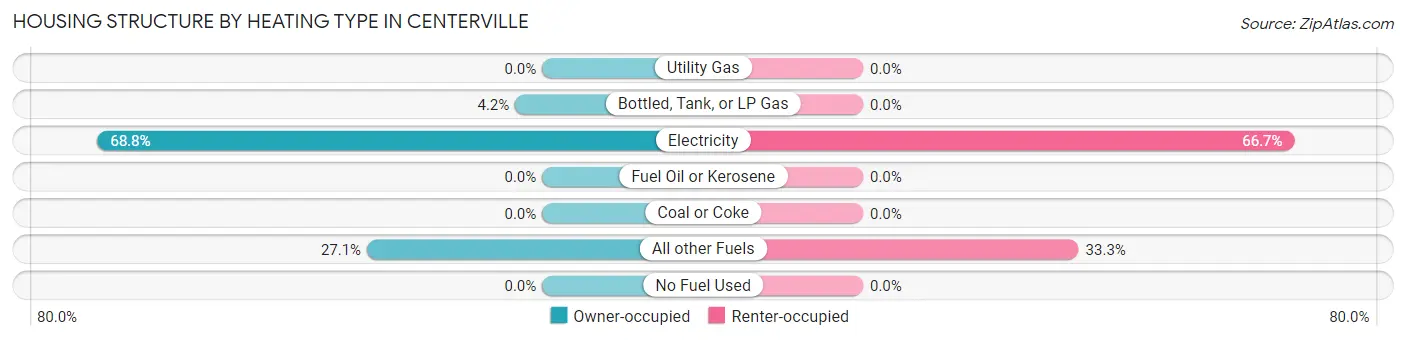
| Heating Type | Owner-occupied | Renter-occupied |
| Utility Gas | 0 (0.0%) | 0 (0.0%) |
| Bottled, Tank, or LP Gas | 2 (4.2%) | 0 (0.0%) |
| Electricity | 33 (68.8%) | 4 (66.7%) |
| Fuel Oil or Kerosene | 0 (0.0%) | 0 (0.0%) |
| Coal or Coke | 0 (0.0%) | 0 (0.0%) |
| All other Fuels | 13 (27.1%) | 2 (33.3%) |
| No Fuel Used | 0 (0.0%) | 0 (0.0%) |
| Total | 48 (100.0%) | 6 (100.0%) |
Household Vehicle Usage in Centerville
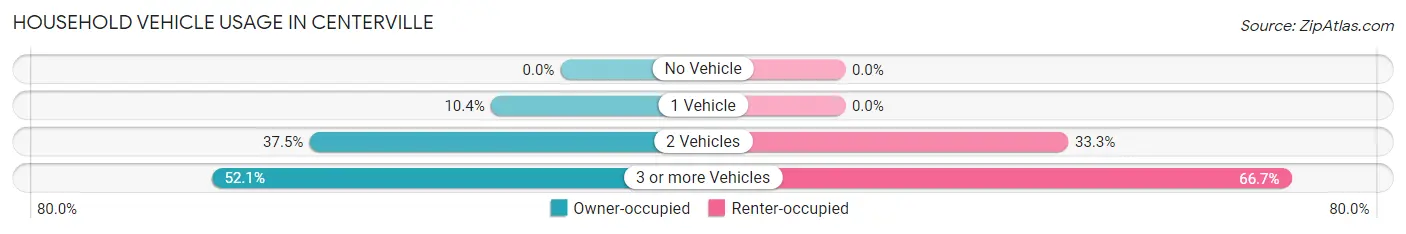
| Vehicles per Household | Owner-occupied | Renter-occupied |
| No Vehicle | 0 (0.0%) | 0 (0.0%) |
| 1 Vehicle | 5 (10.4%) | 0 (0.0%) |
| 2 Vehicles | 18 (37.5%) | 2 (33.3%) |
| 3 or more Vehicles | 25 (52.1%) | 4 (66.7%) |
| Total | 48 (100.0%) | 6 (100.0%) |
Real Estate & Mortgages in Centerville
Real Estate and Mortgage Overview in Centerville
| Characteristic | Without Mortgage | With Mortgage |
| Housing Units | 22 | 26 |
| Median Property Value | $190,000 | $384,600 |
| Median Household Income | $94,167 | $19 |
| Monthly Housing Costs | $400 | $0 |
| Real Estate Taxes | $1,500 | $0 |
Property Value by Mortgage Status in Centerville
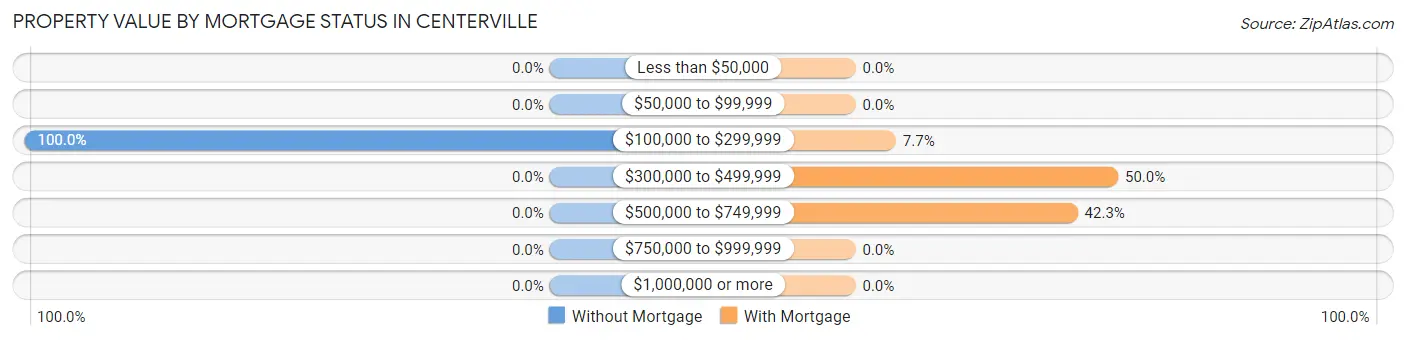
| Property Value | Without Mortgage | With Mortgage |
| Less than $50,000 | 0 (0.0%) | 0 (0.0%) |
| $50,000 to $99,999 | 0 (0.0%) | 0 (0.0%) |
| $100,000 to $299,999 | 22 (100.0%) | 2 (7.7%) |
| $300,000 to $499,999 | 0 (0.0%) | 13 (50.0%) |
| $500,000 to $749,999 | 0 (0.0%) | 11 (42.3%) |
| $750,000 to $999,999 | 0 (0.0%) | 0 (0.0%) |
| $1,000,000 or more | 0 (0.0%) | 0 (0.0%) |
| Total | 22 (100.0%) | 26 (100.0%) |
Household Income by Mortgage Status in Centerville
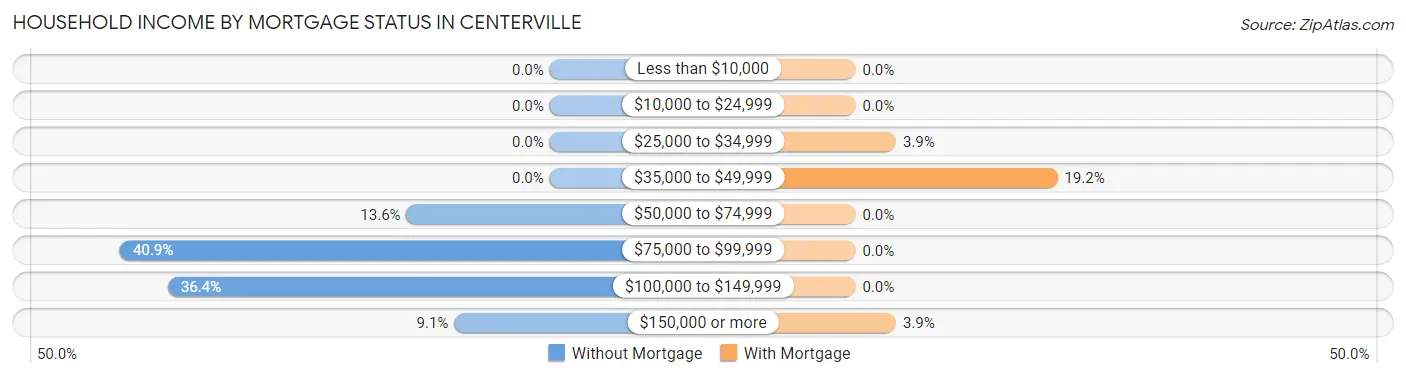
| Household Income | Without Mortgage | With Mortgage |
| Less than $10,000 | 0 (0.0%) | 0 (0.0%) |
| $10,000 to $24,999 | 0 (0.0%) | 0 (0.0%) |
| $25,000 to $34,999 | 0 (0.0%) | 1 (3.8%) |
| $35,000 to $49,999 | 0 (0.0%) | 5 (19.2%) |
| $50,000 to $74,999 | 3 (13.6%) | 0 (0.0%) |
| $75,000 to $99,999 | 9 (40.9%) | 0 (0.0%) |
| $100,000 to $149,999 | 8 (36.4%) | 0 (0.0%) |
| $150,000 or more | 2 (9.1%) | 1 (3.8%) |
| Total | 22 (100.0%) | 26 (100.0%) |
Property Value to Household Income Ratio in Centerville
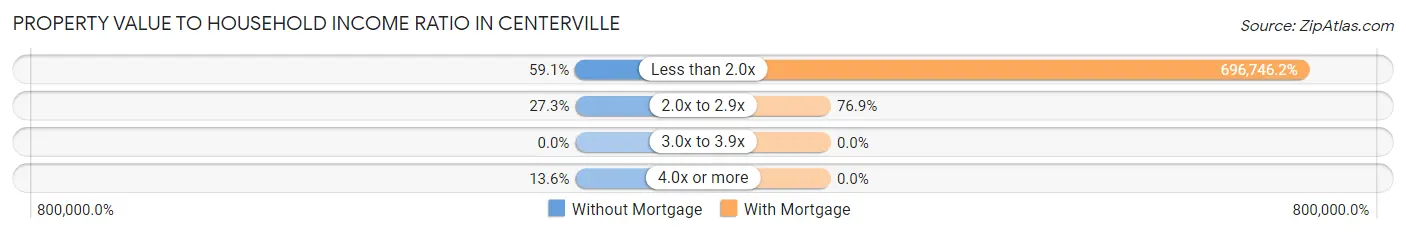
| Value-to-Income Ratio | Without Mortgage | With Mortgage |
| Less than 2.0x | 13 (59.1%) | 181,154 (696,746.2%) |
| 2.0x to 2.9x | 6 (27.3%) | 20 (76.9%) |
| 3.0x to 3.9x | 0 (0.0%) | 0 (0.0%) |
| 4.0x or more | 3 (13.6%) | 0 (0.0%) |
| Total | 22 (100.0%) | 26 (100.0%) |
Real Estate Taxes by Mortgage Status in Centerville
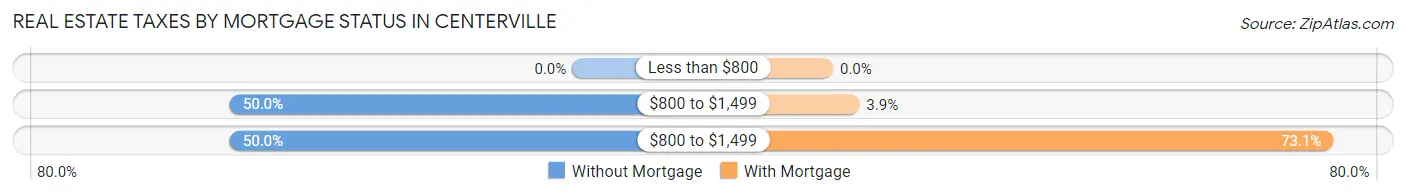
| Property Taxes | Without Mortgage | With Mortgage |
| Less than $800 | 0 (0.0%) | 0 (0.0%) |
| $800 to $1,499 | 11 (50.0%) | 1 (3.8%) |
| $800 to $1,499 | 11 (50.0%) | 19 (73.1%) |
| Total | 22 (100.0%) | 26 (100.0%) |
Health & Disability in Centerville
Health Insurance Coverage by Age in Centerville
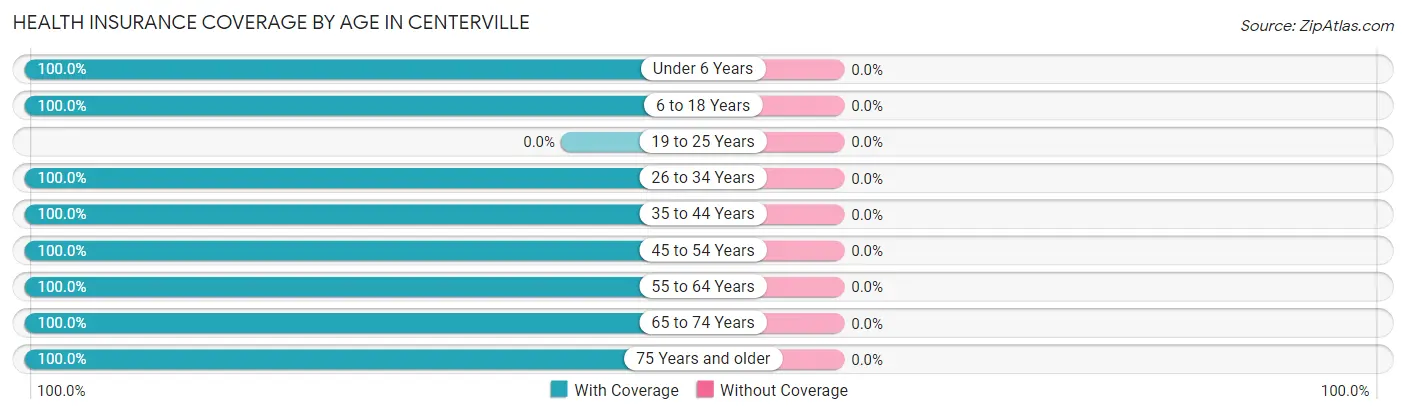
| Age Bracket | With Coverage | Without Coverage |
| Under 6 Years | 3 (100.0%) | 0 (0.0%) |
| 6 to 18 Years | 15 (100.0%) | 0 (0.0%) |
| 19 to 25 Years | 0 (0.0%) | 0 (0.0%) |
| 26 to 34 Years | 10 (100.0%) | 0 (0.0%) |
| 35 to 44 Years | 3 (100.0%) | 0 (0.0%) |
| 45 to 54 Years | 16 (100.0%) | 0 (0.0%) |
| 55 to 64 Years | 47 (100.0%) | 0 (0.0%) |
| 65 to 74 Years | 14 (100.0%) | 0 (0.0%) |
| 75 Years and older | 5 (100.0%) | 0 (0.0%) |
| Total | 113 (100.0%) | 0 (0.0%) |
Health Insurance Coverage by Citizenship Status in Centerville

| Citizenship Status | With Coverage | Without Coverage |
| Native Born | 3 (100.0%) | 0 (0.0%) |
| Foreign Born, Citizen | 15 (100.0%) | 0 (0.0%) |
| Foreign Born, not a Citizen | 0 (0.0%) | 0 (0.0%) |
Health Insurance Coverage by Household Income in Centerville
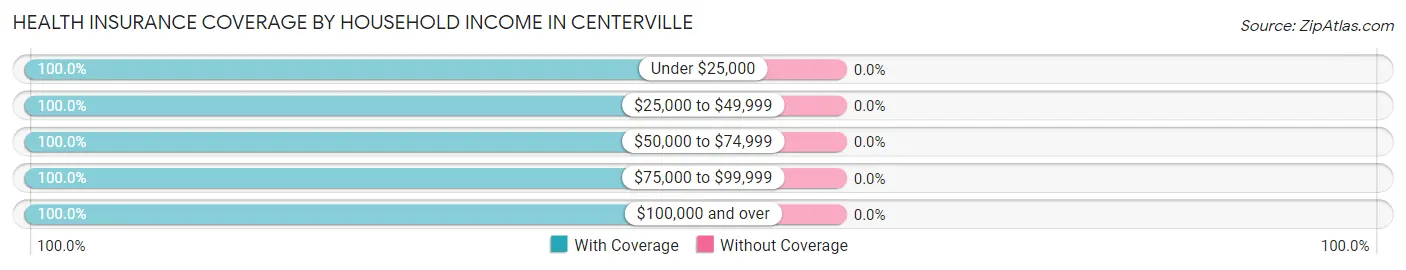
| Household Income | With Coverage | Without Coverage |
| Under $25,000 | 17 (100.0%) | 0 (0.0%) |
| $25,000 to $49,999 | 5 (100.0%) | 0 (0.0%) |
| $50,000 to $74,999 | 6 (100.0%) | 0 (0.0%) |
| $75,000 to $99,999 | 21 (100.0%) | 0 (0.0%) |
| $100,000 and over | 64 (100.0%) | 0 (0.0%) |
Public vs Private Health Insurance Coverage by Age in Centerville
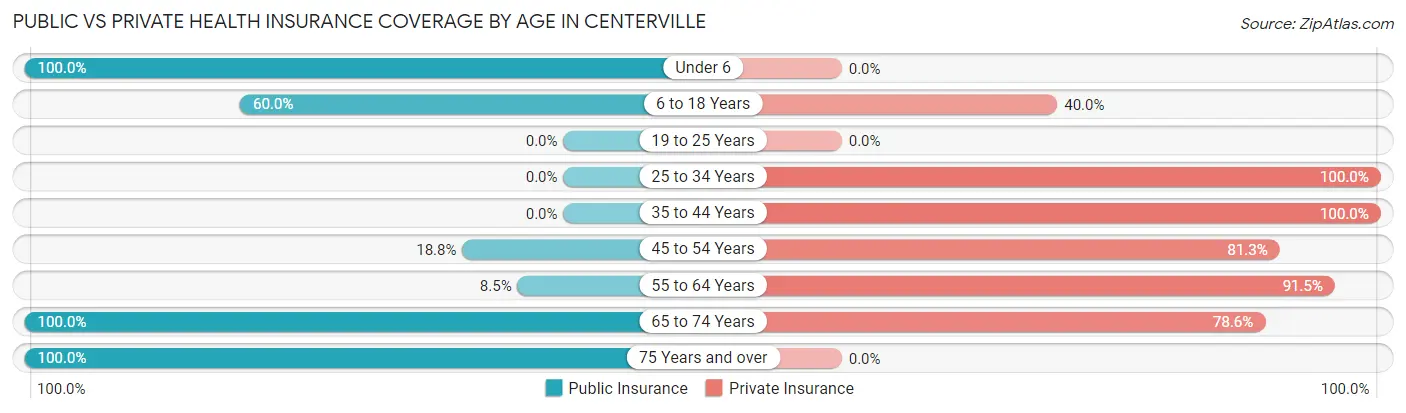
| Age Bracket | Public Insurance | Private Insurance |
| Under 6 | 3 (100.0%) | 0 (0.0%) |
| 6 to 18 Years | 9 (60.0%) | 6 (40.0%) |
| 19 to 25 Years | 0 (0.0%) | 0 (0.0%) |
| 25 to 34 Years | 0 (0.0%) | 10 (100.0%) |
| 35 to 44 Years | 0 (0.0%) | 3 (100.0%) |
| 45 to 54 Years | 3 (18.8%) | 13 (81.2%) |
| 55 to 64 Years | 4 (8.5%) | 43 (91.5%) |
| 65 to 74 Years | 14 (100.0%) | 11 (78.6%) |
| 75 Years and over | 5 (100.0%) | 0 (0.0%) |
| Total | 38 (33.6%) | 86 (76.1%) |
Disability Status by Sex by Age in Centerville
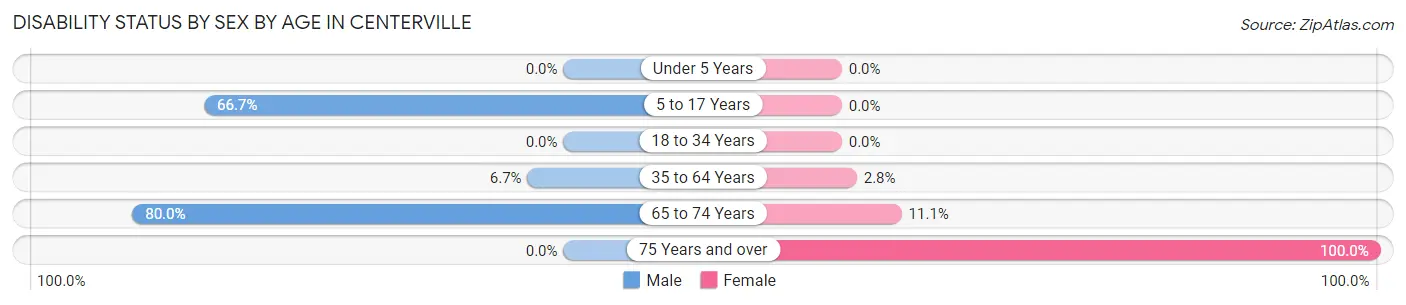
| Age Bracket | Male | Female |
| Under 5 Years | 0 (0.0%) | 0 (0.0%) |
| 5 to 17 Years | 6 (66.7%) | 0 (0.0%) |
| 18 to 34 Years | 0 (0.0%) | 0 (0.0%) |
| 35 to 64 Years | 2 (6.7%) | 1 (2.8%) |
| 65 to 74 Years | 4 (80.0%) | 1 (11.1%) |
| 75 Years and over | 0 (0.0%) | 5 (100.0%) |
Disability Class by Sex by Age in Centerville
Disability Class: Hearing Difficulty
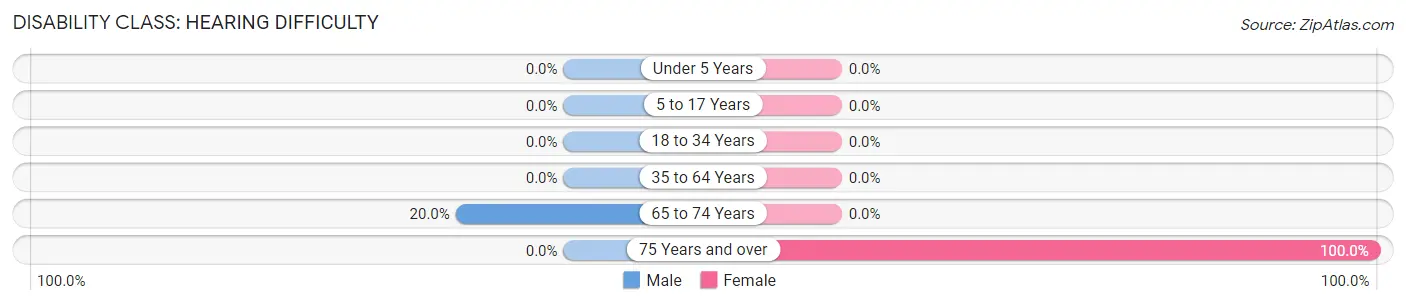
| Age Bracket | Male | Female |
| Under 5 Years | 0 (0.0%) | 0 (0.0%) |
| 5 to 17 Years | 0 (0.0%) | 0 (0.0%) |
| 18 to 34 Years | 0 (0.0%) | 0 (0.0%) |
| 35 to 64 Years | 0 (0.0%) | 0 (0.0%) |
| 65 to 74 Years | 1 (20.0%) | 0 (0.0%) |
| 75 Years and over | 0 (0.0%) | 5 (100.0%) |
Disability Class: Vision Difficulty
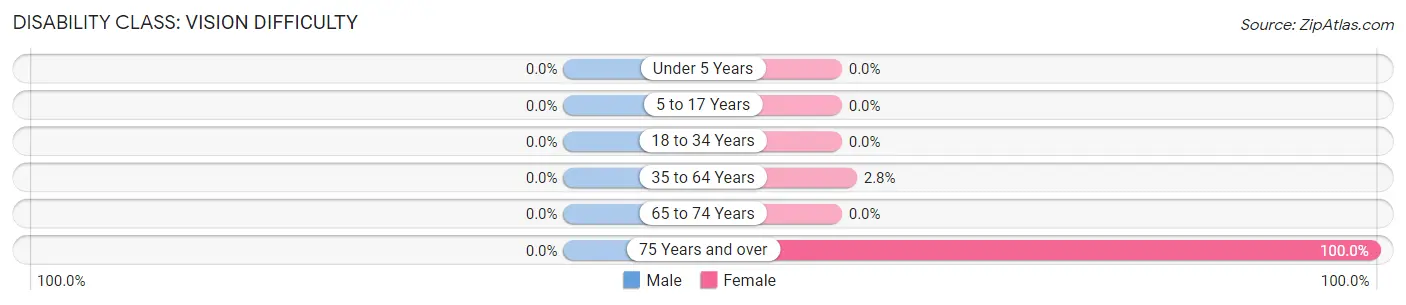
| Age Bracket | Male | Female |
| Under 5 Years | 0 (0.0%) | 0 (0.0%) |
| 5 to 17 Years | 0 (0.0%) | 0 (0.0%) |
| 18 to 34 Years | 0 (0.0%) | 0 (0.0%) |
| 35 to 64 Years | 0 (0.0%) | 1 (2.8%) |
| 65 to 74 Years | 0 (0.0%) | 0 (0.0%) |
| 75 Years and over | 0 (0.0%) | 5 (100.0%) |
Disability Class: Cognitive Difficulty
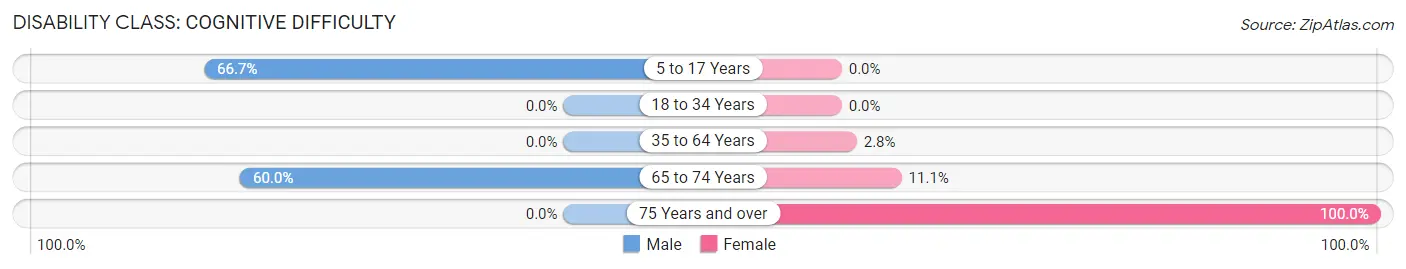
| Age Bracket | Male | Female |
| 5 to 17 Years | 6 (66.7%) | 0 (0.0%) |
| 18 to 34 Years | 0 (0.0%) | 0 (0.0%) |
| 35 to 64 Years | 0 (0.0%) | 1 (2.8%) |
| 65 to 74 Years | 3 (60.0%) | 1 (11.1%) |
| 75 Years and over | 0 (0.0%) | 5 (100.0%) |
Disability Class: Ambulatory Difficulty
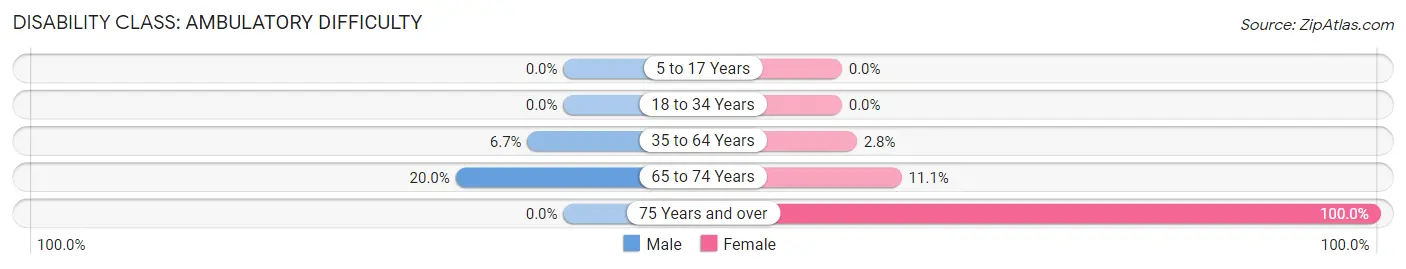
| Age Bracket | Male | Female |
| 5 to 17 Years | 0 (0.0%) | 0 (0.0%) |
| 18 to 34 Years | 0 (0.0%) | 0 (0.0%) |
| 35 to 64 Years | 2 (6.7%) | 1 (2.8%) |
| 65 to 74 Years | 1 (20.0%) | 1 (11.1%) |
| 75 Years and over | 0 (0.0%) | 5 (100.0%) |
Disability Class: Self-Care Difficulty
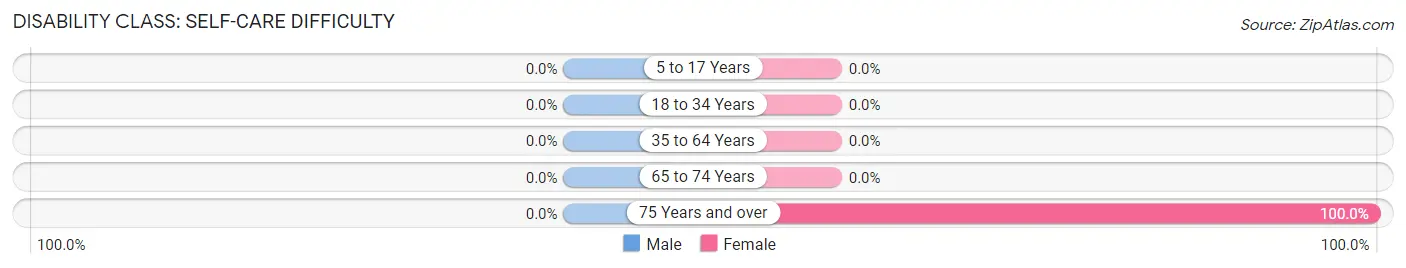
| Age Bracket | Male | Female |
| 5 to 17 Years | 0 (0.0%) | 0 (0.0%) |
| 18 to 34 Years | 0 (0.0%) | 0 (0.0%) |
| 35 to 64 Years | 0 (0.0%) | 0 (0.0%) |
| 65 to 74 Years | 0 (0.0%) | 0 (0.0%) |
| 75 Years and over | 0 (0.0%) | 5 (100.0%) |
Technology Access in Centerville
Computing Device Access in Centerville
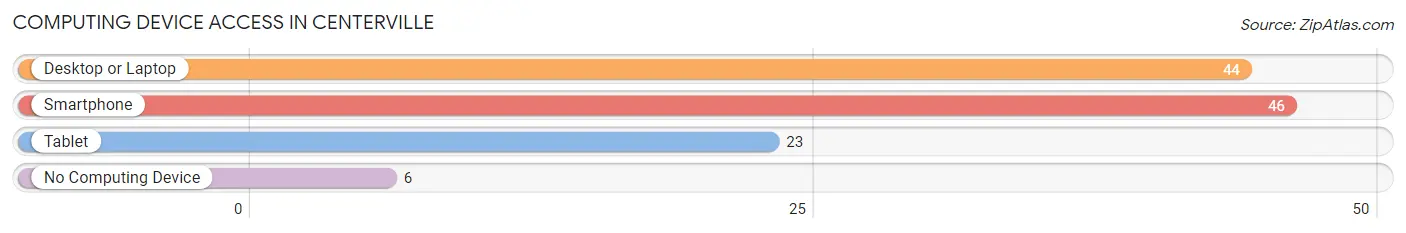
| Device Type | # Households | % Households |
| Desktop or Laptop | 44 | 81.5% |
| Smartphone | 46 | 85.2% |
| Tablet | 23 | 42.6% |
| No Computing Device | 6 | 11.1% |
| Total | 54 | 100.0% |
Internet Access in Centerville
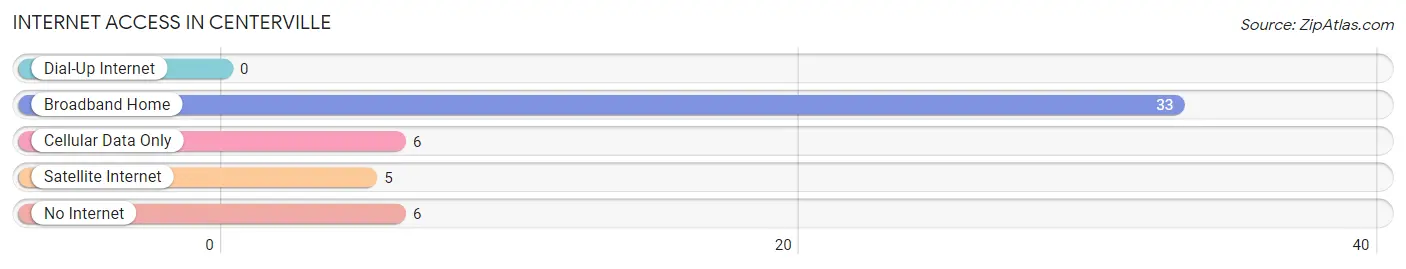
| Internet Type | # Households | % Households |
| Dial-Up Internet | 0 | 0.0% |
| Broadband Home | 33 | 61.1% |
| Cellular Data Only | 6 | 11.1% |
| Satellite Internet | 5 | 9.3% |
| No Internet | 6 | 11.1% |
| Total | 54 | 100.0% |
Centerville Summary
Centerville is a small town located in the state of Washington, United States. It is situated in the county of Spokane, and is part of the Spokane Metropolitan Statistical Area. The town has a population of approximately 1,000 people, and is located in the eastern part of the state, near the Idaho border.
History
Centerville was founded in 1883 by a group of settlers from the Midwest. The town was originally named “Centerville” because it was located at the center of the Spokane Valley. The town was incorporated in 1891, and the first mayor was elected in 1892.
The town grew slowly over the years, and by the early 1900s, it had become a popular destination for tourists. The town was known for its natural beauty, and it was a popular spot for fishing, hunting, and camping.
In the 1920s, the town began to experience a period of growth. The population increased from around 500 to over 1,000 people. This growth was due to the construction of a new railroad line, which connected Centerville to Spokane.
The town continued to grow throughout the 20th century, and by the year 2000, the population had reached 1,000 people.
Geography
Centerville is located in the eastern part of the state of Washington, near the Idaho border. The town is situated in the Spokane Valley, and is surrounded by rolling hills and forests. The town is located at an elevation of 1,890 feet above sea level.
The climate in Centerville is generally mild, with temperatures ranging from the low 30s in the winter to the high 80s in the summer. The town receives an average of 18 inches of precipitation per year.
Economy
The economy of Centerville is largely based on agriculture and tourism. The town is home to several farms, which produce a variety of crops, including wheat, barley, and hay. The town is also home to several wineries, which produce a variety of wines.
Tourism is also an important part of the economy. The town is home to several attractions, including the Centerville Historical Museum, the Centerville Art Gallery, and the Centerville Wildlife Refuge.
Demographics
As of the 2010 census, the population of Centerville was 1,000 people. The racial makeup of the town was 95.2% White, 0.7% African American, 0.7% Native American, 0.7% Asian, 0.3% from other races, and 2.1% from two or more races.
The median household income in Centerville was $41,250, and the median family income was $50,000. The per capita income was $20,000. The town had a poverty rate of 11.3%.
Conclusion
Centerville is a small town located in the state of Washington, United States. It is situated in the county of Spokane, and is part of the Spokane Metropolitan Statistical Area. The town has a population of approximately 1,000 people, and is located in the eastern part of the state, near the Idaho border. The economy of Centerville is largely based on agriculture and tourism, and the town is home to several attractions, including the Centerville Historical Museum, the Centerville Art Gallery, and the Centerville Wildlife Refuge. As of the 2010 census, the population of Centerville was 1,000 people, and the median household income was $41,250.
Common Questions
What is Per Capita Income in Centerville?
Per Capita income in Centerville is $56,666.
What is the Median Family Income in Centerville?
Median Family Income in Centerville is $157,500.
What is the Median Household income in Centerville?
Median Household Income in Centerville is $118,500.
What is Inequality or Gini Index in Centerville?
Inequality or Gini Index in Centerville is 0.35.
What is the Total Population of Centerville?
Total Population of Centerville is 113.
What is the Total Male Population of Centerville?
Total Male Population of Centerville is 49.
What is the Total Female Population of Centerville?
Total Female Population of Centerville is 64.
What is the Ratio of Males per 100 Females in Centerville?
There are 76.56 Males per 100 Females in Centerville.
What is the Ratio of Females per 100 Males in Centerville?
There are 130.61 Females per 100 Males in Centerville.
What is the Median Population Age in Centerville?
Median Population Age in Centerville is 59.1 Years.
What is the Average Family Size in Centerville
Average Family Size in Centerville is 2.3 People.
What is the Average Household Size in Centerville
Average Household Size in Centerville is 2.1 People.
How Large is the Labor Force in Centerville?
There are 83 People in the Labor Forcein in Centerville.
What is the Percentage of People in the Labor Force in Centerville?
75.5% of People are in the Labor Force in Centerville.
What is the Unemployment Rate in Centerville?
Unemployment Rate in Centerville is 19.3%.