Cities with the Highest Percentage of Population Taking Taxi / Cab to Work in Washington
RELATED REPORTS & OPTIONS
Taxi / Cab
Washington
Compare Cities
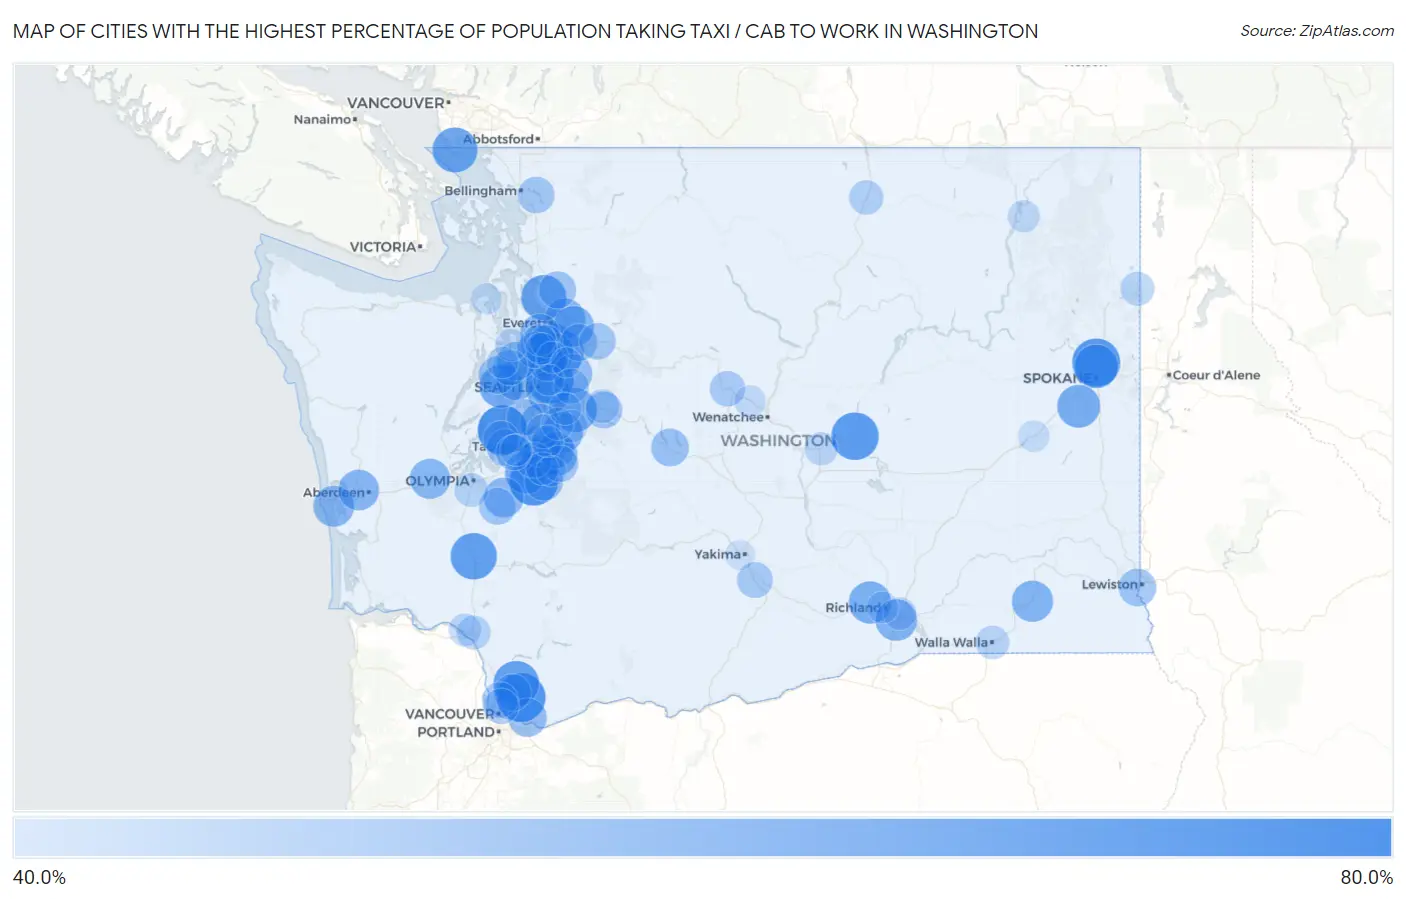
Map of Cities with the Highest Percentage of Population Taking Taxi / Cab to Work in Washington
0.0%
80.0%
Cities with the Highest Percentage of Population Taking Taxi / Cab to Work in Washington
| City | % Take Taxi / Cab | vs State | vs National | |
| 1. | Rosedale | 64.1% | 38.8%(+25.3)#1 | 38.2%(+25.9)#149 |
| 2. | Elk Plain | 63.1% | 38.8%(+24.3)#2 | 38.2%(+24.9)#189 |
| 3. | Hockinson | 63.0% | 38.8%(+24.2)#3 | 38.2%(+24.8)#195 |
| 4. | Country Homes | 62.3% | 38.8%(+23.5)#4 | 38.2%(+24.1)#222 |
| 5. | Ephrata | 61.6% | 38.8%(+22.8)#5 | 38.2%(+23.4)#260 |
| 6. | Yarrow Point | 61.3% | 38.8%(+22.5)#6 | 38.2%(+23.1)#281 |
| 7. | Napavine | 60.3% | 38.8%(+21.5)#7 | 38.2%(+22.1)#343 |
| 8. | Lewisville | 59.6% | 38.8%(+20.8)#8 | 38.2%(+21.4)#386 |
| 9. | Lake Goodwin | 58.8% | 38.8%(+20.0)#9 | 38.2%(+20.6)#456 |
| 10. | Point Roberts | 58.7% | 38.8%(+19.9)#10 | 38.2%(+20.5)#462 |
| 11. | Mirrormont | 57.4% | 38.8%(+18.6)#11 | 38.2%(+19.2)#590 |
| 12. | Brier | 57.2% | 38.8%(+18.4)#12 | 38.2%(+19.0)#610 |
| 13. | Town And Country | 57.2% | 38.8%(+18.4)#13 | 38.2%(+19.0)#611 |
| 14. | Tracyton | 56.9% | 38.8%(+18.1)#14 | 38.2%(+18.7)#632 |
| 15. | Maltby | 56.7% | 38.8%(+17.9)#15 | 38.2%(+18.5)#642 |
| 16. | Cheney | 56.4% | 38.8%(+17.6)#16 | 38.2%(+18.2)#676 |
| 17. | Puyallup | 56.3% | 38.8%(+17.5)#17 | 38.2%(+18.1)#689 |
| 18. | Spanaway | 55.9% | 38.8%(+17.1)#18 | 38.2%(+17.7)#735 |
| 19. | Mercer Island | 55.7% | 38.8%(+16.9)#19 | 38.2%(+17.5)#751 |
| 20. | West Richland | 55.7% | 38.8%(+16.9)#20 | 38.2%(+17.5)#752 |
| 21. | Bonney Lake | 55.1% | 38.8%(+16.3)#21 | 38.2%(+16.9)#837 |
| 22. | Kennewick | 54.8% | 38.8%(+16.0)#22 | 38.2%(+16.6)#870 |
| 23. | Dayton | 54.4% | 38.8%(+15.6)#23 | 38.2%(+16.2)#910 |
| 24. | Lake Morton Berrydale | 54.1% | 38.8%(+15.3)#24 | 38.2%(+15.9)#959 |
| 25. | Milton | 54.1% | 38.8%(+15.3)#25 | 38.2%(+15.9)#963 |
| 26. | Mill Creek | 54.0% | 38.8%(+15.2)#26 | 38.2%(+15.8)#970 |
| 27. | Westport | 53.8% | 38.8%(+15.0)#27 | 38.2%(+15.6)#993 |
| 28. | Hoquiam | 53.7% | 38.8%(+14.9)#28 | 38.2%(+15.5)#1,002 |
| 29. | Lake Stevens | 53.6% | 38.8%(+14.8)#29 | 38.2%(+15.4)#1,006 |
| 30. | Snohomish | 53.5% | 38.8%(+14.7)#30 | 38.2%(+15.3)#1,013 |
| 31. | Bainbridge Island | 53.2% | 38.8%(+14.4)#31 | 38.2%(+15.0)#1,048 |
| 32. | Bothell East | 53.2% | 38.8%(+14.4)#32 | 38.2%(+15.0)#1,050 |
| 33. | Mccleary | 53.1% | 38.8%(+14.3)#33 | 38.2%(+14.9)#1,067 |
| 34. | Des Moines | 52.8% | 38.8%(+14.0)#34 | 38.2%(+14.6)#1,091 |
| 35. | Yelm | 52.7% | 38.8%(+13.9)#35 | 38.2%(+14.5)#1,099 |
| 36. | Mukilteo | 52.5% | 38.8%(+13.7)#36 | 38.2%(+14.3)#1,118 |
| 37. | Kenmore | 52.4% | 38.8%(+13.6)#37 | 38.2%(+14.2)#1,131 |
| 38. | Union Hill Novelty Hill | 52.3% | 38.8%(+13.5)#38 | 38.2%(+14.1)#1,152 |
| 39. | Indianola | 51.6% | 38.8%(+12.8)#39 | 38.2%(+13.4)#1,248 |
| 40. | Graham | 51.4% | 38.8%(+12.6)#40 | 38.2%(+13.2)#1,277 |
| 41. | Camas | 51.4% | 38.8%(+12.6)#41 | 38.2%(+13.2)#1,280 |
| 42. | Silverdale | 50.3% | 38.8%(+11.5)#42 | 38.2%(+12.1)#1,433 |
| 43. | Easton | 50.2% | 38.8%(+11.4)#43 | 38.2%(+12.0)#1,463 |
| 44. | West Clarkston Highland | 50.1% | 38.8%(+11.3)#44 | 38.2%(+11.9)#1,471 |
| 45. | Arlington | 49.6% | 38.8%(+10.8)#45 | 38.2%(+11.4)#1,529 |
| 46. | Meadowdale | 49.5% | 38.8%(+10.7)#46 | 38.2%(+11.3)#1,552 |
| 47. | Monroe | 49.4% | 38.8%(+10.6)#47 | 38.2%(+11.2)#1,567 |
| 48. | Meadow Glade | 49.4% | 38.8%(+10.6)#48 | 38.2%(+11.2)#1,577 |
| 49. | Lake Tapps | 49.3% | 38.8%(+10.5)#49 | 38.2%(+11.1)#1,590 |
| 50. | Fox Island | 49.3% | 38.8%(+10.5)#50 | 38.2%(+11.1)#1,597 |
| 51. | Riverbend | 49.3% | 38.8%(+10.5)#51 | 38.2%(+11.1)#1,601 |
| 52. | Roche Harbor | 49.3% | 38.8%(+10.5)#52 | 38.2%(+11.1)#1,606 |
| 53. | Rainier | 49.2% | 38.8%(+10.4)#53 | 38.2%(+11.0)#1,618 |
| 54. | Vashon | 48.9% | 38.8%(+10.1)#54 | 38.2%(+10.7)#1,668 |
| 55. | Sultan | 48.9% | 38.8%(+10.1)#55 | 38.2%(+10.7)#1,672 |
| 56. | Prairie Ridge | 48.8% | 38.8%(+10.0)#56 | 38.2%(+10.6)#1,687 |
| 57. | Sudden Valley | 48.8% | 38.8%(+10.0)#57 | 38.2%(+10.6)#1,691 |
| 58. | Edmonds | 48.7% | 38.8%(+9.90)#58 | 38.2%(+10.5)#1,707 |
| 59. | Summit | 48.1% | 38.8%(+9.30)#59 | 38.2%(+9.90)#1,824 |
| 60. | Wapato | 48.1% | 38.8%(+9.30)#60 | 38.2%(+9.90)#1,829 |
| 61. | Salmon Creek | 48.0% | 38.8%(+9.20)#61 | 38.2%(+9.80)#1,839 |
| 62. | Artondale | 47.9% | 38.8%(+9.10)#62 | 38.2%(+9.70)#1,858 |
| 63. | Suquamish | 47.9% | 38.8%(+9.10)#63 | 38.2%(+9.70)#1,860 |
| 64. | University Place | 47.8% | 38.8%(+9.00)#64 | 38.2%(+9.60)#1,866 |
| 65. | Hazel Dell | 47.7% | 38.8%(+8.90)#65 | 38.2%(+9.50)#1,885 |
| 66. | Leavenworth | 47.6% | 38.8%(+8.80)#66 | 38.2%(+9.40)#1,906 |
| 67. | Sammamish | 47.2% | 38.8%(+8.40)#67 | 38.2%(+9.00)#1,977 |
| 68. | Tonasket | 46.4% | 38.8%(+7.60)#68 | 38.2%(+8.20)#2,129 |
| 69. | Lakeland North | 46.2% | 38.8%(+7.40)#69 | 38.2%(+8.00)#2,160 |
| 70. | Kelso | 45.9% | 38.8%(+7.10)#70 | 38.2%(+7.70)#2,179 |
| 71. | Tumwater | 45.8% | 38.8%(+7.00)#71 | 38.2%(+7.60)#2,191 |
| 72. | Newport | 45.7% | 38.8%(+6.90)#72 | 38.2%(+7.50)#2,213 |
| 73. | Walla Walla | 45.6% | 38.8%(+6.80)#73 | 38.2%(+7.40)#2,216 |
| 74. | North Bend | 45.6% | 38.8%(+6.80)#74 | 38.2%(+7.40)#2,224 |
| 75. | Fairwood Cdp King County | 45.4% | 38.8%(+6.60)#75 | 38.2%(+7.20)#2,268 |
| 76. | Quincy | 45.1% | 38.8%(+6.30)#76 | 38.2%(+6.90)#2,322 |
| 77. | Longview | 44.6% | 38.8%(+5.80)#77 | 38.2%(+6.40)#2,371 |
| 78. | Pasco | 44.5% | 38.8%(+5.70)#78 | 38.2%(+6.30)#2,384 |
| 79. | South Hill | 44.5% | 38.8%(+5.70)#79 | 38.2%(+6.30)#2,385 |
| 80. | Maple Valley | 44.5% | 38.8%(+5.70)#80 | 38.2%(+6.30)#2,391 |
| 81. | Kent | 44.3% | 38.8%(+5.50)#81 | 38.2%(+6.10)#2,433 |
| 82. | East Renton Highlands | 44.3% | 38.8%(+5.50)#82 | 38.2%(+6.10)#2,445 |
| 83. | Port Gamble Tribal Community | 44.3% | 38.8%(+5.50)#83 | 38.2%(+6.10)#2,454 |
| 84. | Lake Stickney | 44.0% | 38.8%(+5.20)#84 | 38.2%(+5.80)#2,502 |
| 85. | Kettle Falls | 44.0% | 38.8%(+5.20)#85 | 38.2%(+5.80)#2,514 |
| 86. | Picnic Point | 43.8% | 38.8%(+5.00)#86 | 38.2%(+5.60)#2,539 |
| 87. | Fircrest | 43.7% | 38.8%(+4.90)#87 | 38.2%(+5.50)#2,553 |
| 88. | Algona | 43.6% | 38.8%(+4.80)#88 | 38.2%(+5.40)#2,573 |
| 89. | Bothell | 43.5% | 38.8%(+4.70)#89 | 38.2%(+5.30)#2,583 |
| 90. | Richland | 43.4% | 38.8%(+4.60)#90 | 38.2%(+5.20)#2,609 |
| 91. | Cashmere | 43.4% | 38.8%(+4.60)#91 | 38.2%(+5.20)#2,624 |
| 92. | Lynnwood | 43.3% | 38.8%(+4.50)#92 | 38.2%(+5.10)#2,629 |
| 93. | Sprague | 43.3% | 38.8%(+4.50)#93 | 38.2%(+5.10)#2,645 |
| 94. | Poulsbo | 43.2% | 38.8%(+4.40)#94 | 38.2%(+5.00)#2,661 |
| 95. | Port Townsend | 42.8% | 38.8%(+4.00)#95 | 38.2%(+4.60)#2,720 |
| 96. | Tehaleh | 42.6% | 38.8%(+3.80)#96 | 38.2%(+4.40)#2,769 |
| 97. | Hunts Point | 42.5% | 38.8%(+3.70)#97 | 38.2%(+4.30)#2,803 |
| 98. | Orting | 41.9% | 38.8%(+3.10)#98 | 38.2%(+3.70)#2,904 |
| 99. | Yakima | 41.7% | 38.8%(+2.90)#99 | 38.2%(+3.50)#2,938 |
| 100. | Cottage Lake | 41.7% | 38.8%(+2.90)#100 | 38.2%(+3.50)#2,948 |
Common Questions
What are the Top 10 Cities with the Highest Percentage of Population Taking Taxi / Cab to Work in Washington?
Top 10 Cities with the Highest Percentage of Population Taking Taxi / Cab to Work in Washington are:
#1
64.1%
#2
63.1%
#3
63.0%
#4
62.3%
#5
61.6%
#6
61.3%
#7
60.3%
#8
59.6%
#9
58.8%
#10
58.7%
What city has the Highest Percentage of Population Taking Taxi / Cab to Work in Washington?
Rosedale has the Highest Percentage of Population Taking Taxi / Cab to Work in Washington with 64.1%.
What is the Percentage of Population Taking Taxi / Cab to Work in the State of Washington?
Percentage of Population Taking Taxi / Cab to Work in Washington is 38.8%.
What is the Percentage of Population Taking Taxi / Cab to Work in the United States?
Percentage of Population Taking Taxi / Cab to Work in the United States is 38.2%.