Cities with the Highest Percentage of Population Employed in Accommodation & Food Services in Washington
RELATED REPORTS & OPTIONS
Accommodation & Food Services
Washington
Compare Cities
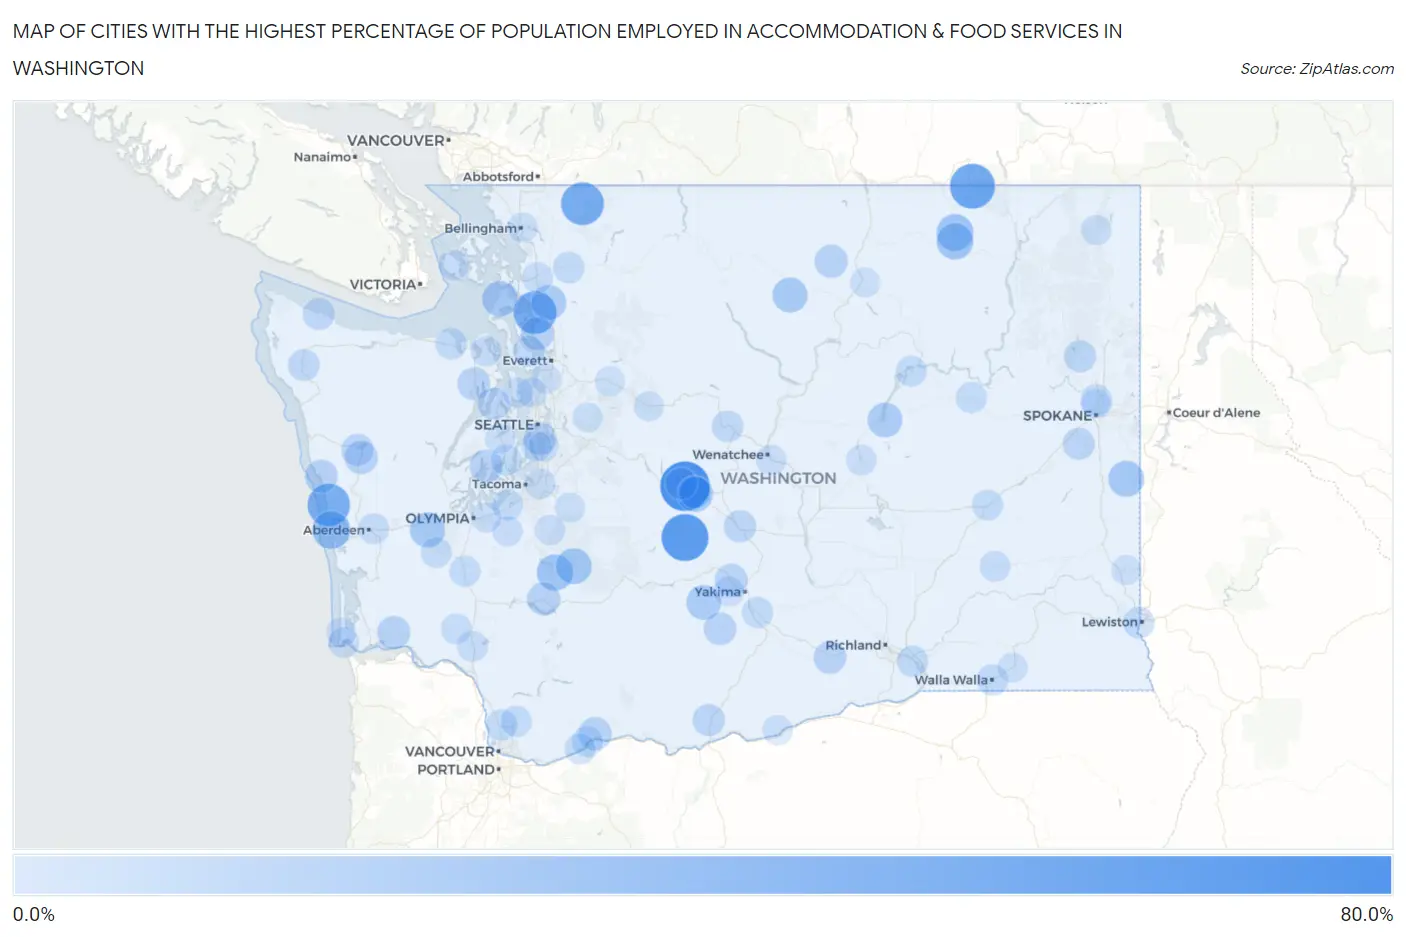
Map of Cities with the Highest Percentage of Population Employed in Accommodation & Food Services in Washington
0.0%
80.0%
Cities with the Highest Percentage of Population Employed in Accommodation & Food Services in Washington
| City | % Employed | vs State | vs National | |
| 1. | Ronald | 71.4% | 6.5%(+64.9)#1 | 6.9%(+64.5)#55 |
| 2. | Cliffdell | 62.9% | 6.5%(+56.4)#2 | 6.9%(+56.0)#77 |
| 3. | Danville | 56.5% | 6.5%(+50.1)#3 | 6.9%(+49.6)#111 |
| 4. | Northwest Stanwood | 50.0% | 6.5%(+43.5)#4 | 6.9%(+43.1)#161 |
| 5. | Glacier | 49.8% | 6.5%(+43.3)#5 | 6.9%(+42.9)#171 |
| 6. | Copalis Beach | 48.9% | 6.5%(+42.4)#6 | 6.9%(+42.0)#177 |
| 7. | Marine View | 39.5% | 6.5%(+33.1)#7 | 6.9%(+32.7)#273 |
| 8. | Ocean Shores | 33.8% | 6.5%(+27.3)#8 | 6.9%(+26.9)#373 |
| 9. | Bow | 31.4% | 6.5%(+24.9)#9 | 6.9%(+24.5)#438 |
| 10. | Curlew Lake | 30.8% | 6.5%(+24.3)#10 | 6.9%(+23.9)#458 |
| 11. | Torboy | 29.8% | 6.5%(+23.3)#11 | 6.9%(+22.9)#490 |
| 12. | Mineral | 29.1% | 6.5%(+22.6)#12 | 6.9%(+22.2)#509 |
| 13. | South Cle Elum | 28.3% | 6.5%(+21.9)#13 | 6.9%(+21.5)#548 |
| 14. | Ashford | 28.0% | 6.5%(+21.5)#14 | 6.9%(+21.1)#565 |
| 15. | Latah | 27.7% | 6.5%(+21.2)#15 | 6.9%(+20.8)#580 |
| 16. | Whidbey Island Station | 26.9% | 6.5%(+20.4)#16 | 6.9%(+20.0)#623 |
| 17. | Malone | 25.0% | 6.5%(+18.5)#17 | 6.9%(+18.1)#726 |
| 18. | Twisp | 24.9% | 6.5%(+18.5)#18 | 6.9%(+18.1)#745 |
| 19. | Lake Mcmurray | 24.4% | 6.5%(+18.0)#19 | 6.9%(+17.6)#778 |
| 20. | Tampico | 24.1% | 6.5%(+17.6)#20 | 6.9%(+17.2)#813 |
| 21. | Banks Lake South | 24.0% | 6.5%(+17.5)#21 | 6.9%(+17.1)#816 |
| 22. | Morton | 19.5% | 6.5%(+13.0)#22 | 6.9%(+12.6)#1,325 |
| 23. | Grays River | 19.4% | 6.5%(+13.0)#23 | 6.9%(+12.5)#1,337 |
| 24. | Neilton | 19.4% | 6.5%(+13.0)#24 | 6.9%(+12.5)#1,339 |
| 25. | Kayak Point | 19.4% | 6.5%(+12.9)#25 | 6.9%(+12.5)#1,343 |
| 26. | Conconully | 19.4% | 6.5%(+12.9)#26 | 6.9%(+12.5)#1,345 |
| 27. | Carson | 19.3% | 6.5%(+12.9)#27 | 6.9%(+12.5)#1,361 |
| 28. | Santiago | 18.8% | 6.5%(+12.3)#28 | 6.9%(+11.9)#1,465 |
| 29. | Vaughn | 18.7% | 6.5%(+12.2)#29 | 6.9%(+11.8)#1,470 |
| 30. | Boulevard Park | 18.3% | 6.5%(+11.9)#30 | 6.9%(+11.5)#1,544 |
| 31. | Quilcene | 18.0% | 6.5%(+11.5)#31 | 6.9%(+11.1)#1,630 |
| 32. | Prosser | 17.8% | 6.5%(+11.3)#32 | 6.9%(+10.9)#1,662 |
| 33. | White Swan | 17.8% | 6.5%(+11.3)#33 | 6.9%(+10.9)#1,666 |
| 34. | Eschbach | 17.7% | 6.5%(+11.2)#34 | 6.9%(+10.8)#1,682 |
| 35. | Amanda Park | 16.7% | 6.5%(+10.2)#35 | 6.9%(+9.79)#1,915 |
| 36. | Ellensburg | 16.7% | 6.5%(+10.2)#36 | 6.9%(+9.78)#1,919 |
| 37. | Bangor Base | 16.6% | 6.5%(+10.2)#37 | 6.9%(+9.75)#1,922 |
| 38. | Goldendale | 16.6% | 6.5%(+10.1)#38 | 6.9%(+9.67)#1,941 |
| 39. | Clayton | 16.0% | 6.5%(+9.54)#39 | 6.9%(+9.12)#2,101 |
| 40. | Cheney | 15.7% | 6.5%(+9.24)#40 | 6.9%(+8.82)#2,201 |
| 41. | Clallam Bay | 15.7% | 6.5%(+9.20)#41 | 6.9%(+8.78)#2,210 |
| 42. | Roslyn | 15.6% | 6.5%(+9.17)#42 | 6.9%(+8.75)#2,219 |
| 43. | Cle Elum | 15.6% | 6.5%(+9.17)#43 | 6.9%(+8.75)#2,220 |
| 44. | Forks | 15.0% | 6.5%(+8.55)#44 | 6.9%(+8.13)#2,438 |
| 45. | Leavenworth | 14.9% | 6.5%(+8.42)#45 | 6.9%(+8.00)#2,490 |
| 46. | Sequim | 14.6% | 6.5%(+8.11)#46 | 6.9%(+7.70)#2,609 |
| 47. | Clarkston | 14.5% | 6.5%(+8.08)#47 | 6.9%(+7.67)#2,619 |
| 48. | Langley | 14.5% | 6.5%(+8.06)#48 | 6.9%(+7.64)#2,630 |
| 49. | Country Homes | 14.2% | 6.5%(+7.78)#49 | 6.9%(+7.36)#2,761 |
| 50. | Lyman | 14.2% | 6.5%(+7.69)#50 | 6.9%(+7.27)#2,799 |
| 51. | Walla Walla | 13.9% | 6.5%(+7.48)#51 | 6.9%(+7.06)#2,870 |
| 52. | Finley | 13.8% | 6.5%(+7.33)#52 | 6.9%(+6.91)#2,950 |
| 53. | Roche Harbor | 13.7% | 6.5%(+7.22)#53 | 6.9%(+6.80)#3,004 |
| 54. | Centralia | 13.6% | 6.5%(+7.15)#54 | 6.9%(+6.73)#3,056 |
| 55. | Creston | 13.5% | 6.5%(+7.05)#55 | 6.9%(+6.63)#3,111 |
| 56. | Duluth | 13.4% | 6.5%(+6.96)#56 | 6.9%(+6.54)#3,149 |
| 57. | Donald | 13.4% | 6.5%(+6.94)#57 | 6.9%(+6.52)#3,161 |
| 58. | Lewisville | 13.3% | 6.5%(+6.83)#58 | 6.9%(+6.41)#3,216 |
| 59. | North Fort Lewis | 13.1% | 6.5%(+6.65)#59 | 6.9%(+6.24)#3,306 |
| 60. | Purdy | 13.1% | 6.5%(+6.60)#60 | 6.9%(+6.19)#3,334 |
| 61. | Stevenson | 13.1% | 6.5%(+6.59)#61 | 6.9%(+6.17)#3,340 |
| 62. | Electric City | 12.9% | 6.5%(+6.40)#62 | 6.9%(+5.98)#3,449 |
| 63. | North Bonneville | 12.7% | 6.5%(+6.25)#63 | 6.9%(+5.83)#3,535 |
| 64. | Ritzville | 12.6% | 6.5%(+6.17)#64 | 6.9%(+5.75)#3,593 |
| 65. | Castle Rock | 12.6% | 6.5%(+6.09)#65 | 6.9%(+5.68)#3,641 |
| 66. | Burlington | 12.4% | 6.5%(+5.94)#66 | 6.9%(+5.52)#3,742 |
| 67. | Oakville | 12.4% | 6.5%(+5.92)#67 | 6.9%(+5.51)#3,753 |
| 68. | Aberdeen | 12.3% | 6.5%(+5.79)#68 | 6.9%(+5.37)#3,847 |
| 69. | Ilwaco | 12.0% | 6.5%(+5.59)#69 | 6.9%(+5.17)#3,967 |
| 70. | Ryderwood | 11.9% | 6.5%(+5.40)#70 | 6.9%(+4.98)#4,111 |
| 71. | Milton | 11.9% | 6.5%(+5.40)#71 | 6.9%(+4.98)#4,115 |
| 72. | Burien | 11.6% | 6.5%(+5.18)#72 | 6.9%(+4.76)#4,269 |
| 73. | Port Hadlock Irondale | 11.6% | 6.5%(+5.17)#73 | 6.9%(+4.75)#4,273 |
| 74. | Washtucna | 11.6% | 6.5%(+5.17)#74 | 6.9%(+4.75)#4,280 |
| 75. | Soap Lake | 11.4% | 6.5%(+4.97)#75 | 6.9%(+4.55)#4,426 |
| 76. | Kingston | 11.4% | 6.5%(+4.92)#76 | 6.9%(+4.50)#4,453 |
| 77. | Friday Harbor | 11.4% | 6.5%(+4.91)#77 | 6.9%(+4.49)#4,456 |
| 78. | Beverly | 11.4% | 6.5%(+4.89)#78 | 6.9%(+4.47)#4,473 |
| 79. | Summitview | 11.3% | 6.5%(+4.81)#79 | 6.9%(+4.39)#4,548 |
| 80. | South Wenatchee | 11.3% | 6.5%(+4.81)#80 | 6.9%(+4.39)#4,553 |
| 81. | North Yelm | 11.1% | 6.5%(+4.68)#81 | 6.9%(+4.26)#4,661 |
| 82. | Ione | 11.0% | 6.5%(+4.55)#82 | 6.9%(+4.14)#4,766 |
| 83. | Tanglewilde | 11.0% | 6.5%(+4.53)#83 | 6.9%(+4.11)#4,786 |
| 84. | Kapowsin | 10.8% | 6.5%(+4.31)#84 | 6.9%(+3.89)#4,972 |
| 85. | Riverpoint | 10.7% | 6.5%(+4.27)#85 | 6.9%(+3.85)#5,018 |
| 86. | Lake Stickney | 10.5% | 6.5%(+4.06)#86 | 6.9%(+3.64)#5,204 |
| 87. | Tukwila | 10.5% | 6.5%(+4.03)#87 | 6.9%(+3.61)#5,226 |
| 88. | Dixie | 10.4% | 6.5%(+3.99)#88 | 6.9%(+3.57)#5,273 |
| 89. | Skykomish | 10.4% | 6.5%(+3.95)#89 | 6.9%(+3.54)#5,307 |
| 90. | Wilkeson | 10.4% | 6.5%(+3.93)#90 | 6.9%(+3.52)#5,321 |
| 91. | Roosevelt | 10.3% | 6.5%(+3.88)#91 | 6.9%(+3.46)#5,393 |
| 92. | Bellingham | 10.3% | 6.5%(+3.81)#92 | 6.9%(+3.39)#5,481 |
| 93. | Town And Country | 10.3% | 6.5%(+3.79)#93 | 6.9%(+3.38)#5,499 |
| 94. | Carnation | 10.2% | 6.5%(+3.79)#94 | 6.9%(+3.37)#5,513 |
| 95. | North Omak | 10.2% | 6.5%(+3.76)#95 | 6.9%(+3.34)#5,535 |
| 96. | Woodway | 10.2% | 6.5%(+3.72)#96 | 6.9%(+3.30)#5,590 |
| 97. | Pullman | 10.2% | 6.5%(+3.71)#97 | 6.9%(+3.29)#5,596 |
| 98. | Gold Bar | 10.1% | 6.5%(+3.66)#98 | 6.9%(+3.24)#5,653 |
| 99. | Long Beach | 10.1% | 6.5%(+3.64)#99 | 6.9%(+3.22)#5,680 |
| 100. | Port Orchard | 10.1% | 6.5%(+3.60)#100 | 6.9%(+3.18)#5,709 |
Common Questions
What are the Top 10 Cities with the Highest Percentage of Population Employed in Accommodation & Food Services in Washington?
Top 10 Cities with the Highest Percentage of Population Employed in Accommodation & Food Services in Washington are:
#1
71.4%
#2
62.9%
#3
56.5%
#4
50.0%
#5
49.8%
#6
48.9%
#7
33.8%
#8
30.8%
#9
29.8%
#10
29.1%
What city has the Highest Percentage of Population Employed in Accommodation & Food Services in Washington?
Ronald has the Highest Percentage of Population Employed in Accommodation & Food Services in Washington with 71.4%.
What is the Percentage of Population Employed in Accommodation & Food Services in the State of Washington?
Percentage of Population Employed in Accommodation & Food Services in Washington is 6.5%.
What is the Percentage of Population Employed in Accommodation & Food Services in the United States?
Percentage of Population Employed in Accommodation & Food Services in the United States is 6.9%.