Bingen, WA Map & Demographics
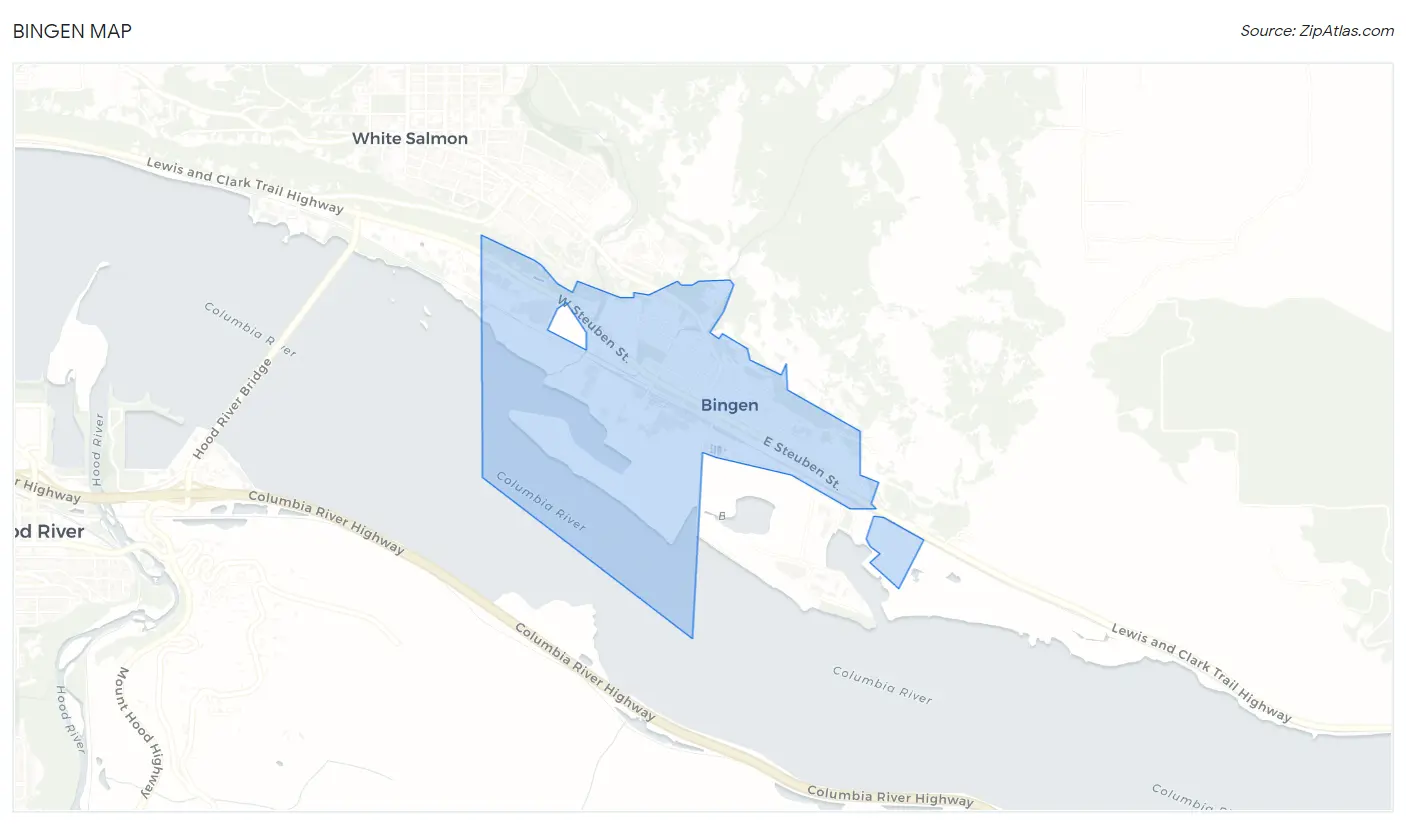
Bingen Map
Bingen Overview
$36,732
PER CAPITA INCOME
$83,698
AVG FAMILY INCOME
$79,803
AVG HOUSEHOLD INCOME
12.4%
WAGE / INCOME GAP [ % ]
87.6¢/ $1
WAGE / INCOME GAP [ $ ]
0.34
INEQUALITY / GINI INDEX
933
TOTAL POPULATION
461
MALE POPULATION
472
FEMALE POPULATION
97.67
MALES / 100 FEMALES
102.39
FEMALES / 100 MALES
37.6
MEDIAN AGE
3.6
AVG FAMILY SIZE
2.7
AVG HOUSEHOLD SIZE
518
LABOR FORCE [ PEOPLE ]
66.3%
PERCENT IN LABOR FORCE
4.4%
UNEMPLOYMENT RATE
Bingen Zip Codes
Bingen Area Codes
Income in Bingen
Income Overview in Bingen
Per Capita Income in Bingen is $36,732, while median incomes of families and households are $83,698 and $79,803 respectively.
| Characteristic | Number | Measure |
| Per Capita Income | 933 | $36,732 |
| Median Family Income | 189 | $83,698 |
| Mean Family Income | 189 | $105,231 |
| Median Household Income | 335 | $79,803 |
| Mean Household Income | 335 | $94,159 |
| Income Deficit | 189 | $0 |
| Wage / Income Gap (%) | 933 | 12.45% |
| Wage / Income Gap ($) | 933 | 87.55¢ per $1 |
| Gini / Inequality Index | 933 | 0.34 |
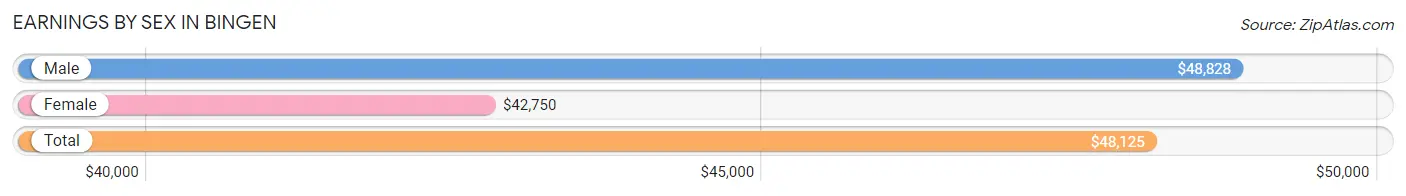
Earnings by Sex in Bingen
Average Earnings in Bingen are $48,125, $48,828 for men and $42,750 for women, a difference of 12.4%.
| Sex | Number | Average Earnings |
| Male | 270 (49.8%) | $48,828 |
| Female | 272 (50.2%) | $42,750 |
| Total | 542 (100.0%) | $48,125 |
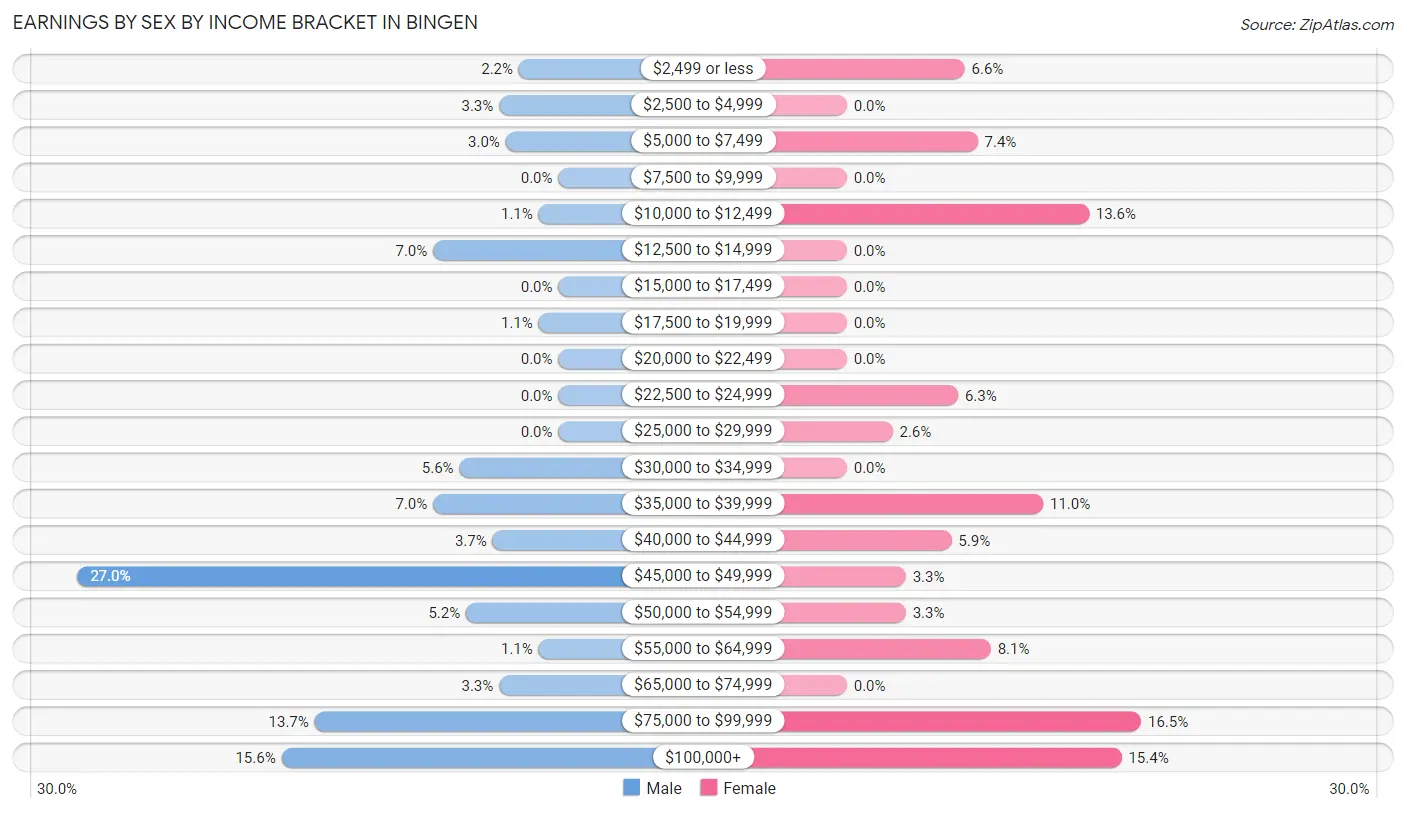
Earnings by Sex by Income Bracket in Bingen
The most common earnings brackets in Bingen are $45,000 to $49,999 for men (73 | 27.0%) and $75,000 to $99,999 for women (45 | 16.5%).
| Income | Male | Female |
| $2,499 or less | 6 (2.2%) | 18 (6.6%) |
| $2,500 to $4,999 | 9 (3.3%) | 0 (0.0%) |
| $5,000 to $7,499 | 8 (3.0%) | 20 (7.3%) |
| $7,500 to $9,999 | 0 (0.0%) | 0 (0.0%) |
| $10,000 to $12,499 | 3 (1.1%) | 37 (13.6%) |
| $12,500 to $14,999 | 19 (7.0%) | 0 (0.0%) |
| $15,000 to $17,499 | 0 (0.0%) | 0 (0.0%) |
| $17,500 to $19,999 | 3 (1.1%) | 0 (0.0%) |
| $20,000 to $22,499 | 0 (0.0%) | 0 (0.0%) |
| $22,500 to $24,999 | 0 (0.0%) | 17 (6.2%) |
| $25,000 to $29,999 | 0 (0.0%) | 7 (2.6%) |
| $30,000 to $34,999 | 15 (5.6%) | 0 (0.0%) |
| $35,000 to $39,999 | 19 (7.0%) | 30 (11.0%) |
| $40,000 to $44,999 | 10 (3.7%) | 16 (5.9%) |
| $45,000 to $49,999 | 73 (27.0%) | 9 (3.3%) |
| $50,000 to $54,999 | 14 (5.2%) | 9 (3.3%) |
| $55,000 to $64,999 | 3 (1.1%) | 22 (8.1%) |
| $65,000 to $74,999 | 9 (3.3%) | 0 (0.0%) |
| $75,000 to $99,999 | 37 (13.7%) | 45 (16.5%) |
| $100,000+ | 42 (15.6%) | 42 (15.4%) |
| Total | 270 (100.0%) | 272 (100.0%) |
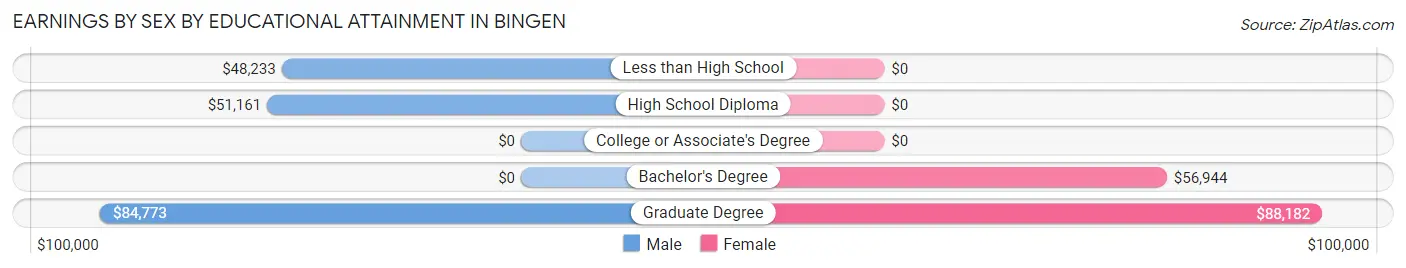
Earnings by Sex by Educational Attainment in Bingen
Average earnings in Bingen are $49,824 for men and $55,966 for women, a difference of 11.0%. Men with an educational attainment of graduate degree enjoy the highest average annual earnings of $84,773, while those with less than high school education earn the least with $48,233. Women with an educational attainment of graduate degree earn the most with the average annual earnings of $88,182, while those with bachelor's degree education have the smallest earnings of $56,944.
| Educational Attainment | Male Income | Female Income |
| Less than High School | $48,233 | $0 |
| High School Diploma | $51,161 | $0 |
| College or Associate's Degree | - | - |
| Bachelor's Degree | - | - |
| Graduate Degree | $84,773 | $88,182 |
| Total | $49,824 | $55,966 |
Family Income in Bingen
Family Income Brackets in Bingen
According to the Bingen family income data, there are 43 families falling into the $100,000 to $149,999 income range, which is the most common income bracket and makes up 22.8% of all families.
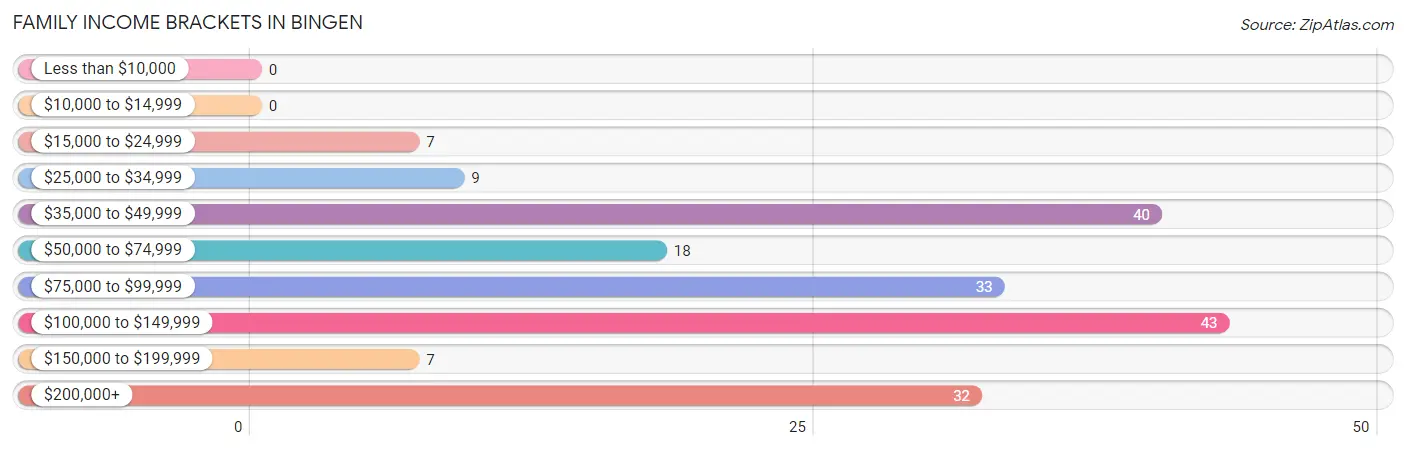
| Income Bracket | # Families | % Families |
| Less than $10,000 | 0 | 0.0% |
| $10,000 to $14,999 | 0 | 0.0% |
| $15,000 to $24,999 | 7 | 3.7% |
| $25,000 to $34,999 | 9 | 4.8% |
| $35,000 to $49,999 | 40 | 21.2% |
| $50,000 to $74,999 | 18 | 9.5% |
| $75,000 to $99,999 | 33 | 17.5% |
| $100,000 to $149,999 | 43 | 22.8% |
| $150,000 to $199,999 | 7 | 3.7% |
| $200,000+ | 32 | 16.9% |
Family Income by Famaliy Size in Bingen
3-person families (36 | 19.1%) account for the highest median family income in Bingen with $83,462 per family, while 3-person families (36 | 19.1%) have the highest median income of $27,821 per family member.
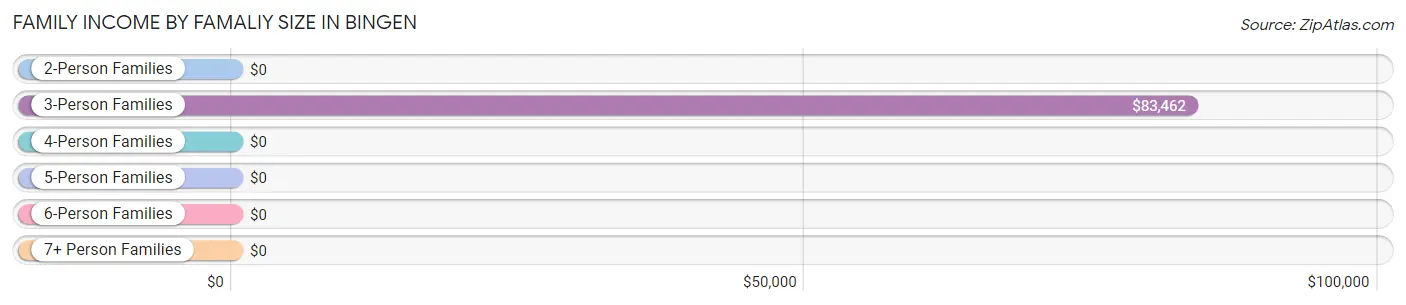
| Income Bracket | # Families | Median Income |
| 2-Person Families | 101 (53.4%) | $0 |
| 3-Person Families | 36 (19.1%) | $83,462 |
| 4-Person Families | 13 (6.9%) | $0 |
| 5-Person Families | 11 (5.8%) | $0 |
| 6-Person Families | 12 (6.4%) | $0 |
| 7+ Person Families | 16 (8.5%) | $0 |
| Total | 189 (100.0%) | $83,698 |
Family Income by Number of Earners in Bingen
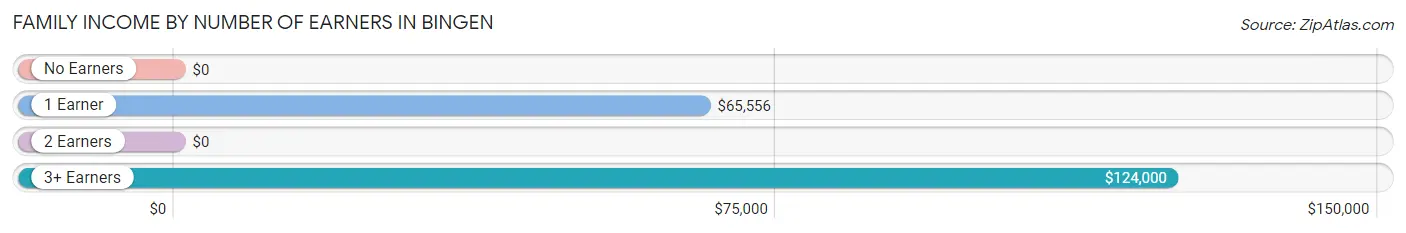
| Number of Earners | # Families | Median Income |
| No Earners | 18 (9.5%) | $0 |
| 1 Earner | 74 (39.2%) | $65,556 |
| 2 Earners | 67 (35.4%) | $0 |
| 3+ Earners | 30 (15.9%) | $124,000 |
| Total | 189 (100.0%) | $83,698 |
Household Income in Bingen
Household Income Brackets in Bingen
With 71 households falling in the category, the $100,000 to $149,999 income range is the most frequent in Bingen, accounting for 21.2% of all households.
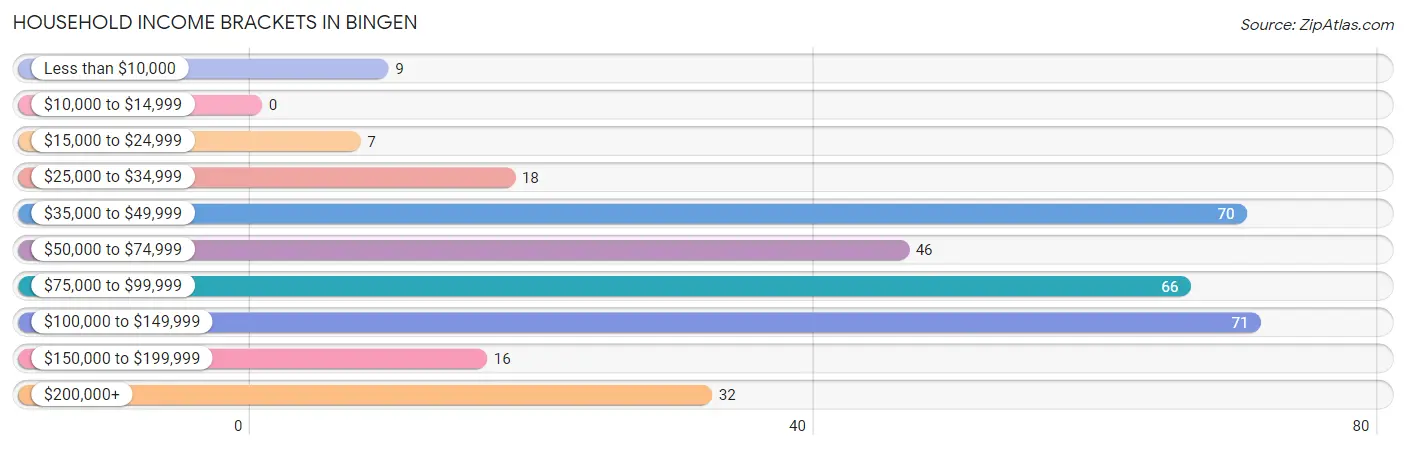
| Income Bracket | # Households | % Households |
| Less than $10,000 | 9 | 2.7% |
| $10,000 to $14,999 | 0 | 0.0% |
| $15,000 to $24,999 | 7 | 2.1% |
| $25,000 to $34,999 | 18 | 5.4% |
| $35,000 to $49,999 | 70 | 20.9% |
| $50,000 to $74,999 | 46 | 13.7% |
| $75,000 to $99,999 | 66 | 19.7% |
| $100,000 to $149,999 | 71 | 21.2% |
| $150,000 to $199,999 | 16 | 4.8% |
| $200,000+ | 32 | 9.6% |
Household Income by Householder Age in Bingen
The median household income in Bingen is $79,803, with the highest median household income of $97,222 found in the 25 to 44 years age bracket for the primary householder. A total of 124 households (37.0%) fall into this category. Meanwhile, the 15 to 24 years age bracket for the primary householder has the lowest median household income of $0, with 6 households (1.8%) in this group.
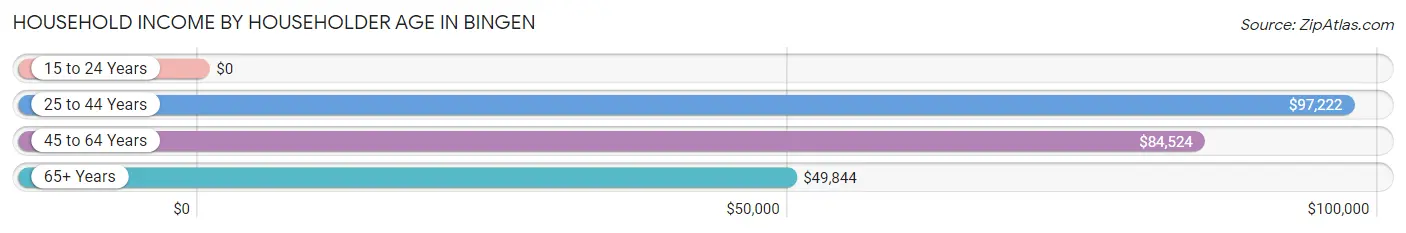
| Income Bracket | # Households | Median Income |
| 15 to 24 Years | 6 (1.8%) | $0 |
| 25 to 44 Years | 124 (37.0%) | $97,222 |
| 45 to 64 Years | 124 (37.0%) | $84,524 |
| 65+ Years | 81 (24.2%) | $49,844 |
| Total | 335 (100.0%) | $79,803 |
Poverty in Bingen
Income Below Poverty by Sex and Age in Bingen
With 4.1% poverty level for males and 3.4% for females among the residents of Bingen, 18 to 24 year old males and 35 to 44 year old females are the most vulnerable to poverty, with 19 males (33.3%) and 9 females (15.0%) in their respective age groups living below the poverty level.
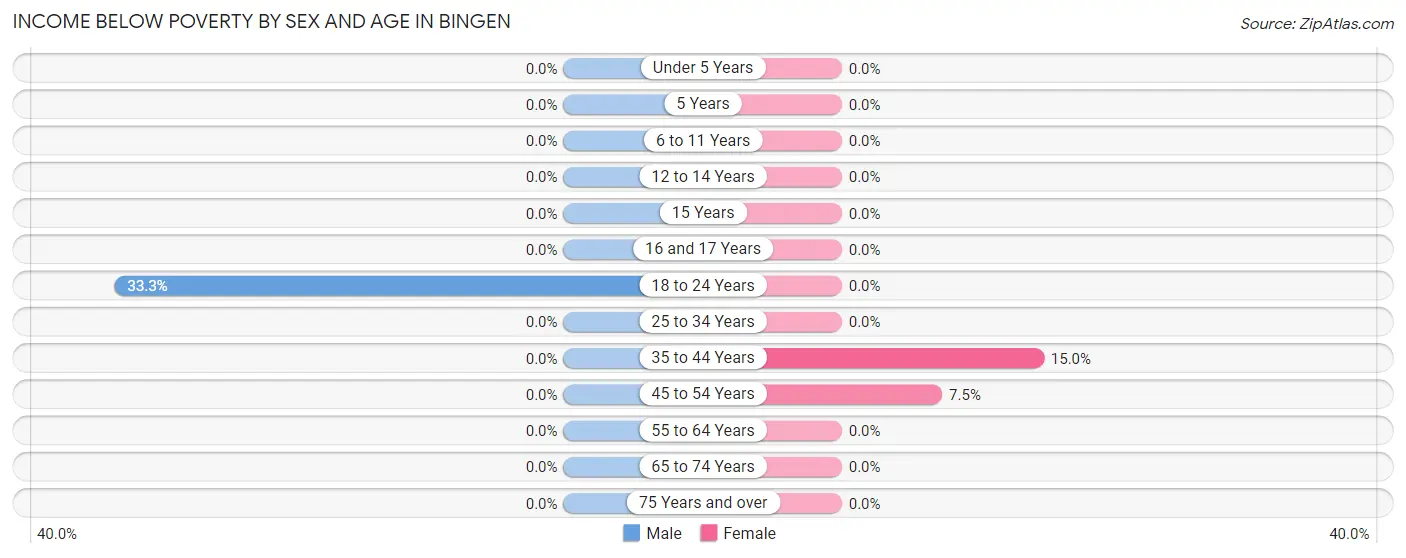
| Age Bracket | Male | Female |
| Under 5 Years | 0 (0.0%) | 0 (0.0%) |
| 5 Years | 0 (0.0%) | 0 (0.0%) |
| 6 to 11 Years | 0 (0.0%) | 0 (0.0%) |
| 12 to 14 Years | 0 (0.0%) | 0 (0.0%) |
| 15 Years | 0 (0.0%) | 0 (0.0%) |
| 16 and 17 Years | 0 (0.0%) | 0 (0.0%) |
| 18 to 24 Years | 19 (33.3%) | 0 (0.0%) |
| 25 to 34 Years | 0 (0.0%) | 0 (0.0%) |
| 35 to 44 Years | 0 (0.0%) | 9 (15.0%) |
| 45 to 54 Years | 0 (0.0%) | 7 (7.4%) |
| 55 to 64 Years | 0 (0.0%) | 0 (0.0%) |
| 65 to 74 Years | 0 (0.0%) | 0 (0.0%) |
| 75 Years and over | 0 (0.0%) | 0 (0.0%) |
| Total | 19 (4.1%) | 16 (3.4%) |
Income Above Poverty by Sex and Age in Bingen
According to the poverty statistics in Bingen, males aged under 5 years and females aged under 5 years are the age groups that are most secure financially, with 100.0% of males and 100.0% of females in these age groups living above the poverty line.
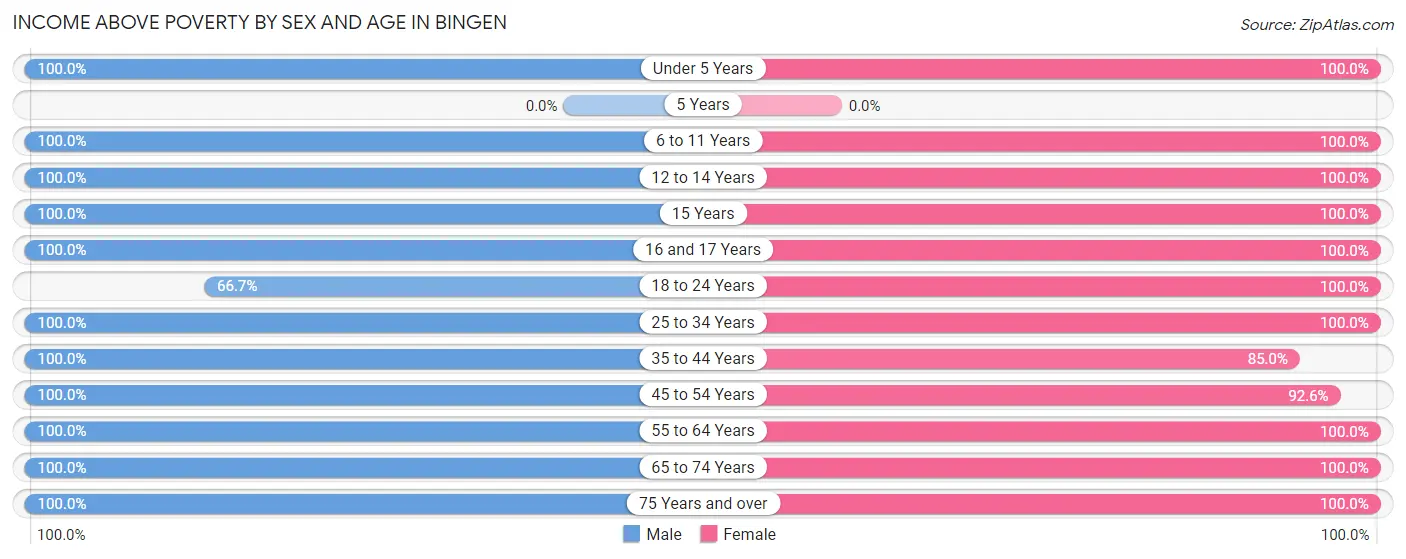
| Age Bracket | Male | Female |
| Under 5 Years | 52 (100.0%) | 15 (100.0%) |
| 5 Years | 0 (0.0%) | 0 (0.0%) |
| 6 to 11 Years | 18 (100.0%) | 22 (100.0%) |
| 12 to 14 Years | 6 (100.0%) | 13 (100.0%) |
| 15 Years | 21 (100.0%) | 5 (100.0%) |
| 16 and 17 Years | 15 (100.0%) | 7 (100.0%) |
| 18 to 24 Years | 38 (66.7%) | 71 (100.0%) |
| 25 to 34 Years | 34 (100.0%) | 66 (100.0%) |
| 35 to 44 Years | 98 (100.0%) | 51 (85.0%) |
| 45 to 54 Years | 65 (100.0%) | 87 (92.5%) |
| 55 to 64 Years | 60 (100.0%) | 47 (100.0%) |
| 65 to 74 Years | 18 (100.0%) | 46 (100.0%) |
| 75 Years and over | 17 (100.0%) | 26 (100.0%) |
| Total | 442 (95.9%) | 456 (96.6%) |
Income Below Poverty Among Married-Couple Families in Bingen
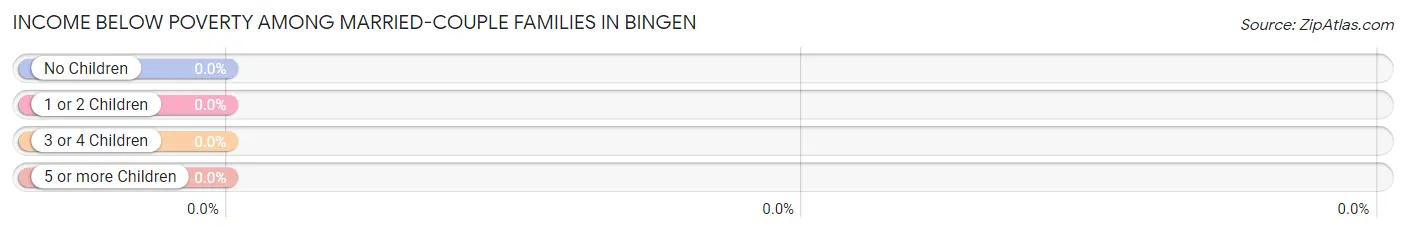
| Children | Above Poverty | Below Poverty |
| No Children | 98 (100.0%) | 0 (0.0%) |
| 1 or 2 Children | 7 (100.0%) | 0 (0.0%) |
| 3 or 4 Children | 21 (100.0%) | 0 (0.0%) |
| 5 or more Children | 0 (0.0%) | 0 (0.0%) |
| Total | 126 (100.0%) | 0 (0.0%) |
Income Below Poverty Among Single-Parent Households in Bingen
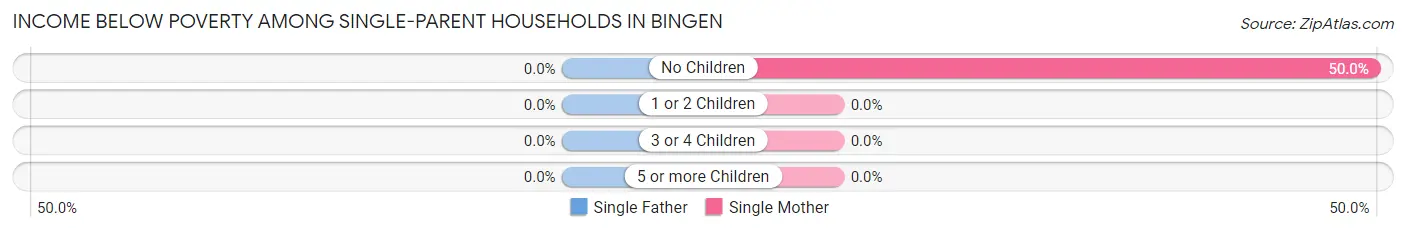
| Children | Single Father | Single Mother |
| No Children | 0 (0.0%) | 7 (50.0%) |
| 1 or 2 Children | 0 (0.0%) | 0 (0.0%) |
| 3 or 4 Children | 0 (0.0%) | 0 (0.0%) |
| 5 or more Children | 0 (0.0%) | 0 (0.0%) |
| Total | 0 (0.0%) | 7 (11.1%) |
Income Below Poverty Among Married-Couple vs Single-Parent Households in Bingen
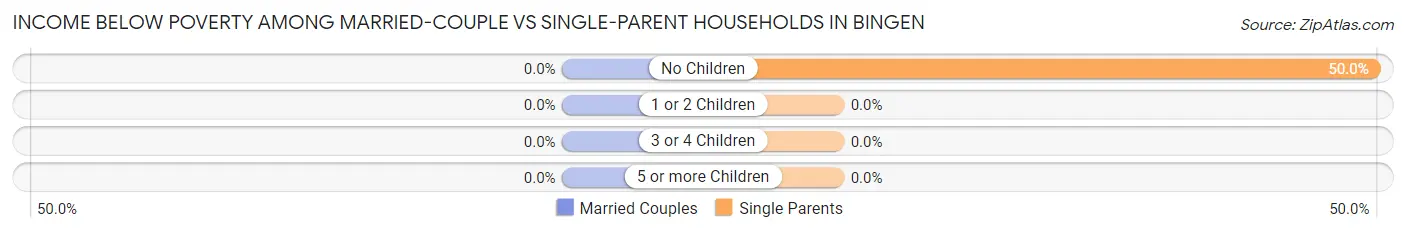
| Children | Married-Couple Families | Single-Parent Households |
| No Children | 0 (0.0%) | 7 (50.0%) |
| 1 or 2 Children | 0 (0.0%) | 0 (0.0%) |
| 3 or 4 Children | 0 (0.0%) | 0 (0.0%) |
| 5 or more Children | 0 (0.0%) | 0 (0.0%) |
| Total | 0 (0.0%) | 7 (11.1%) |
Race in Bingen
The most populous races in Bingen are White / Caucasian (758 | 81.2%), Hispanic or Latino (344 | 36.9%), and Two or more Races (102 | 10.9%).
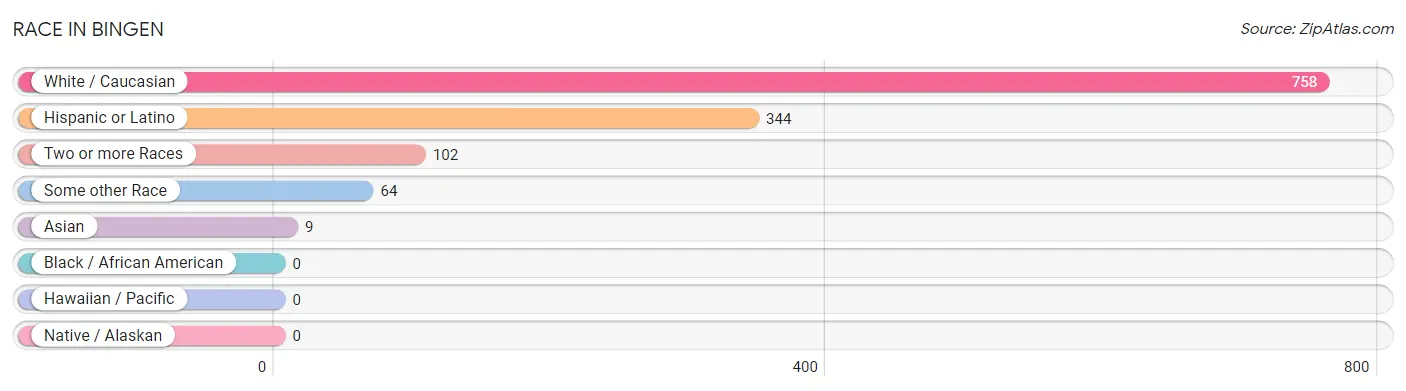
| Race | # Population | % Population |
| Asian | 9 | 1.0% |
| Black / African American | 0 | 0.0% |
| Hawaiian / Pacific | 0 | 0.0% |
| Hispanic or Latino | 344 | 36.9% |
| Native / Alaskan | 0 | 0.0% |
| White / Caucasian | 758 | 81.2% |
| Two or more Races | 102 | 10.9% |
| Some other Race | 64 | 6.9% |
| Total | 933 | 100.0% |
Ancestry in Bingen
The most populous ancestries reported in Bingen are Mexican (344 | 36.9%), German (222 | 23.8%), Irish (103 | 11.0%), Norwegian (77 | 8.3%), and Scottish (59 | 6.3%), together accounting for 86.3% of all Bingen residents.
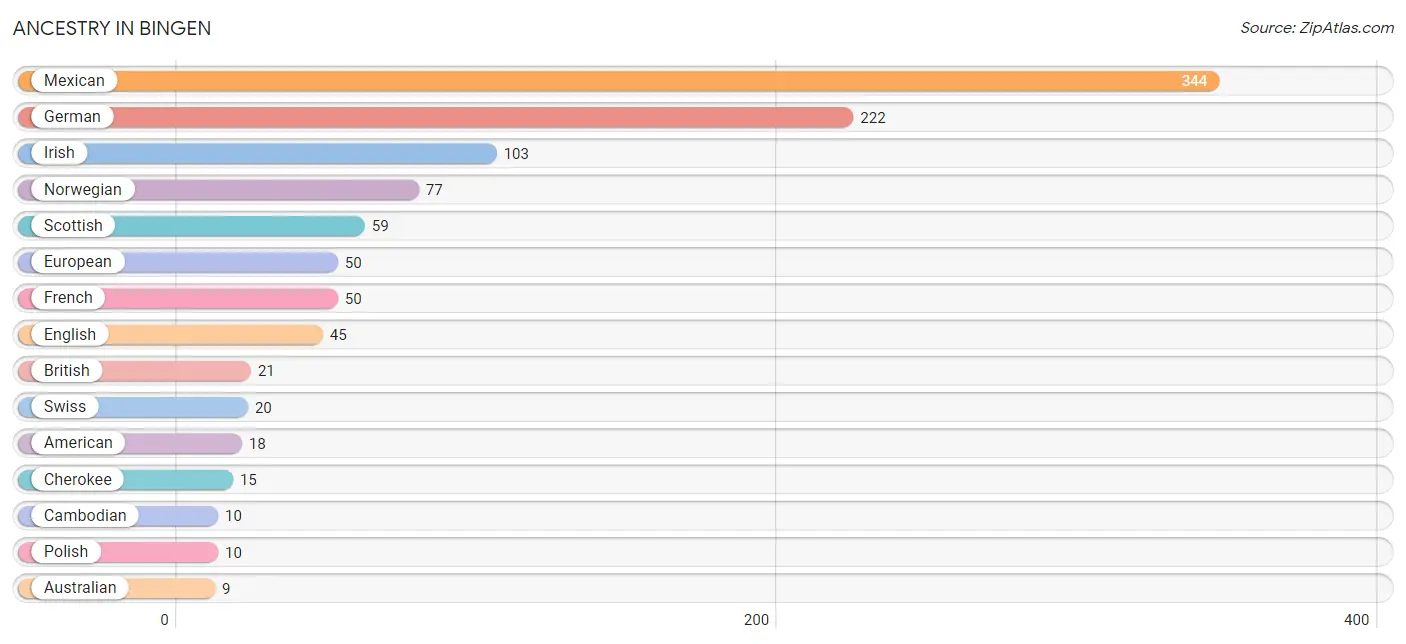
| Ancestry | # Population | % Population |
| American | 18 | 1.9% |
| Australian | 9 | 1.0% |
| British | 21 | 2.2% |
| Cambodian | 10 | 1.1% |
| Cherokee | 15 | 1.6% |
| English | 45 | 4.8% |
| European | 50 | 5.4% |
| French | 50 | 5.4% |
| German | 222 | 23.8% |
| Irish | 103 | 11.0% |
| Italian | 9 | 1.0% |
| Mexican | 344 | 36.9% |
| Norwegian | 77 | 8.3% |
| Polish | 10 | 1.1% |
| Russian | 8 | 0.9% |
| Scotch-Irish | 8 | 0.9% |
| Scottish | 59 | 6.3% |
| Serbian | 9 | 1.0% |
| Swedish | 8 | 0.9% |
| Swiss | 20 | 2.1% |
| Thai | 9 | 1.0% | View All 21 Rows |
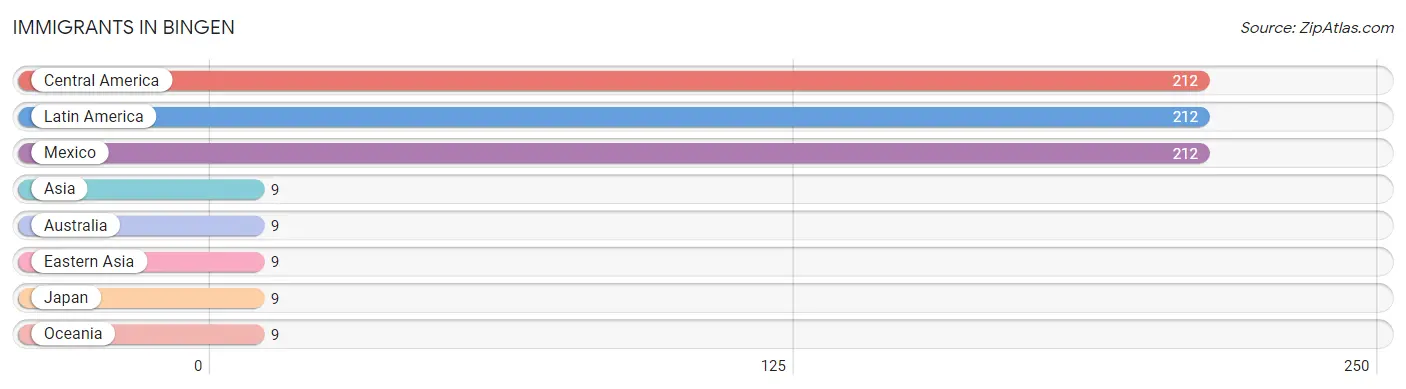
Immigrants in Bingen
The most numerous immigrant groups reported in Bingen came from Central America (212 | 22.7%), Latin America (212 | 22.7%), Mexico (212 | 22.7%), Asia (9 | 1.0%), and Australia (9 | 1.0%), together accounting for 70.1% of all Bingen residents.
| Immigration Origin | # Population | % Population |
| Asia | 9 | 1.0% |
| Australia | 9 | 1.0% |
| Central America | 212 | 22.7% |
| Eastern Asia | 9 | 1.0% |
| Japan | 9 | 1.0% |
| Latin America | 212 | 22.7% |
| Mexico | 212 | 22.7% |
| Oceania | 9 | 1.0% | View All 8 Rows |
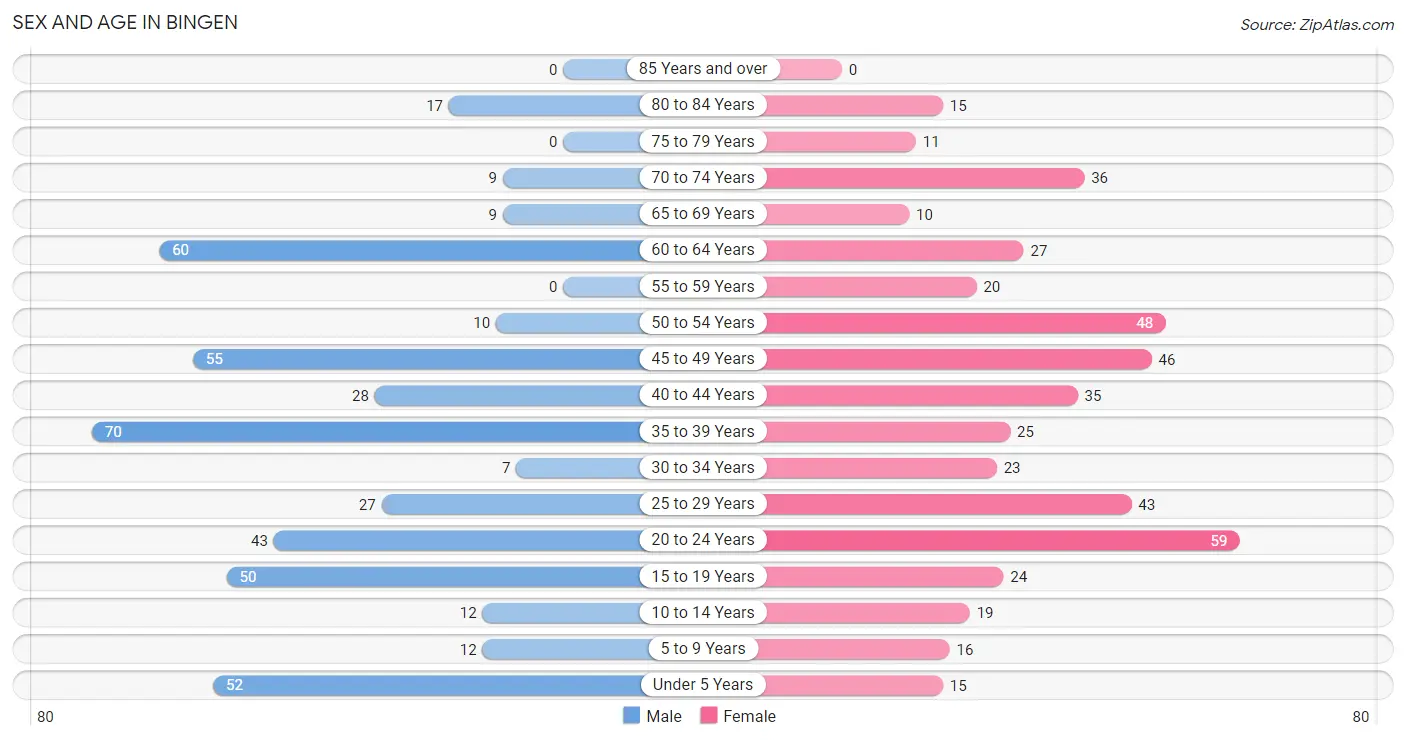
Sex and Age in Bingen
Sex and Age in Bingen
The most populous age groups in Bingen are 35 to 39 Years (70 | 15.2%) for men and 20 to 24 Years (59 | 12.5%) for women.
| Age Bracket | Male | Female |
| Under 5 Years | 52 (11.3%) | 15 (3.2%) |
| 5 to 9 Years | 12 (2.6%) | 16 (3.4%) |
| 10 to 14 Years | 12 (2.6%) | 19 (4.0%) |
| 15 to 19 Years | 50 (10.8%) | 24 (5.1%) |
| 20 to 24 Years | 43 (9.3%) | 59 (12.5%) |
| 25 to 29 Years | 27 (5.9%) | 43 (9.1%) |
| 30 to 34 Years | 7 (1.5%) | 23 (4.9%) |
| 35 to 39 Years | 70 (15.2%) | 25 (5.3%) |
| 40 to 44 Years | 28 (6.1%) | 35 (7.4%) |
| 45 to 49 Years | 55 (11.9%) | 46 (9.8%) |
| 50 to 54 Years | 10 (2.2%) | 48 (10.2%) |
| 55 to 59 Years | 0 (0.0%) | 20 (4.2%) |
| 60 to 64 Years | 60 (13.0%) | 27 (5.7%) |
| 65 to 69 Years | 9 (1.9%) | 10 (2.1%) |
| 70 to 74 Years | 9 (1.9%) | 36 (7.6%) |
| 75 to 79 Years | 0 (0.0%) | 11 (2.3%) |
| 80 to 84 Years | 17 (3.7%) | 15 (3.2%) |
| 85 Years and over | 0 (0.0%) | 0 (0.0%) |
| Total | 461 (100.0%) | 472 (100.0%) |
Families and Households in Bingen
Median Family Size in Bingen
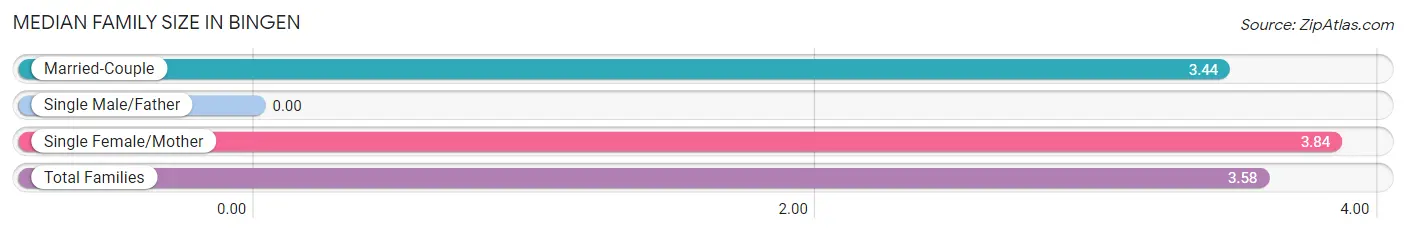
| Family Type | # Families | Family Size |
| Married-Couple | 126 (66.7%) | 3.44 |
| Single Male/Father | 0 (0.0%) | - |
| Single Female/Mother | 63 (33.3%) | 3.84 |
| Total Families | 189 (100.0%) | 3.58 |
Median Household Size in Bingen
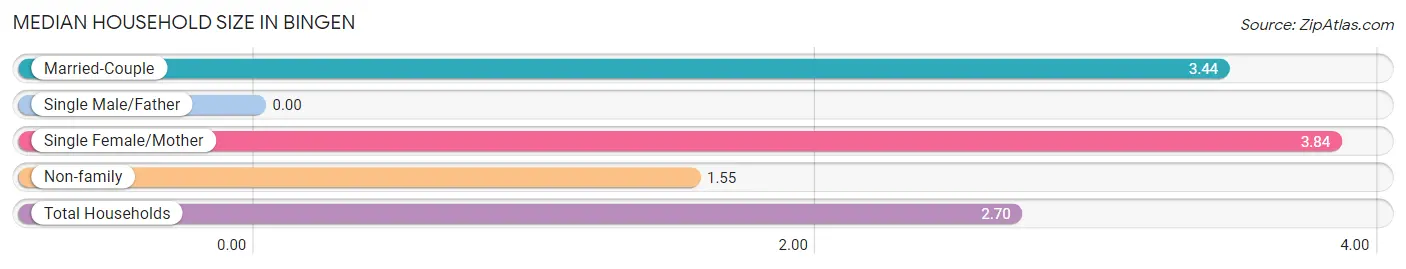
| Household Type | # Households | Household Size |
| Married-Couple | 126 (37.6%) | 3.44 |
| Single Male/Father | 0 (0.0%) | - |
| Single Female/Mother | 63 (18.8%) | 3.84 |
| Non-family | 146 (43.6%) | 1.55 |
| Total Households | 335 (100.0%) | 2.70 |
Household Size by Marriage Status in Bingen
Out of a total of 335 households in Bingen, 189 (56.4%) are family households, while 146 (43.6%) are nonfamily households. The most numerous type of family households are 2-person households, comprising 101, and the most common type of nonfamily households are 1-person households, comprising 78.
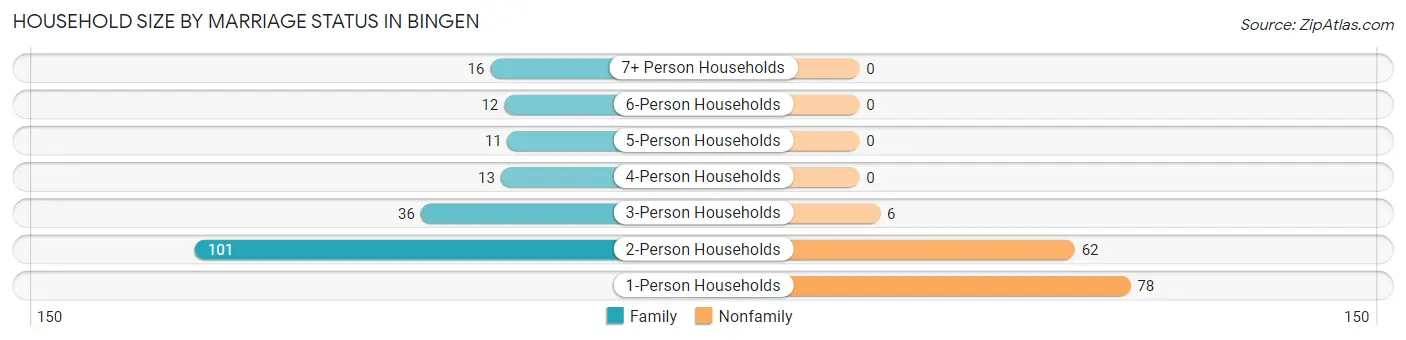
| Household Size | Family Households | Nonfamily Households |
| 1-Person Households | - | 78 (23.3%) |
| 2-Person Households | 101 (30.1%) | 62 (18.5%) |
| 3-Person Households | 36 (10.7%) | 6 (1.8%) |
| 4-Person Households | 13 (3.9%) | 0 (0.0%) |
| 5-Person Households | 11 (3.3%) | 0 (0.0%) |
| 6-Person Households | 12 (3.6%) | 0 (0.0%) |
| 7+ Person Households | 16 (4.8%) | 0 (0.0%) |
| Total | 189 (56.4%) | 146 (43.6%) |
Female Fertility in Bingen
Fertility by Age in Bingen
Average fertility rate in Bingen is 64.0 births per 1,000 women. Women in the age bracket of 20 to 34 years have the highest fertility rate with 144.0 births per 1,000 women. Women in the age bracket of 20 to 34 years acount for 100.0% of all women with births.
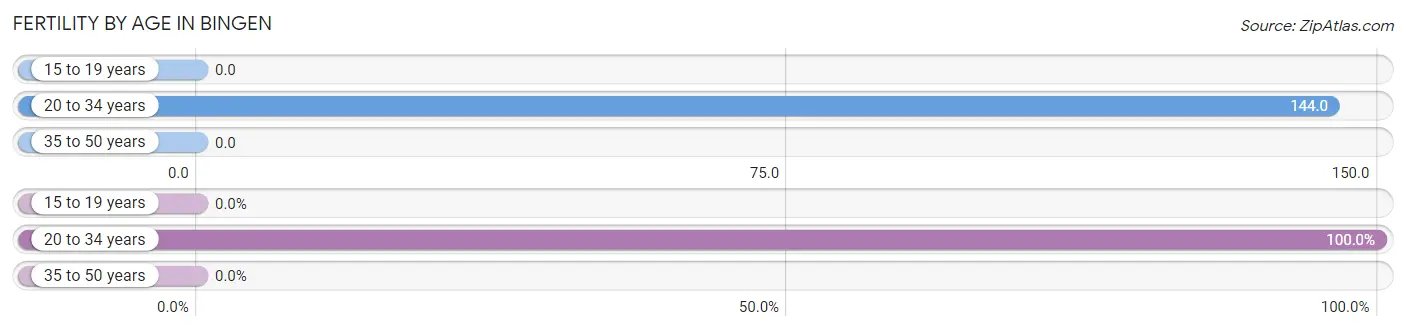
| Age Bracket | Women with Births | Births / 1,000 Women |
| 15 to 19 years | 0 (0.0%) | 0.0 |
| 20 to 34 years | 18 (100.0%) | 144.0 |
| 35 to 50 years | 0 (0.0%) | 0.0 |
| Total | 18 (100.0%) | 64.0 |
Fertility by Age by Marriage Status in Bingen
27.8% of women with births (18) in Bingen are married. The highest percentage of unmarried women with births falls into 20 to 34 years age bracket with 72.2% of them unmarried at the time of birth, while the lowest percentage of unmarried women with births belong to 20 to 34 years age bracket with 72.2% of them unmarried.
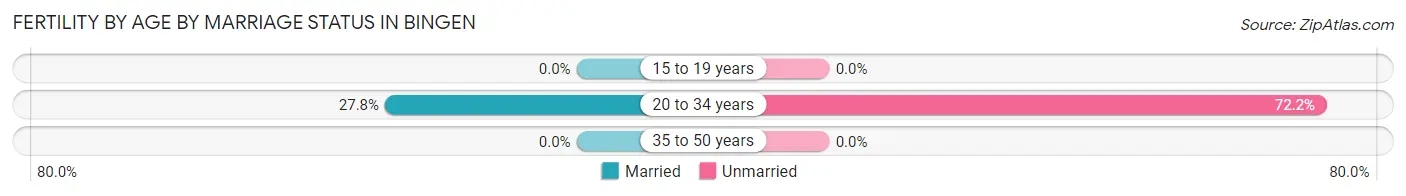
| Age Bracket | Married | Unmarried |
| 15 to 19 years | 0 (0.0%) | 0 (0.0%) |
| 20 to 34 years | 5 (27.8%) | 13 (72.2%) |
| 35 to 50 years | 0 (0.0%) | 0 (0.0%) |
| Total | 5 (27.8%) | 13 (72.2%) |
Fertility by Education in Bingen
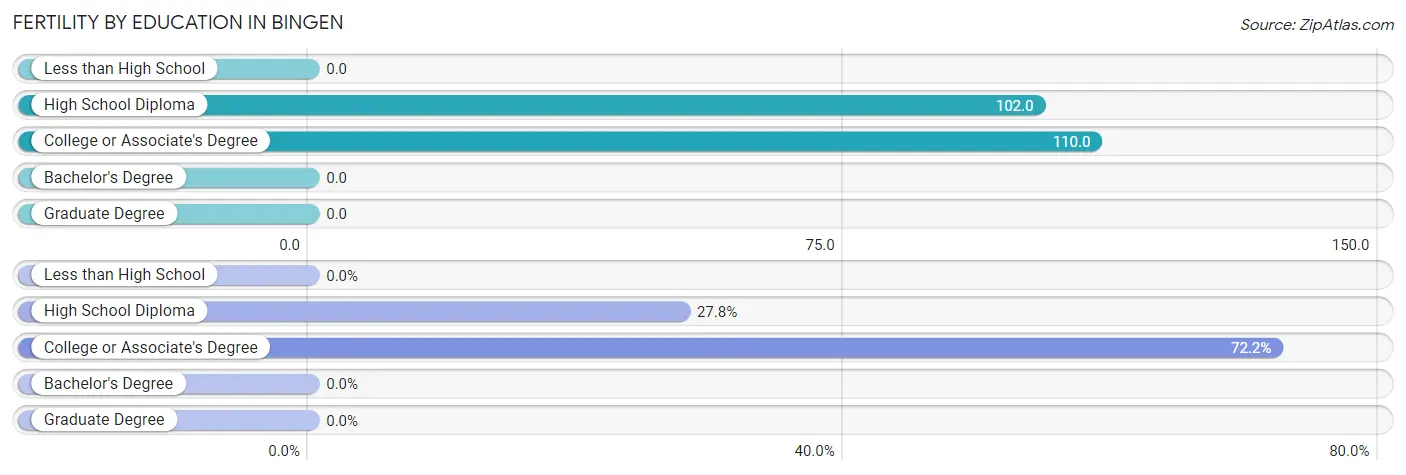
| Educational Attainment | Women with Births | Births / 1,000 Women |
| Less than High School | 0 (0.0%) | 0.0 |
| High School Diploma | 5 (27.8%) | 102.0 |
| College or Associate's Degree | 13 (72.2%) | 110.0 |
| Bachelor's Degree | 0 (0.0%) | 0.0 |
| Graduate Degree | 0 (0.0%) | 0.0 |
| Total | 18 (100.0%) | 64.0 |
Fertility by Education by Marriage Status in Bingen
72.2% of women with births in Bingen are unmarried. Women with the educational attainment of high school diploma are most likely to be married with 100.0% of them married at childbirth, while women with the educational attainment of college or associate's degree are least likely to be married with 100.0% of them unmarried at childbirth.
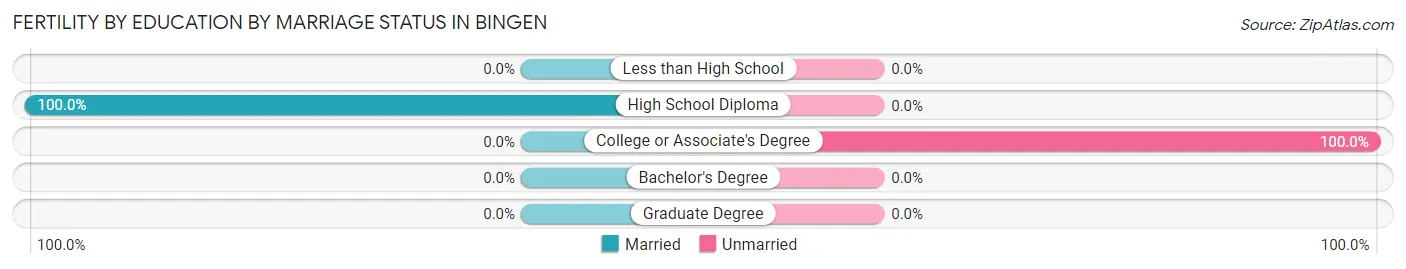
| Educational Attainment | Married | Unmarried |
| Less than High School | 0 (0.0%) | 0 (0.0%) |
| High School Diploma | 5 (100.0%) | 0 (0.0%) |
| College or Associate's Degree | 0 (0.0%) | 13 (100.0%) |
| Bachelor's Degree | 0 (0.0%) | 0 (0.0%) |
| Graduate Degree | 0 (0.0%) | 0 (0.0%) |
| Total | 5 (27.8%) | 13 (72.2%) |
Employment Characteristics in Bingen
Employment by Class of Employer in Bingen
Among the 467 employed individuals in Bingen, private company employees (355 | 76.0%), local government employees (51 | 10.9%), and self-employed (incorporated) (39 | 8.4%) make up the most common classes of employment.
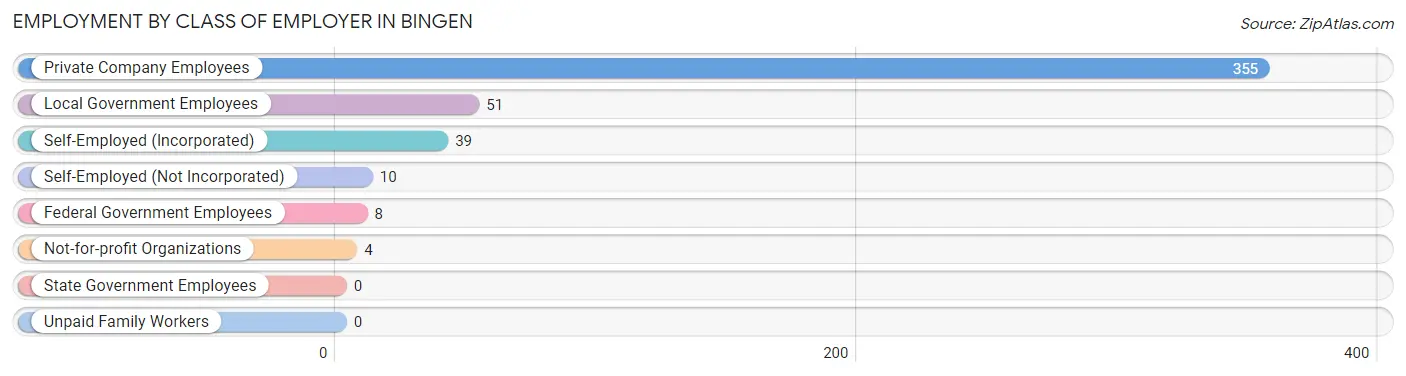
| Employer Class | # Employees | % Employees |
| Private Company Employees | 355 | 76.0% |
| Self-Employed (Incorporated) | 39 | 8.4% |
| Self-Employed (Not Incorporated) | 10 | 2.1% |
| Not-for-profit Organizations | 4 | 0.9% |
| Local Government Employees | 51 | 10.9% |
| State Government Employees | 0 | 0.0% |
| Federal Government Employees | 8 | 1.7% |
| Unpaid Family Workers | 0 | 0.0% |
| Total | 467 | 100.0% |
Employment Status by Age in Bingen
According to the labor force statistics for Bingen, out of the total population over 16 years of age (781), 66.3% or 518 individuals are in the labor force, with 4.4% or 23 of them unemployed. The age group with the highest labor force participation rate is 30 to 34 years, with 100.0% or 30 individuals in the labor force. Within the labor force, the 30 to 34 years age range has the highest percentage of unemployed individuals, with 23.3% or 7 of them being unemployed.
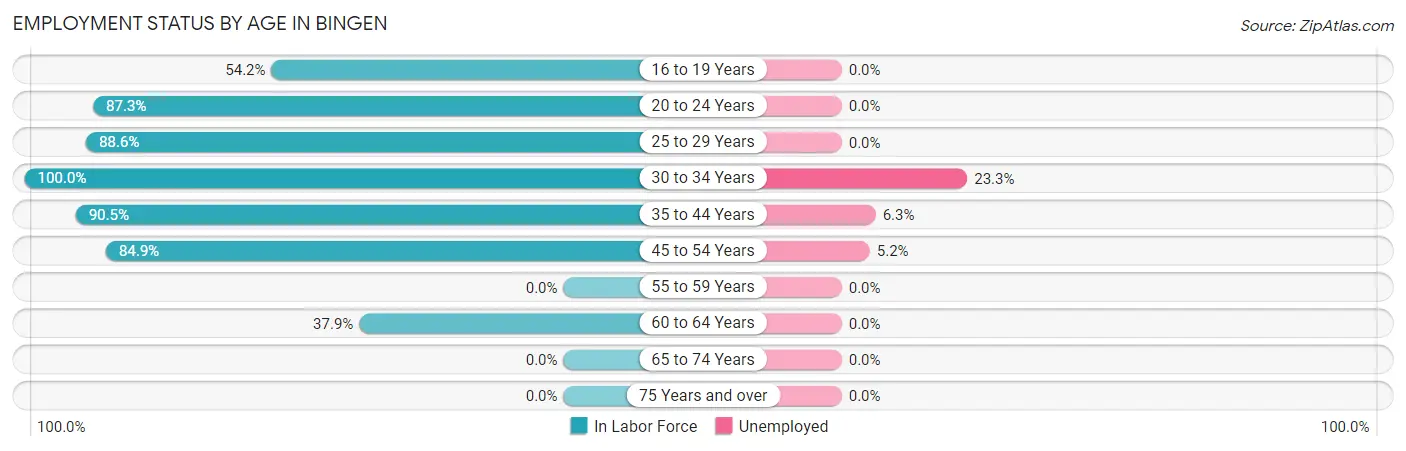
| Age Bracket | In Labor Force | Unemployed |
| 16 to 19 Years | 26 (54.2%) | 0 (0.0%) |
| 20 to 24 Years | 89 (87.3%) | 0 (0.0%) |
| 25 to 29 Years | 62 (88.6%) | 0 (0.0%) |
| 30 to 34 Years | 30 (100.0%) | 7 (23.3%) |
| 35 to 44 Years | 143 (90.5%) | 9 (6.3%) |
| 45 to 54 Years | 135 (84.9%) | 7 (5.2%) |
| 55 to 59 Years | 0 (0.0%) | 0 (0.0%) |
| 60 to 64 Years | 33 (37.9%) | 0 (0.0%) |
| 65 to 74 Years | 0 (0.0%) | 0 (0.0%) |
| 75 Years and over | 0 (0.0%) | 0 (0.0%) |
| Total | 518 (66.3%) | 23 (4.4%) |
Employment Status by Educational Attainment in Bingen
According to labor force statistics for Bingen, 76.9% of individuals (403) out of the total population between 25 and 64 years of age (524) are in the labor force, with 5.7% or 23 of them being unemployed. The group with the highest labor force participation rate are those with the educational attainment of bachelor's degree or higher, with 100.0% or 157 individuals in the labor force. Within the labor force, individuals with less than high school education have the highest percentage of unemployment, with 10.9% or 7 of them being unemployed.
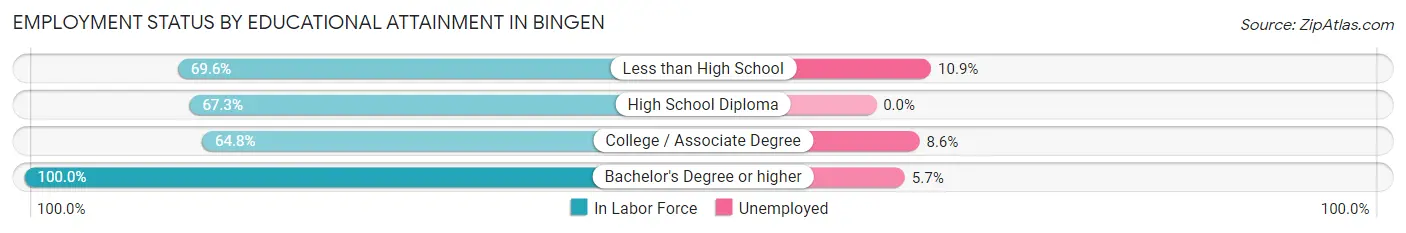
| Educational Attainment | In Labor Force | Unemployed |
| Less than High School | 64 (69.6%) | 10 (10.9%) |
| High School Diploma | 101 (67.3%) | 0 (0.0%) |
| College / Associate Degree | 81 (64.8%) | 11 (8.6%) |
| Bachelor's Degree or higher | 157 (100.0%) | 9 (5.7%) |
| Total | 403 (76.9%) | 30 (5.7%) |
Employment Occupations by Sex in Bingen
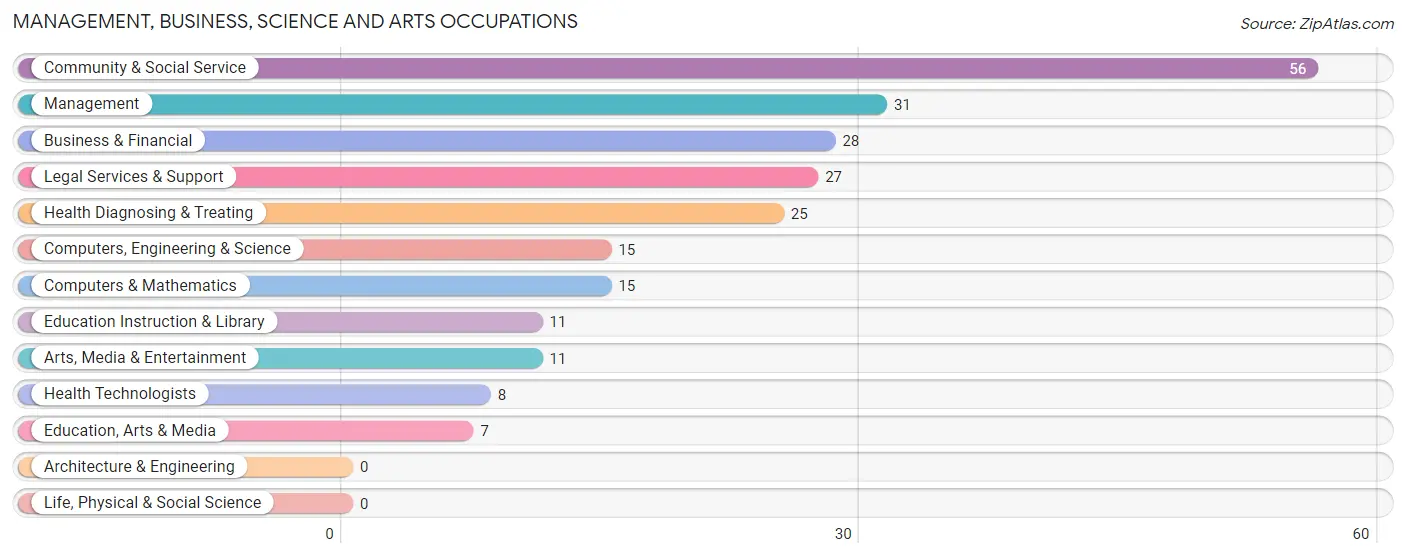
Management, Business, Science and Arts Occupations
The most common Management, Business, Science and Arts occupations in Bingen are Community & Social Service (56 | 11.3%), Management (31 | 6.3%), Business & Financial (28 | 5.7%), Legal Services & Support (27 | 5.4%), and Health Diagnosing & Treating (25 | 5.1%).
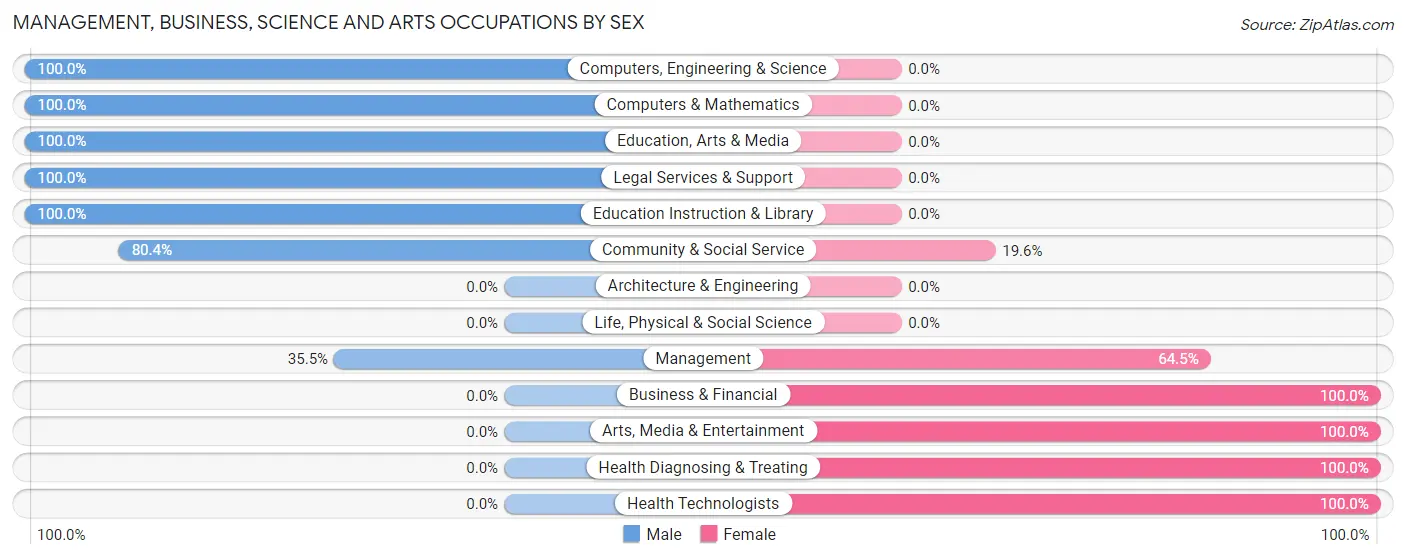
Management, Business, Science and Arts Occupations by Sex
Within the Management, Business, Science and Arts occupations in Bingen, the most male-oriented occupations are Computers, Engineering & Science (100.0%), Computers & Mathematics (100.0%), and Education, Arts & Media (100.0%), while the most female-oriented occupations are Business & Financial (100.0%), Arts, Media & Entertainment (100.0%), and Health Diagnosing & Treating (100.0%).
| Occupation | Male | Female |
| Management | 11 (35.5%) | 20 (64.5%) |
| Business & Financial | 0 (0.0%) | 28 (100.0%) |
| Computers, Engineering & Science | 15 (100.0%) | 0 (0.0%) |
| Computers & Mathematics | 15 (100.0%) | 0 (0.0%) |
| Architecture & Engineering | 0 (0.0%) | 0 (0.0%) |
| Life, Physical & Social Science | 0 (0.0%) | 0 (0.0%) |
| Community & Social Service | 45 (80.4%) | 11 (19.6%) |
| Education, Arts & Media | 7 (100.0%) | 0 (0.0%) |
| Legal Services & Support | 27 (100.0%) | 0 (0.0%) |
| Education Instruction & Library | 11 (100.0%) | 0 (0.0%) |
| Arts, Media & Entertainment | 0 (0.0%) | 11 (100.0%) |
| Health Diagnosing & Treating | 0 (0.0%) | 25 (100.0%) |
| Health Technologists | 0 (0.0%) | 8 (100.0%) |
| Total (Category) | 71 (45.8%) | 84 (54.2%) |
| Total (Overall) | 261 (52.7%) | 234 (47.3%) |
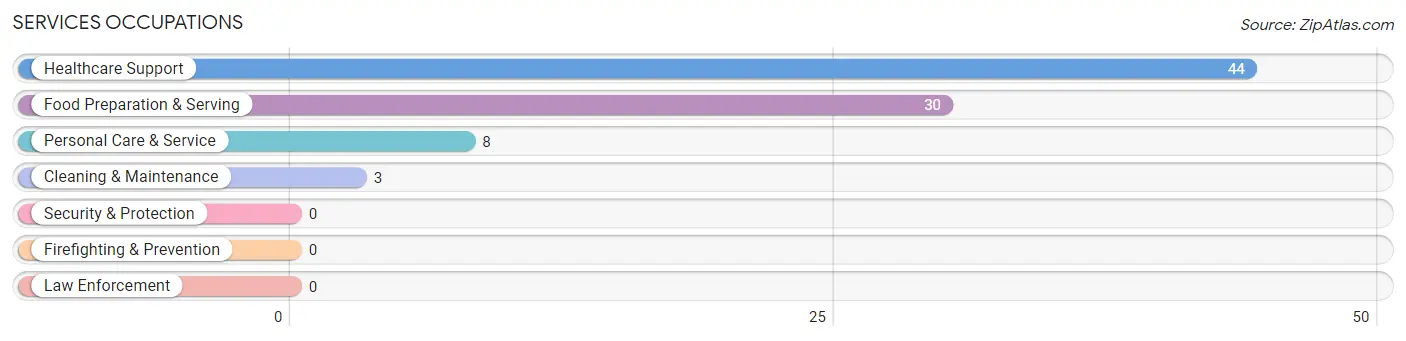
Services Occupations
The most common Services occupations in Bingen are Healthcare Support (44 | 8.9%), Food Preparation & Serving (30 | 6.1%), Personal Care & Service (8 | 1.6%), and Cleaning & Maintenance (3 | 0.6%).
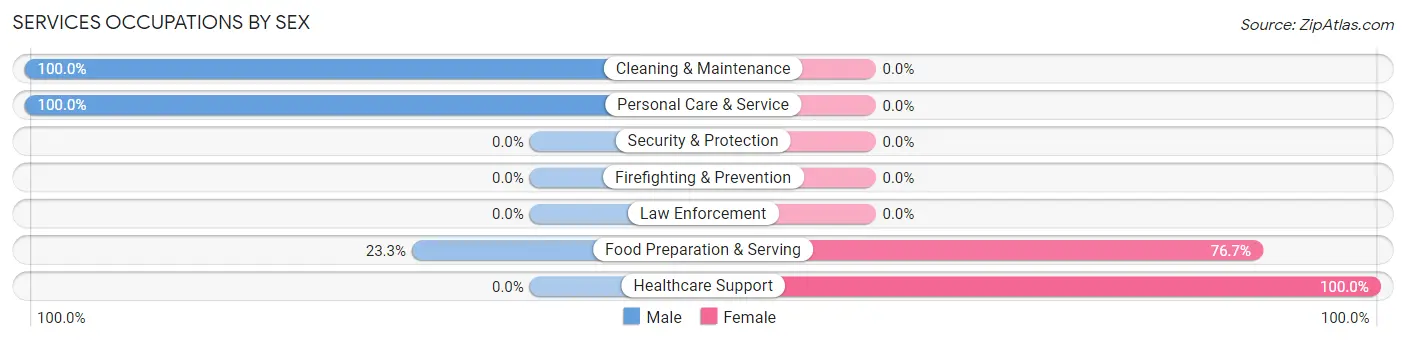
Services Occupations by Sex
Within the Services occupations in Bingen, the most male-oriented occupations are Cleaning & Maintenance (100.0%), Personal Care & Service (100.0%), and Food Preparation & Serving (23.3%), while the most female-oriented occupations are Healthcare Support (100.0%), and Food Preparation & Serving (76.7%).
| Occupation | Male | Female |
| Healthcare Support | 0 (0.0%) | 44 (100.0%) |
| Security & Protection | 0 (0.0%) | 0 (0.0%) |
| Firefighting & Prevention | 0 (0.0%) | 0 (0.0%) |
| Law Enforcement | 0 (0.0%) | 0 (0.0%) |
| Food Preparation & Serving | 7 (23.3%) | 23 (76.7%) |
| Cleaning & Maintenance | 3 (100.0%) | 0 (0.0%) |
| Personal Care & Service | 8 (100.0%) | 0 (0.0%) |
| Total (Category) | 18 (21.2%) | 67 (78.8%) |
| Total (Overall) | 261 (52.7%) | 234 (47.3%) |
Sales and Office Occupations
The most common Sales and Office occupations in Bingen are Sales & Related (77 | 15.6%), and Office & Administration (19 | 3.8%).
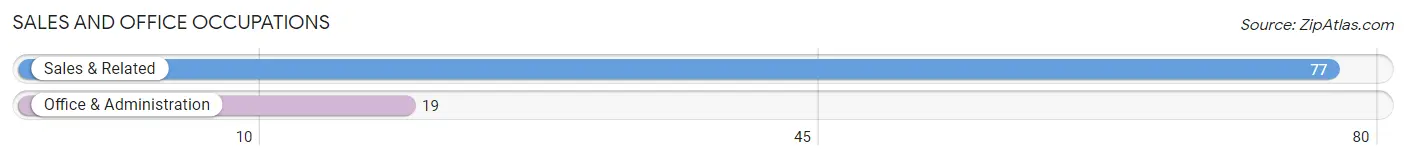
Sales and Office Occupations by Sex
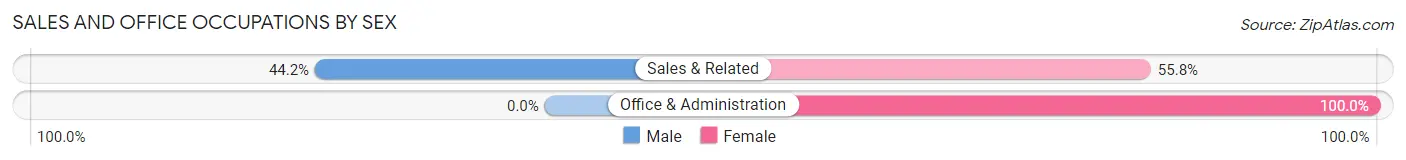
| Occupation | Male | Female |
| Sales & Related | 34 (44.2%) | 43 (55.8%) |
| Office & Administration | 0 (0.0%) | 19 (100.0%) |
| Total (Category) | 34 (35.4%) | 62 (64.6%) |
| Total (Overall) | 261 (52.7%) | 234 (47.3%) |
Natural Resources, Construction and Maintenance Occupations
The most common Natural Resources, Construction and Maintenance occupations in Bingen are Construction & Extraction (39 | 7.9%), Farming, Fishing & Forestry (30 | 6.1%), and Installation, Maintenance & Repair (5 | 1.0%).
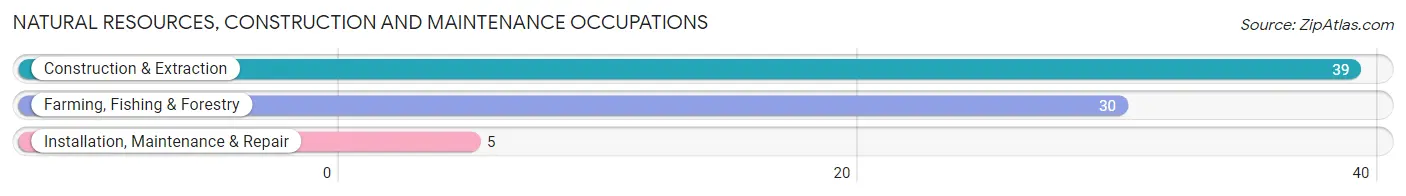
Natural Resources, Construction and Maintenance Occupations by Sex
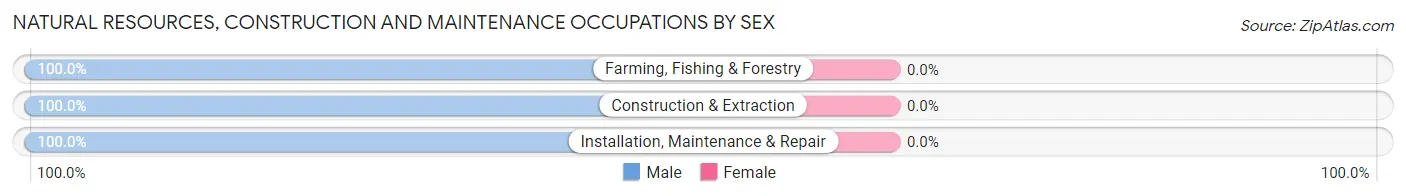
| Occupation | Male | Female |
| Farming, Fishing & Forestry | 30 (100.0%) | 0 (0.0%) |
| Construction & Extraction | 39 (100.0%) | 0 (0.0%) |
| Installation, Maintenance & Repair | 5 (100.0%) | 0 (0.0%) |
| Total (Category) | 74 (100.0%) | 0 (0.0%) |
| Total (Overall) | 261 (52.7%) | 234 (47.3%) |
Production, Transportation and Moving Occupations
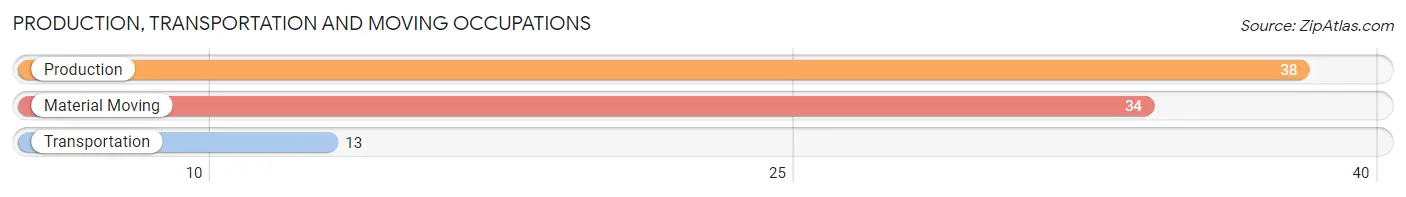
The most common Production, Transportation and Moving occupations in Bingen are Production (38 | 7.7%), Material Moving (34 | 6.9%), and Transportation (13 | 2.6%).
Production, Transportation and Moving Occupations by Sex
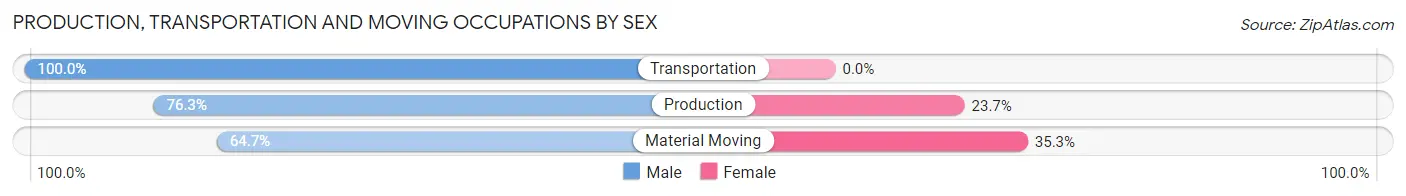
| Occupation | Male | Female |
| Production | 29 (76.3%) | 9 (23.7%) |
| Transportation | 13 (100.0%) | 0 (0.0%) |
| Material Moving | 22 (64.7%) | 12 (35.3%) |
| Total (Category) | 64 (75.3%) | 21 (24.7%) |
| Total (Overall) | 261 (52.7%) | 234 (47.3%) |
Employment Industries by Sex in Bingen
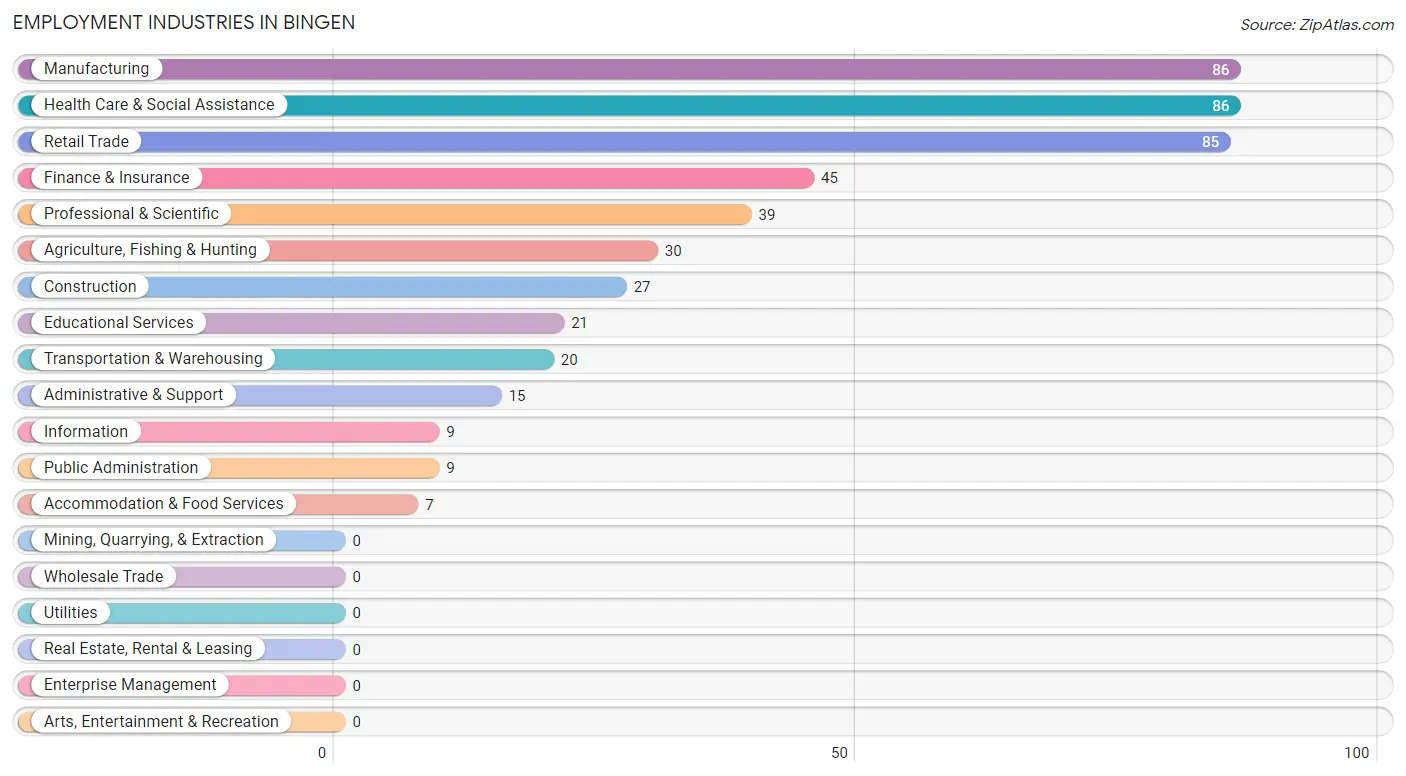
Employment Industries in Bingen
The major employment industries in Bingen include Manufacturing (86 | 17.4%), Health Care & Social Assistance (86 | 17.4%), Retail Trade (85 | 17.2%), Finance & Insurance (45 | 9.1%), and Professional & Scientific (39 | 7.9%).
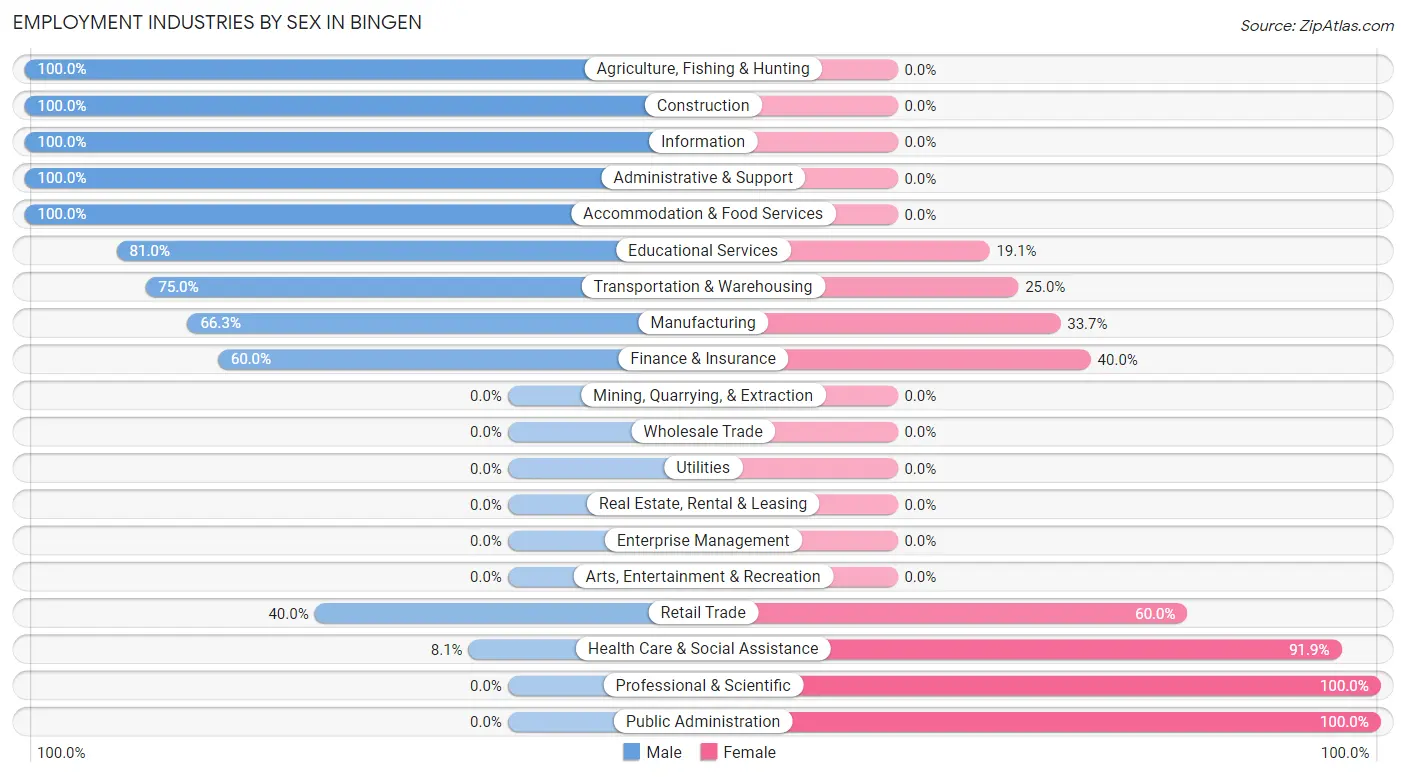
Employment Industries by Sex in Bingen
The Bingen industries that see more men than women are Agriculture, Fishing & Hunting (100.0%), Construction (100.0%), and Information (100.0%), whereas the industries that tend to have a higher number of women are Professional & Scientific (100.0%), Public Administration (100.0%), and Health Care & Social Assistance (91.9%).
| Industry | Male | Female |
| Agriculture, Fishing & Hunting | 30 (100.0%) | 0 (0.0%) |
| Mining, Quarrying, & Extraction | 0 (0.0%) | 0 (0.0%) |
| Construction | 27 (100.0%) | 0 (0.0%) |
| Manufacturing | 57 (66.3%) | 29 (33.7%) |
| Wholesale Trade | 0 (0.0%) | 0 (0.0%) |
| Retail Trade | 34 (40.0%) | 51 (60.0%) |
| Transportation & Warehousing | 15 (75.0%) | 5 (25.0%) |
| Utilities | 0 (0.0%) | 0 (0.0%) |
| Information | 9 (100.0%) | 0 (0.0%) |
| Finance & Insurance | 27 (60.0%) | 18 (40.0%) |
| Real Estate, Rental & Leasing | 0 (0.0%) | 0 (0.0%) |
| Professional & Scientific | 0 (0.0%) | 39 (100.0%) |
| Enterprise Management | 0 (0.0%) | 0 (0.0%) |
| Administrative & Support | 15 (100.0%) | 0 (0.0%) |
| Educational Services | 17 (80.9%) | 4 (19.1%) |
| Health Care & Social Assistance | 7 (8.1%) | 79 (91.9%) |
| Arts, Entertainment & Recreation | 0 (0.0%) | 0 (0.0%) |
| Accommodation & Food Services | 7 (100.0%) | 0 (0.0%) |
| Public Administration | 0 (0.0%) | 9 (100.0%) |
| Total | 261 (52.7%) | 234 (47.3%) |
Education in Bingen
School Enrollment in Bingen
The most common levels of schooling among the 215 students in Bingen are college / undergraduate (67 | 31.2%), high school (54 | 25.1%), and middle school (25 | 11.6%).
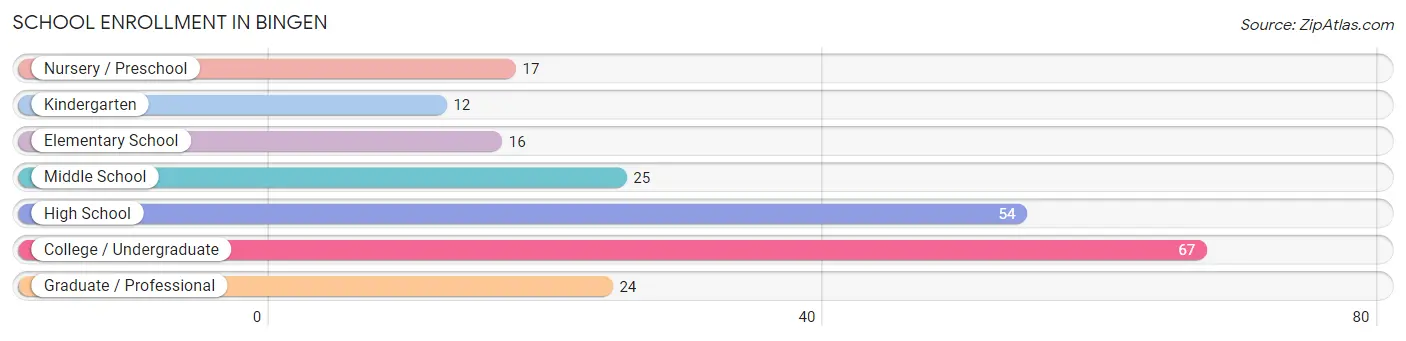
| School Level | # Students | % Students |
| Nursery / Preschool | 17 | 7.9% |
| Kindergarten | 12 | 5.6% |
| Elementary School | 16 | 7.4% |
| Middle School | 25 | 11.6% |
| High School | 54 | 25.1% |
| College / Undergraduate | 67 | 31.2% |
| Graduate / Professional | 24 | 11.2% |
| Total | 215 | 100.0% |
School Enrollment by Age by Funding Source in Bingen
Out of a total of 215 students who are enrolled in schools in Bingen, 37 (17.2%) attend a private institution, while the remaining 178 (82.8%) are enrolled in public schools. The age group of 3 to 4 year olds has the highest likelihood of being enrolled in private schools, with 17 (100.0% in the age bracket) enrolled. Conversely, the age group of 15 to 17 year olds has the lowest likelihood of being enrolled in a private school, with 48 (100.0% in the age bracket) attending a public institution.
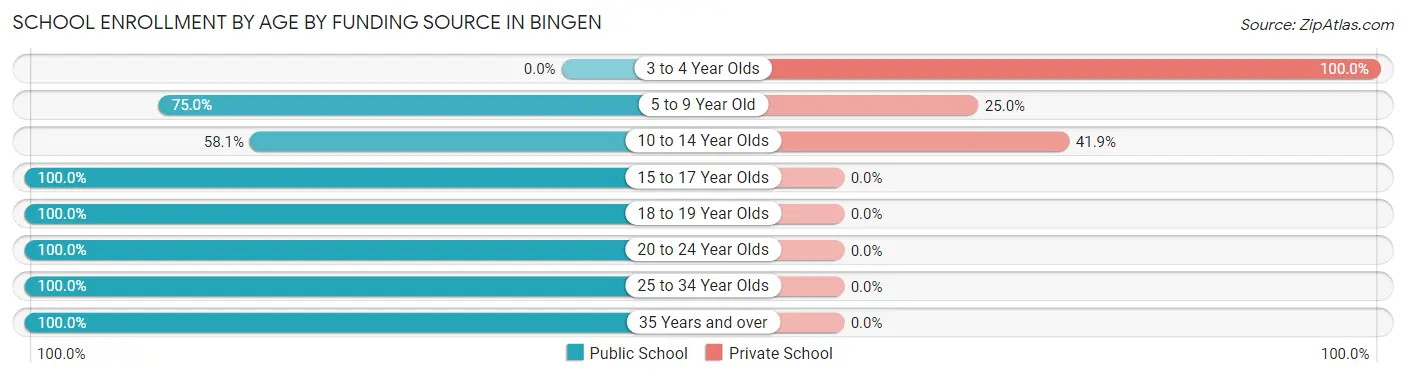
| Age Bracket | Public School | Private School |
| 3 to 4 Year Olds | 0 (0.0%) | 17 (100.0%) |
| 5 to 9 Year Old | 21 (75.0%) | 7 (25.0%) |
| 10 to 14 Year Olds | 18 (58.1%) | 13 (41.9%) |
| 15 to 17 Year Olds | 48 (100.0%) | 0 (0.0%) |
| 18 to 19 Year Olds | 3 (100.0%) | 0 (0.0%) |
| 20 to 24 Year Olds | 54 (100.0%) | 0 (0.0%) |
| 25 to 34 Year Olds | 19 (100.0%) | 0 (0.0%) |
| 35 Years and over | 15 (100.0%) | 0 (0.0%) |
| Total | 178 (82.8%) | 37 (17.2%) |
Educational Attainment by Field of Study in Bingen
Bio, nature & agricultural (30 | 14.6%), physical & health sciences (28 | 13.7%), multidisciplinary studies (27 | 13.2%), science & technology (26 | 12.7%), and business (25 | 12.2%) are the most common fields of study among 205 individuals in Bingen who have obtained a bachelor's degree or higher.
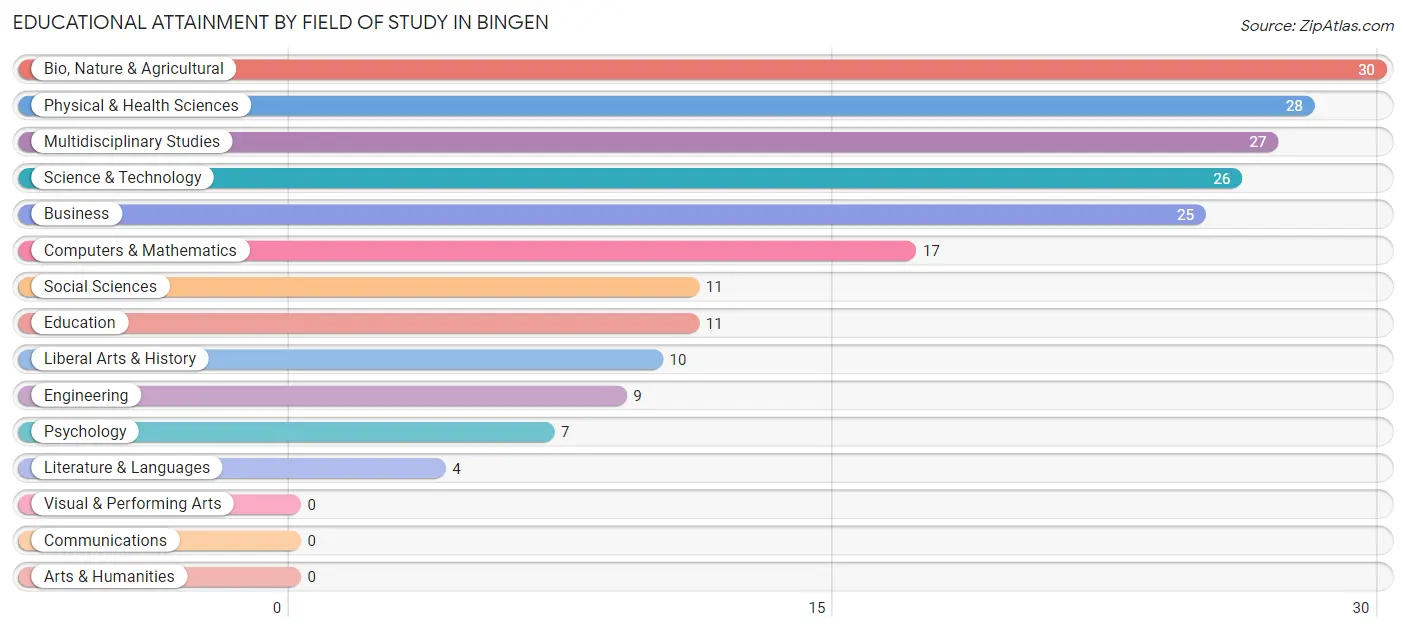
| Field of Study | # Graduates | % Graduates |
| Computers & Mathematics | 17 | 8.3% |
| Bio, Nature & Agricultural | 30 | 14.6% |
| Physical & Health Sciences | 28 | 13.7% |
| Psychology | 7 | 3.4% |
| Social Sciences | 11 | 5.4% |
| Engineering | 9 | 4.4% |
| Multidisciplinary Studies | 27 | 13.2% |
| Science & Technology | 26 | 12.7% |
| Business | 25 | 12.2% |
| Education | 11 | 5.4% |
| Literature & Languages | 4 | 1.9% |
| Liberal Arts & History | 10 | 4.9% |
| Visual & Performing Arts | 0 | 0.0% |
| Communications | 0 | 0.0% |
| Arts & Humanities | 0 | 0.0% |
| Total | 205 | 100.0% |
Transportation & Commute in Bingen
Vehicle Availability by Sex in Bingen
The most prevalent vehicle ownership categories in Bingen are males with 2 vehicles (105, accounting for 49.5%) and females with 2 vehicles (125, making up 46.7%).
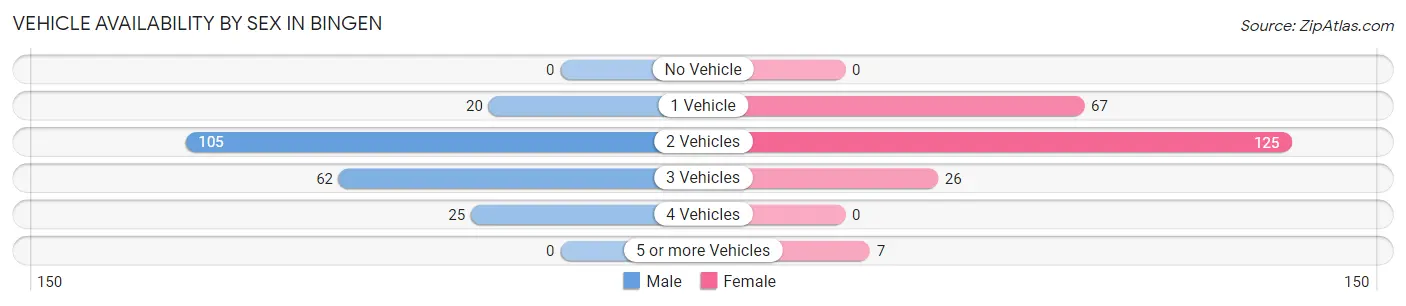
| Vehicles Available | Male | Female |
| No Vehicle | 0 (0.0%) | 0 (0.0%) |
| 1 Vehicle | 20 (9.4%) | 67 (29.8%) |
| 2 Vehicles | 105 (49.5%) | 125 (55.6%) |
| 3 Vehicles | 62 (29.2%) | 26 (11.6%) |
| 4 Vehicles | 25 (11.8%) | 0 (0.0%) |
| 5 or more Vehicles | 0 (0.0%) | 7 (3.1%) |
| Total | 212 (100.0%) | 225 (100.0%) |
Commute Time in Bingen
The most frequently occuring commute durations in Bingen are less than 5 minutes (100 commuters, 27.9%), 5 to 9 minutes (66 commuters, 18.4%), and 20 to 24 minutes (61 commuters, 17.0%).
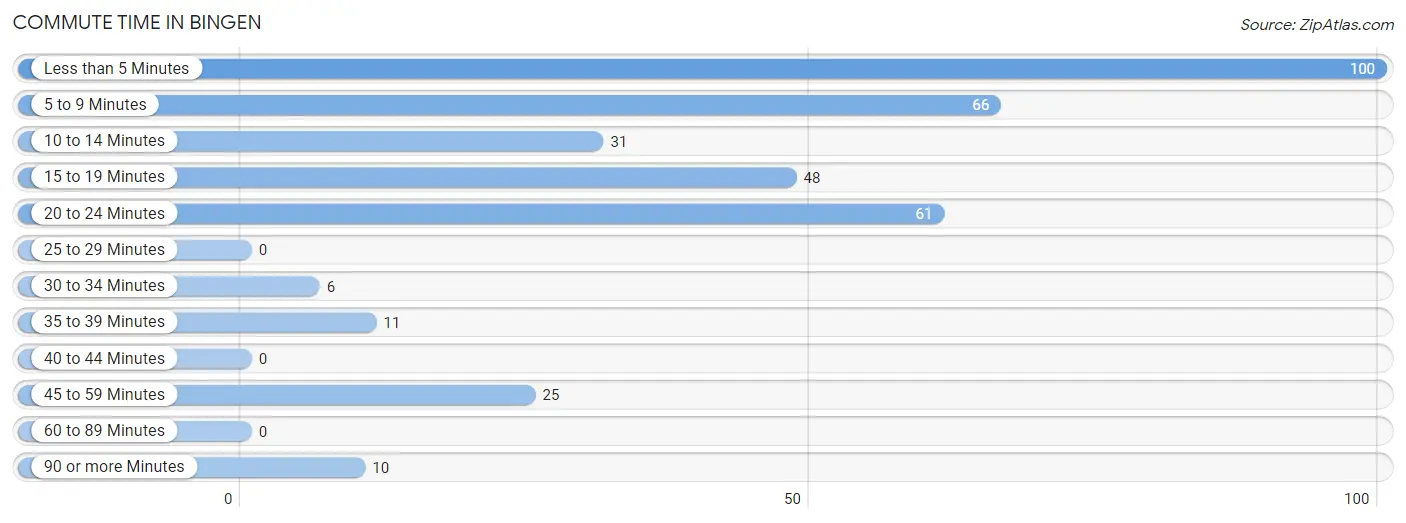
| Commute Time | # Commuters | % Commuters |
| Less than 5 Minutes | 100 | 27.9% |
| 5 to 9 Minutes | 66 | 18.4% |
| 10 to 14 Minutes | 31 | 8.7% |
| 15 to 19 Minutes | 48 | 13.4% |
| 20 to 24 Minutes | 61 | 17.0% |
| 25 to 29 Minutes | 0 | 0.0% |
| 30 to 34 Minutes | 6 | 1.7% |
| 35 to 39 Minutes | 11 | 3.1% |
| 40 to 44 Minutes | 0 | 0.0% |
| 45 to 59 Minutes | 25 | 7.0% |
| 60 to 89 Minutes | 0 | 0.0% |
| 90 or more Minutes | 10 | 2.8% |
Commute Time by Sex in Bingen
The most common commute times in Bingen are 5 to 9 minutes (61 commuters, 32.1%) for males and less than 5 minutes (59 commuters, 35.1%) for females.
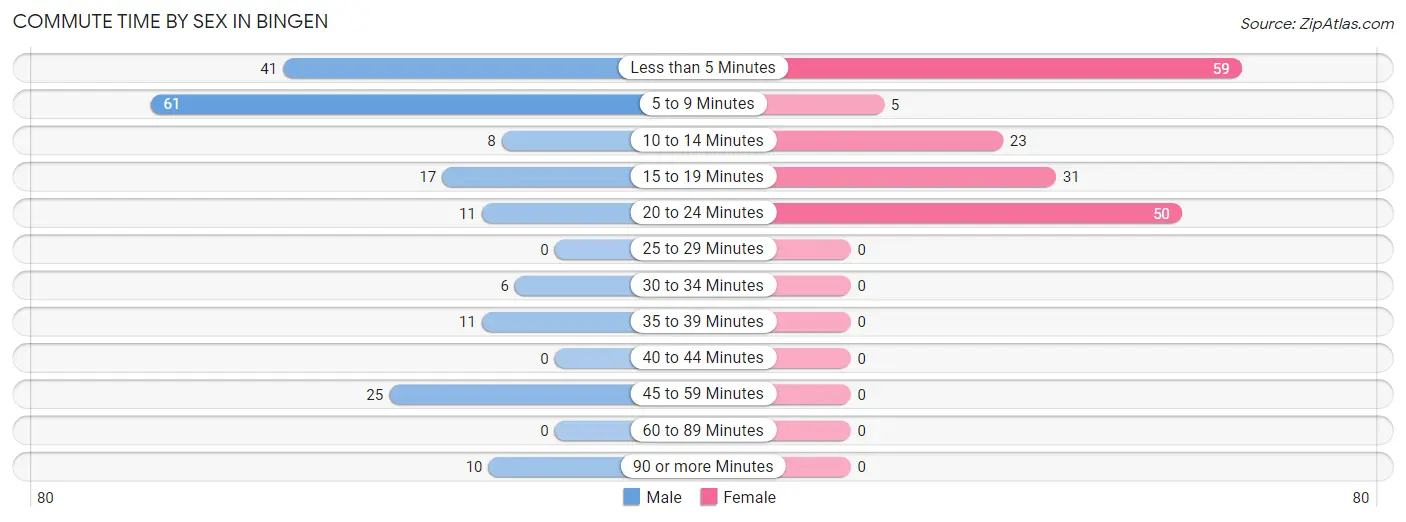
| Commute Time | Male | Female |
| Less than 5 Minutes | 41 (21.6%) | 59 (35.1%) |
| 5 to 9 Minutes | 61 (32.1%) | 5 (3.0%) |
| 10 to 14 Minutes | 8 (4.2%) | 23 (13.7%) |
| 15 to 19 Minutes | 17 (8.9%) | 31 (18.4%) |
| 20 to 24 Minutes | 11 (5.8%) | 50 (29.8%) |
| 25 to 29 Minutes | 0 (0.0%) | 0 (0.0%) |
| 30 to 34 Minutes | 6 (3.2%) | 0 (0.0%) |
| 35 to 39 Minutes | 11 (5.8%) | 0 (0.0%) |
| 40 to 44 Minutes | 0 (0.0%) | 0 (0.0%) |
| 45 to 59 Minutes | 25 (13.2%) | 0 (0.0%) |
| 60 to 89 Minutes | 0 (0.0%) | 0 (0.0%) |
| 90 or more Minutes | 10 (5.3%) | 0 (0.0%) |
Time of Departure to Work by Sex in Bingen
The most frequent times of departure to work in Bingen are 5:30 AM to 5:59 AM (32, 16.8%) for males and 9:00 AM to 9:59 AM (52, 30.9%) for females.
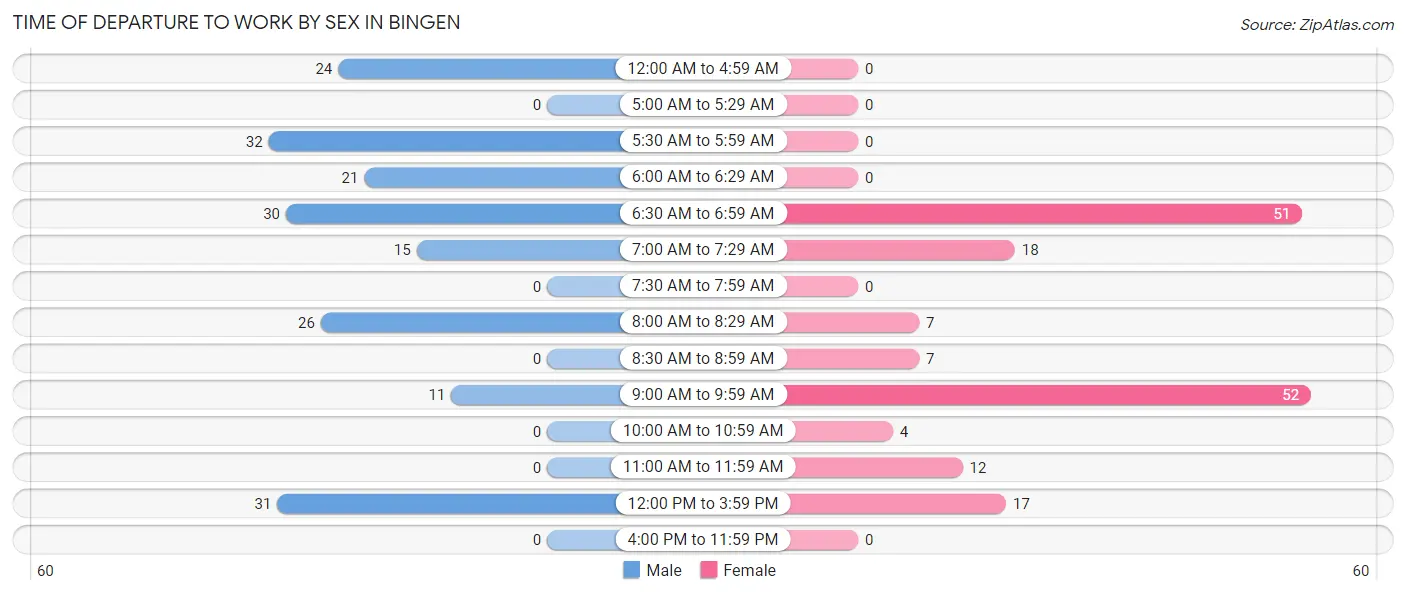
| Time of Departure | Male | Female |
| 12:00 AM to 4:59 AM | 24 (12.6%) | 0 (0.0%) |
| 5:00 AM to 5:29 AM | 0 (0.0%) | 0 (0.0%) |
| 5:30 AM to 5:59 AM | 32 (16.8%) | 0 (0.0%) |
| 6:00 AM to 6:29 AM | 21 (11.1%) | 0 (0.0%) |
| 6:30 AM to 6:59 AM | 30 (15.8%) | 51 (30.4%) |
| 7:00 AM to 7:29 AM | 15 (7.9%) | 18 (10.7%) |
| 7:30 AM to 7:59 AM | 0 (0.0%) | 0 (0.0%) |
| 8:00 AM to 8:29 AM | 26 (13.7%) | 7 (4.2%) |
| 8:30 AM to 8:59 AM | 0 (0.0%) | 7 (4.2%) |
| 9:00 AM to 9:59 AM | 11 (5.8%) | 52 (30.9%) |
| 10:00 AM to 10:59 AM | 0 (0.0%) | 4 (2.4%) |
| 11:00 AM to 11:59 AM | 0 (0.0%) | 12 (7.1%) |
| 12:00 PM to 3:59 PM | 31 (16.3%) | 17 (10.1%) |
| 4:00 PM to 11:59 PM | 0 (0.0%) | 0 (0.0%) |
| Total | 190 (100.0%) | 168 (100.0%) |
Housing Occupancy in Bingen
Occupancy by Ownership in Bingen
Of the total 335 dwellings in Bingen, owner-occupied units account for 216 (64.5%), while renter-occupied units make up 119 (35.5%).
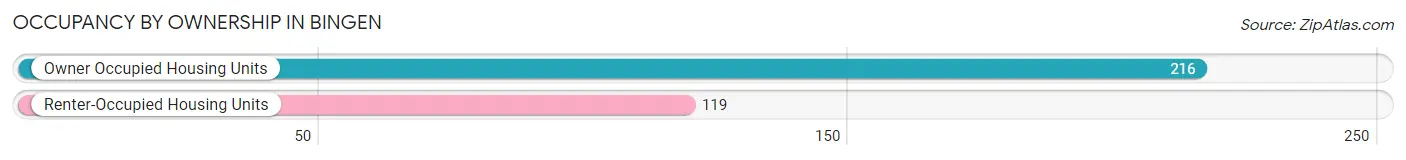
| Occupancy | # Housing Units | % Housing Units |
| Owner Occupied Housing Units | 216 | 64.5% |
| Renter-Occupied Housing Units | 119 | 35.5% |
| Total Occupied Housing Units | 335 | 100.0% |
Occupancy by Household Size in Bingen
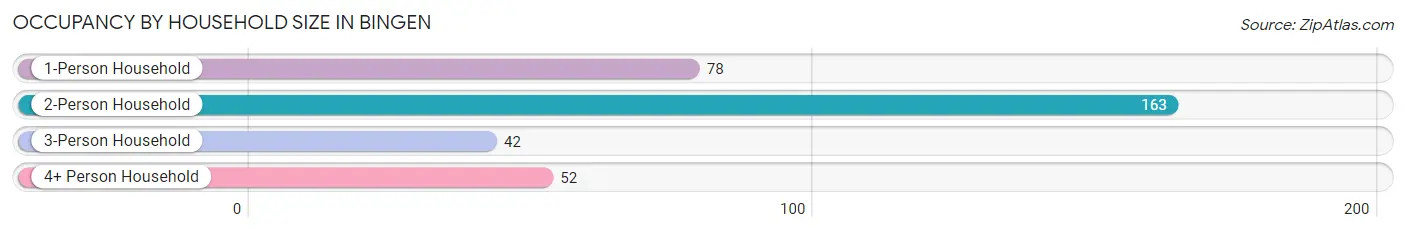
| Household Size | # Housing Units | % Housing Units |
| 1-Person Household | 78 | 23.3% |
| 2-Person Household | 163 | 48.7% |
| 3-Person Household | 42 | 12.5% |
| 4+ Person Household | 52 | 15.5% |
| Total Housing Units | 335 | 100.0% |
Occupancy by Ownership by Household Size in Bingen
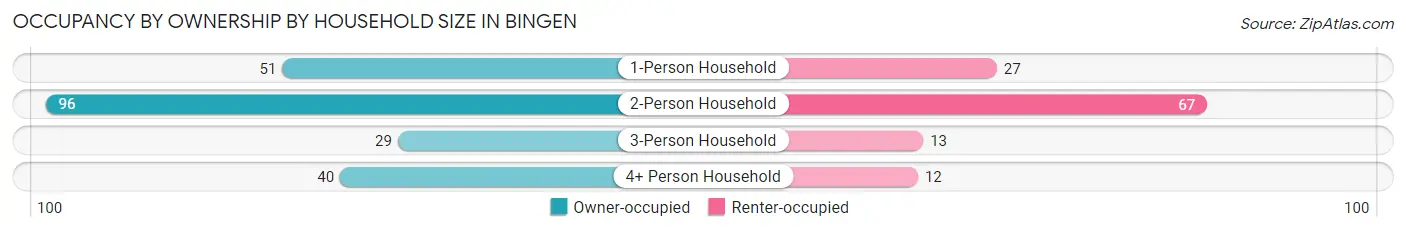
| Household Size | Owner-occupied | Renter-occupied |
| 1-Person Household | 51 (65.4%) | 27 (34.6%) |
| 2-Person Household | 96 (58.9%) | 67 (41.1%) |
| 3-Person Household | 29 (69.1%) | 13 (30.9%) |
| 4+ Person Household | 40 (76.9%) | 12 (23.1%) |
| Total Housing Units | 216 (64.5%) | 119 (35.5%) |
Occupancy by Educational Attainment in Bingen
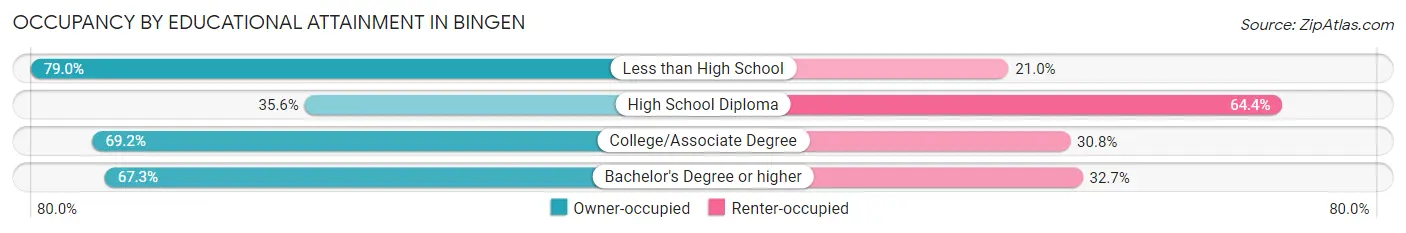
| Household Size | Owner-occupied | Renter-occupied |
| Less than High School | 49 (79.0%) | 13 (21.0%) |
| High School Diploma | 21 (35.6%) | 38 (64.4%) |
| College/Associate Degree | 72 (69.2%) | 32 (30.8%) |
| Bachelor's Degree or higher | 74 (67.3%) | 36 (32.7%) |
Occupancy by Age of Householder in Bingen
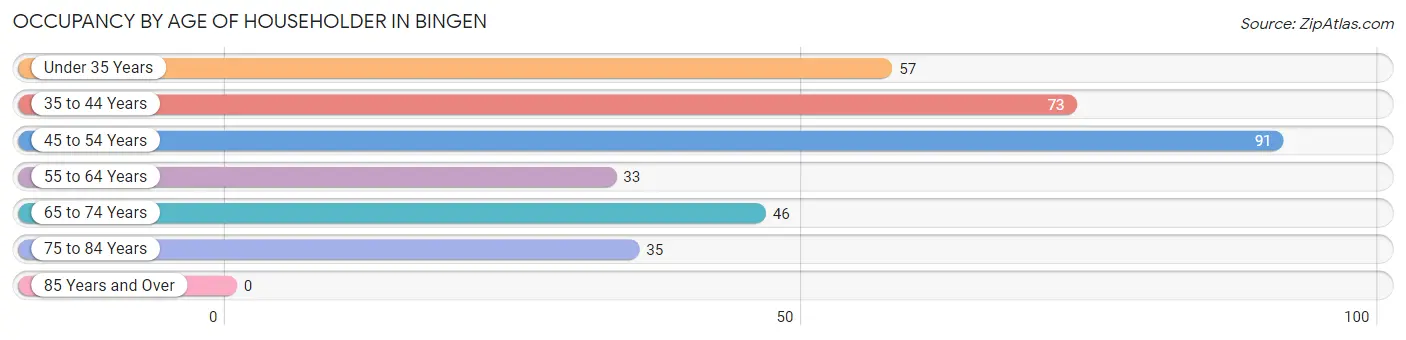
| Age Bracket | # Households | % Households |
| Under 35 Years | 57 | 17.0% |
| 35 to 44 Years | 73 | 21.8% |
| 45 to 54 Years | 91 | 27.2% |
| 55 to 64 Years | 33 | 9.9% |
| 65 to 74 Years | 46 | 13.7% |
| 75 to 84 Years | 35 | 10.4% |
| 85 Years and Over | 0 | 0.0% |
| Total | 335 | 100.0% |
Housing Finances in Bingen
Median Income by Occupancy in Bingen
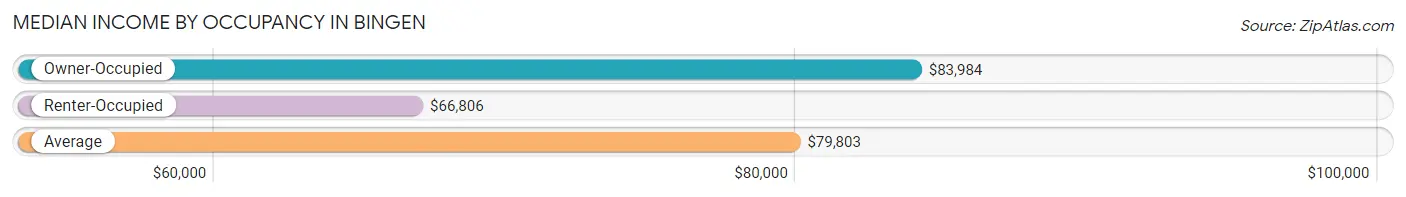
| Occupancy Type | # Households | Median Income |
| Owner-Occupied | 216 (64.5%) | $83,984 |
| Renter-Occupied | 119 (35.5%) | $66,806 |
| Average | 335 (100.0%) | $79,803 |
Occupancy by Householder Income Bracket in Bingen
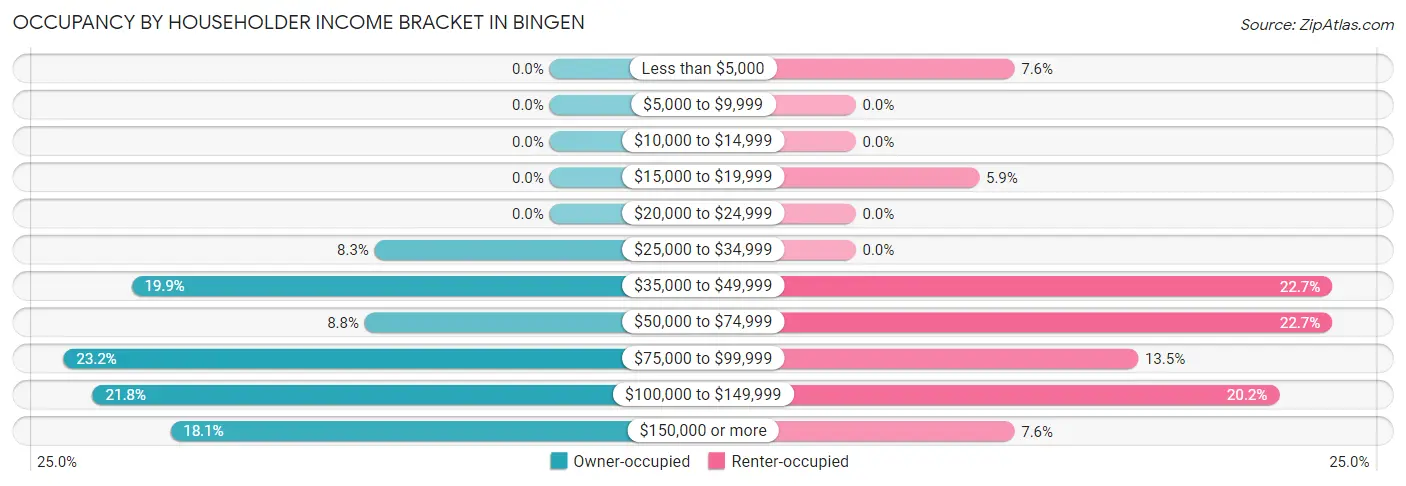
| Income Bracket | Owner-occupied | Renter-occupied |
| Less than $5,000 | 0 (0.0%) | 9 (7.6%) |
| $5,000 to $9,999 | 0 (0.0%) | 0 (0.0%) |
| $10,000 to $14,999 | 0 (0.0%) | 0 (0.0%) |
| $15,000 to $19,999 | 0 (0.0%) | 7 (5.9%) |
| $20,000 to $24,999 | 0 (0.0%) | 0 (0.0%) |
| $25,000 to $34,999 | 18 (8.3%) | 0 (0.0%) |
| $35,000 to $49,999 | 43 (19.9%) | 27 (22.7%) |
| $50,000 to $74,999 | 19 (8.8%) | 27 (22.7%) |
| $75,000 to $99,999 | 50 (23.2%) | 16 (13.5%) |
| $100,000 to $149,999 | 47 (21.8%) | 24 (20.2%) |
| $150,000 or more | 39 (18.1%) | 9 (7.6%) |
| Total | 216 (100.0%) | 119 (100.0%) |
Monthly Housing Cost Tiers in Bingen
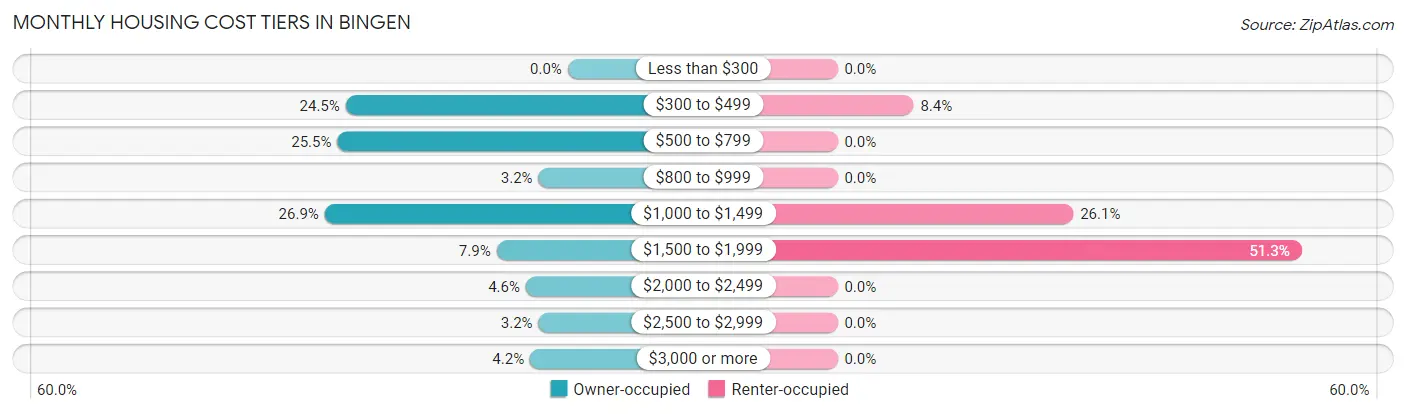
| Monthly Cost | Owner-occupied | Renter-occupied |
| Less than $300 | 0 (0.0%) | 0 (0.0%) |
| $300 to $499 | 53 (24.5%) | 10 (8.4%) |
| $500 to $799 | 55 (25.5%) | 0 (0.0%) |
| $800 to $999 | 7 (3.2%) | 0 (0.0%) |
| $1,000 to $1,499 | 58 (26.9%) | 31 (26.1%) |
| $1,500 to $1,999 | 17 (7.9%) | 61 (51.3%) |
| $2,000 to $2,499 | 10 (4.6%) | 0 (0.0%) |
| $2,500 to $2,999 | 7 (3.2%) | 0 (0.0%) |
| $3,000 or more | 9 (4.2%) | 0 (0.0%) |
| Total | 216 (100.0%) | 119 (100.0%) |
Physical Housing Characteristics in Bingen
Housing Structures in Bingen
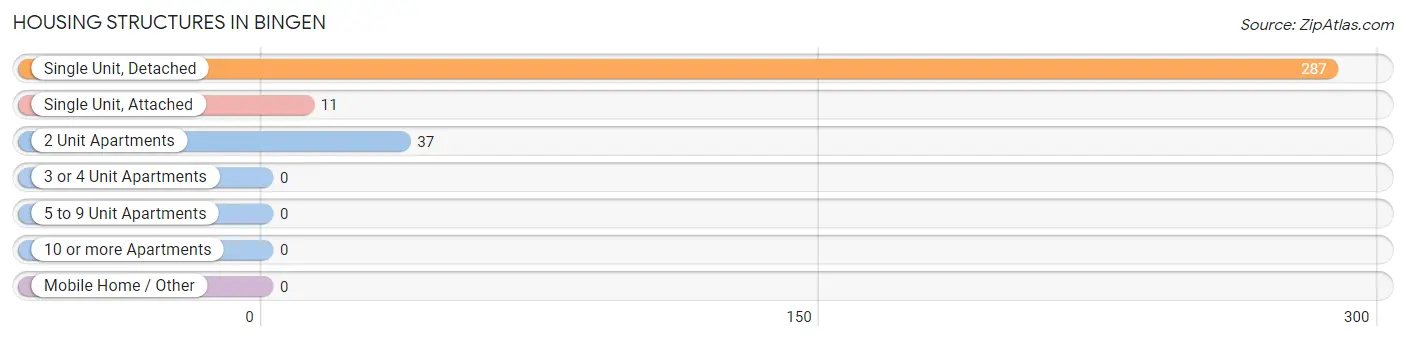
| Structure Type | # Housing Units | % Housing Units |
| Single Unit, Detached | 287 | 85.7% |
| Single Unit, Attached | 11 | 3.3% |
| 2 Unit Apartments | 37 | 11.0% |
| 3 or 4 Unit Apartments | 0 | 0.0% |
| 5 to 9 Unit Apartments | 0 | 0.0% |
| 10 or more Apartments | 0 | 0.0% |
| Mobile Home / Other | 0 | 0.0% |
| Total | 335 | 100.0% |
Housing Structures by Occupancy in Bingen
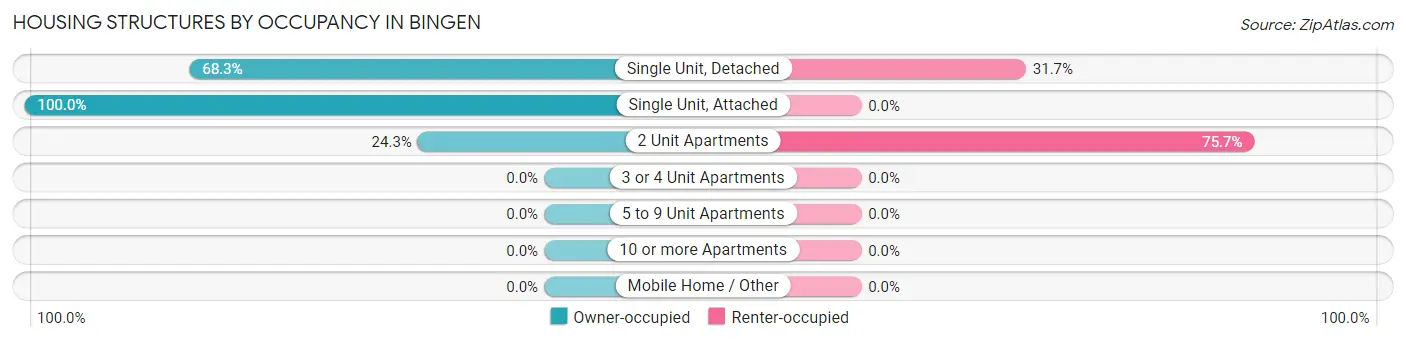
| Structure Type | Owner-occupied | Renter-occupied |
| Single Unit, Detached | 196 (68.3%) | 91 (31.7%) |
| Single Unit, Attached | 11 (100.0%) | 0 (0.0%) |
| 2 Unit Apartments | 9 (24.3%) | 28 (75.7%) |
| 3 or 4 Unit Apartments | 0 (0.0%) | 0 (0.0%) |
| 5 to 9 Unit Apartments | 0 (0.0%) | 0 (0.0%) |
| 10 or more Apartments | 0 (0.0%) | 0 (0.0%) |
| Mobile Home / Other | 0 (0.0%) | 0 (0.0%) |
| Total | 216 (64.5%) | 119 (35.5%) |
Housing Structures by Number of Rooms in Bingen
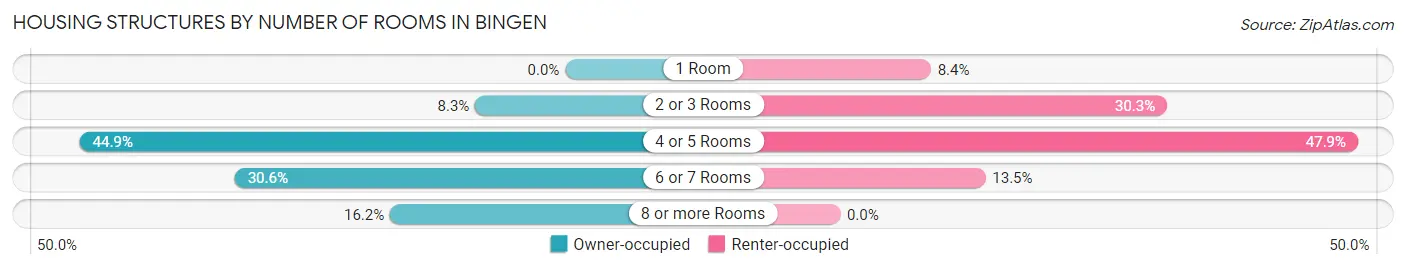
| Number of Rooms | Owner-occupied | Renter-occupied |
| 1 Room | 0 (0.0%) | 10 (8.4%) |
| 2 or 3 Rooms | 18 (8.3%) | 36 (30.2%) |
| 4 or 5 Rooms | 97 (44.9%) | 57 (47.9%) |
| 6 or 7 Rooms | 66 (30.6%) | 16 (13.5%) |
| 8 or more Rooms | 35 (16.2%) | 0 (0.0%) |
| Total | 216 (100.0%) | 119 (100.0%) |
Housing Structure by Heating Type in Bingen
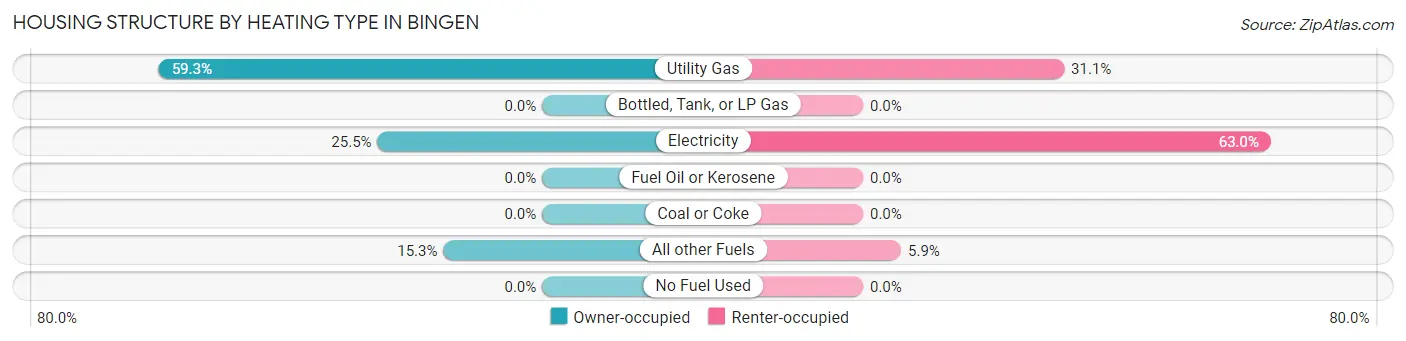
| Heating Type | Owner-occupied | Renter-occupied |
| Utility Gas | 128 (59.3%) | 37 (31.1%) |
| Bottled, Tank, or LP Gas | 0 (0.0%) | 0 (0.0%) |
| Electricity | 55 (25.5%) | 75 (63.0%) |
| Fuel Oil or Kerosene | 0 (0.0%) | 0 (0.0%) |
| Coal or Coke | 0 (0.0%) | 0 (0.0%) |
| All other Fuels | 33 (15.3%) | 7 (5.9%) |
| No Fuel Used | 0 (0.0%) | 0 (0.0%) |
| Total | 216 (100.0%) | 119 (100.0%) |
Household Vehicle Usage in Bingen
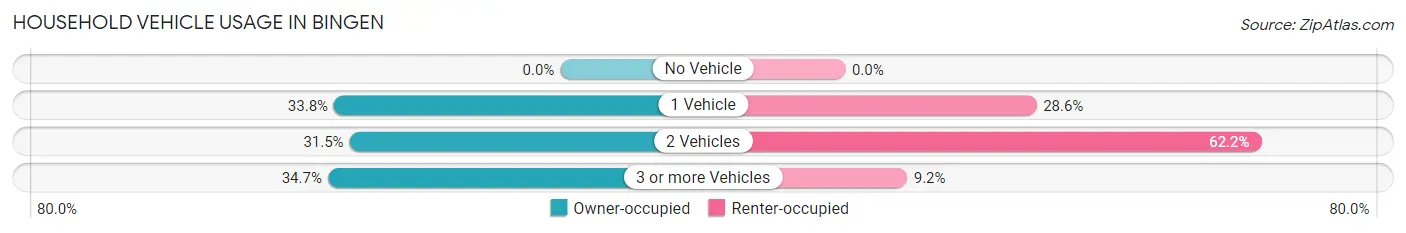
| Vehicles per Household | Owner-occupied | Renter-occupied |
| No Vehicle | 0 (0.0%) | 0 (0.0%) |
| 1 Vehicle | 73 (33.8%) | 34 (28.6%) |
| 2 Vehicles | 68 (31.5%) | 74 (62.2%) |
| 3 or more Vehicles | 75 (34.7%) | 11 (9.2%) |
| Total | 216 (100.0%) | 119 (100.0%) |
Real Estate & Mortgages in Bingen
Real Estate and Mortgage Overview in Bingen
| Characteristic | Without Mortgage | With Mortgage |
| Housing Units | 108 | 108 |
| Median Property Value | $329,700 | $300,000 |
| Median Household Income | - | - |
| Monthly Housing Costs | $511 | $9 |
| Real Estate Taxes | $1,630 | $0 |
Property Value by Mortgage Status in Bingen
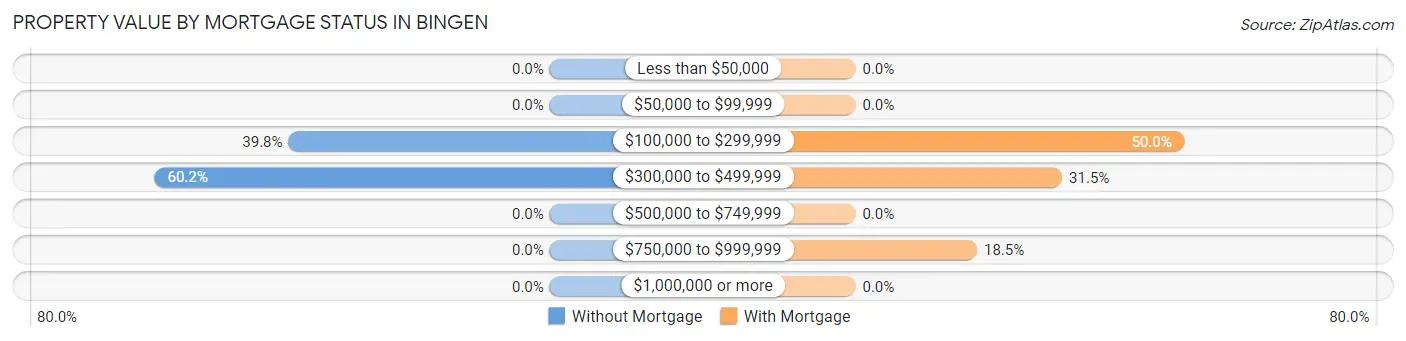
| Property Value | Without Mortgage | With Mortgage |
| Less than $50,000 | 0 (0.0%) | 0 (0.0%) |
| $50,000 to $99,999 | 0 (0.0%) | 0 (0.0%) |
| $100,000 to $299,999 | 43 (39.8%) | 54 (50.0%) |
| $300,000 to $499,999 | 65 (60.2%) | 34 (31.5%) |
| $500,000 to $749,999 | 0 (0.0%) | 0 (0.0%) |
| $750,000 to $999,999 | 0 (0.0%) | 20 (18.5%) |
| $1,000,000 or more | 0 (0.0%) | 0 (0.0%) |
| Total | 108 (100.0%) | 108 (100.0%) |
Household Income by Mortgage Status in Bingen
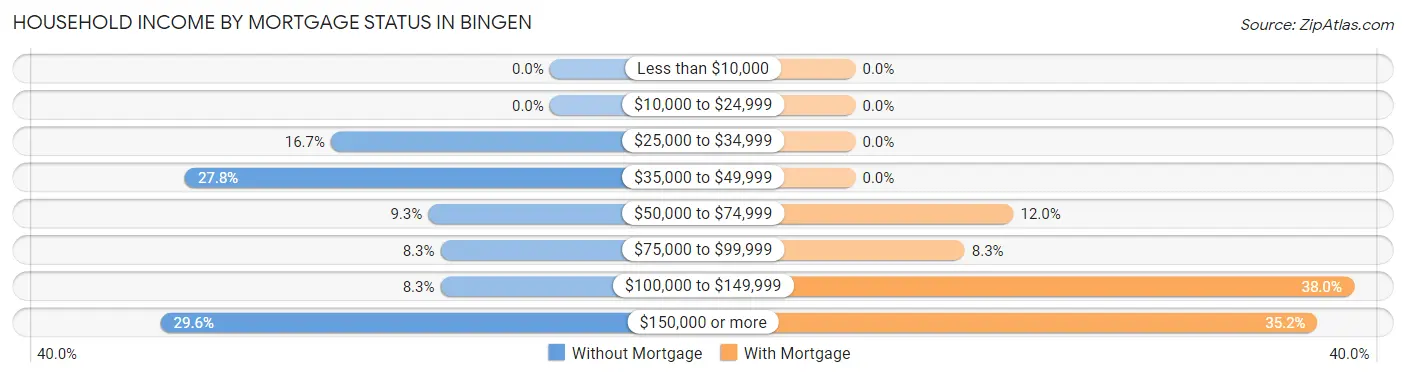
| Household Income | Without Mortgage | With Mortgage |
| Less than $10,000 | 0 (0.0%) | 0 (0.0%) |
| $10,000 to $24,999 | 0 (0.0%) | 0 (0.0%) |
| $25,000 to $34,999 | 18 (16.7%) | 0 (0.0%) |
| $35,000 to $49,999 | 30 (27.8%) | 0 (0.0%) |
| $50,000 to $74,999 | 10 (9.3%) | 13 (12.0%) |
| $75,000 to $99,999 | 9 (8.3%) | 9 (8.3%) |
| $100,000 to $149,999 | 9 (8.3%) | 41 (38.0%) |
| $150,000 or more | 32 (29.6%) | 38 (35.2%) |
| Total | 108 (100.0%) | 108 (100.0%) |
Property Value to Household Income Ratio in Bingen
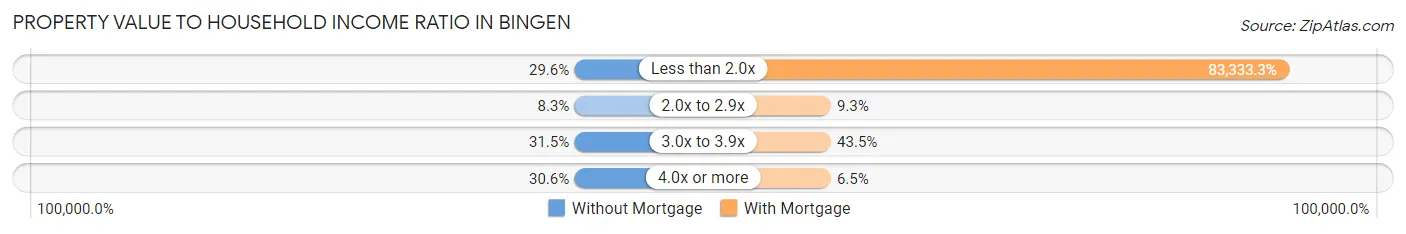
| Value-to-Income Ratio | Without Mortgage | With Mortgage |
| Less than 2.0x | 32 (29.6%) | 90,000 (83,333.3%) |
| 2.0x to 2.9x | 9 (8.3%) | 10 (9.3%) |
| 3.0x to 3.9x | 34 (31.5%) | 47 (43.5%) |
| 4.0x or more | 33 (30.6%) | 7 (6.5%) |
| Total | 108 (100.0%) | 108 (100.0%) |
Real Estate Taxes by Mortgage Status in Bingen
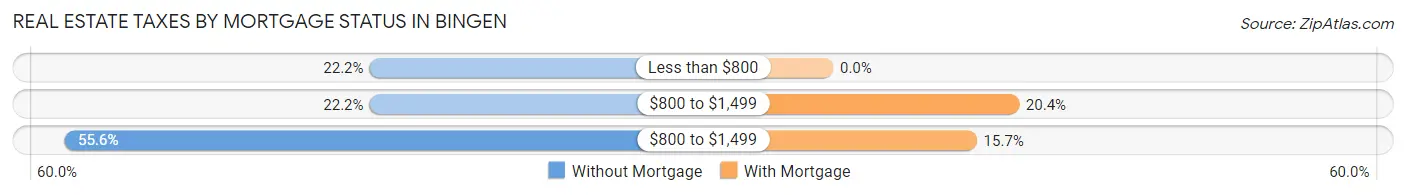
| Property Taxes | Without Mortgage | With Mortgage |
| Less than $800 | 24 (22.2%) | 0 (0.0%) |
| $800 to $1,499 | 24 (22.2%) | 22 (20.4%) |
| $800 to $1,499 | 60 (55.6%) | 17 (15.7%) |
| Total | 108 (100.0%) | 108 (100.0%) |
Health & Disability in Bingen
Health Insurance Coverage by Age in Bingen
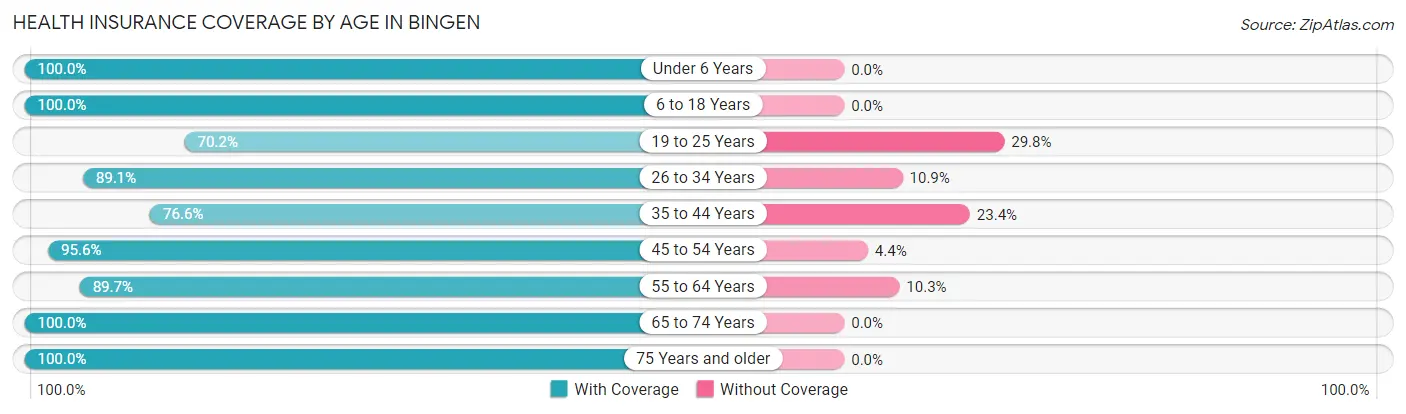
| Age Bracket | With Coverage | Without Coverage |
| Under 6 Years | 67 (100.0%) | 0 (0.0%) |
| 6 to 18 Years | 119 (100.0%) | 0 (0.0%) |
| 19 to 25 Years | 87 (70.2%) | 37 (29.8%) |
| 26 to 34 Years | 82 (89.1%) | 10 (10.9%) |
| 35 to 44 Years | 121 (76.6%) | 37 (23.4%) |
| 45 to 54 Years | 152 (95.6%) | 7 (4.4%) |
| 55 to 64 Years | 96 (89.7%) | 11 (10.3%) |
| 65 to 74 Years | 64 (100.0%) | 0 (0.0%) |
| 75 Years and older | 43 (100.0%) | 0 (0.0%) |
| Total | 831 (89.1%) | 102 (10.9%) |
Health Insurance Coverage by Citizenship Status in Bingen
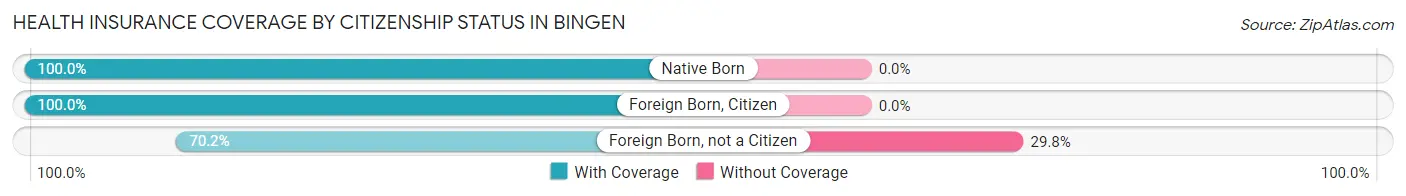
| Citizenship Status | With Coverage | Without Coverage |
| Native Born | 67 (100.0%) | 0 (0.0%) |
| Foreign Born, Citizen | 119 (100.0%) | 0 (0.0%) |
| Foreign Born, not a Citizen | 87 (70.2%) | 37 (29.8%) |
Health Insurance Coverage by Household Income in Bingen
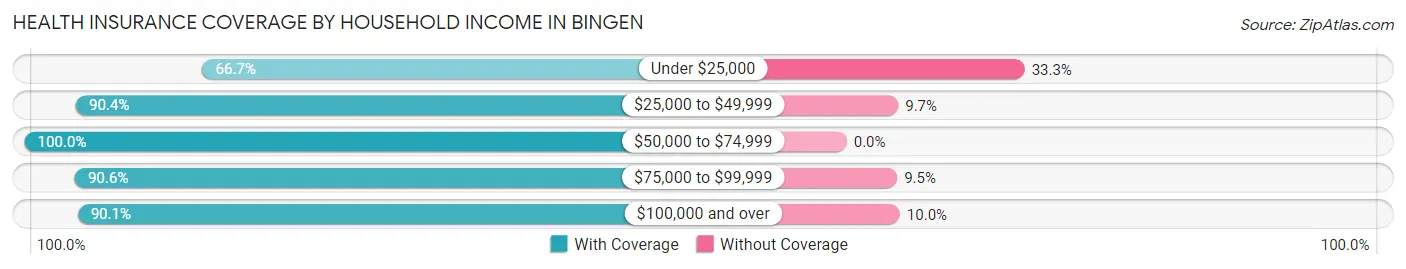
| Household Income | With Coverage | Without Coverage |
| Under $25,000 | 18 (66.7%) | 9 (33.3%) |
| $25,000 to $49,999 | 206 (90.3%) | 22 (9.7%) |
| $50,000 to $74,999 | 75 (100.0%) | 0 (0.0%) |
| $75,000 to $99,999 | 182 (90.5%) | 19 (9.5%) |
| $100,000 and over | 335 (90.0%) | 37 (10.0%) |
Public vs Private Health Insurance Coverage by Age in Bingen
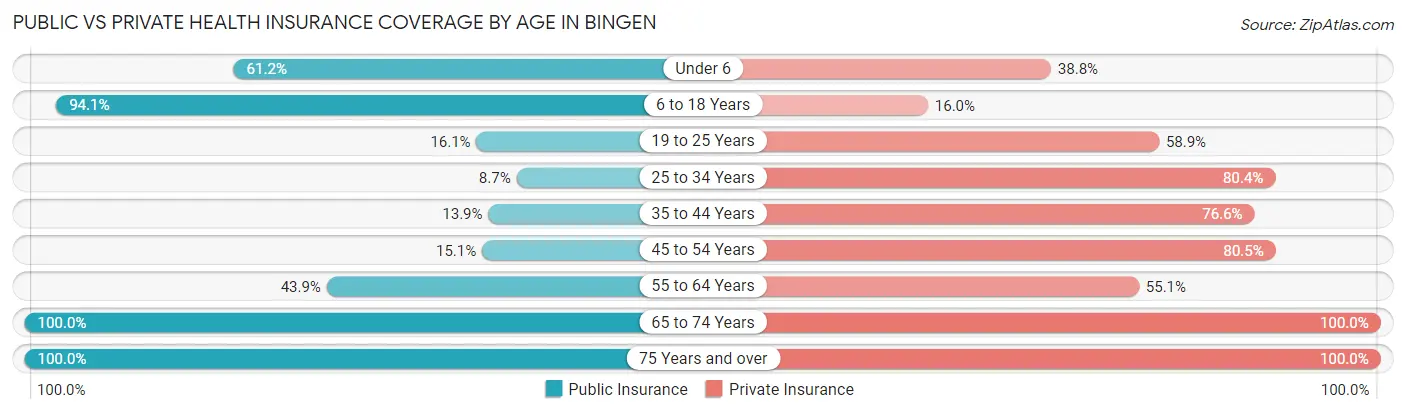
| Age Bracket | Public Insurance | Private Insurance |
| Under 6 | 41 (61.2%) | 26 (38.8%) |
| 6 to 18 Years | 112 (94.1%) | 19 (16.0%) |
| 19 to 25 Years | 20 (16.1%) | 73 (58.9%) |
| 25 to 34 Years | 8 (8.7%) | 74 (80.4%) |
| 35 to 44 Years | 22 (13.9%) | 121 (76.6%) |
| 45 to 54 Years | 24 (15.1%) | 128 (80.5%) |
| 55 to 64 Years | 47 (43.9%) | 59 (55.1%) |
| 65 to 74 Years | 64 (100.0%) | 64 (100.0%) |
| 75 Years and over | 43 (100.0%) | 43 (100.0%) |
| Total | 381 (40.8%) | 607 (65.1%) |
Disability Status by Sex by Age in Bingen
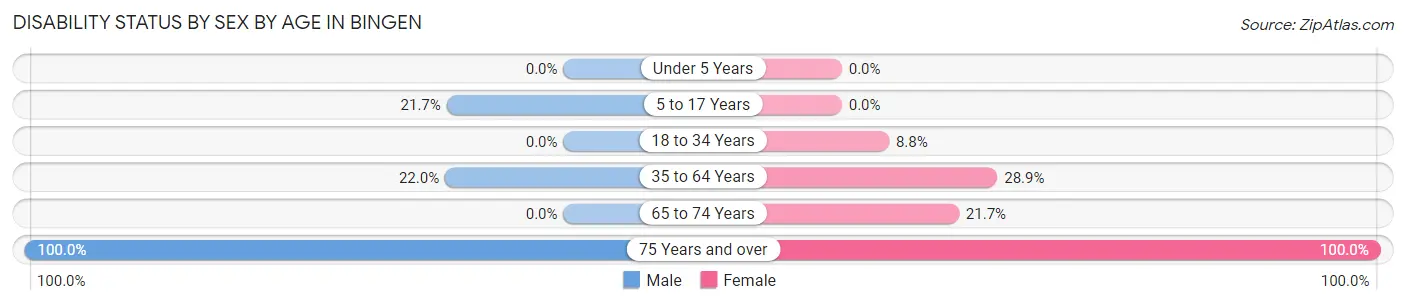
| Age Bracket | Male | Female |
| Under 5 Years | 0 (0.0%) | 0 (0.0%) |
| 5 to 17 Years | 13 (21.7%) | 0 (0.0%) |
| 18 to 34 Years | 0 (0.0%) | 12 (8.8%) |
| 35 to 64 Years | 49 (22.0%) | 58 (28.9%) |
| 65 to 74 Years | 0 (0.0%) | 10 (21.7%) |
| 75 Years and over | 17 (100.0%) | 26 (100.0%) |
Disability Class by Sex by Age in Bingen
Disability Class: Hearing Difficulty
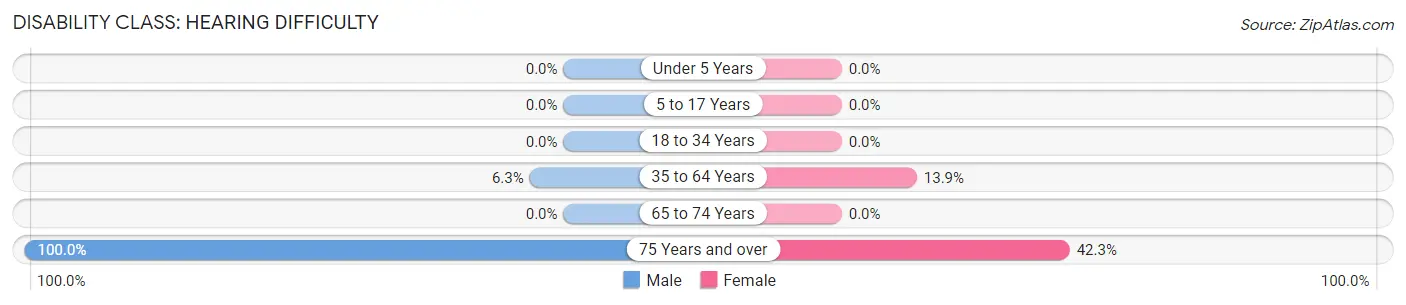
| Age Bracket | Male | Female |
| Under 5 Years | 0 (0.0%) | 0 (0.0%) |
| 5 to 17 Years | 0 (0.0%) | 0 (0.0%) |
| 18 to 34 Years | 0 (0.0%) | 0 (0.0%) |
| 35 to 64 Years | 14 (6.3%) | 28 (13.9%) |
| 65 to 74 Years | 0 (0.0%) | 0 (0.0%) |
| 75 Years and over | 17 (100.0%) | 11 (42.3%) |
Disability Class: Vision Difficulty
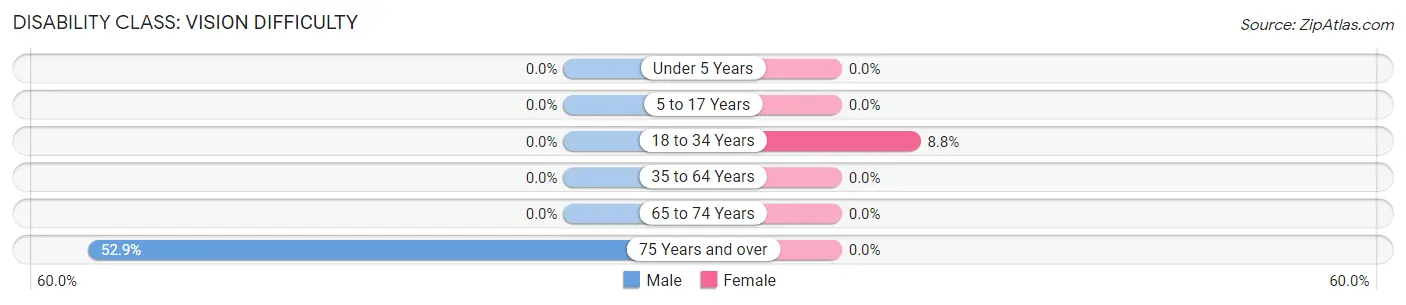
| Age Bracket | Male | Female |
| Under 5 Years | 0 (0.0%) | 0 (0.0%) |
| 5 to 17 Years | 0 (0.0%) | 0 (0.0%) |
| 18 to 34 Years | 0 (0.0%) | 12 (8.8%) |
| 35 to 64 Years | 0 (0.0%) | 0 (0.0%) |
| 65 to 74 Years | 0 (0.0%) | 0 (0.0%) |
| 75 Years and over | 9 (52.9%) | 0 (0.0%) |
Disability Class: Cognitive Difficulty
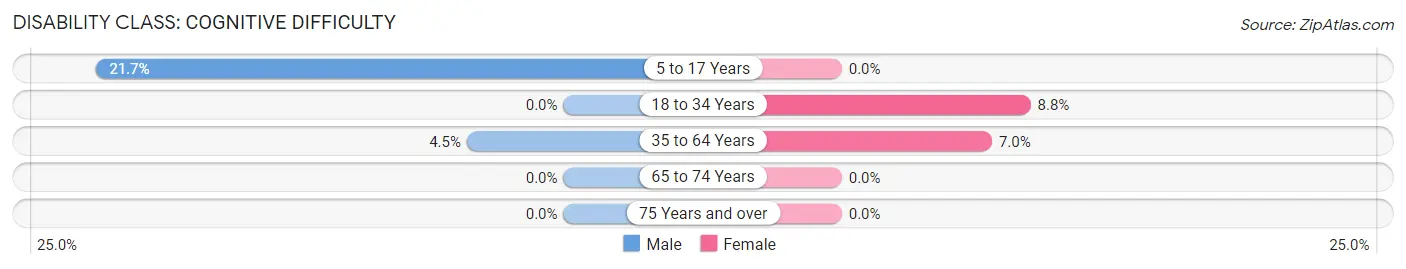
| Age Bracket | Male | Female |
| 5 to 17 Years | 13 (21.7%) | 0 (0.0%) |
| 18 to 34 Years | 0 (0.0%) | 12 (8.8%) |
| 35 to 64 Years | 10 (4.5%) | 14 (7.0%) |
| 65 to 74 Years | 0 (0.0%) | 0 (0.0%) |
| 75 Years and over | 0 (0.0%) | 0 (0.0%) |
Disability Class: Ambulatory Difficulty
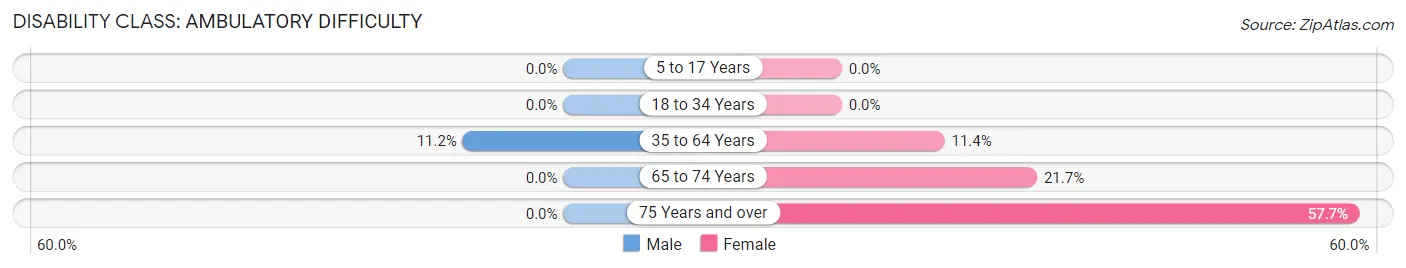
| Age Bracket | Male | Female |
| 5 to 17 Years | 0 (0.0%) | 0 (0.0%) |
| 18 to 34 Years | 0 (0.0%) | 0 (0.0%) |
| 35 to 64 Years | 25 (11.2%) | 23 (11.4%) |
| 65 to 74 Years | 0 (0.0%) | 10 (21.7%) |
| 75 Years and over | 0 (0.0%) | 15 (57.7%) |
Disability Class: Self-Care Difficulty
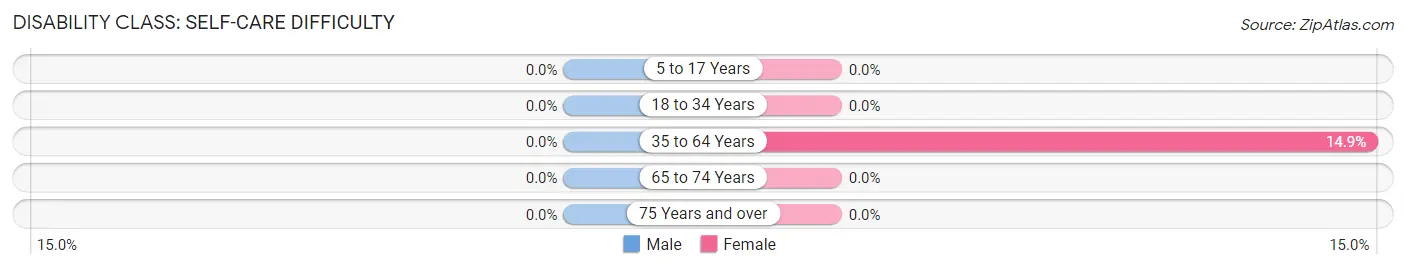
| Age Bracket | Male | Female |
| 5 to 17 Years | 0 (0.0%) | 0 (0.0%) |
| 18 to 34 Years | 0 (0.0%) | 0 (0.0%) |
| 35 to 64 Years | 0 (0.0%) | 30 (14.9%) |
| 65 to 74 Years | 0 (0.0%) | 0 (0.0%) |
| 75 Years and over | 0 (0.0%) | 0 (0.0%) |
Technology Access in Bingen
Computing Device Access in Bingen
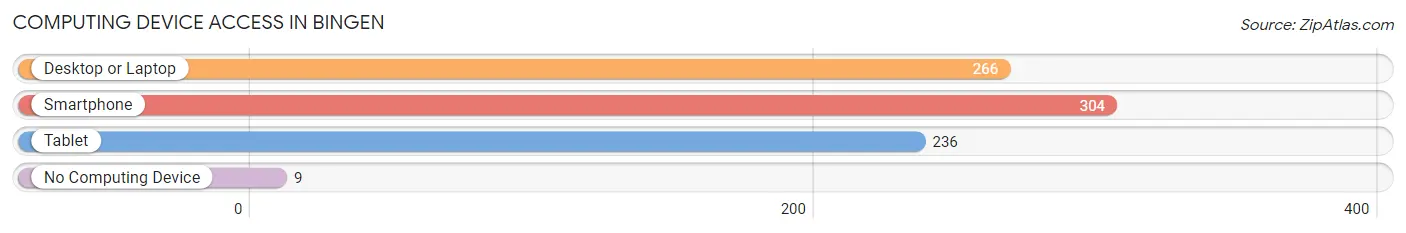
| Device Type | # Households | % Households |
| Desktop or Laptop | 266 | 79.4% |
| Smartphone | 304 | 90.7% |
| Tablet | 236 | 70.5% |
| No Computing Device | 9 | 2.7% |
| Total | 335 | 100.0% |
Internet Access in Bingen
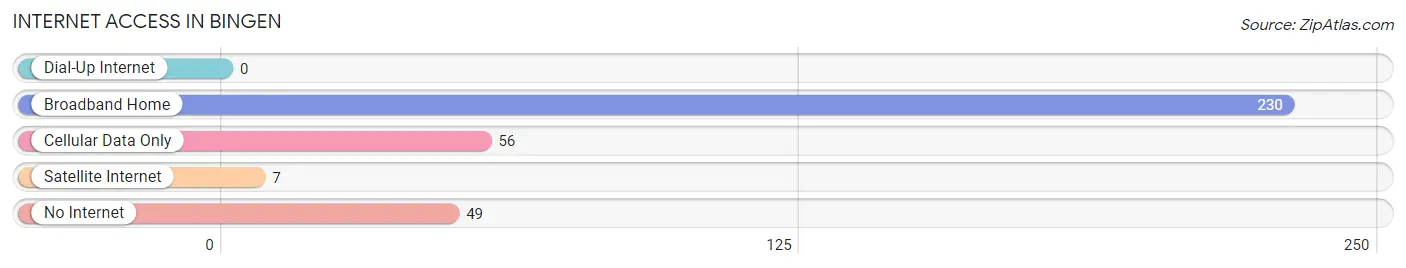
| Internet Type | # Households | % Households |
| Dial-Up Internet | 0 | 0.0% |
| Broadband Home | 230 | 68.7% |
| Cellular Data Only | 56 | 16.7% |
| Satellite Internet | 7 | 2.1% |
| No Internet | 49 | 14.6% |
| Total | 335 | 100.0% |
Bingen Summary
Bingen, Washington is a small town located in the Columbia River Gorge in Klickitat County, Washington. It is situated on the Washington side of the Columbia River, just across from the Oregon border. The town is named after the nearby Bingen Point, which was named after a German town of the same name. Bingen is known for its scenic beauty, outdoor recreation, and its proximity to the Columbia River Gorge National Scenic Area.
Geography
Bingen is located in the Columbia River Gorge, a deep canyon carved by the Columbia River. The town is situated on the Washington side of the river, just across from the Oregon border. The town is surrounded by the Columbia River to the north, the White Salmon River to the east, and the Klickitat River to the south. The town is located at an elevation of about 500 feet above sea level.
The climate in Bingen is mild and temperate, with warm summers and cool winters. The average annual temperature is around 50 degrees Fahrenheit. The average annual precipitation is around 30 inches.
Economy
The economy of Bingen is largely based on tourism and outdoor recreation. The town is a popular destination for hikers, campers, and other outdoor enthusiasts. The town is also home to several wineries, breweries, and distilleries.
The town is also home to several businesses, including a grocery store, a hardware store, a restaurant, and a few other small businesses. The town is also home to a few small manufacturing companies.
Demographics
As of the 2010 census, the population of Bingen was 1,334. The racial makeup of the town was 94.3% White, 0.7% African American, 0.7% Native American, 0.7% Asian, 0.2% Pacific Islander, 0.7% from other races, and 2.3% from two or more races. Hispanic or Latino of any race were 3.3% of the population.
The median income for a household in Bingen was $37,500, and the median income for a family was $45,000. The per capita income for the town was $20,000. About 11.3% of families and 14.3% of the population were below the poverty line, including 18.2% of those under age 18 and 8.3% of those age 65 or over.
History
Bingen was first settled in the late 1800s by settlers from Germany. The town was originally known as “Bingen Point”, and was named after a German town of the same name. The town was officially incorporated in 1909.
In the early 1900s, the town was a popular destination for tourists, and was home to several hotels and resorts. The town was also home to several industries, including a sawmill, a flour mill, and a cannery.
In the late 1900s, the town began to decline as the local industries closed down. The town was revitalized in the late 1990s, when the Columbia River Gorge National Scenic Area was established. The town has since become a popular destination for outdoor recreation and tourism.
Common Questions
What is Per Capita Income in Bingen?
Per Capita income in Bingen is $36,732.
What is the Median Family Income in Bingen?
Median Family Income in Bingen is $83,698.
What is the Median Household income in Bingen?
Median Household Income in Bingen is $79,803.
What is Income or Wage Gap in Bingen?
Income or Wage Gap in Bingen is 12.4%.
Women in Bingen earn 87.6 cents for every dollar earned by a man.
What is Inequality or Gini Index in Bingen?
Inequality or Gini Index in Bingen is 0.34.
What is the Total Population of Bingen?
Total Population of Bingen is 933.
What is the Total Male Population of Bingen?
Total Male Population of Bingen is 461.
What is the Total Female Population of Bingen?
Total Female Population of Bingen is 472.
What is the Ratio of Males per 100 Females in Bingen?
There are 97.67 Males per 100 Females in Bingen.
What is the Ratio of Females per 100 Males in Bingen?
There are 102.39 Females per 100 Males in Bingen.
What is the Median Population Age in Bingen?
Median Population Age in Bingen is 37.6 Years.
What is the Average Family Size in Bingen
Average Family Size in Bingen is 3.6 People.
What is the Average Household Size in Bingen
Average Household Size in Bingen is 2.7 People.
How Large is the Labor Force in Bingen?
There are 518 People in the Labor Forcein in Bingen.
What is the Percentage of People in the Labor Force in Bingen?
66.3% of People are in the Labor Force in Bingen.
What is the Unemployment Rate in Bingen?
Unemployment Rate in Bingen is 4.4%.