Mossyrock, WA Map & Demographics
Mossyrock Map
Mossyrock Overview
$19,909
PER CAPITA INCOME
$51,382
AVG FAMILY INCOME
$39,450
AVG HOUSEHOLD INCOME
48.1%
WAGE / INCOME GAP [ % ]
51.9¢/ $1
WAGE / INCOME GAP [ $ ]
0.43
INEQUALITY / GINI INDEX
911
TOTAL POPULATION
453
MALE POPULATION
458
FEMALE POPULATION
98.91
MALES / 100 FEMALES
101.10
FEMALES / 100 MALES
28.6
MEDIAN AGE
4.1
AVG FAMILY SIZE
3.1
AVG HOUSEHOLD SIZE
332
LABOR FORCE [ PEOPLE ]
58.3%
PERCENT IN LABOR FORCE
3.9%
UNEMPLOYMENT RATE
Mossyrock Zip Codes
Mossyrock Area Codes
Income in Mossyrock
Income Overview in Mossyrock
Per Capita Income in Mossyrock is $19,909, while median incomes of families and households are $51,382 and $39,450 respectively.
| Characteristic | Number | Measure |
| Per Capita Income | 911 | $19,909 |
| Median Family Income | 197 | $51,382 |
| Mean Family Income | 197 | $65,302 |
| Median Household Income | 293 | $39,450 |
| Mean Household Income | 293 | $60,485 |
| Income Deficit | 197 | $0 |
| Wage / Income Gap (%) | 911 | 48.15% |
| Wage / Income Gap ($) | 911 | 51.85¢ per $1 |
| Gini / Inequality Index | 911 | 0.43 |
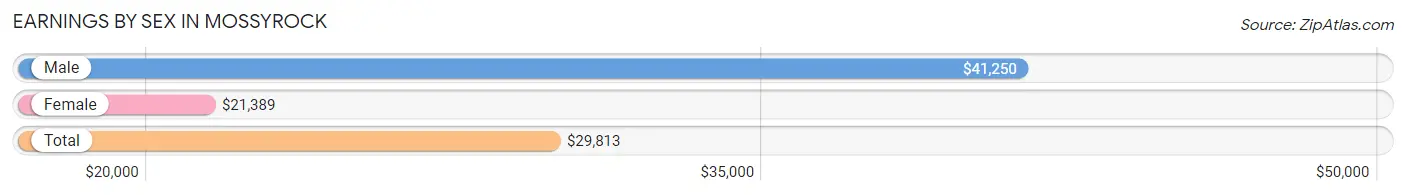
Earnings by Sex in Mossyrock
Average Earnings in Mossyrock are $29,813, $41,250 for men and $21,389 for women, a difference of 48.1%.
| Sex | Number | Average Earnings |
| Male | 162 (44.8%) | $41,250 |
| Female | 200 (55.2%) | $21,389 |
| Total | 362 (100.0%) | $29,813 |
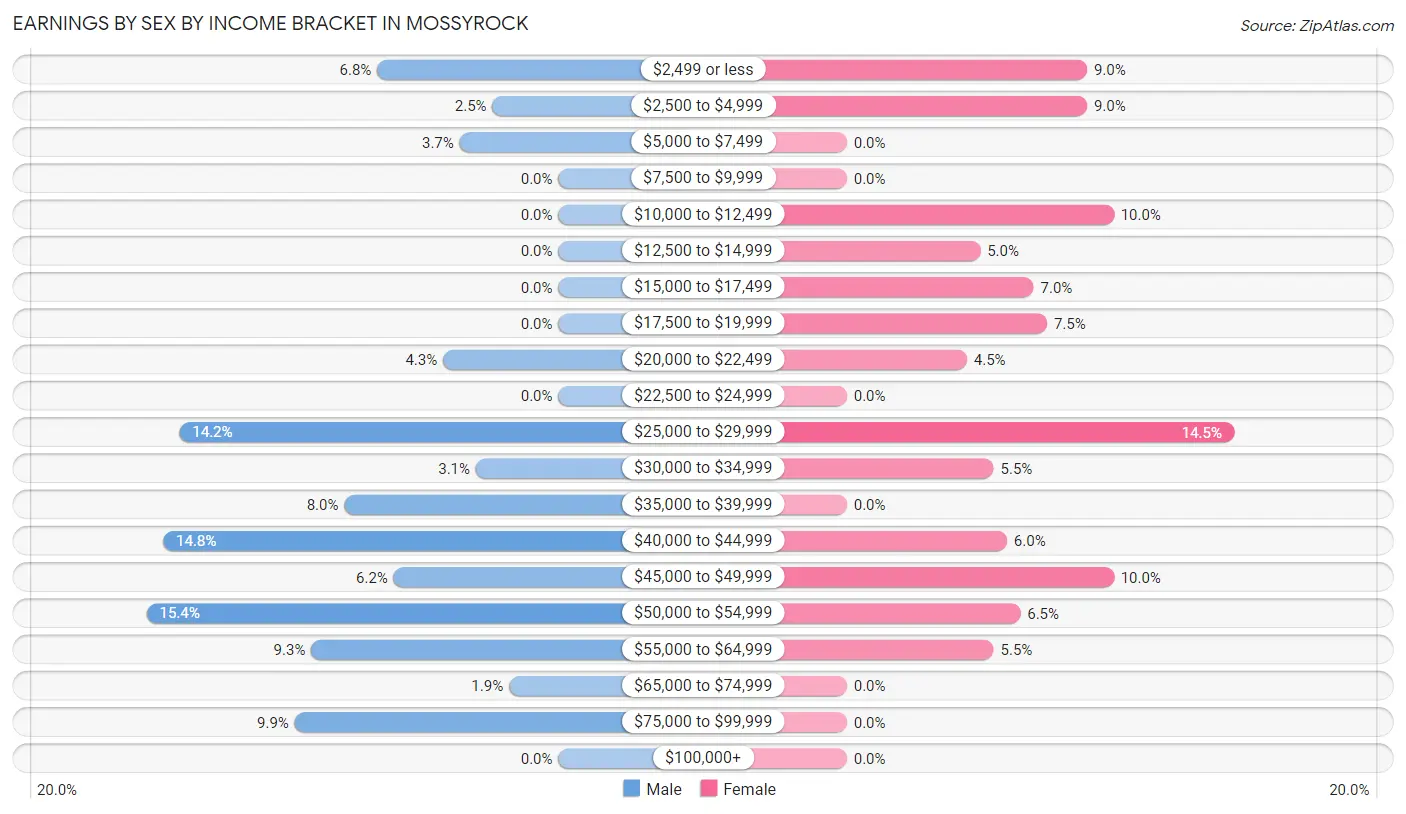
Earnings by Sex by Income Bracket in Mossyrock
The most common earnings brackets in Mossyrock are $50,000 to $54,999 for men (25 | 15.4%) and $25,000 to $29,999 for women (29 | 14.5%).
| Income | Male | Female |
| $2,499 or less | 11 (6.8%) | 18 (9.0%) |
| $2,500 to $4,999 | 4 (2.5%) | 18 (9.0%) |
| $5,000 to $7,499 | 6 (3.7%) | 0 (0.0%) |
| $7,500 to $9,999 | 0 (0.0%) | 0 (0.0%) |
| $10,000 to $12,499 | 0 (0.0%) | 20 (10.0%) |
| $12,500 to $14,999 | 0 (0.0%) | 10 (5.0%) |
| $15,000 to $17,499 | 0 (0.0%) | 14 (7.0%) |
| $17,500 to $19,999 | 0 (0.0%) | 15 (7.5%) |
| $20,000 to $22,499 | 7 (4.3%) | 9 (4.5%) |
| $22,500 to $24,999 | 0 (0.0%) | 0 (0.0%) |
| $25,000 to $29,999 | 23 (14.2%) | 29 (14.5%) |
| $30,000 to $34,999 | 5 (3.1%) | 11 (5.5%) |
| $35,000 to $39,999 | 13 (8.0%) | 0 (0.0%) |
| $40,000 to $44,999 | 24 (14.8%) | 12 (6.0%) |
| $45,000 to $49,999 | 10 (6.2%) | 20 (10.0%) |
| $50,000 to $54,999 | 25 (15.4%) | 13 (6.5%) |
| $55,000 to $64,999 | 15 (9.3%) | 11 (5.5%) |
| $65,000 to $74,999 | 3 (1.8%) | 0 (0.0%) |
| $75,000 to $99,999 | 16 (9.9%) | 0 (0.0%) |
| $100,000+ | 0 (0.0%) | 0 (0.0%) |
| Total | 162 (100.0%) | 200 (100.0%) |
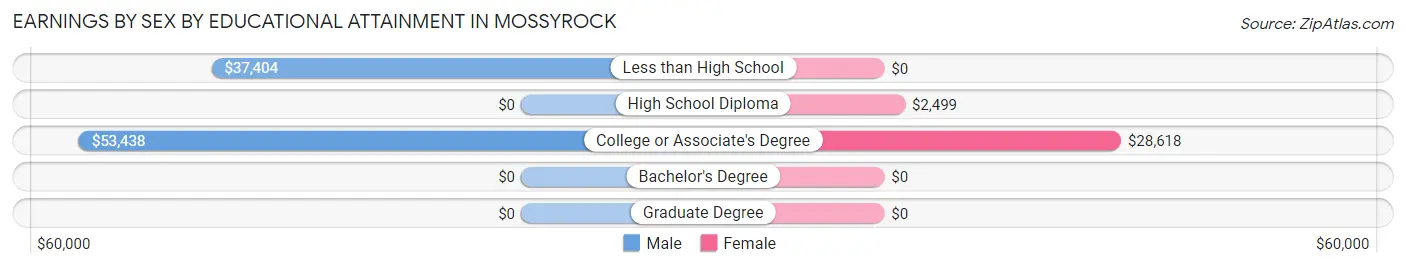
Earnings by Sex by Educational Attainment in Mossyrock
Average earnings in Mossyrock are $45,375 for men and $27,895 for women, a difference of 38.5%. Men with an educational attainment of college or associate's degree enjoy the highest average annual earnings of $53,438, while those with less than high school education earn the least with $37,404. Women with an educational attainment of college or associate's degree earn the most with the average annual earnings of $28,618, while those with high school diploma education have the smallest earnings of $2,499.
| Educational Attainment | Male Income | Female Income |
| Less than High School | $37,404 | $0 |
| High School Diploma | - | - |
| College or Associate's Degree | $53,438 | $28,618 |
| Bachelor's Degree | - | - |
| Graduate Degree | - | - |
| Total | $45,375 | $27,895 |
Family Income in Mossyrock
Family Income Brackets in Mossyrock
According to the Mossyrock family income data, there are 49 families falling into the $100,000 to $149,999 income range, which is the most common income bracket and makes up 24.9% of all families.
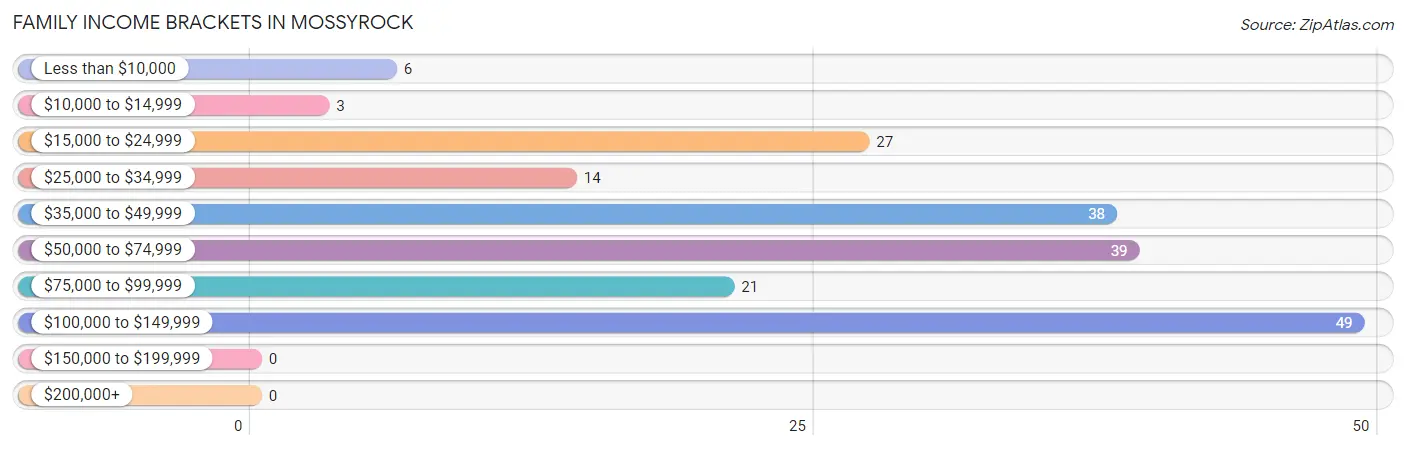
| Income Bracket | # Families | % Families |
| Less than $10,000 | 6 | 3.0% |
| $10,000 to $14,999 | 3 | 1.5% |
| $15,000 to $24,999 | 27 | 13.7% |
| $25,000 to $34,999 | 14 | 7.1% |
| $35,000 to $49,999 | 38 | 19.3% |
| $50,000 to $74,999 | 39 | 19.8% |
| $75,000 to $99,999 | 21 | 10.7% |
| $100,000 to $149,999 | 49 | 24.9% |
| $150,000 to $199,999 | 0 | 0.0% |
| $200,000+ | 0 | 0.0% |
Family Income by Famaliy Size in Mossyrock
6-person families (26 | 13.2%) account for the highest median family income in Mossyrock with $101,250 per family, while 2-person families (52 | 26.4%) have the highest median income of $32,143 per family member.
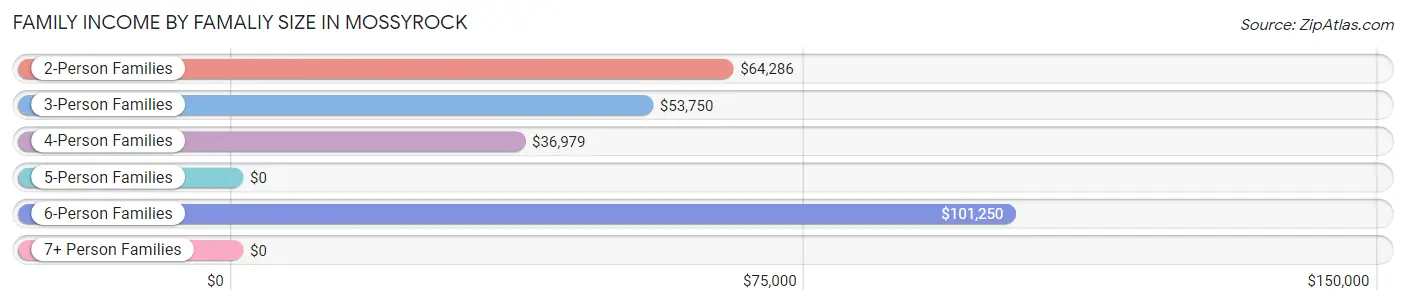
| Income Bracket | # Families | Median Income |
| 2-Person Families | 52 (26.4%) | $64,286 |
| 3-Person Families | 38 (19.3%) | $53,750 |
| 4-Person Families | 59 (29.9%) | $36,979 |
| 5-Person Families | 22 (11.2%) | $0 |
| 6-Person Families | 26 (13.2%) | $101,250 |
| 7+ Person Families | 0 (0.0%) | $0 |
| Total | 197 (100.0%) | $51,382 |
Family Income by Number of Earners in Mossyrock
The median family income in Mossyrock is $51,382, with families comprising 3+ earners (32) having the highest median family income of $138,333, while families with no earners (34) have the lowest median family income of $19,688, accounting for 16.2% and 17.3% of families, respectively.
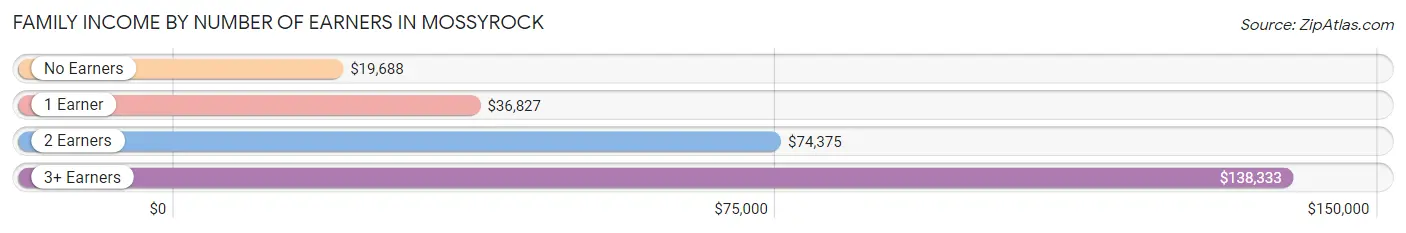
| Number of Earners | # Families | Median Income |
| No Earners | 34 (17.3%) | $19,688 |
| 1 Earner | 65 (33.0%) | $36,827 |
| 2 Earners | 66 (33.5%) | $74,375 |
| 3+ Earners | 32 (16.2%) | $138,333 |
| Total | 197 (100.0%) | $51,382 |
Household Income in Mossyrock
Household Income Brackets in Mossyrock
With 67 households falling in the category, the $35,000 to $49,999 income range is the most frequent in Mossyrock, accounting for 22.9% of all households.
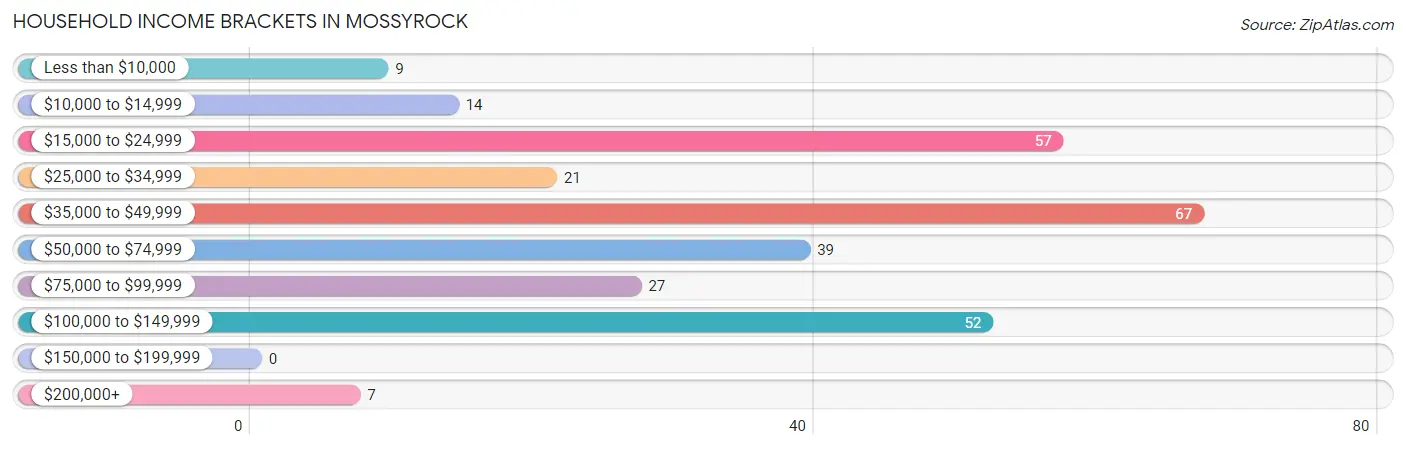
| Income Bracket | # Households | % Households |
| Less than $10,000 | 9 | 3.1% |
| $10,000 to $14,999 | 14 | 4.8% |
| $15,000 to $24,999 | 57 | 19.5% |
| $25,000 to $34,999 | 21 | 7.2% |
| $35,000 to $49,999 | 67 | 22.9% |
| $50,000 to $74,999 | 39 | 13.3% |
| $75,000 to $99,999 | 27 | 9.2% |
| $100,000 to $149,999 | 52 | 17.7% |
| $150,000 to $199,999 | 0 | 0.0% |
| $200,000+ | 7 | 2.4% |
Household Income by Householder Age in Mossyrock
The median household income in Mossyrock is $39,450, with the highest median household income of $41,389 found in the 25 to 44 years age bracket for the primary householder. A total of 102 households (34.8%) fall into this category. Meanwhile, the 15 to 24 years age bracket for the primary householder has the lowest median household income of $0, with 5 households (1.7%) in this group.
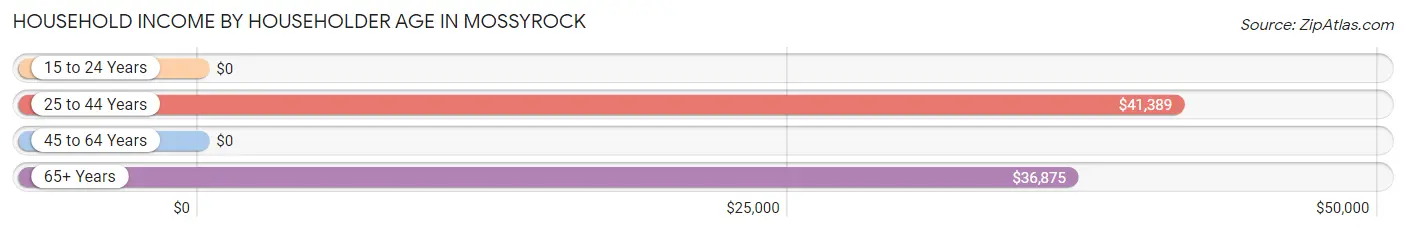
| Income Bracket | # Households | Median Income |
| 15 to 24 Years | 5 (1.7%) | $0 |
| 25 to 44 Years | 102 (34.8%) | $41,389 |
| 45 to 64 Years | 100 (34.1%) | $0 |
| 65+ Years | 86 (29.3%) | $36,875 |
| Total | 293 (100.0%) | $39,450 |
Poverty in Mossyrock
Income Below Poverty by Sex and Age in Mossyrock
With 21.6% poverty level for males and 25.6% for females among the residents of Mossyrock, 5 year old males and 6 to 11 year old females are the most vulnerable to poverty, with 8 males (88.9%) and 58 females (69.9%) in their respective age groups living below the poverty level.
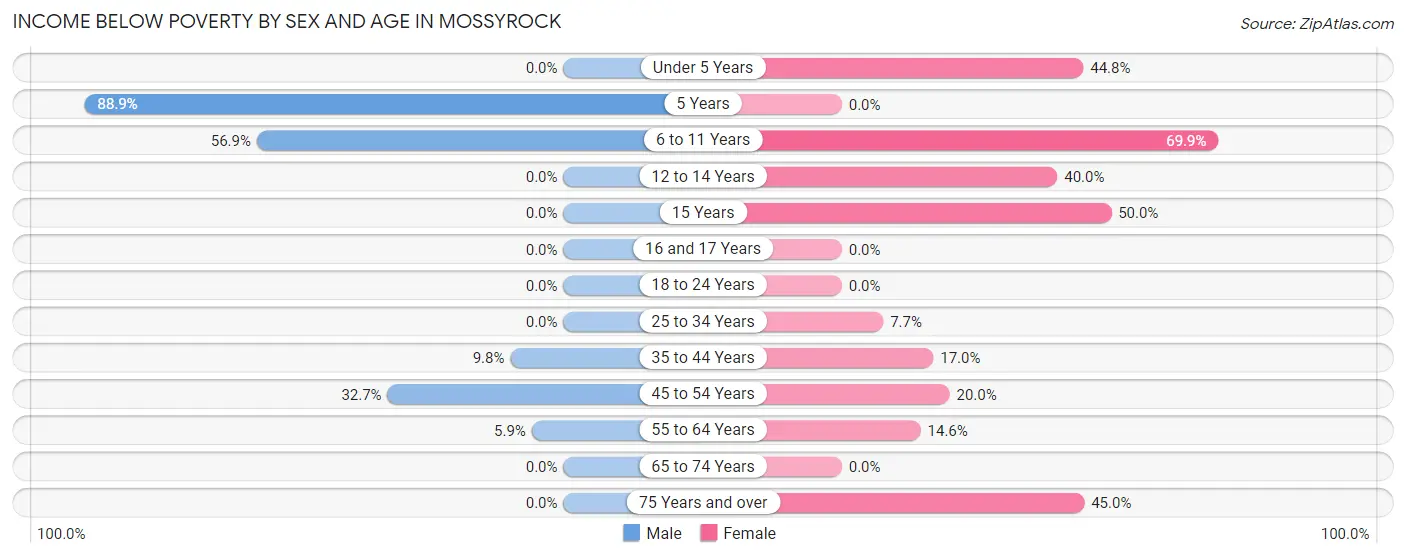
| Age Bracket | Male | Female |
| Under 5 Years | 0 (0.0%) | 13 (44.8%) |
| 5 Years | 8 (88.9%) | 0 (0.0%) |
| 6 to 11 Years | 66 (56.9%) | 58 (69.9%) |
| 12 to 14 Years | 0 (0.0%) | 8 (40.0%) |
| 15 Years | 0 (0.0%) | 3 (50.0%) |
| 16 and 17 Years | 0 (0.0%) | 0 (0.0%) |
| 18 to 24 Years | 0 (0.0%) | 0 (0.0%) |
| 25 to 34 Years | 0 (0.0%) | 6 (7.7%) |
| 35 to 44 Years | 6 (9.8%) | 9 (17.0%) |
| 45 to 54 Years | 16 (32.7%) | 5 (20.0%) |
| 55 to 64 Years | 2 (5.9%) | 6 (14.6%) |
| 65 to 74 Years | 0 (0.0%) | 0 (0.0%) |
| 75 Years and over | 0 (0.0%) | 9 (45.0%) |
| Total | 98 (21.6%) | 117 (25.6%) |
Income Above Poverty by Sex and Age in Mossyrock
According to the poverty statistics in Mossyrock, males aged under 5 years and females aged 5 years are the age groups that are most secure financially, with 100.0% of males and 100.0% of females in these age groups living above the poverty line.
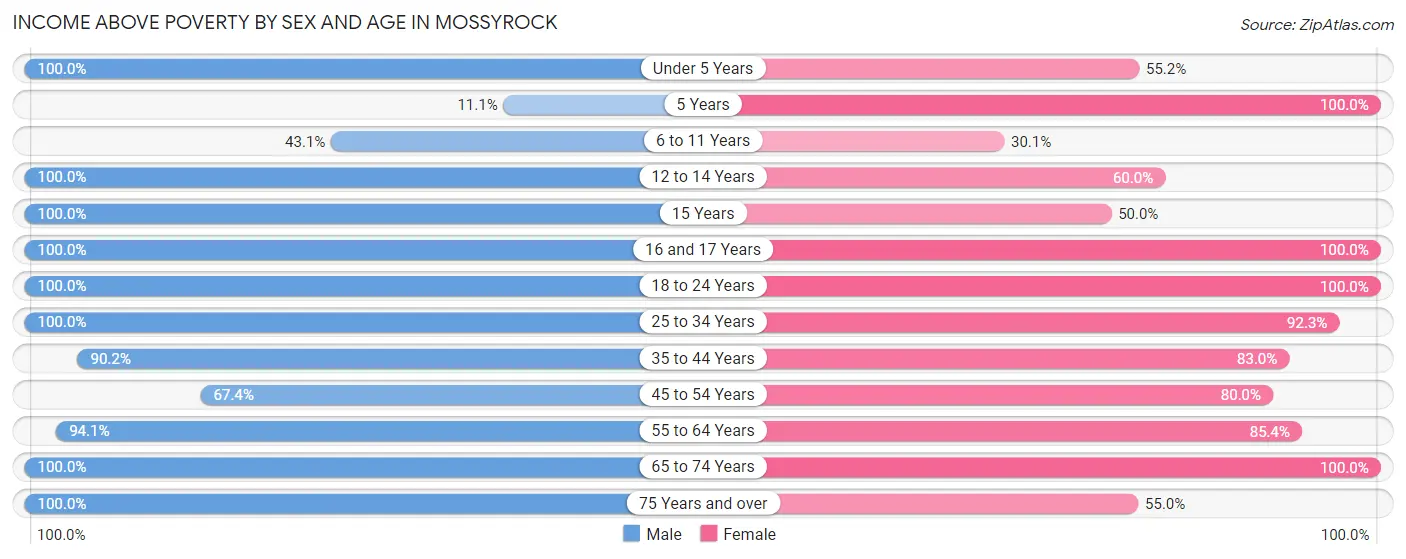
| Age Bracket | Male | Female |
| Under 5 Years | 21 (100.0%) | 16 (55.2%) |
| 5 Years | 1 (11.1%) | 18 (100.0%) |
| 6 to 11 Years | 50 (43.1%) | 25 (30.1%) |
| 12 to 14 Years | 29 (100.0%) | 12 (60.0%) |
| 15 Years | 11 (100.0%) | 3 (50.0%) |
| 16 and 17 Years | 21 (100.0%) | 14 (100.0%) |
| 18 to 24 Years | 12 (100.0%) | 26 (100.0%) |
| 25 to 34 Years | 34 (100.0%) | 72 (92.3%) |
| 35 to 44 Years | 55 (90.2%) | 44 (83.0%) |
| 45 to 54 Years | 33 (67.3%) | 20 (80.0%) |
| 55 to 64 Years | 32 (94.1%) | 35 (85.4%) |
| 65 to 74 Years | 36 (100.0%) | 45 (100.0%) |
| 75 Years and over | 20 (100.0%) | 11 (55.0%) |
| Total | 355 (78.4%) | 341 (74.5%) |
Income Below Poverty Among Married-Couple Families in Mossyrock
The poverty statistics for married-couple families in Mossyrock show that 5.2% or 8 of the total 155 families live below the poverty line. Families with 3 or 4 children have the highest poverty rate of 23.1%, comprising of 6 families. On the other hand, families with 1 or 2 children have the lowest poverty rate of 0.0%, which includes 0 families.
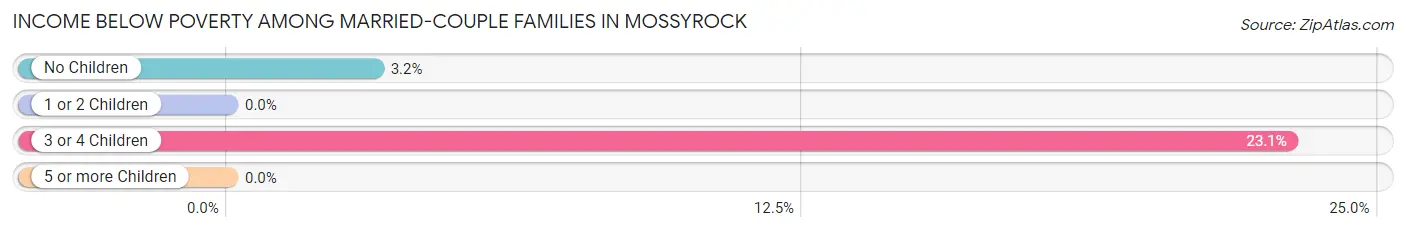
| Children | Above Poverty | Below Poverty |
| No Children | 61 (96.8%) | 2 (3.2%) |
| 1 or 2 Children | 66 (100.0%) | 0 (0.0%) |
| 3 or 4 Children | 20 (76.9%) | 6 (23.1%) |
| 5 or more Children | 0 (0.0%) | 0 (0.0%) |
| Total | 147 (94.8%) | 8 (5.2%) |
Income Below Poverty Among Single-Parent Households in Mossyrock
According to the poverty data in Mossyrock, 73.7% or 14 single-father households and 52.2% or 12 single-mother households are living below the poverty line. Among single-father households, those with 3 or 4 children have the highest poverty rate, with 14 households (100.0%) experiencing poverty. Likewise, among single-mother households, those with 1 or 2 children have the highest poverty rate, with 12 households (52.2%) falling below the poverty line.
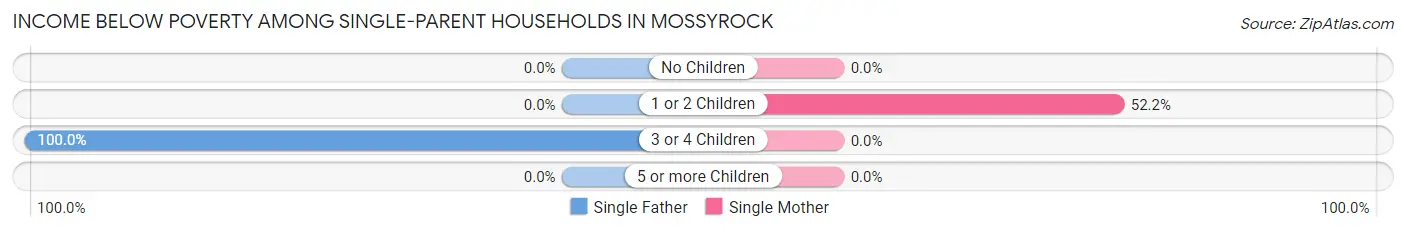
| Children | Single Father | Single Mother |
| No Children | 0 (0.0%) | 0 (0.0%) |
| 1 or 2 Children | 0 (0.0%) | 12 (52.2%) |
| 3 or 4 Children | 14 (100.0%) | 0 (0.0%) |
| 5 or more Children | 0 (0.0%) | 0 (0.0%) |
| Total | 14 (73.7%) | 12 (52.2%) |
Income Below Poverty Among Married-Couple vs Single-Parent Households in Mossyrock
The poverty data for Mossyrock shows that 8 of the married-couple family households (5.2%) and 26 of the single-parent households (61.9%) are living below the poverty level. Within the married-couple family households, those with 3 or 4 children have the highest poverty rate, with 6 households (23.1%) falling below the poverty line. Among the single-parent households, those with 3 or 4 children have the highest poverty rate, with 14 household (100.0%) living below poverty.
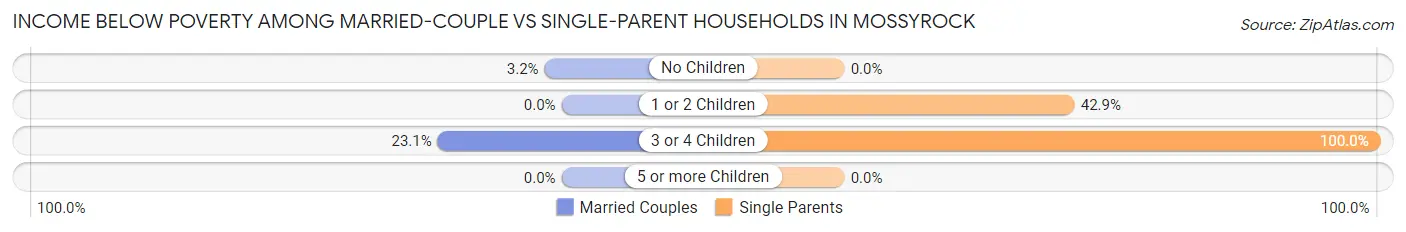
| Children | Married-Couple Families | Single-Parent Households |
| No Children | 2 (3.2%) | 0 (0.0%) |
| 1 or 2 Children | 0 (0.0%) | 12 (42.9%) |
| 3 or 4 Children | 6 (23.1%) | 14 (100.0%) |
| 5 or more Children | 0 (0.0%) | 0 (0.0%) |
| Total | 8 (5.2%) | 26 (61.9%) |
Race in Mossyrock
The most populous races in Mossyrock are White / Caucasian (536 | 58.8%), Hispanic or Latino (331 | 36.3%), and Two or more Races (204 | 22.4%).
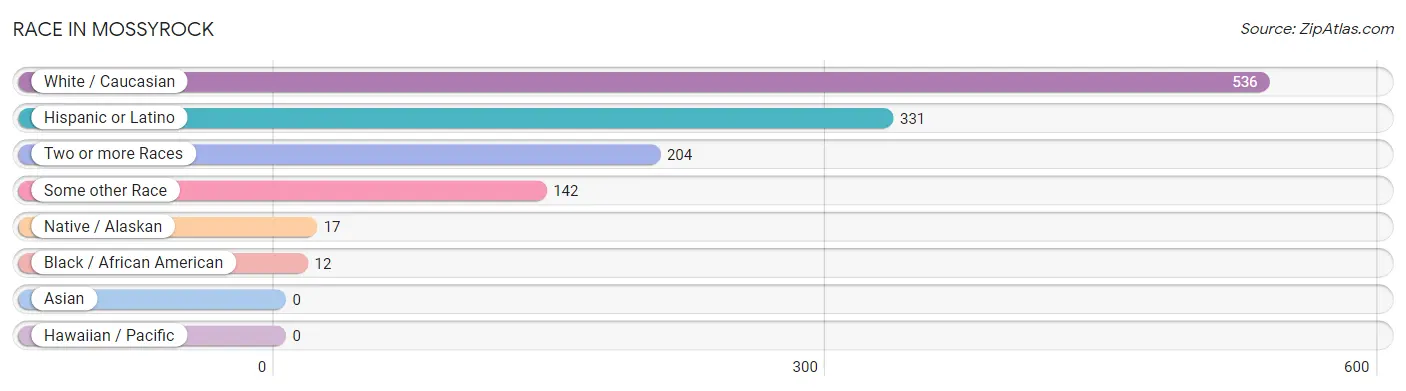
| Race | # Population | % Population |
| Asian | 0 | 0.0% |
| Black / African American | 12 | 1.3% |
| Hawaiian / Pacific | 0 | 0.0% |
| Hispanic or Latino | 331 | 36.3% |
| Native / Alaskan | 17 | 1.9% |
| White / Caucasian | 536 | 58.8% |
| Two or more Races | 204 | 22.4% |
| Some other Race | 142 | 15.6% |
| Total | 911 | 100.0% |
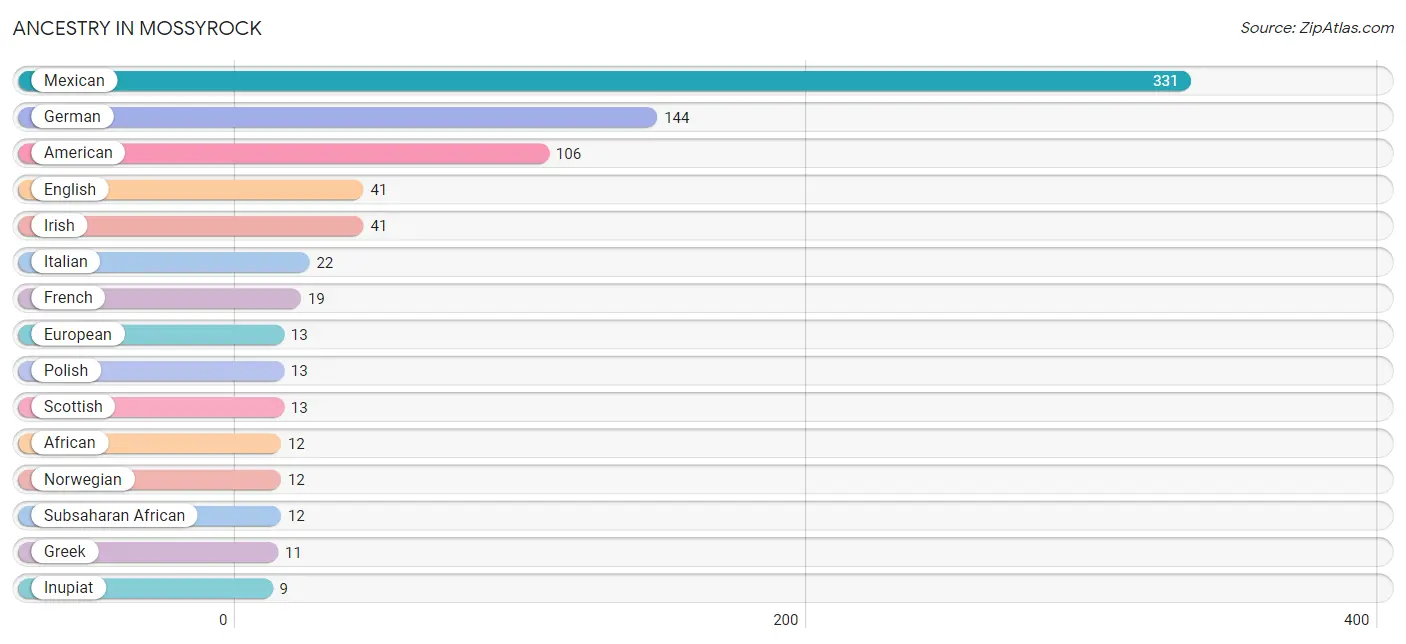
Ancestry in Mossyrock
The most populous ancestries reported in Mossyrock are Mexican (331 | 36.3%), German (144 | 15.8%), American (106 | 11.6%), English (41 | 4.5%), and Irish (41 | 4.5%), together accounting for 72.8% of all Mossyrock residents.
| Ancestry | # Population | % Population |
| African | 12 | 1.3% |
| American | 106 | 11.6% |
| Cherokee | 2 | 0.2% |
| Dutch West Indian | 1 | 0.1% |
| English | 41 | 4.5% |
| European | 13 | 1.4% |
| French | 19 | 2.1% |
| German | 144 | 15.8% |
| Greek | 11 | 1.2% |
| Inupiat | 9 | 1.0% |
| Irish | 41 | 4.5% |
| Italian | 22 | 2.4% |
| Mexican | 331 | 36.3% |
| Navajo | 4 | 0.4% |
| Norwegian | 12 | 1.3% |
| Polish | 13 | 1.4% |
| Scandinavian | 7 | 0.8% |
| Scottish | 13 | 1.4% |
| Sioux | 6 | 0.7% |
| Subsaharan African | 12 | 1.3% |
| Welsh | 8 | 0.9% |
| Yugoslavian | 8 | 0.9% | View All 22 Rows |
Immigrants in Mossyrock
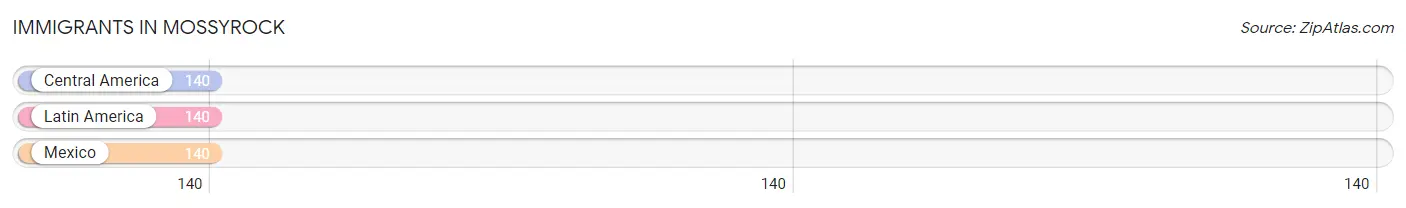
The most numerous immigrant groups reported in Mossyrock came from Central America (140 | 15.4%), Latin America (140 | 15.4%), and Mexico (140 | 15.4%), together accounting for 46.1% of all Mossyrock residents.
| Immigration Origin | # Population | % Population |
| Central America | 140 | 15.4% |
| Latin America | 140 | 15.4% |
| Mexico | 140 | 15.4% | View All 3 Rows |
Sex and Age in Mossyrock
Sex and Age in Mossyrock
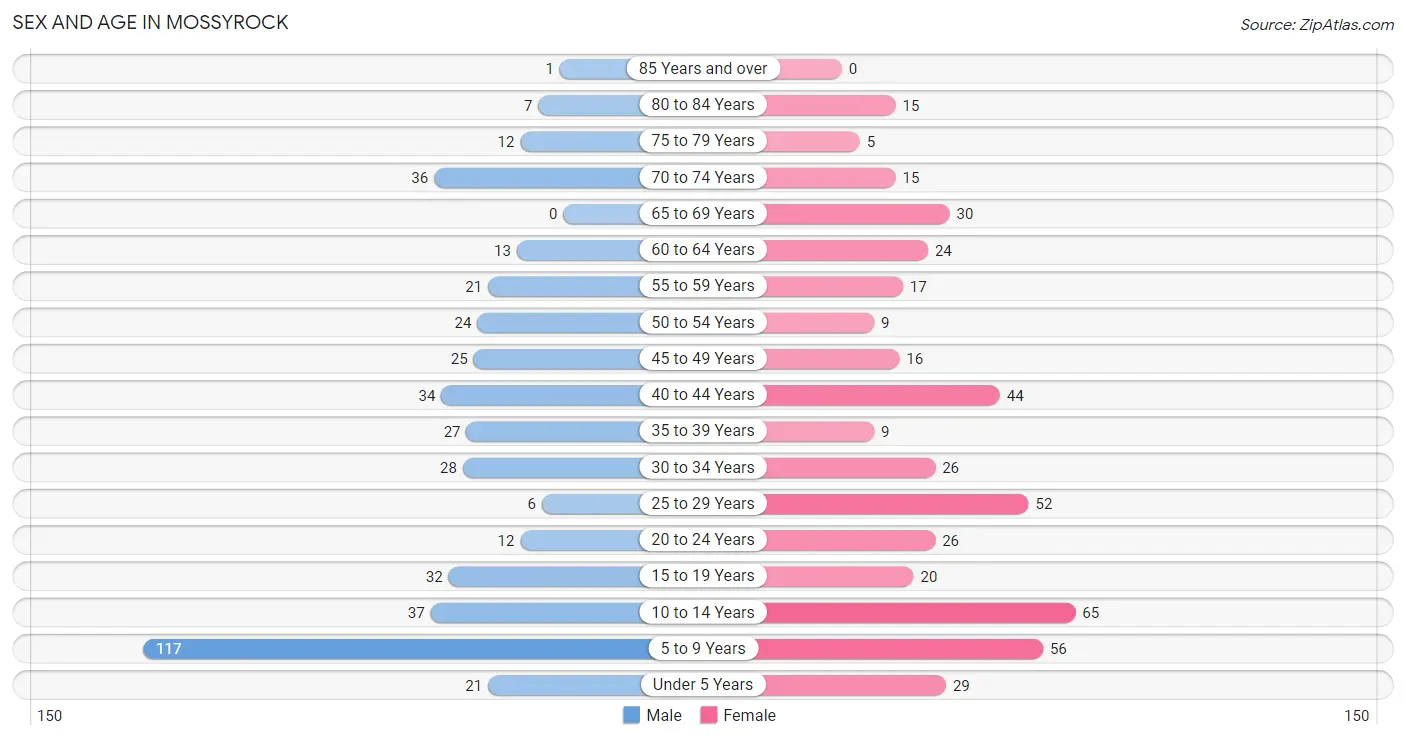
The most populous age groups in Mossyrock are 5 to 9 Years (117 | 25.8%) for men and 10 to 14 Years (65 | 14.2%) for women.
| Age Bracket | Male | Female |
| Under 5 Years | 21 (4.6%) | 29 (6.3%) |
| 5 to 9 Years | 117 (25.8%) | 56 (12.2%) |
| 10 to 14 Years | 37 (8.2%) | 65 (14.2%) |
| 15 to 19 Years | 32 (7.1%) | 20 (4.4%) |
| 20 to 24 Years | 12 (2.6%) | 26 (5.7%) |
| 25 to 29 Years | 6 (1.3%) | 52 (11.4%) |
| 30 to 34 Years | 28 (6.2%) | 26 (5.7%) |
| 35 to 39 Years | 27 (6.0%) | 9 (2.0%) |
| 40 to 44 Years | 34 (7.5%) | 44 (9.6%) |
| 45 to 49 Years | 25 (5.5%) | 16 (3.5%) |
| 50 to 54 Years | 24 (5.3%) | 9 (2.0%) |
| 55 to 59 Years | 21 (4.6%) | 17 (3.7%) |
| 60 to 64 Years | 13 (2.9%) | 24 (5.2%) |
| 65 to 69 Years | 0 (0.0%) | 30 (6.6%) |
| 70 to 74 Years | 36 (8.0%) | 15 (3.3%) |
| 75 to 79 Years | 12 (2.6%) | 5 (1.1%) |
| 80 to 84 Years | 7 (1.5%) | 15 (3.3%) |
| 85 Years and over | 1 (0.2%) | 0 (0.0%) |
| Total | 453 (100.0%) | 458 (100.0%) |
Families and Households in Mossyrock
Median Family Size in Mossyrock
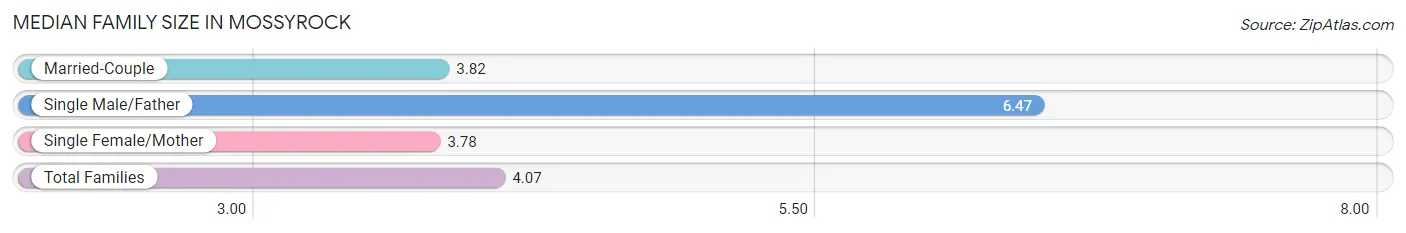
The median family size in Mossyrock is 4.07 persons per family, with single male/father families (19 | 9.6%) accounting for the largest median family size of 6.47 persons per family. On the other hand, single female/mother families (23 | 11.7%) represent the smallest median family size with 3.78 persons per family.
| Family Type | # Families | Family Size |
| Married-Couple | 155 (78.7%) | 3.82 |
| Single Male/Father | 19 (9.6%) | 6.47 |
| Single Female/Mother | 23 (11.7%) | 3.78 |
| Total Families | 197 (100.0%) | 4.07 |
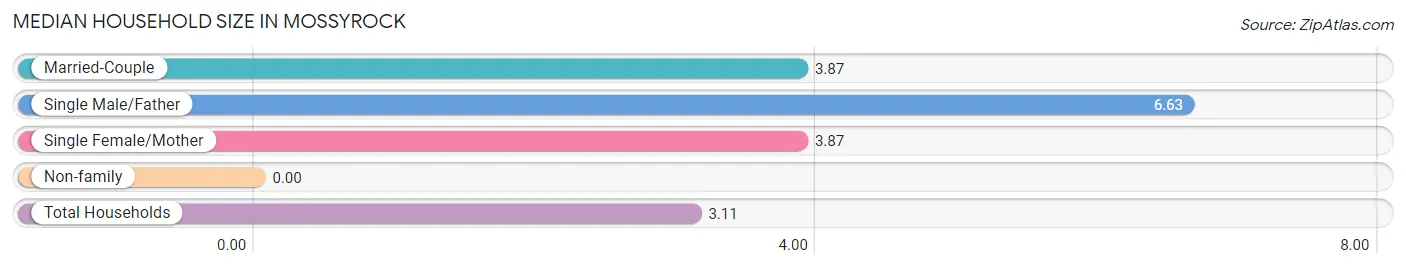
Median Household Size in Mossyrock
| Household Type | # Households | Household Size |
| Married-Couple | 155 (52.9%) | 3.87 |
| Single Male/Father | 19 (6.5%) | 6.63 |
| Single Female/Mother | 23 (7.9%) | 3.87 |
| Non-family | 96 (32.8%) | - |
| Total Households | 293 (100.0%) | 3.11 |
Household Size by Marriage Status in Mossyrock
Out of a total of 293 households in Mossyrock, 197 (67.2%) are family households, while 96 (32.8%) are nonfamily households. The most numerous type of family households are 4-person households, comprising 65, and the most common type of nonfamily households are 1-person households, comprising 96.
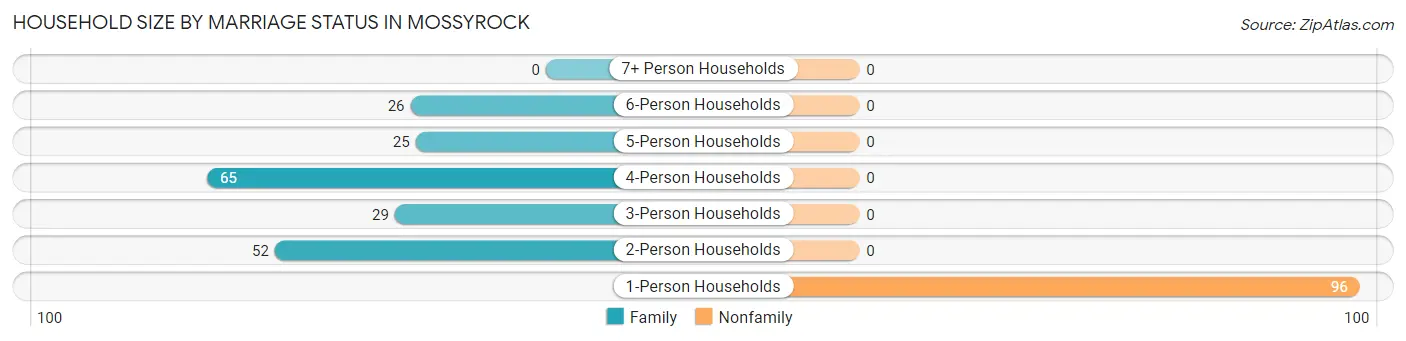
| Household Size | Family Households | Nonfamily Households |
| 1-Person Households | - | 96 (32.8%) |
| 2-Person Households | 52 (17.7%) | 0 (0.0%) |
| 3-Person Households | 29 (9.9%) | 0 (0.0%) |
| 4-Person Households | 65 (22.2%) | 0 (0.0%) |
| 5-Person Households | 25 (8.5%) | 0 (0.0%) |
| 6-Person Households | 26 (8.9%) | 0 (0.0%) |
| 7+ Person Households | 0 (0.0%) | 0 (0.0%) |
| Total | 197 (67.2%) | 96 (32.8%) |
Female Fertility in Mossyrock
Fertility by Age in Mossyrock
Average fertility rate in Mossyrock is 124.0 births per 1,000 women. Women in the age bracket of 20 to 34 years have the highest fertility rate with 163.0 births per 1,000 women. Women in the age bracket of 20 to 34 years acount for 70.8% of all women with births.
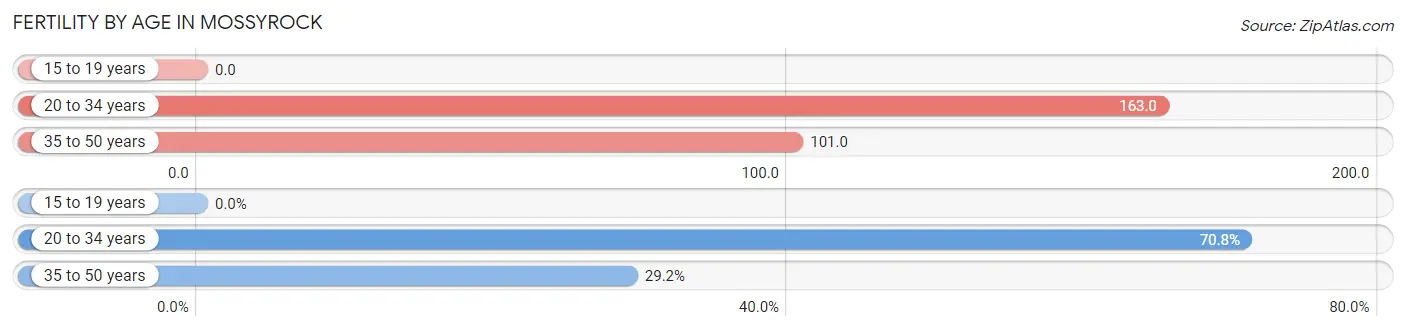
| Age Bracket | Women with Births | Births / 1,000 Women |
| 15 to 19 years | 0 (0.0%) | 0.0 |
| 20 to 34 years | 17 (70.8%) | 163.0 |
| 35 to 50 years | 7 (29.2%) | 101.0 |
| Total | 24 (100.0%) | 124.0 |
Fertility by Age by Marriage Status in Mossyrock
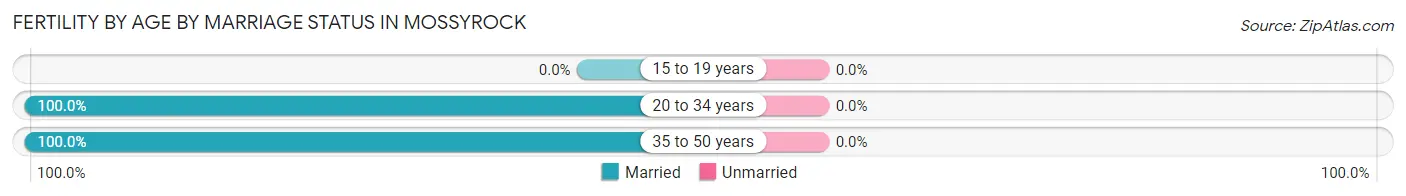
| Age Bracket | Married | Unmarried |
| 15 to 19 years | 0 (0.0%) | 0 (0.0%) |
| 20 to 34 years | 17 (100.0%) | 0 (0.0%) |
| 35 to 50 years | 7 (100.0%) | 0 (0.0%) |
| Total | 24 (100.0%) | 0 (0.0%) |
Fertility by Education in Mossyrock
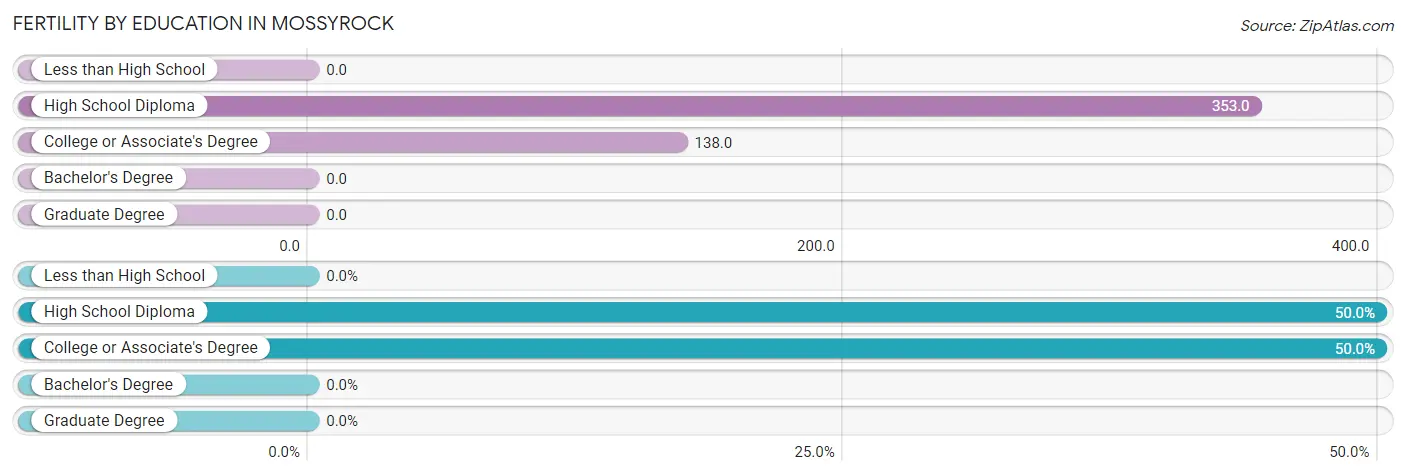
| Educational Attainment | Women with Births | Births / 1,000 Women |
| Less than High School | 0 (0.0%) | 0.0 |
| High School Diploma | 12 (50.0%) | 353.0 |
| College or Associate's Degree | 12 (50.0%) | 138.0 |
| Bachelor's Degree | 0 (0.0%) | 0.0 |
| Graduate Degree | 0 (0.0%) | 0.0 |
| Total | 24 (100.0%) | 124.0 |
Fertility by Education by Marriage Status in Mossyrock
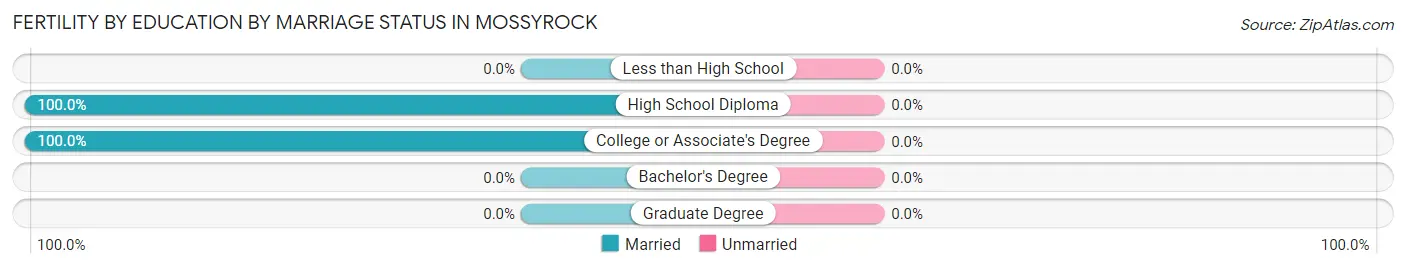
| Educational Attainment | Married | Unmarried |
| Less than High School | 0 (0.0%) | 0 (0.0%) |
| High School Diploma | 12 (100.0%) | 0 (0.0%) |
| College or Associate's Degree | 12 (100.0%) | 0 (0.0%) |
| Bachelor's Degree | 0 (0.0%) | 0 (0.0%) |
| Graduate Degree | 0 (0.0%) | 0 (0.0%) |
| Total | 24 (100.0%) | 0 (0.0%) |
Employment Characteristics in Mossyrock
Employment by Class of Employer in Mossyrock
Among the 312 employed individuals in Mossyrock, private company employees (228 | 73.1%), local government employees (29 | 9.3%), and state government employees (26 | 8.3%) make up the most common classes of employment.
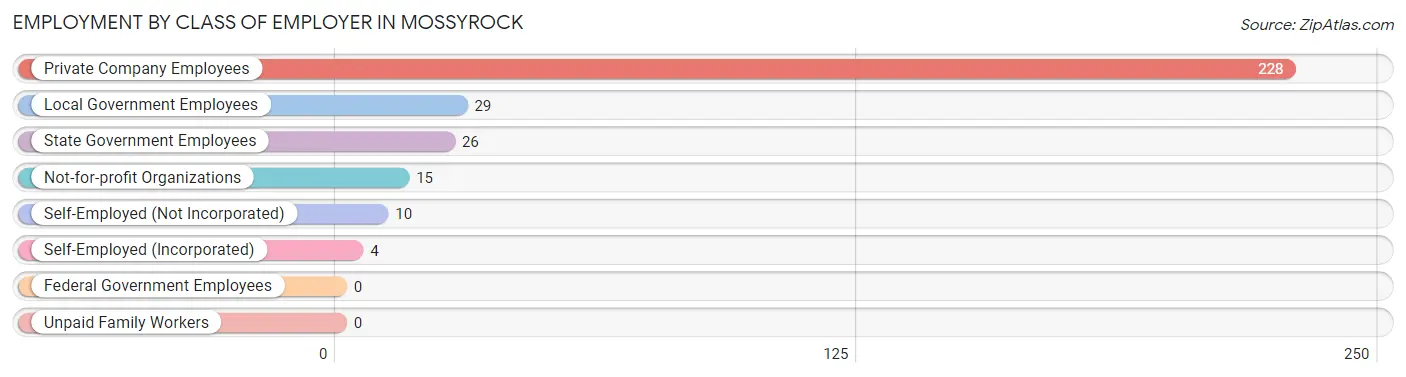
| Employer Class | # Employees | % Employees |
| Private Company Employees | 228 | 73.1% |
| Self-Employed (Incorporated) | 4 | 1.3% |
| Self-Employed (Not Incorporated) | 10 | 3.2% |
| Not-for-profit Organizations | 15 | 4.8% |
| Local Government Employees | 29 | 9.3% |
| State Government Employees | 26 | 8.3% |
| Federal Government Employees | 0 | 0.0% |
| Unpaid Family Workers | 0 | 0.0% |
| Total | 312 | 100.0% |
Employment Status by Age in Mossyrock
According to the labor force statistics for Mossyrock, out of the total population over 16 years of age (569), 58.3% or 332 individuals are in the labor force, with 3.9% or 13 of them unemployed. The age group with the highest labor force participation rate is 16 to 19 years, with 100.0% or 35 individuals in the labor force. Within the labor force, the 45 to 54 years age range has the highest percentage of unemployed individuals, with 26.1% or 12 of them being unemployed.
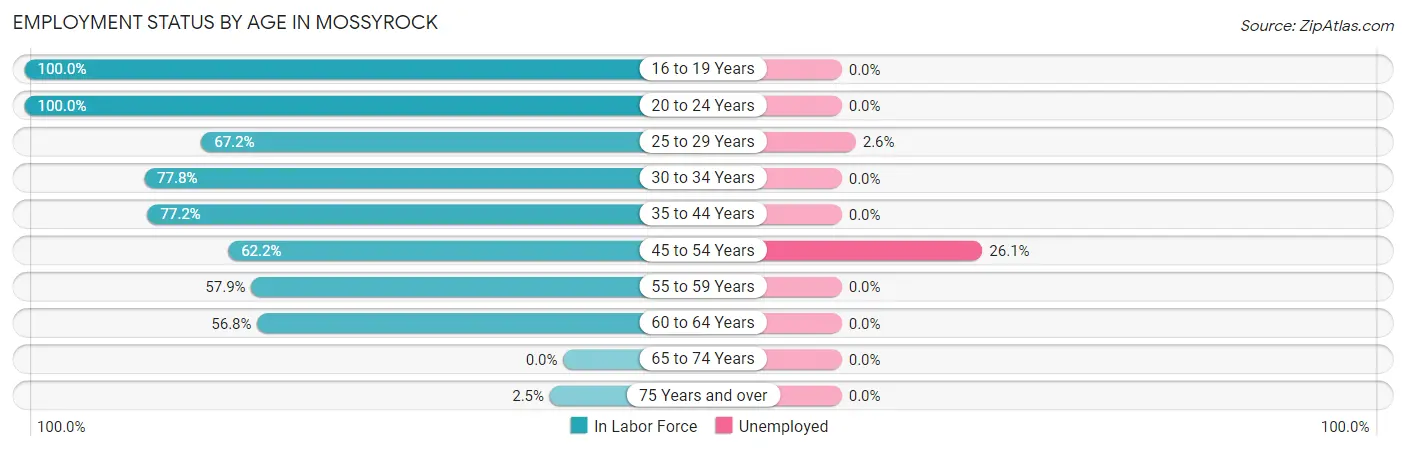
| Age Bracket | In Labor Force | Unemployed |
| 16 to 19 Years | 35 (100.0%) | 0 (0.0%) |
| 20 to 24 Years | 38 (100.0%) | 0 (0.0%) |
| 25 to 29 Years | 39 (67.2%) | 1 (2.6%) |
| 30 to 34 Years | 42 (77.8%) | 0 (0.0%) |
| 35 to 44 Years | 88 (77.2%) | 0 (0.0%) |
| 45 to 54 Years | 46 (62.2%) | 12 (26.1%) |
| 55 to 59 Years | 22 (57.9%) | 0 (0.0%) |
| 60 to 64 Years | 21 (56.8%) | 0 (0.0%) |
| 65 to 74 Years | 0 (0.0%) | 0 (0.0%) |
| 75 Years and over | 1 (2.5%) | 0 (0.0%) |
| Total | 332 (58.3%) | 13 (3.9%) |
Employment Status by Educational Attainment in Mossyrock
According to labor force statistics for Mossyrock, 68.8% of individuals (258) out of the total population between 25 and 64 years of age (375) are in the labor force, with 5.0% or 13 of them being unemployed. The group with the highest labor force participation rate are those with the educational attainment of bachelor's degree or higher, with 95.0% or 19 individuals in the labor force. Within the labor force, individuals with less than high school education have the highest percentage of unemployment, with 12.1% or 12 of them being unemployed.
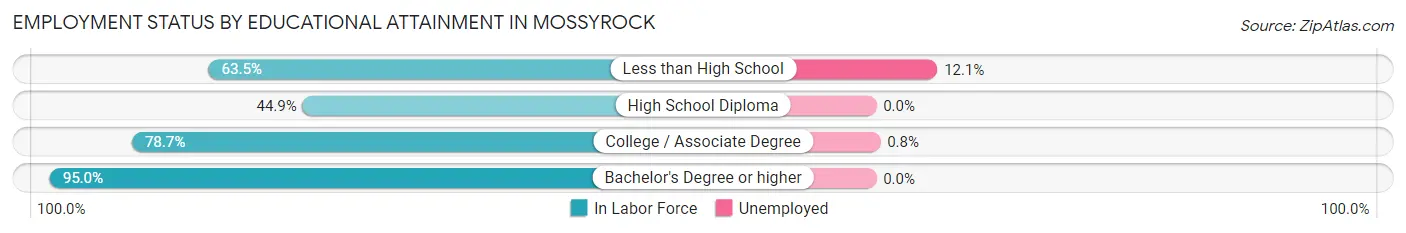
| Educational Attainment | In Labor Force | Unemployed |
| Less than High School | 99 (63.5%) | 19 (12.1%) |
| High School Diploma | 22 (44.9%) | 0 (0.0%) |
| College / Associate Degree | 118 (78.7%) | 1 (0.8%) |
| Bachelor's Degree or higher | 19 (95.0%) | 0 (0.0%) |
| Total | 258 (68.8%) | 19 (5.0%) |
Employment Occupations by Sex in Mossyrock
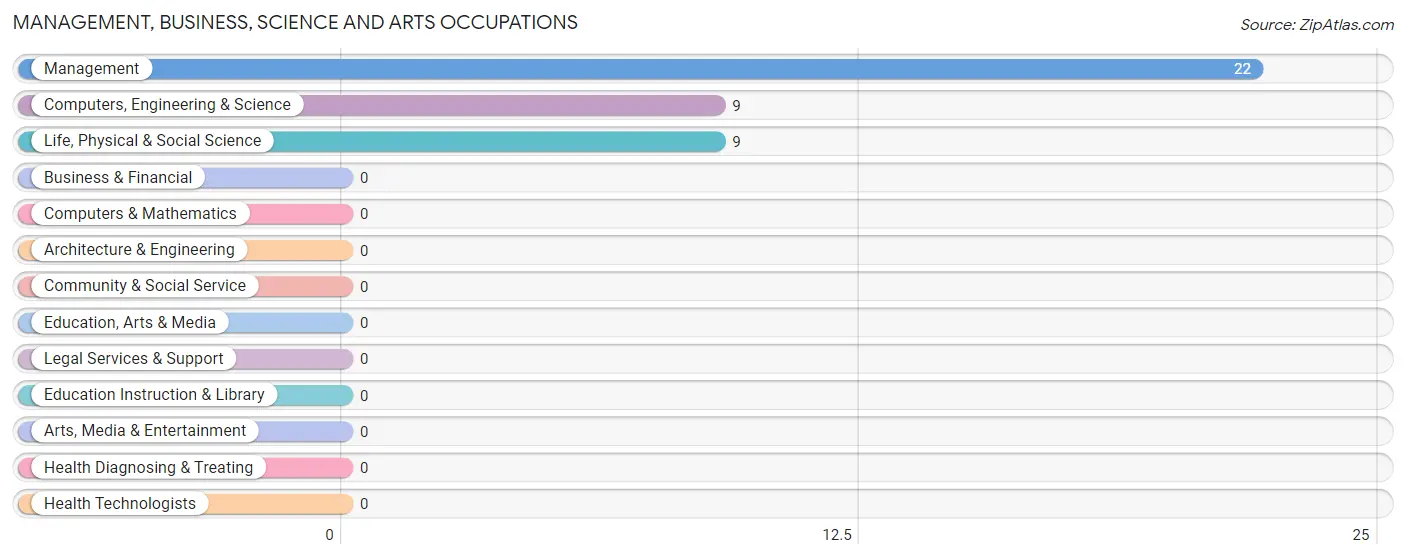
Management, Business, Science and Arts Occupations
The most common Management, Business, Science and Arts occupations in Mossyrock are Management (22 | 6.9%), Computers, Engineering & Science (9 | 2.8%), and Life, Physical & Social Science (9 | 2.8%).
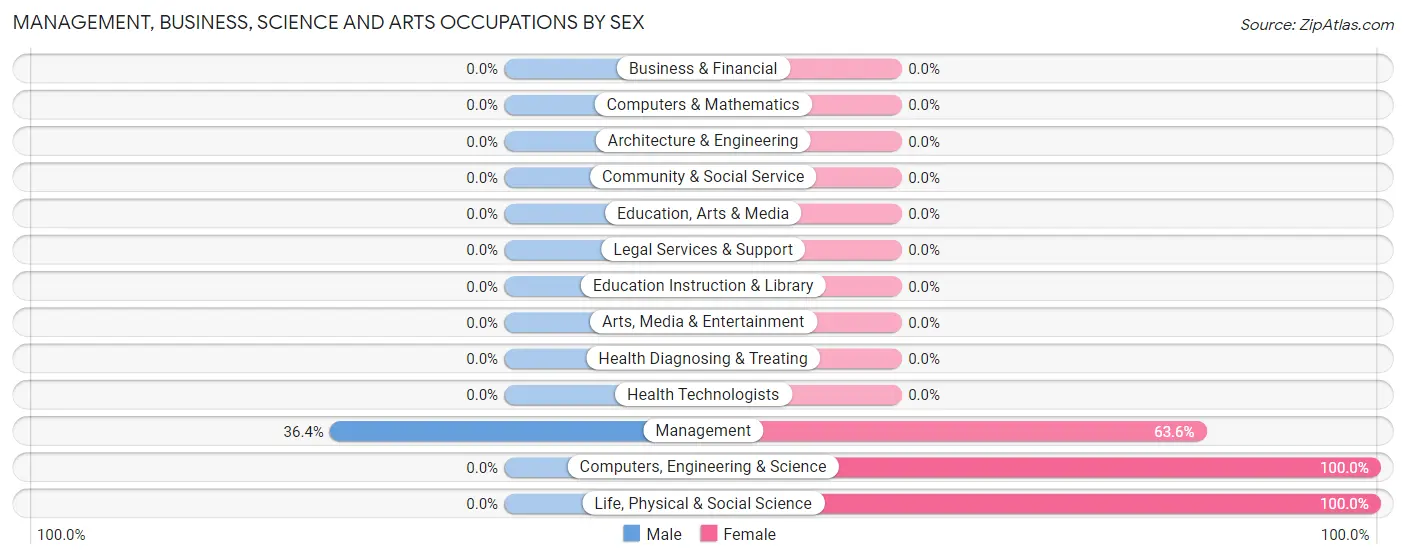
Management, Business, Science and Arts Occupations by Sex
| Occupation | Male | Female |
| Management | 8 (36.4%) | 14 (63.6%) |
| Business & Financial | 0 (0.0%) | 0 (0.0%) |
| Computers, Engineering & Science | 0 (0.0%) | 9 (100.0%) |
| Computers & Mathematics | 0 (0.0%) | 0 (0.0%) |
| Architecture & Engineering | 0 (0.0%) | 0 (0.0%) |
| Life, Physical & Social Science | 0 (0.0%) | 9 (100.0%) |
| Community & Social Service | 0 (0.0%) | 0 (0.0%) |
| Education, Arts & Media | 0 (0.0%) | 0 (0.0%) |
| Legal Services & Support | 0 (0.0%) | 0 (0.0%) |
| Education Instruction & Library | 0 (0.0%) | 0 (0.0%) |
| Arts, Media & Entertainment | 0 (0.0%) | 0 (0.0%) |
| Health Diagnosing & Treating | 0 (0.0%) | 0 (0.0%) |
| Health Technologists | 0 (0.0%) | 0 (0.0%) |
| Total (Category) | 8 (25.8%) | 23 (74.2%) |
| Total (Overall) | 150 (47.0%) | 169 (53.0%) |
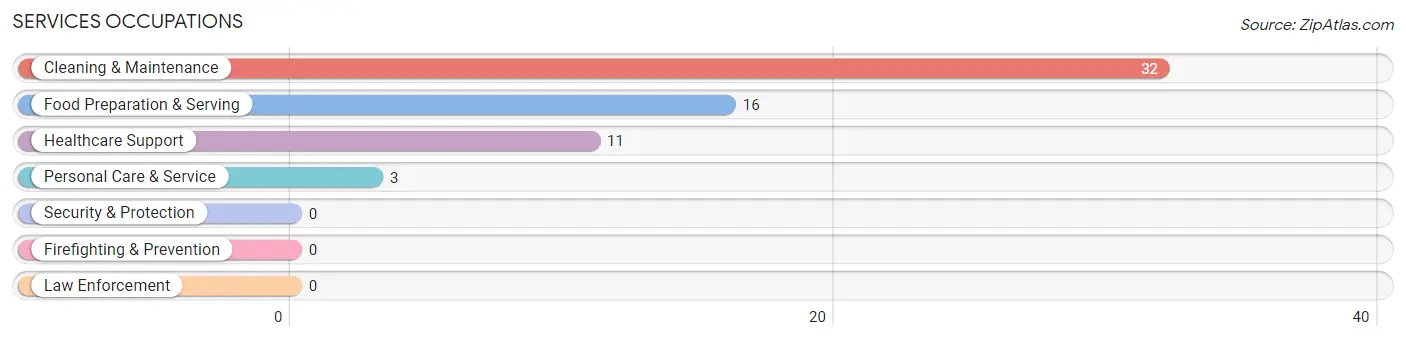
Services Occupations
The most common Services occupations in Mossyrock are Cleaning & Maintenance (32 | 10.0%), Food Preparation & Serving (16 | 5.0%), Healthcare Support (11 | 3.5%), and Personal Care & Service (3 | 0.9%).
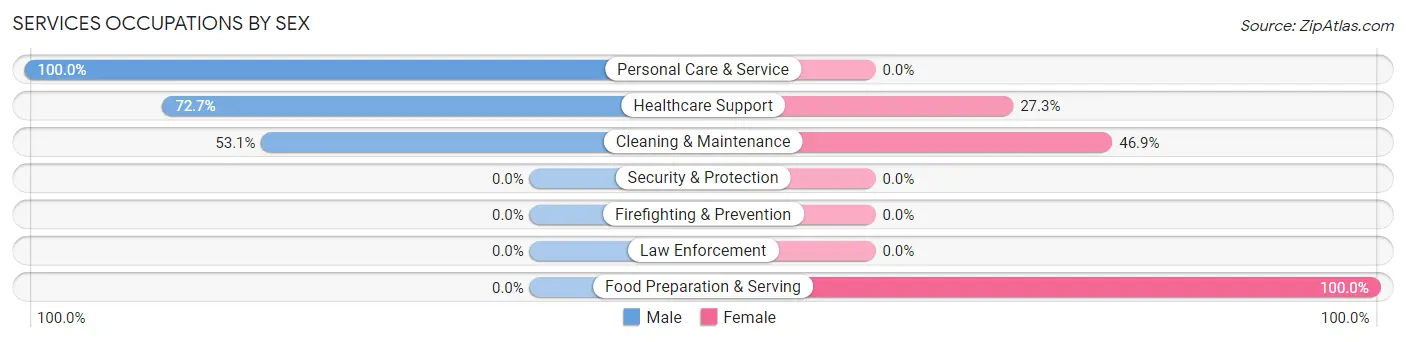
Services Occupations by Sex
Within the Services occupations in Mossyrock, the most male-oriented occupations are Personal Care & Service (100.0%), Healthcare Support (72.7%), and Cleaning & Maintenance (53.1%), while the most female-oriented occupations are Food Preparation & Serving (100.0%), Cleaning & Maintenance (46.9%), and Healthcare Support (27.3%).
| Occupation | Male | Female |
| Healthcare Support | 8 (72.7%) | 3 (27.3%) |
| Security & Protection | 0 (0.0%) | 0 (0.0%) |
| Firefighting & Prevention | 0 (0.0%) | 0 (0.0%) |
| Law Enforcement | 0 (0.0%) | 0 (0.0%) |
| Food Preparation & Serving | 0 (0.0%) | 16 (100.0%) |
| Cleaning & Maintenance | 17 (53.1%) | 15 (46.9%) |
| Personal Care & Service | 3 (100.0%) | 0 (0.0%) |
| Total (Category) | 28 (45.2%) | 34 (54.8%) |
| Total (Overall) | 150 (47.0%) | 169 (53.0%) |
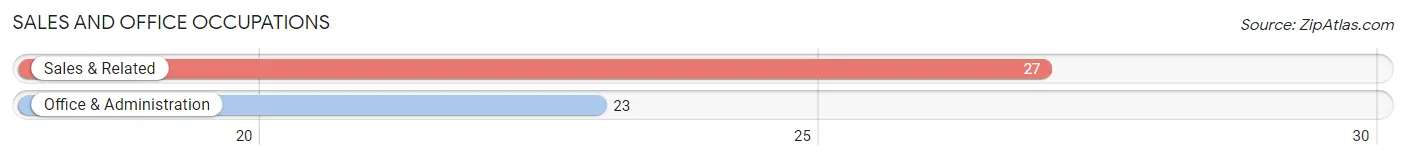
Sales and Office Occupations
The most common Sales and Office occupations in Mossyrock are Sales & Related (27 | 8.5%), and Office & Administration (23 | 7.2%).
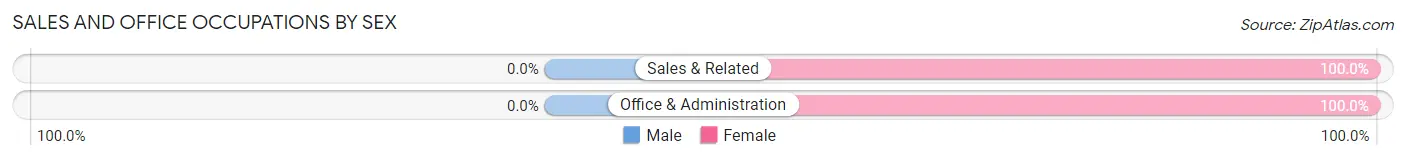
Sales and Office Occupations by Sex
| Occupation | Male | Female |
| Sales & Related | 0 (0.0%) | 27 (100.0%) |
| Office & Administration | 0 (0.0%) | 23 (100.0%) |
| Total (Category) | 0 (0.0%) | 50 (100.0%) |
| Total (Overall) | 150 (47.0%) | 169 (53.0%) |
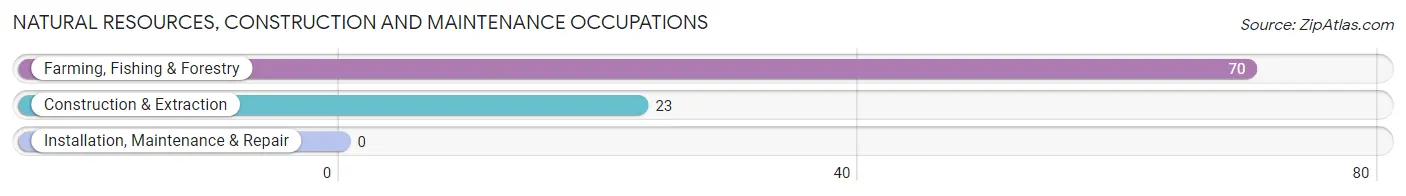
Natural Resources, Construction and Maintenance Occupations
The most common Natural Resources, Construction and Maintenance occupations in Mossyrock are Farming, Fishing & Forestry (70 | 21.9%), and Construction & Extraction (23 | 7.2%).
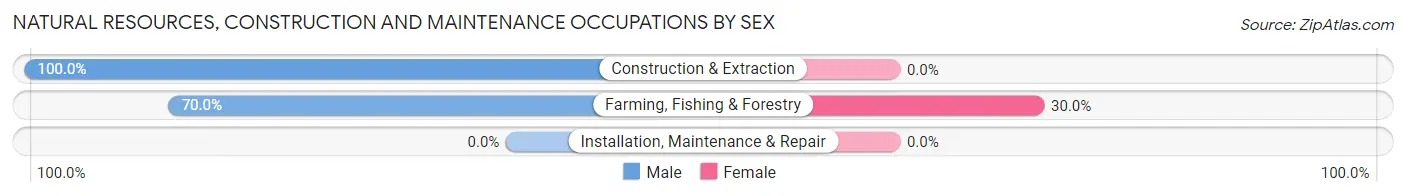
Natural Resources, Construction and Maintenance Occupations by Sex
| Occupation | Male | Female |
| Farming, Fishing & Forestry | 49 (70.0%) | 21 (30.0%) |
| Construction & Extraction | 23 (100.0%) | 0 (0.0%) |
| Installation, Maintenance & Repair | 0 (0.0%) | 0 (0.0%) |
| Total (Category) | 72 (77.4%) | 21 (22.6%) |
| Total (Overall) | 150 (47.0%) | 169 (53.0%) |
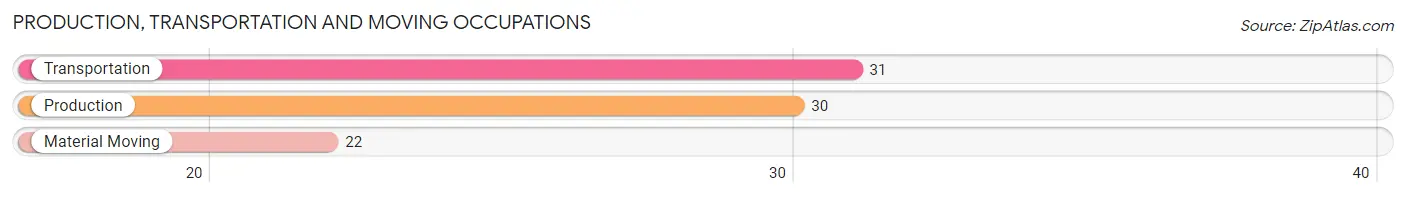
Production, Transportation and Moving Occupations
The most common Production, Transportation and Moving occupations in Mossyrock are Transportation (31 | 9.7%), Production (30 | 9.4%), and Material Moving (22 | 6.9%).
Production, Transportation and Moving Occupations by Sex
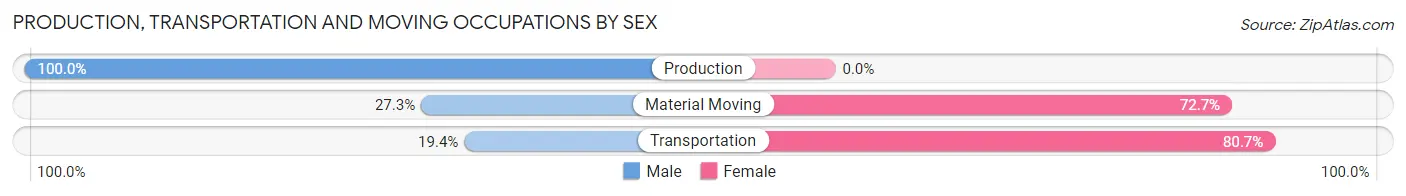
| Occupation | Male | Female |
| Production | 30 (100.0%) | 0 (0.0%) |
| Transportation | 6 (19.4%) | 25 (80.6%) |
| Material Moving | 6 (27.3%) | 16 (72.7%) |
| Total (Category) | 42 (50.6%) | 41 (49.4%) |
| Total (Overall) | 150 (47.0%) | 169 (53.0%) |
Employment Industries by Sex in Mossyrock
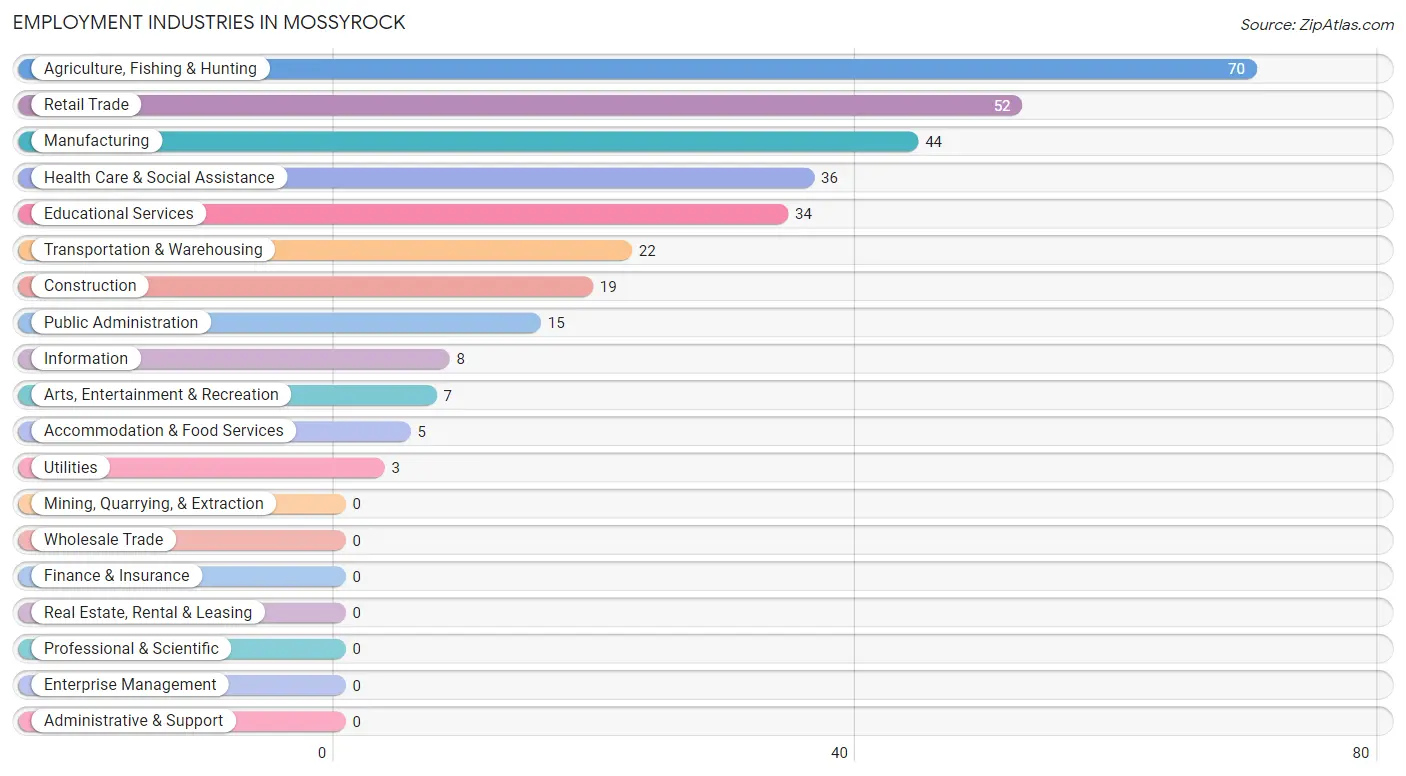
Employment Industries in Mossyrock
The major employment industries in Mossyrock include Agriculture, Fishing & Hunting (70 | 21.9%), Retail Trade (52 | 16.3%), Manufacturing (44 | 13.8%), Health Care & Social Assistance (36 | 11.3%), and Educational Services (34 | 10.7%).
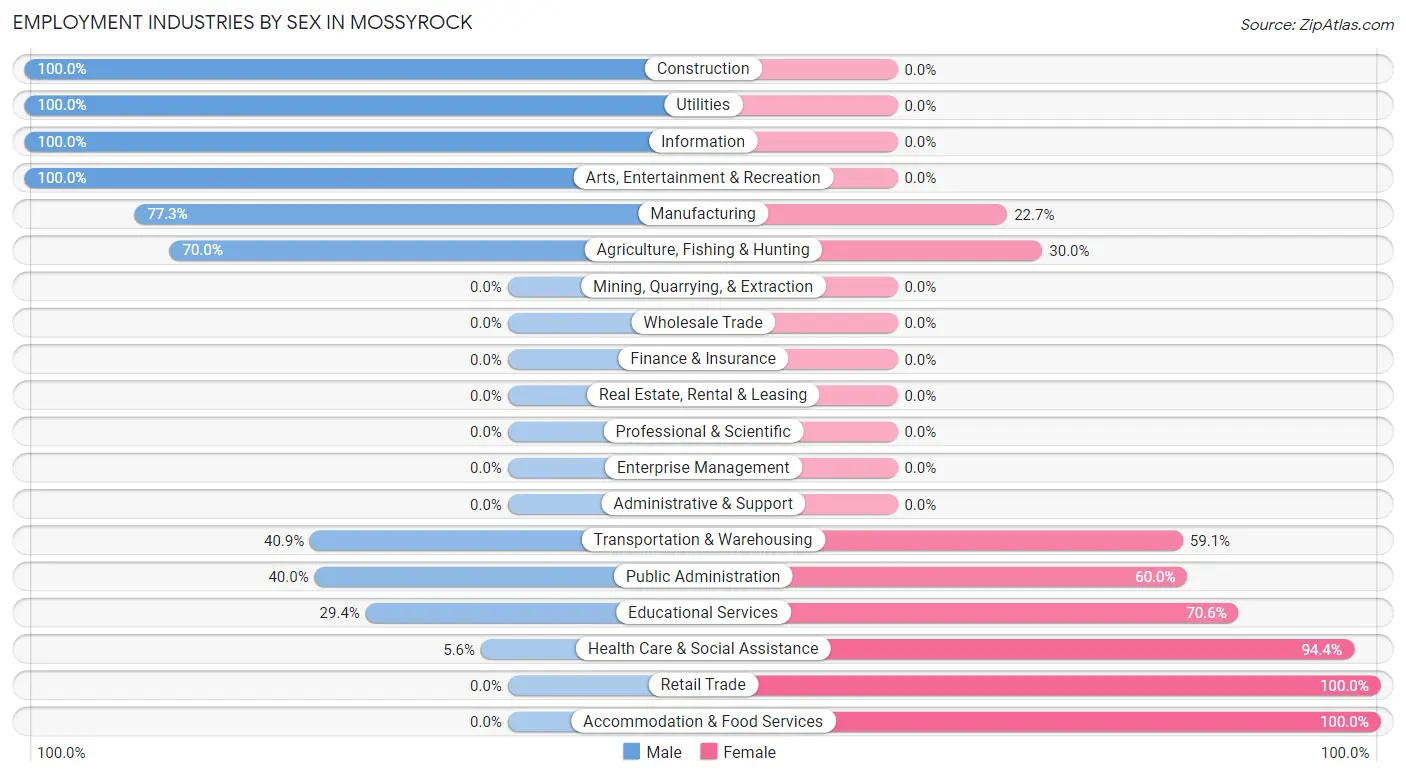
Employment Industries by Sex in Mossyrock
The Mossyrock industries that see more men than women are Construction (100.0%), Utilities (100.0%), and Information (100.0%), whereas the industries that tend to have a higher number of women are Retail Trade (100.0%), Accommodation & Food Services (100.0%), and Health Care & Social Assistance (94.4%).
| Industry | Male | Female |
| Agriculture, Fishing & Hunting | 49 (70.0%) | 21 (30.0%) |
| Mining, Quarrying, & Extraction | 0 (0.0%) | 0 (0.0%) |
| Construction | 19 (100.0%) | 0 (0.0%) |
| Manufacturing | 34 (77.3%) | 10 (22.7%) |
| Wholesale Trade | 0 (0.0%) | 0 (0.0%) |
| Retail Trade | 0 (0.0%) | 52 (100.0%) |
| Transportation & Warehousing | 9 (40.9%) | 13 (59.1%) |
| Utilities | 3 (100.0%) | 0 (0.0%) |
| Information | 8 (100.0%) | 0 (0.0%) |
| Finance & Insurance | 0 (0.0%) | 0 (0.0%) |
| Real Estate, Rental & Leasing | 0 (0.0%) | 0 (0.0%) |
| Professional & Scientific | 0 (0.0%) | 0 (0.0%) |
| Enterprise Management | 0 (0.0%) | 0 (0.0%) |
| Administrative & Support | 0 (0.0%) | 0 (0.0%) |
| Educational Services | 10 (29.4%) | 24 (70.6%) |
| Health Care & Social Assistance | 2 (5.6%) | 34 (94.4%) |
| Arts, Entertainment & Recreation | 7 (100.0%) | 0 (0.0%) |
| Accommodation & Food Services | 0 (0.0%) | 5 (100.0%) |
| Public Administration | 6 (40.0%) | 9 (60.0%) |
| Total | 150 (47.0%) | 169 (53.0%) |
Education in Mossyrock
School Enrollment in Mossyrock
The most common levels of schooling among the 346 students in Mossyrock are elementary school (131 | 37.9%), middle school (92 | 26.6%), and high school (53 | 15.3%).
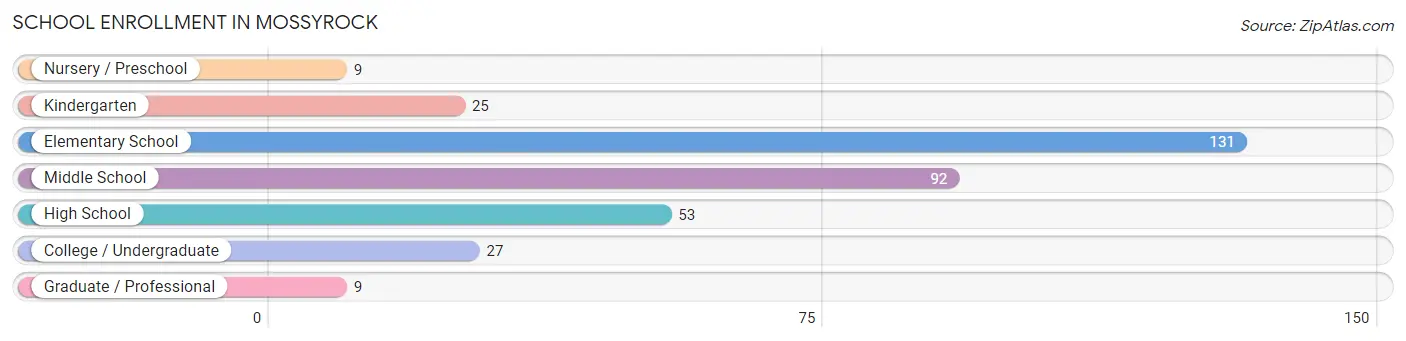
| School Level | # Students | % Students |
| Nursery / Preschool | 9 | 2.6% |
| Kindergarten | 25 | 7.2% |
| Elementary School | 131 | 37.9% |
| Middle School | 92 | 26.6% |
| High School | 53 | 15.3% |
| College / Undergraduate | 27 | 7.8% |
| Graduate / Professional | 9 | 2.6% |
| Total | 346 | 100.0% |
School Enrollment by Age by Funding Source in Mossyrock
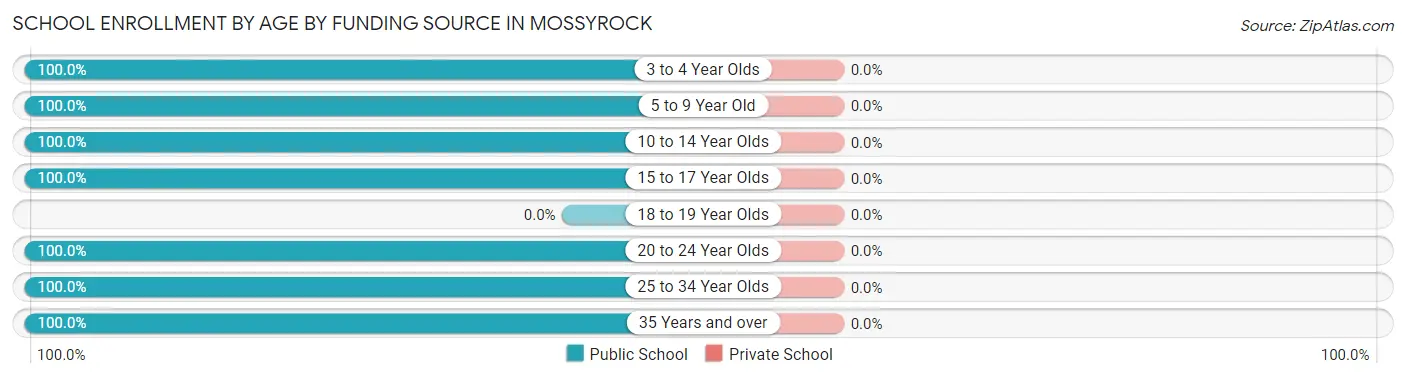
| Age Bracket | Public School | Private School |
| 3 to 4 Year Olds | 9 (100.0%) | 0 (0.0%) |
| 5 to 9 Year Old | 147 (100.0%) | 0 (0.0%) |
| 10 to 14 Year Olds | 102 (100.0%) | 0 (0.0%) |
| 15 to 17 Year Olds | 52 (100.0%) | 0 (0.0%) |
| 18 to 19 Year Olds | 0 (0.0%) | 0 (0.0%) |
| 20 to 24 Year Olds | 4 (100.0%) | 0 (0.0%) |
| 25 to 34 Year Olds | 19 (100.0%) | 0 (0.0%) |
| 35 Years and over | 13 (100.0%) | 0 (0.0%) |
| Total | 346 (100.0%) | 0 (0.0%) |
Educational Attainment by Field of Study in Mossyrock
Education (14 | 63.6%), bio, nature & agricultural (6 | 27.3%), business (1 | 4.5%), and arts & humanities (1 | 4.5%) are the most common fields of study among 22 individuals in Mossyrock who have obtained a bachelor's degree or higher.
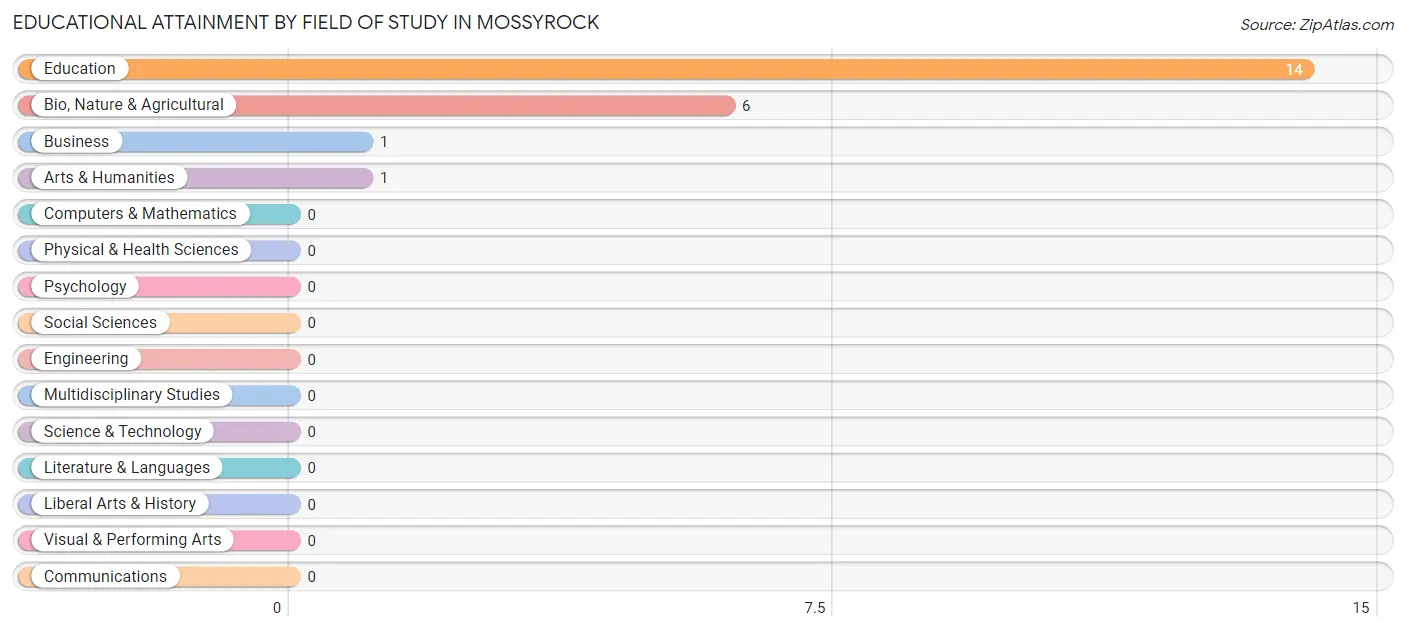
| Field of Study | # Graduates | % Graduates |
| Computers & Mathematics | 0 | 0.0% |
| Bio, Nature & Agricultural | 6 | 27.3% |
| Physical & Health Sciences | 0 | 0.0% |
| Psychology | 0 | 0.0% |
| Social Sciences | 0 | 0.0% |
| Engineering | 0 | 0.0% |
| Multidisciplinary Studies | 0 | 0.0% |
| Science & Technology | 0 | 0.0% |
| Business | 1 | 4.5% |
| Education | 14 | 63.6% |
| Literature & Languages | 0 | 0.0% |
| Liberal Arts & History | 0 | 0.0% |
| Visual & Performing Arts | 0 | 0.0% |
| Communications | 0 | 0.0% |
| Arts & Humanities | 1 | 4.5% |
| Total | 22 | 100.0% |
Transportation & Commute in Mossyrock
Vehicle Availability by Sex in Mossyrock
The most prevalent vehicle ownership categories in Mossyrock are males with 4 vehicles (51, accounting for 35.7%) and females with 4 vehicles (75, making up 30.2%).
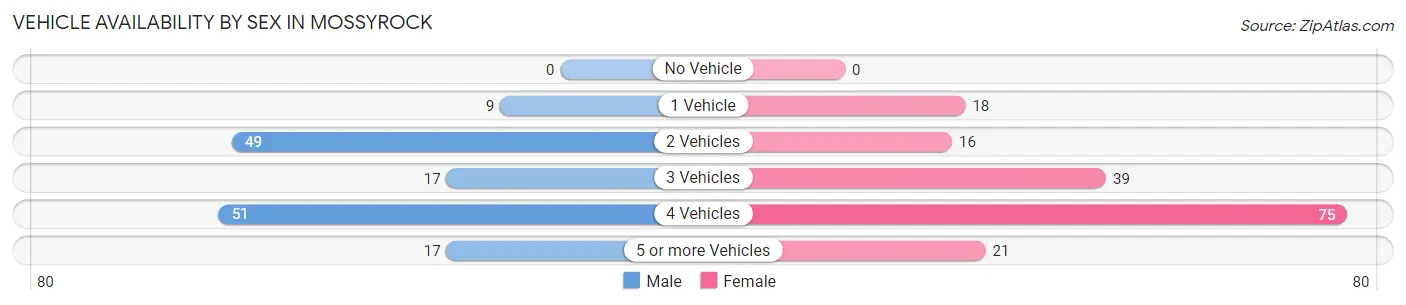
| Vehicles Available | Male | Female |
| No Vehicle | 0 (0.0%) | 0 (0.0%) |
| 1 Vehicle | 9 (6.3%) | 18 (10.6%) |
| 2 Vehicles | 49 (34.3%) | 16 (9.5%) |
| 3 Vehicles | 17 (11.9%) | 39 (23.1%) |
| 4 Vehicles | 51 (35.7%) | 75 (44.4%) |
| 5 or more Vehicles | 17 (11.9%) | 21 (12.4%) |
| Total | 143 (100.0%) | 169 (100.0%) |
Commute Time in Mossyrock
The most frequently occuring commute durations in Mossyrock are 5 to 9 minutes (61 commuters, 20.5%), less than 5 minutes (52 commuters, 17.4%), and 15 to 19 minutes (43 commuters, 14.4%).
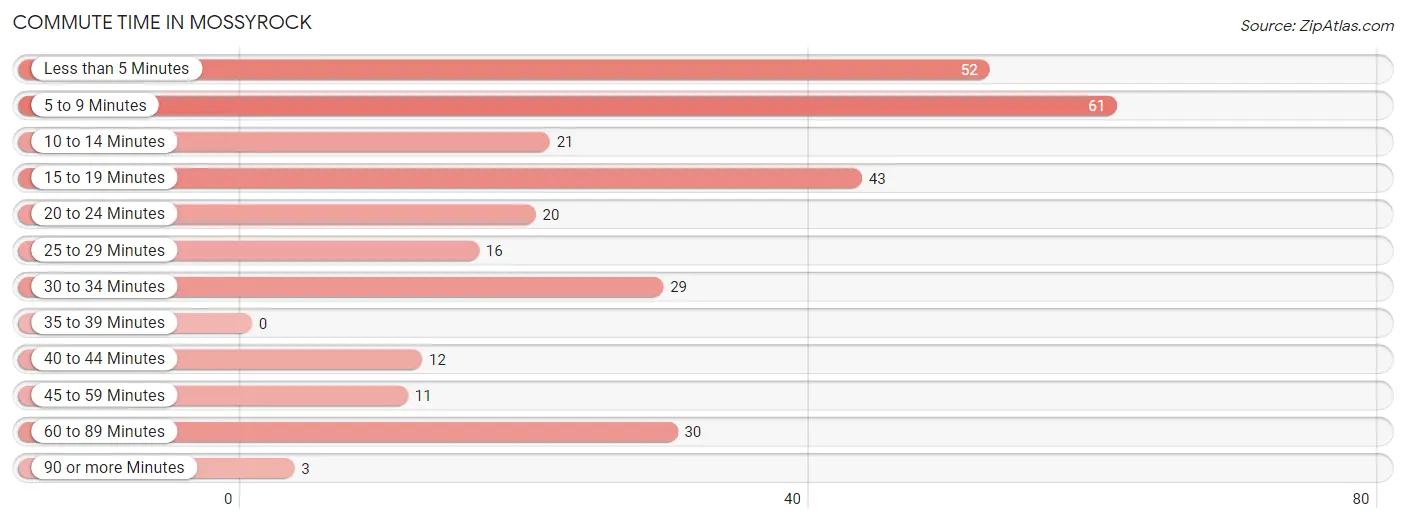
| Commute Time | # Commuters | % Commuters |
| Less than 5 Minutes | 52 | 17.4% |
| 5 to 9 Minutes | 61 | 20.5% |
| 10 to 14 Minutes | 21 | 7.0% |
| 15 to 19 Minutes | 43 | 14.4% |
| 20 to 24 Minutes | 20 | 6.7% |
| 25 to 29 Minutes | 16 | 5.4% |
| 30 to 34 Minutes | 29 | 9.7% |
| 35 to 39 Minutes | 0 | 0.0% |
| 40 to 44 Minutes | 12 | 4.0% |
| 45 to 59 Minutes | 11 | 3.7% |
| 60 to 89 Minutes | 30 | 10.1% |
| 90 or more Minutes | 3 | 1.0% |
Commute Time by Sex in Mossyrock
The most common commute times in Mossyrock are 5 to 9 minutes (50 commuters, 35.0%) for males and less than 5 minutes (39 commuters, 25.2%) for females.
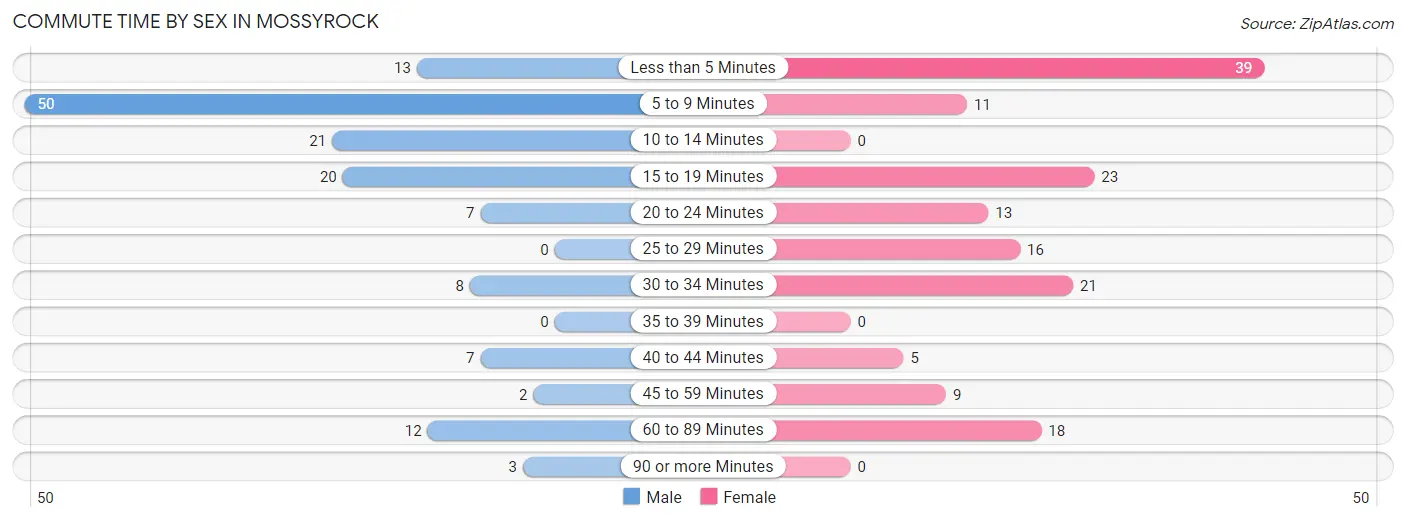
| Commute Time | Male | Female |
| Less than 5 Minutes | 13 (9.1%) | 39 (25.2%) |
| 5 to 9 Minutes | 50 (35.0%) | 11 (7.1%) |
| 10 to 14 Minutes | 21 (14.7%) | 0 (0.0%) |
| 15 to 19 Minutes | 20 (14.0%) | 23 (14.8%) |
| 20 to 24 Minutes | 7 (4.9%) | 13 (8.4%) |
| 25 to 29 Minutes | 0 (0.0%) | 16 (10.3%) |
| 30 to 34 Minutes | 8 (5.6%) | 21 (13.6%) |
| 35 to 39 Minutes | 0 (0.0%) | 0 (0.0%) |
| 40 to 44 Minutes | 7 (4.9%) | 5 (3.2%) |
| 45 to 59 Minutes | 2 (1.4%) | 9 (5.8%) |
| 60 to 89 Minutes | 12 (8.4%) | 18 (11.6%) |
| 90 or more Minutes | 3 (2.1%) | 0 (0.0%) |
Time of Departure to Work by Sex in Mossyrock
The most frequent times of departure to work in Mossyrock are 12:00 AM to 4:59 AM (43, 30.1%) for males and 7:00 AM to 7:29 AM (59, 38.1%) for females.
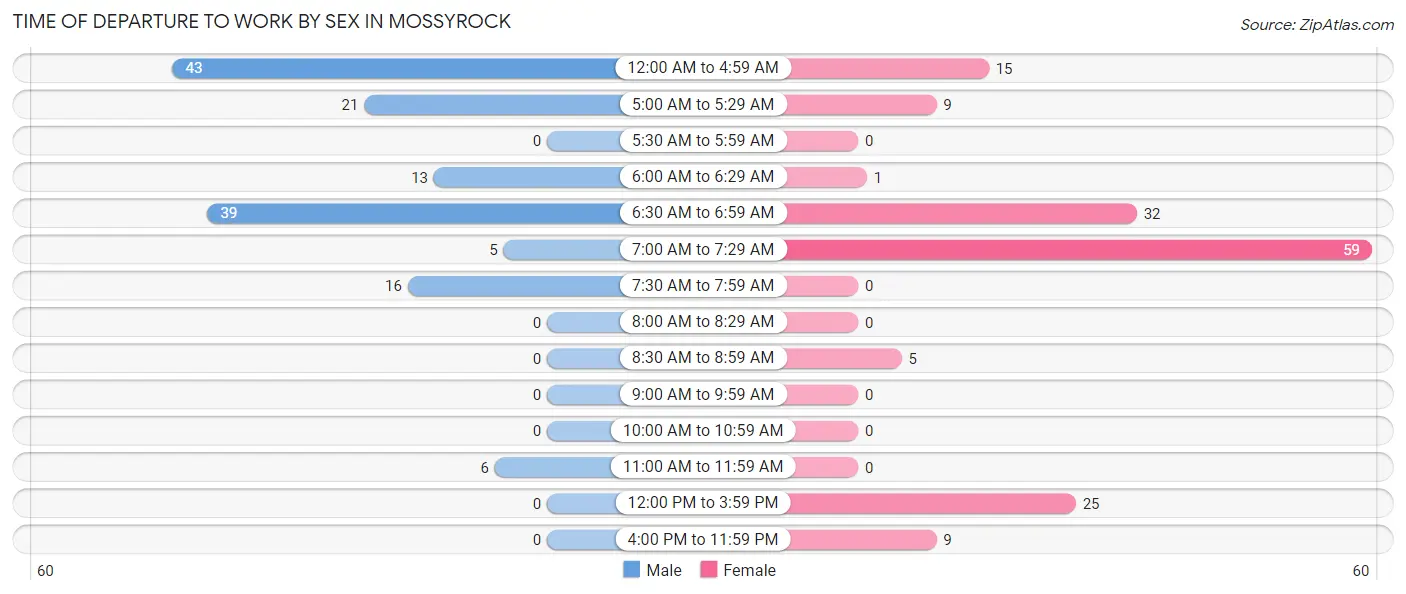
| Time of Departure | Male | Female |
| 12:00 AM to 4:59 AM | 43 (30.1%) | 15 (9.7%) |
| 5:00 AM to 5:29 AM | 21 (14.7%) | 9 (5.8%) |
| 5:30 AM to 5:59 AM | 0 (0.0%) | 0 (0.0%) |
| 6:00 AM to 6:29 AM | 13 (9.1%) | 1 (0.6%) |
| 6:30 AM to 6:59 AM | 39 (27.3%) | 32 (20.6%) |
| 7:00 AM to 7:29 AM | 5 (3.5%) | 59 (38.1%) |
| 7:30 AM to 7:59 AM | 16 (11.2%) | 0 (0.0%) |
| 8:00 AM to 8:29 AM | 0 (0.0%) | 0 (0.0%) |
| 8:30 AM to 8:59 AM | 0 (0.0%) | 5 (3.2%) |
| 9:00 AM to 9:59 AM | 0 (0.0%) | 0 (0.0%) |
| 10:00 AM to 10:59 AM | 0 (0.0%) | 0 (0.0%) |
| 11:00 AM to 11:59 AM | 6 (4.2%) | 0 (0.0%) |
| 12:00 PM to 3:59 PM | 0 (0.0%) | 25 (16.1%) |
| 4:00 PM to 11:59 PM | 0 (0.0%) | 9 (5.8%) |
| Total | 143 (100.0%) | 155 (100.0%) |
Housing Occupancy in Mossyrock
Occupancy by Ownership in Mossyrock
Of the total 293 dwellings in Mossyrock, owner-occupied units account for 185 (63.1%), while renter-occupied units make up 108 (36.9%).
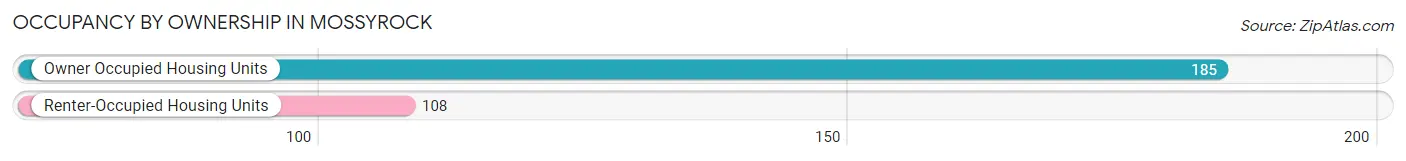
| Occupancy | # Housing Units | % Housing Units |
| Owner Occupied Housing Units | 185 | 63.1% |
| Renter-Occupied Housing Units | 108 | 36.9% |
| Total Occupied Housing Units | 293 | 100.0% |
Occupancy by Household Size in Mossyrock
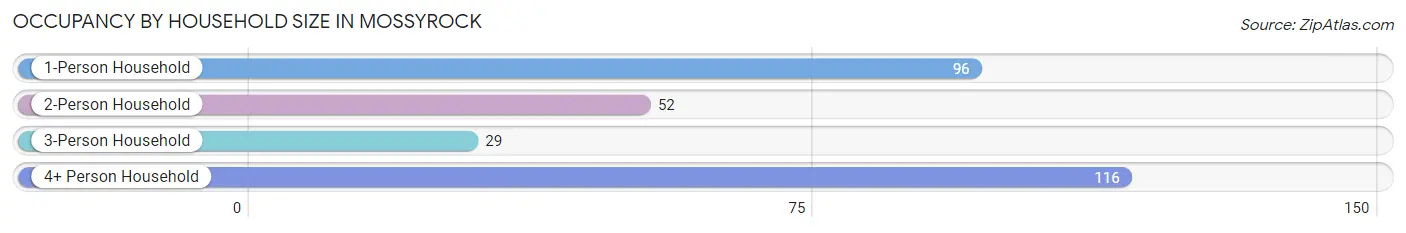
| Household Size | # Housing Units | % Housing Units |
| 1-Person Household | 96 | 32.8% |
| 2-Person Household | 52 | 17.7% |
| 3-Person Household | 29 | 9.9% |
| 4+ Person Household | 116 | 39.6% |
| Total Housing Units | 293 | 100.0% |
Occupancy by Ownership by Household Size in Mossyrock
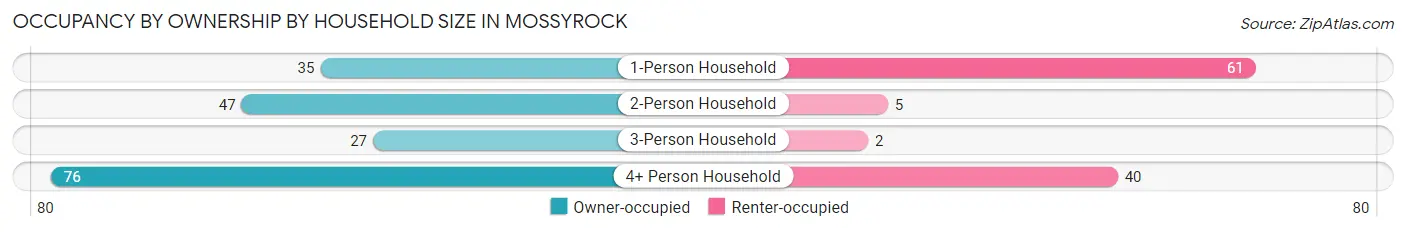
| Household Size | Owner-occupied | Renter-occupied |
| 1-Person Household | 35 (36.5%) | 61 (63.5%) |
| 2-Person Household | 47 (90.4%) | 5 (9.6%) |
| 3-Person Household | 27 (93.1%) | 2 (6.9%) |
| 4+ Person Household | 76 (65.5%) | 40 (34.5%) |
| Total Housing Units | 185 (63.1%) | 108 (36.9%) |
Occupancy by Educational Attainment in Mossyrock
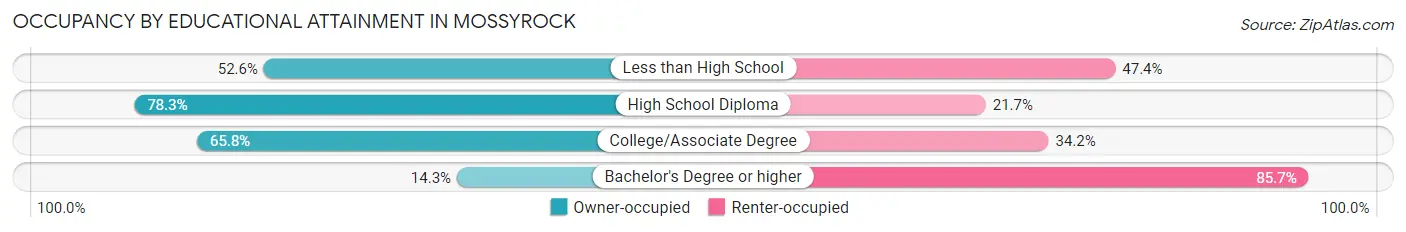
| Household Size | Owner-occupied | Renter-occupied |
| Less than High School | 51 (52.6%) | 46 (47.4%) |
| High School Diploma | 54 (78.3%) | 15 (21.7%) |
| College/Associate Degree | 79 (65.8%) | 41 (34.2%) |
| Bachelor's Degree or higher | 1 (14.3%) | 6 (85.7%) |
Occupancy by Age of Householder in Mossyrock
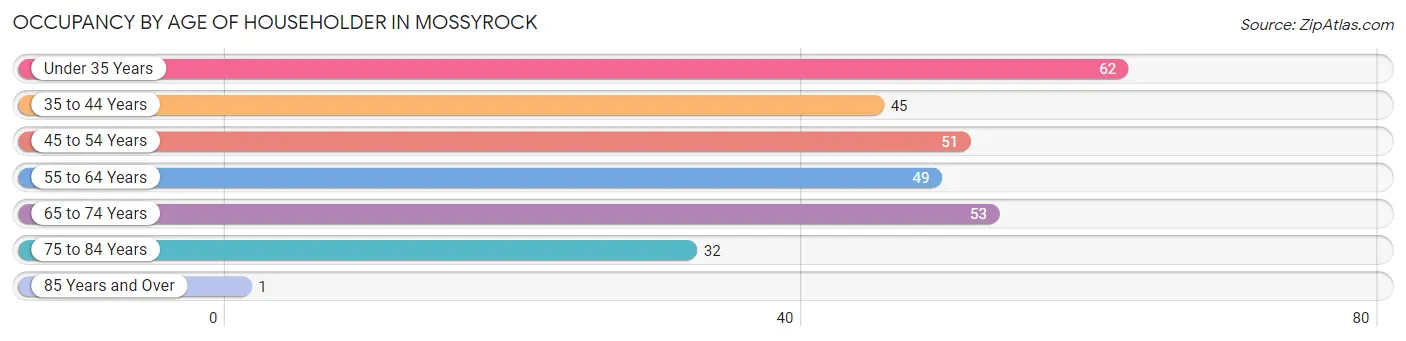
| Age Bracket | # Households | % Households |
| Under 35 Years | 62 | 21.2% |
| 35 to 44 Years | 45 | 15.4% |
| 45 to 54 Years | 51 | 17.4% |
| 55 to 64 Years | 49 | 16.7% |
| 65 to 74 Years | 53 | 18.1% |
| 75 to 84 Years | 32 | 10.9% |
| 85 Years and Over | 1 | 0.3% |
| Total | 293 | 100.0% |
Housing Finances in Mossyrock
Median Income by Occupancy in Mossyrock
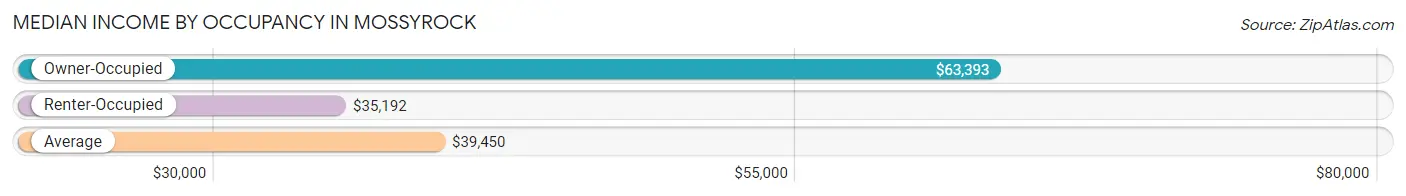
| Occupancy Type | # Households | Median Income |
| Owner-Occupied | 185 (63.1%) | $63,393 |
| Renter-Occupied | 108 (36.9%) | $35,192 |
| Average | 293 (100.0%) | $39,450 |
Occupancy by Householder Income Bracket in Mossyrock
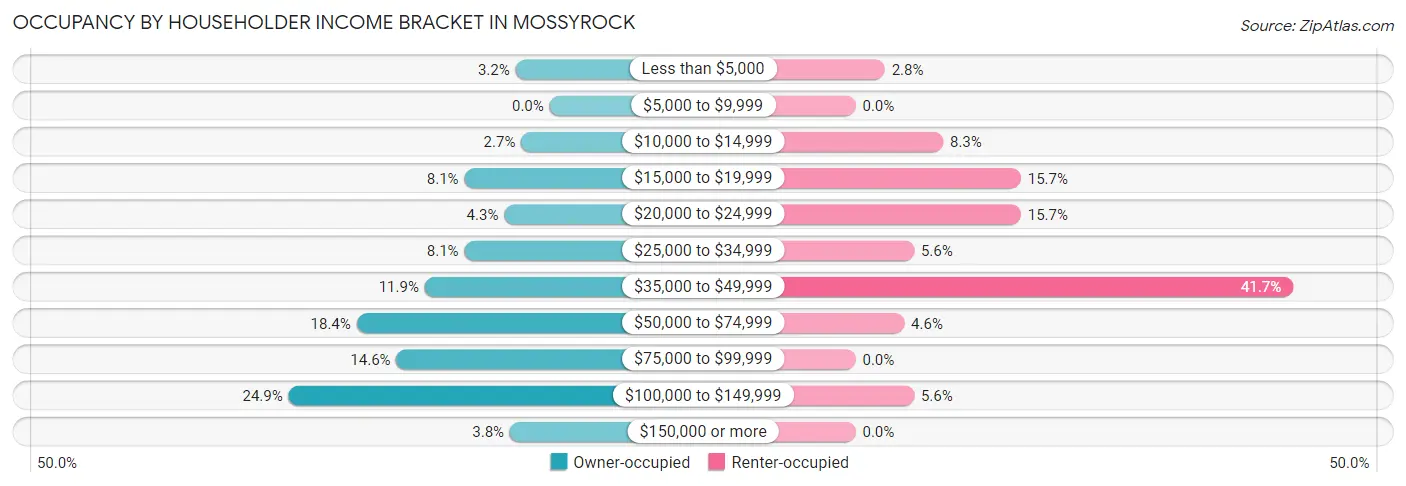
| Income Bracket | Owner-occupied | Renter-occupied |
| Less than $5,000 | 6 (3.2%) | 3 (2.8%) |
| $5,000 to $9,999 | 0 (0.0%) | 0 (0.0%) |
| $10,000 to $14,999 | 5 (2.7%) | 9 (8.3%) |
| $15,000 to $19,999 | 15 (8.1%) | 17 (15.7%) |
| $20,000 to $24,999 | 8 (4.3%) | 17 (15.7%) |
| $25,000 to $34,999 | 15 (8.1%) | 6 (5.6%) |
| $35,000 to $49,999 | 22 (11.9%) | 45 (41.7%) |
| $50,000 to $74,999 | 34 (18.4%) | 5 (4.6%) |
| $75,000 to $99,999 | 27 (14.6%) | 0 (0.0%) |
| $100,000 to $149,999 | 46 (24.9%) | 6 (5.6%) |
| $150,000 or more | 7 (3.8%) | 0 (0.0%) |
| Total | 185 (100.0%) | 108 (100.0%) |
Monthly Housing Cost Tiers in Mossyrock
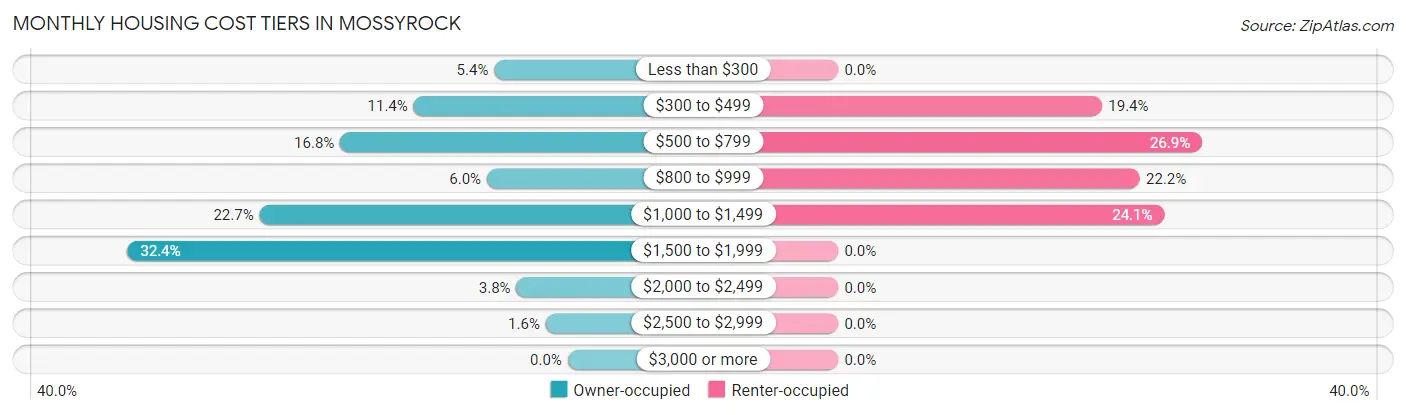
| Monthly Cost | Owner-occupied | Renter-occupied |
| Less than $300 | 10 (5.4%) | 0 (0.0%) |
| $300 to $499 | 21 (11.4%) | 21 (19.4%) |
| $500 to $799 | 31 (16.8%) | 29 (26.9%) |
| $800 to $999 | 11 (5.9%) | 24 (22.2%) |
| $1,000 to $1,499 | 42 (22.7%) | 26 (24.1%) |
| $1,500 to $1,999 | 60 (32.4%) | 0 (0.0%) |
| $2,000 to $2,499 | 7 (3.8%) | 0 (0.0%) |
| $2,500 to $2,999 | 3 (1.6%) | 0 (0.0%) |
| $3,000 or more | 0 (0.0%) | 0 (0.0%) |
| Total | 185 (100.0%) | 108 (100.0%) |
Physical Housing Characteristics in Mossyrock
Housing Structures in Mossyrock
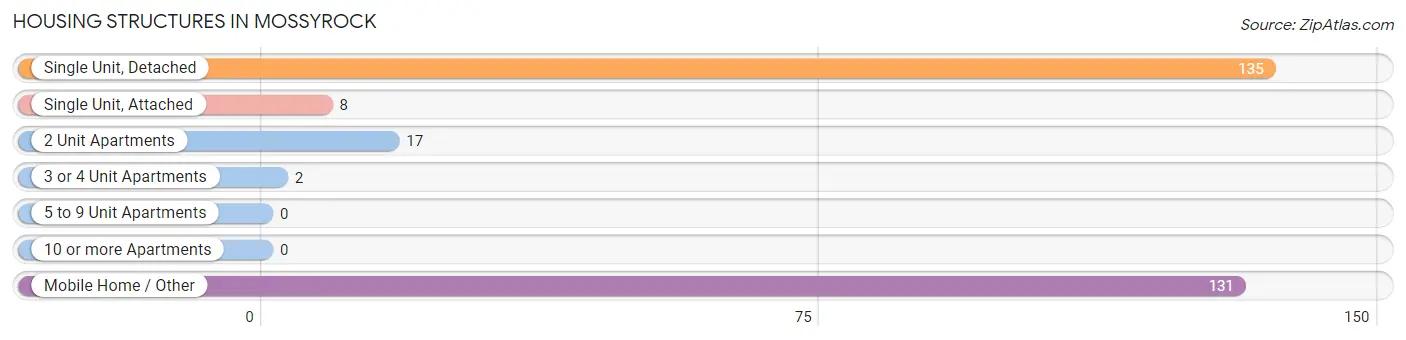
| Structure Type | # Housing Units | % Housing Units |
| Single Unit, Detached | 135 | 46.1% |
| Single Unit, Attached | 8 | 2.7% |
| 2 Unit Apartments | 17 | 5.8% |
| 3 or 4 Unit Apartments | 2 | 0.7% |
| 5 to 9 Unit Apartments | 0 | 0.0% |
| 10 or more Apartments | 0 | 0.0% |
| Mobile Home / Other | 131 | 44.7% |
| Total | 293 | 100.0% |
Housing Structures by Occupancy in Mossyrock
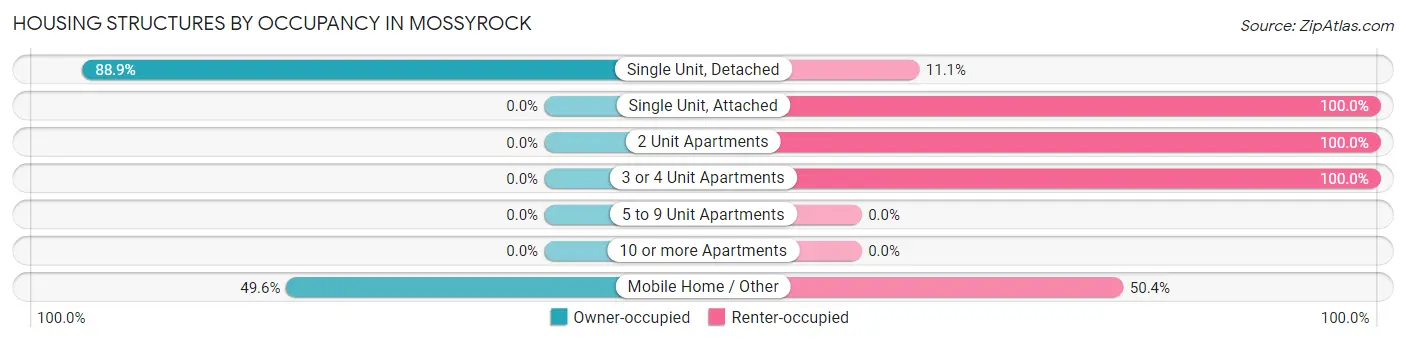
| Structure Type | Owner-occupied | Renter-occupied |
| Single Unit, Detached | 120 (88.9%) | 15 (11.1%) |
| Single Unit, Attached | 0 (0.0%) | 8 (100.0%) |
| 2 Unit Apartments | 0 (0.0%) | 17 (100.0%) |
| 3 or 4 Unit Apartments | 0 (0.0%) | 2 (100.0%) |
| 5 to 9 Unit Apartments | 0 (0.0%) | 0 (0.0%) |
| 10 or more Apartments | 0 (0.0%) | 0 (0.0%) |
| Mobile Home / Other | 65 (49.6%) | 66 (50.4%) |
| Total | 185 (63.1%) | 108 (36.9%) |
Housing Structures by Number of Rooms in Mossyrock
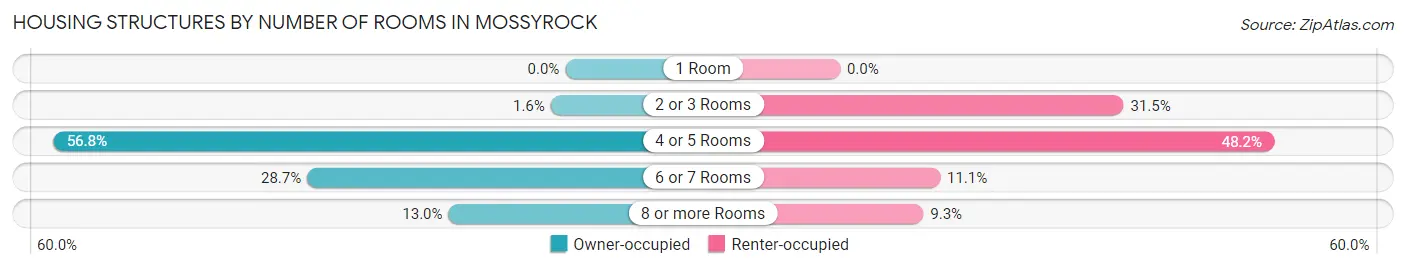
| Number of Rooms | Owner-occupied | Renter-occupied |
| 1 Room | 0 (0.0%) | 0 (0.0%) |
| 2 or 3 Rooms | 3 (1.6%) | 34 (31.5%) |
| 4 or 5 Rooms | 105 (56.8%) | 52 (48.1%) |
| 6 or 7 Rooms | 53 (28.6%) | 12 (11.1%) |
| 8 or more Rooms | 24 (13.0%) | 10 (9.3%) |
| Total | 185 (100.0%) | 108 (100.0%) |
Housing Structure by Heating Type in Mossyrock
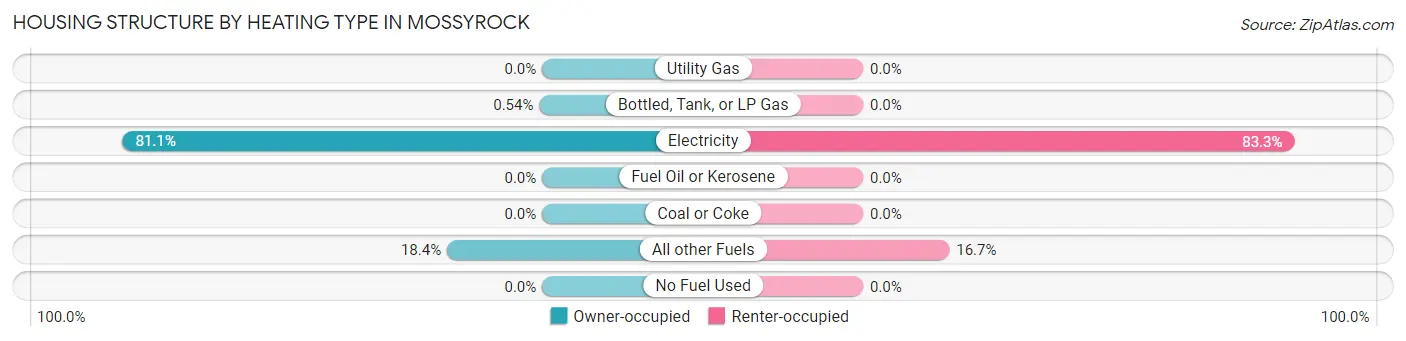
| Heating Type | Owner-occupied | Renter-occupied |
| Utility Gas | 0 (0.0%) | 0 (0.0%) |
| Bottled, Tank, or LP Gas | 1 (0.5%) | 0 (0.0%) |
| Electricity | 150 (81.1%) | 90 (83.3%) |
| Fuel Oil or Kerosene | 0 (0.0%) | 0 (0.0%) |
| Coal or Coke | 0 (0.0%) | 0 (0.0%) |
| All other Fuels | 34 (18.4%) | 18 (16.7%) |
| No Fuel Used | 0 (0.0%) | 0 (0.0%) |
| Total | 185 (100.0%) | 108 (100.0%) |
Household Vehicle Usage in Mossyrock
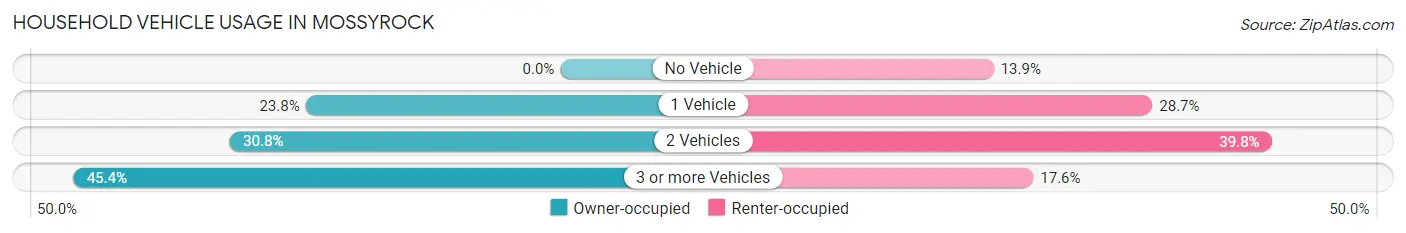
| Vehicles per Household | Owner-occupied | Renter-occupied |
| No Vehicle | 0 (0.0%) | 15 (13.9%) |
| 1 Vehicle | 44 (23.8%) | 31 (28.7%) |
| 2 Vehicles | 57 (30.8%) | 43 (39.8%) |
| 3 or more Vehicles | 84 (45.4%) | 19 (17.6%) |
| Total | 185 (100.0%) | 108 (100.0%) |
Real Estate & Mortgages in Mossyrock
Real Estate and Mortgage Overview in Mossyrock
| Characteristic | Without Mortgage | With Mortgage |
| Housing Units | 46 | 139 |
| Median Property Value | $9,999 | $191,300 |
| Median Household Income | $24,688 | $7 |
| Monthly Housing Costs | - | - |
| Real Estate Taxes | $199 | $26 |
Property Value by Mortgage Status in Mossyrock
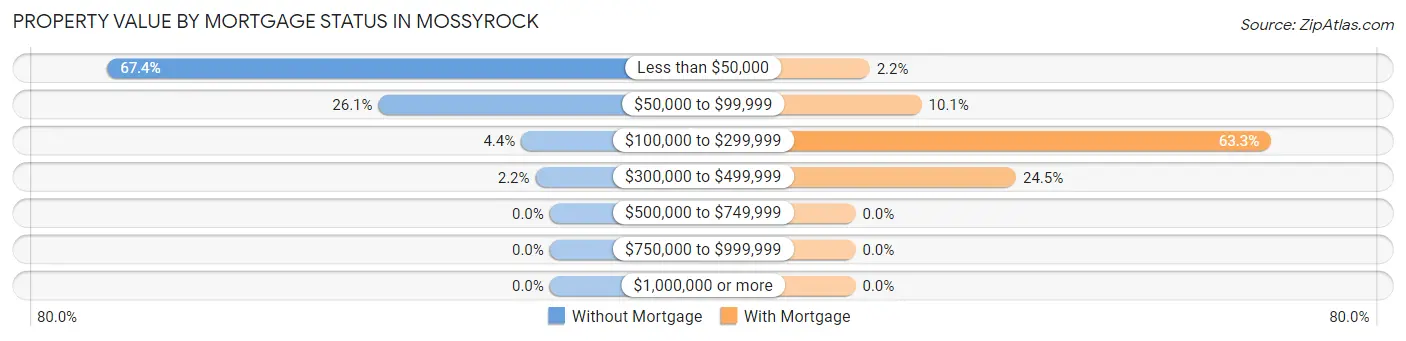
| Property Value | Without Mortgage | With Mortgage |
| Less than $50,000 | 31 (67.4%) | 3 (2.2%) |
| $50,000 to $99,999 | 12 (26.1%) | 14 (10.1%) |
| $100,000 to $299,999 | 2 (4.3%) | 88 (63.3%) |
| $300,000 to $499,999 | 1 (2.2%) | 34 (24.5%) |
| $500,000 to $749,999 | 0 (0.0%) | 0 (0.0%) |
| $750,000 to $999,999 | 0 (0.0%) | 0 (0.0%) |
| $1,000,000 or more | 0 (0.0%) | 0 (0.0%) |
| Total | 46 (100.0%) | 139 (100.0%) |
Household Income by Mortgage Status in Mossyrock
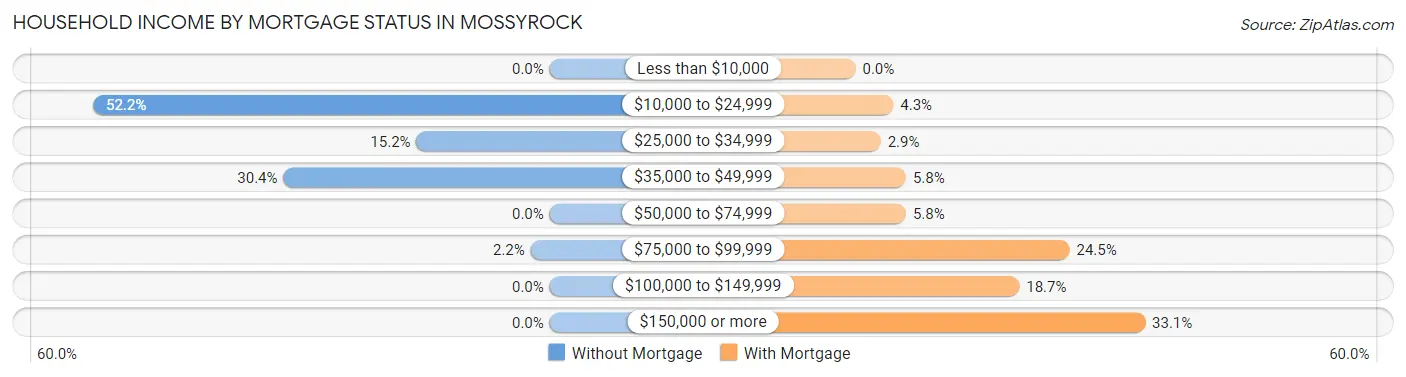
| Household Income | Without Mortgage | With Mortgage |
| Less than $10,000 | 0 (0.0%) | 0 (0.0%) |
| $10,000 to $24,999 | 24 (52.2%) | 6 (4.3%) |
| $25,000 to $34,999 | 7 (15.2%) | 4 (2.9%) |
| $35,000 to $49,999 | 14 (30.4%) | 8 (5.8%) |
| $50,000 to $74,999 | 0 (0.0%) | 8 (5.8%) |
| $75,000 to $99,999 | 1 (2.2%) | 34 (24.5%) |
| $100,000 to $149,999 | 0 (0.0%) | 26 (18.7%) |
| $150,000 or more | 0 (0.0%) | 46 (33.1%) |
| Total | 46 (100.0%) | 139 (100.0%) |
Property Value to Household Income Ratio in Mossyrock
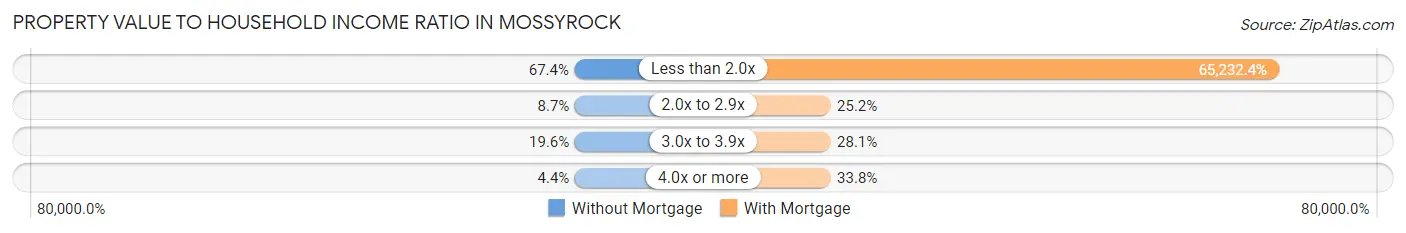
| Value-to-Income Ratio | Without Mortgage | With Mortgage |
| Less than 2.0x | 31 (67.4%) | 90,673 (65,232.4%) |
| 2.0x to 2.9x | 4 (8.7%) | 35 (25.2%) |
| 3.0x to 3.9x | 9 (19.6%) | 39 (28.1%) |
| 4.0x or more | 2 (4.3%) | 47 (33.8%) |
| Total | 46 (100.0%) | 139 (100.0%) |
Real Estate Taxes by Mortgage Status in Mossyrock
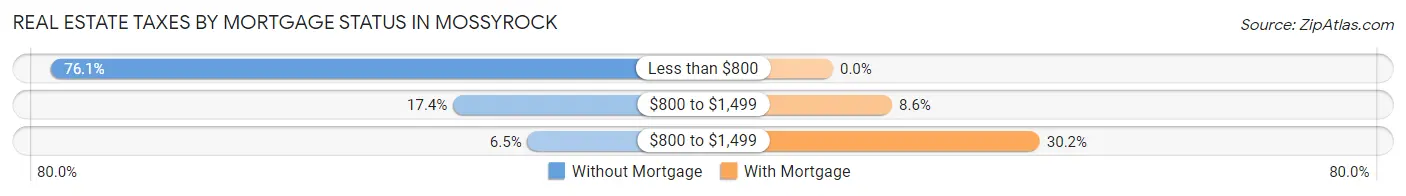
| Property Taxes | Without Mortgage | With Mortgage |
| Less than $800 | 35 (76.1%) | 0 (0.0%) |
| $800 to $1,499 | 8 (17.4%) | 12 (8.6%) |
| $800 to $1,499 | 3 (6.5%) | 42 (30.2%) |
| Total | 46 (100.0%) | 139 (100.0%) |
Health & Disability in Mossyrock
Health Insurance Coverage by Age in Mossyrock
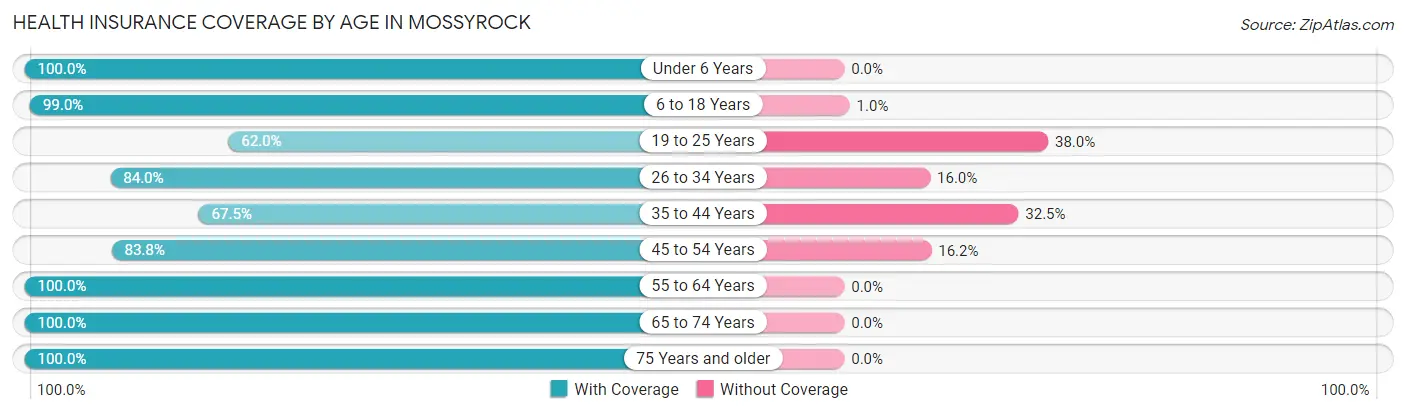
| Age Bracket | With Coverage | Without Coverage |
| Under 6 Years | 77 (100.0%) | 0 (0.0%) |
| 6 to 18 Years | 297 (99.0%) | 3 (1.0%) |
| 19 to 25 Years | 31 (62.0%) | 19 (38.0%) |
| 26 to 34 Years | 84 (84.0%) | 16 (16.0%) |
| 35 to 44 Years | 77 (67.5%) | 37 (32.5%) |
| 45 to 54 Years | 62 (83.8%) | 12 (16.2%) |
| 55 to 64 Years | 75 (100.0%) | 0 (0.0%) |
| 65 to 74 Years | 81 (100.0%) | 0 (0.0%) |
| 75 Years and older | 40 (100.0%) | 0 (0.0%) |
| Total | 824 (90.4%) | 87 (9.6%) |
Health Insurance Coverage by Citizenship Status in Mossyrock
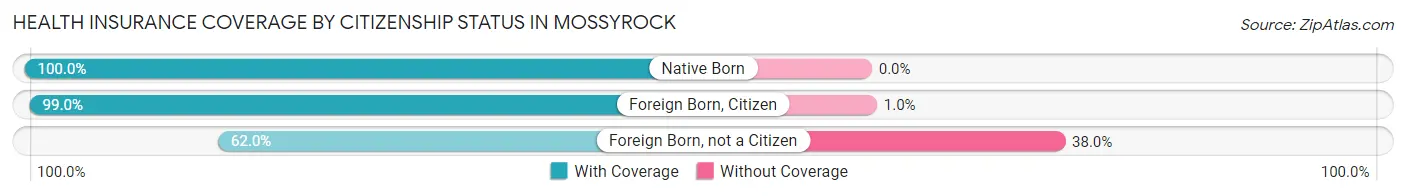
| Citizenship Status | With Coverage | Without Coverage |
| Native Born | 77 (100.0%) | 0 (0.0%) |
| Foreign Born, Citizen | 297 (99.0%) | 3 (1.0%) |
| Foreign Born, not a Citizen | 31 (62.0%) | 19 (38.0%) |
Health Insurance Coverage by Household Income in Mossyrock
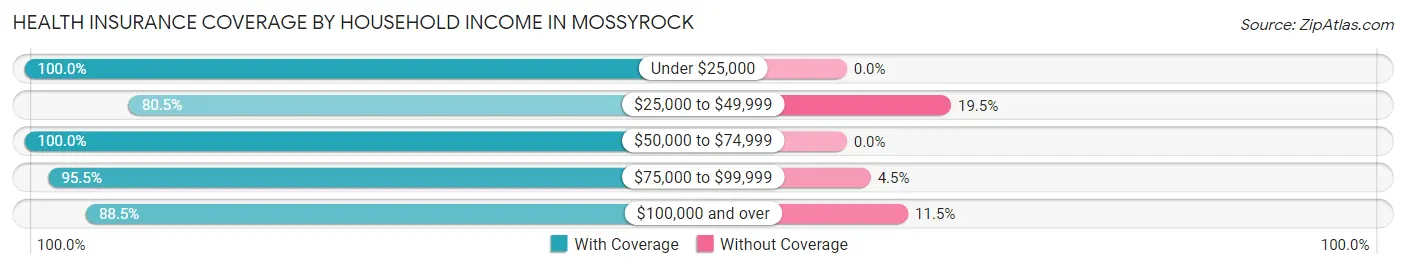
| Household Income | With Coverage | Without Coverage |
| Under $25,000 | 203 (100.0%) | 0 (0.0%) |
| $25,000 to $49,999 | 210 (80.5%) | 51 (19.5%) |
| $50,000 to $74,999 | 93 (100.0%) | 0 (0.0%) |
| $75,000 to $99,999 | 64 (95.5%) | 3 (4.5%) |
| $100,000 and over | 254 (88.5%) | 33 (11.5%) |
Public vs Private Health Insurance Coverage by Age in Mossyrock
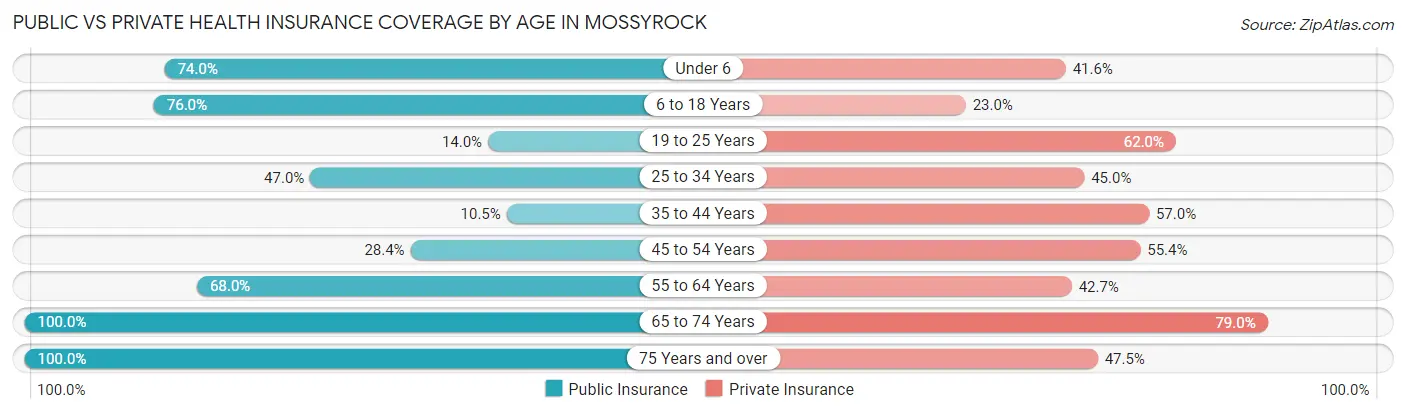
| Age Bracket | Public Insurance | Private Insurance |
| Under 6 | 57 (74.0%) | 32 (41.6%) |
| 6 to 18 Years | 228 (76.0%) | 69 (23.0%) |
| 19 to 25 Years | 7 (14.0%) | 31 (62.0%) |
| 25 to 34 Years | 47 (47.0%) | 45 (45.0%) |
| 35 to 44 Years | 12 (10.5%) | 65 (57.0%) |
| 45 to 54 Years | 21 (28.4%) | 41 (55.4%) |
| 55 to 64 Years | 51 (68.0%) | 32 (42.7%) |
| 65 to 74 Years | 81 (100.0%) | 64 (79.0%) |
| 75 Years and over | 40 (100.0%) | 19 (47.5%) |
| Total | 544 (59.7%) | 398 (43.7%) |
Disability Status by Sex by Age in Mossyrock
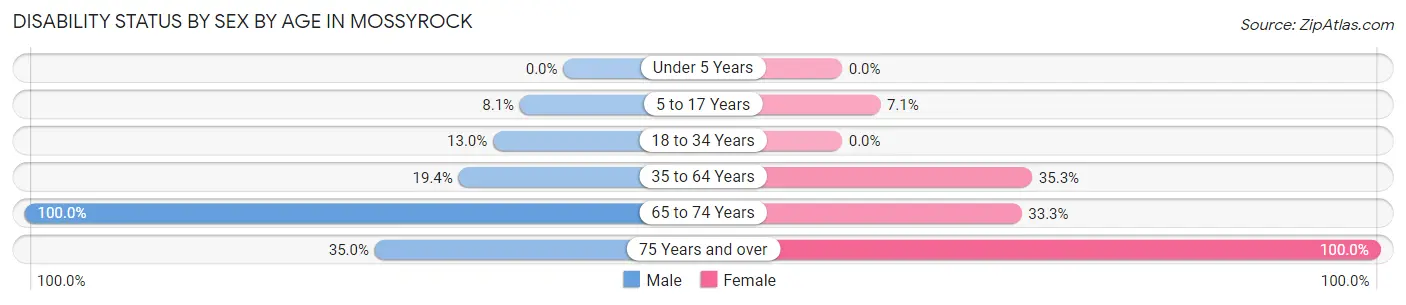
| Age Bracket | Male | Female |
| Under 5 Years | 0 (0.0%) | 0 (0.0%) |
| 5 to 17 Years | 15 (8.1%) | 10 (7.1%) |
| 18 to 34 Years | 6 (13.0%) | 0 (0.0%) |
| 35 to 64 Years | 28 (19.4%) | 42 (35.3%) |
| 65 to 74 Years | 36 (100.0%) | 15 (33.3%) |
| 75 Years and over | 7 (35.0%) | 20 (100.0%) |
Disability Class by Sex by Age in Mossyrock
Disability Class: Hearing Difficulty
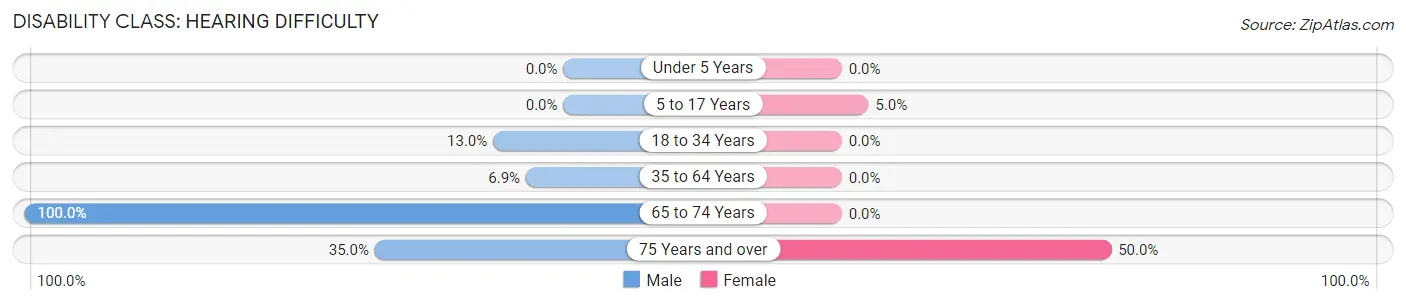
| Age Bracket | Male | Female |
| Under 5 Years | 0 (0.0%) | 0 (0.0%) |
| 5 to 17 Years | 0 (0.0%) | 7 (5.0%) |
| 18 to 34 Years | 6 (13.0%) | 0 (0.0%) |
| 35 to 64 Years | 10 (6.9%) | 0 (0.0%) |
| 65 to 74 Years | 36 (100.0%) | 0 (0.0%) |
| 75 Years and over | 7 (35.0%) | 10 (50.0%) |
Disability Class: Vision Difficulty
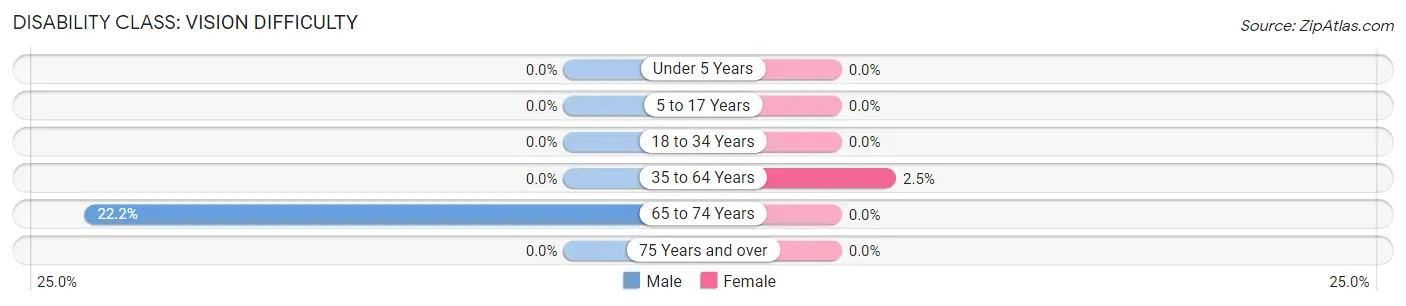
| Age Bracket | Male | Female |
| Under 5 Years | 0 (0.0%) | 0 (0.0%) |
| 5 to 17 Years | 0 (0.0%) | 0 (0.0%) |
| 18 to 34 Years | 0 (0.0%) | 0 (0.0%) |
| 35 to 64 Years | 0 (0.0%) | 3 (2.5%) |
| 65 to 74 Years | 8 (22.2%) | 0 (0.0%) |
| 75 Years and over | 0 (0.0%) | 0 (0.0%) |
Disability Class: Cognitive Difficulty
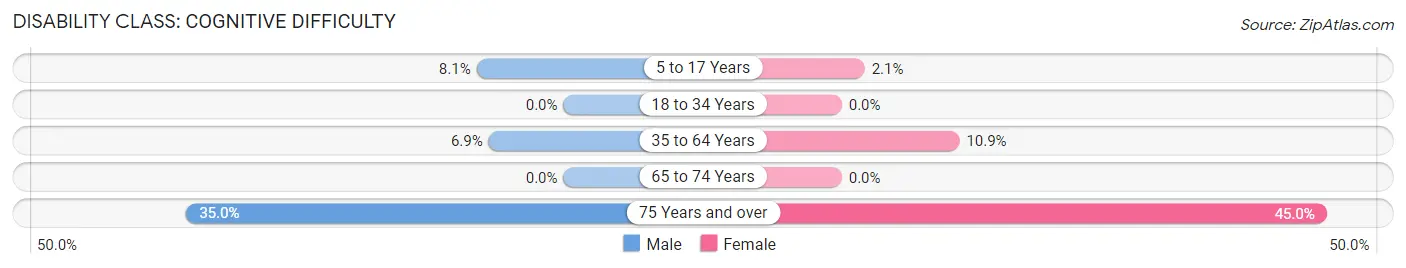
| Age Bracket | Male | Female |
| 5 to 17 Years | 15 (8.1%) | 3 (2.1%) |
| 18 to 34 Years | 0 (0.0%) | 0 (0.0%) |
| 35 to 64 Years | 10 (6.9%) | 13 (10.9%) |
| 65 to 74 Years | 0 (0.0%) | 0 (0.0%) |
| 75 Years and over | 7 (35.0%) | 9 (45.0%) |
Disability Class: Ambulatory Difficulty
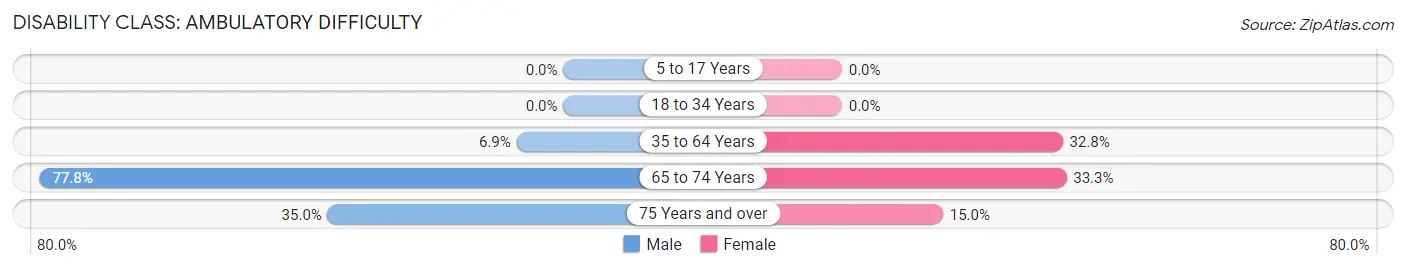
| Age Bracket | Male | Female |
| 5 to 17 Years | 0 (0.0%) | 0 (0.0%) |
| 18 to 34 Years | 0 (0.0%) | 0 (0.0%) |
| 35 to 64 Years | 10 (6.9%) | 39 (32.8%) |
| 65 to 74 Years | 28 (77.8%) | 15 (33.3%) |
| 75 Years and over | 7 (35.0%) | 3 (15.0%) |
Disability Class: Self-Care Difficulty
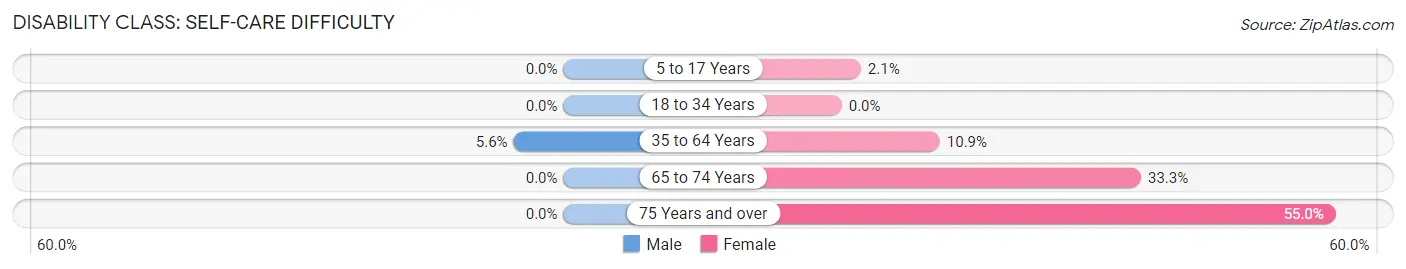
| Age Bracket | Male | Female |
| 5 to 17 Years | 0 (0.0%) | 3 (2.1%) |
| 18 to 34 Years | 0 (0.0%) | 0 (0.0%) |
| 35 to 64 Years | 8 (5.6%) | 13 (10.9%) |
| 65 to 74 Years | 0 (0.0%) | 15 (33.3%) |
| 75 Years and over | 0 (0.0%) | 11 (55.0%) |
Technology Access in Mossyrock
Computing Device Access in Mossyrock
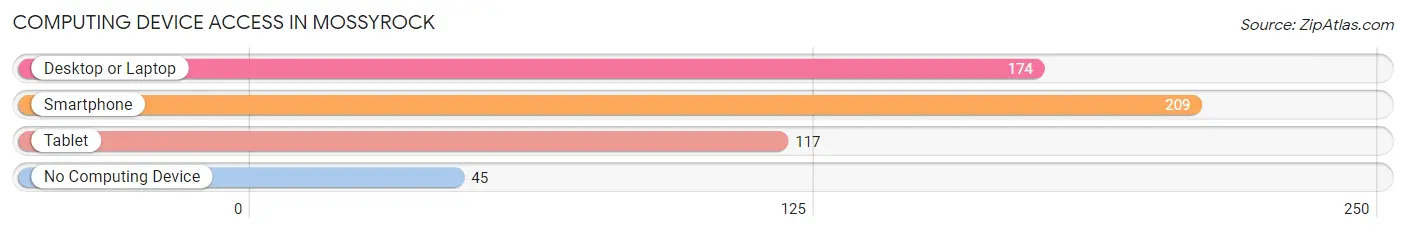
| Device Type | # Households | % Households |
| Desktop or Laptop | 174 | 59.4% |
| Smartphone | 209 | 71.3% |
| Tablet | 117 | 39.9% |
| No Computing Device | 45 | 15.4% |
| Total | 293 | 100.0% |
Internet Access in Mossyrock
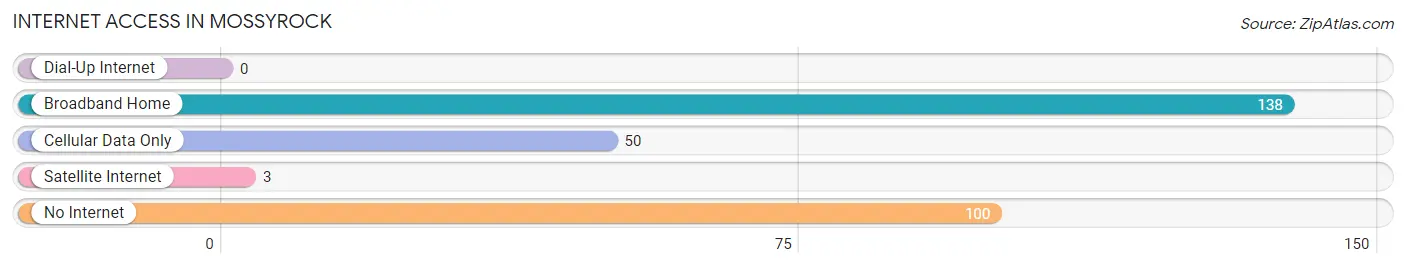
| Internet Type | # Households | % Households |
| Dial-Up Internet | 0 | 0.0% |
| Broadband Home | 138 | 47.1% |
| Cellular Data Only | 50 | 17.1% |
| Satellite Internet | 3 | 1.0% |
| No Internet | 100 | 34.1% |
| Total | 293 | 100.0% |
Mossyrock Summary
Mossyrock is a small town located in Lewis County, Washington, United States. It is situated along the Cowlitz River, approximately 50 miles south of the state capital, Olympia. The town was founded in 1883 and was originally known as "Mossy Rock" due to the large moss-covered rocks in the area. The town was officially incorporated in 1891 and the name was changed to Mossyrock.
Geography
Mossyrock is located in the foothills of the Cascade Mountains, at an elevation of 845 feet. The town is situated along the Cowlitz River, which is a major tributary of the Columbia River. The town is surrounded by lush forests and rolling hills, and is home to several lakes, including Riffe Lake, Mayfield Lake, and Deep Lake. The climate in Mossyrock is mild and temperate, with warm summers and cool winters.
Economy
Mossyrock's economy is largely based on timber and agriculture. The town is home to several lumber mills, and the surrounding forests provide an abundance of timber for the local industry. The town is also home to several farms, which produce a variety of crops, including apples, cherries, and pears. In addition, the town is home to several small businesses, including restaurants, shops, and a variety of other services.
Demographics
As of the 2010 census, Mossyrock had a population of 1,717. The racial makeup of the town was 94.3% White, 0.3% African American, 0.7% Native American, 0.3% Asian, 0.1% Pacific Islander, 0.7% from other races, and 3.6% from two or more races. Hispanic or Latino of any race were 2.2% of the population.
The median household income in Mossyrock was $37,917, and the median family income was $45,938. The per capita income for the town was $17,945. About 11.2% of families and 14.2% of the population were below the poverty line, including 18.2% of those under age 18 and 8.2% of those age 65 or over.
History
Mossyrock was founded in 1883 by a group of settlers from Oregon. The town was originally known as "Mossy Rock" due to the large moss-covered rocks in the area. The town was officially incorporated in 1891 and the name was changed to Mossyrock.
In the early 1900s, the town was a major logging center, and the surrounding forests provided an abundance of timber for the local industry. The town was also home to several farms, which produced a variety of crops, including apples, cherries, and pears.
In the 1950s, the town began to experience a decline in its economy, as the logging industry began to decline. In the 1970s, the town began to experience a resurgence, as the local economy began to diversify. Today, Mossyrock is a small but vibrant community, with a variety of businesses and services.
Common Questions
What is Per Capita Income in Mossyrock?
Per Capita income in Mossyrock is $19,909.
What is the Median Family Income in Mossyrock?
Median Family Income in Mossyrock is $51,382.
What is the Median Household income in Mossyrock?
Median Household Income in Mossyrock is $39,450.
What is Income or Wage Gap in Mossyrock?
Income or Wage Gap in Mossyrock is 48.1%.
Women in Mossyrock earn 51.9 cents for every dollar earned by a man.
What is Inequality or Gini Index in Mossyrock?
Inequality or Gini Index in Mossyrock is 0.43.
What is the Total Population of Mossyrock?
Total Population of Mossyrock is 911.
What is the Total Male Population of Mossyrock?
Total Male Population of Mossyrock is 453.
What is the Total Female Population of Mossyrock?
Total Female Population of Mossyrock is 458.
What is the Ratio of Males per 100 Females in Mossyrock?
There are 98.91 Males per 100 Females in Mossyrock.
What is the Ratio of Females per 100 Males in Mossyrock?
There are 101.10 Females per 100 Males in Mossyrock.
What is the Median Population Age in Mossyrock?
Median Population Age in Mossyrock is 28.6 Years.
What is the Average Family Size in Mossyrock
Average Family Size in Mossyrock is 4.1 People.
What is the Average Household Size in Mossyrock
Average Household Size in Mossyrock is 3.1 People.
How Large is the Labor Force in Mossyrock?
There are 332 People in the Labor Forcein in Mossyrock.
What is the Percentage of People in the Labor Force in Mossyrock?
58.3% of People are in the Labor Force in Mossyrock.
What is the Unemployment Rate in Mossyrock?
Unemployment Rate in Mossyrock is 3.9%.