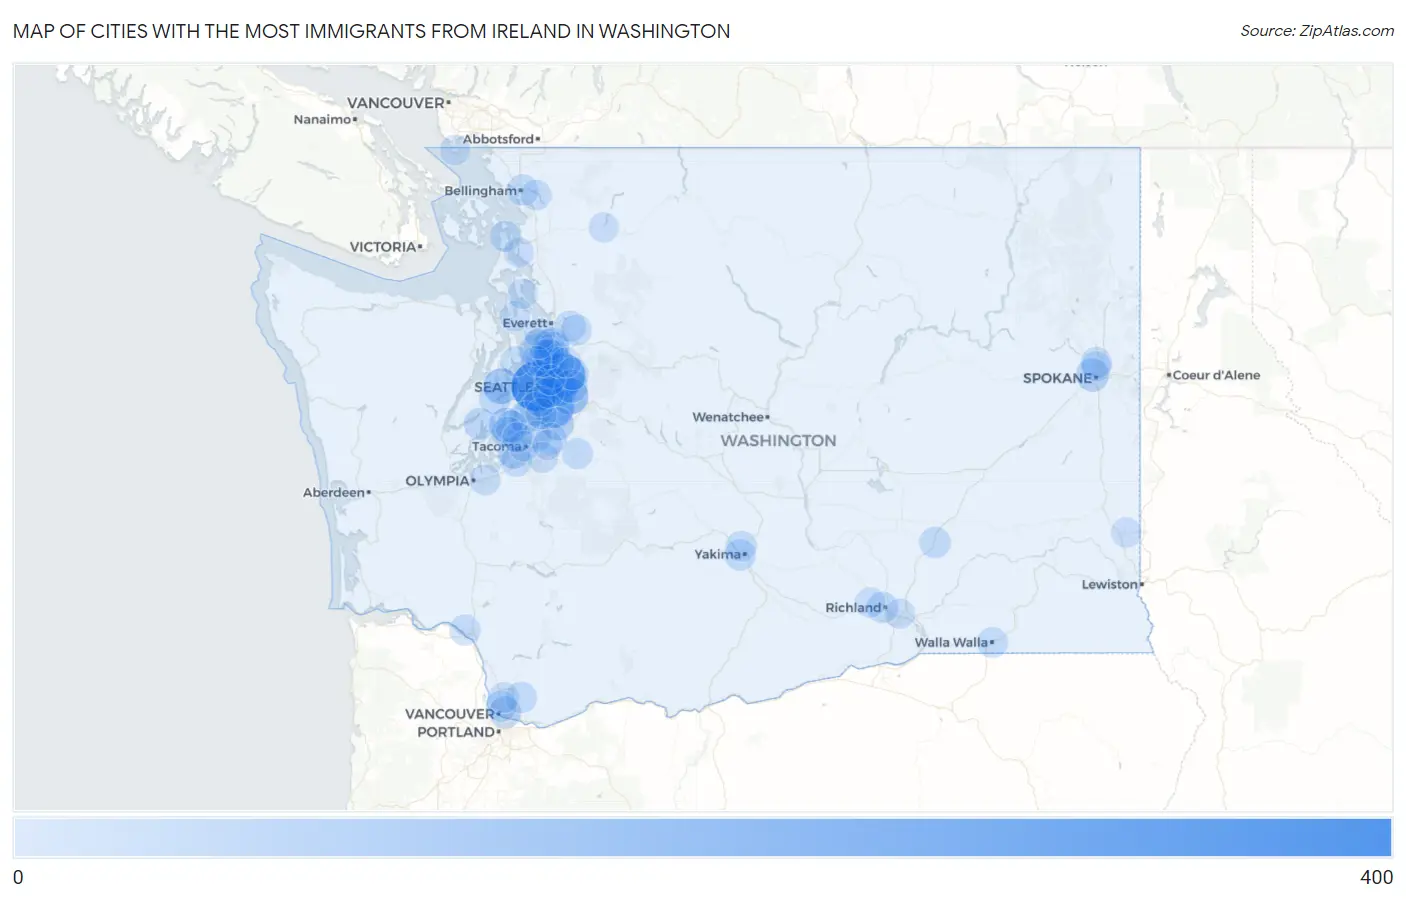
Cities with the Most Immigrants from Ireland in Washington
RELATED REPORTS & OPTIONS
Ireland
Washington
Compare Cities
Map of Cities with the Most Immigrants from Ireland in Washington
0
400
Cities with the Most Immigrants from Ireland in Washington
| City | Ireland | vs State | vs National | |
| 1. | Seattle | 357 | 2,812(12.70%)#1 | 119,836(0.30%)#17 |
| 2. | Redmond | 231 | 2,812(8.21%)#2 | 119,836(0.19%)#41 |
| 3. | Renton | 185 | 2,812(6.58%)#3 | 119,836(0.15%)#56 |
| 4. | Bellevue | 132 | 2,812(4.69%)#4 | 119,836(0.11%)#96 |
| 5. | Issaquah | 119 | 2,812(4.23%)#5 | 119,836(0.10%)#119 |
| 6. | Tracyton | 99 | 2,812(3.52%)#6 | 119,836(0.08%)#164 |
| 7. | Kirkland | 82 | 2,812(2.92%)#7 | 119,836(0.07%)#215 |
| 8. | Canterwood | 76 | 2,812(2.70%)#8 | 119,836(0.06%)#243 |
| 9. | Bothell | 71 | 2,812(2.52%)#9 | 119,836(0.06%)#257 |
| 10. | Kenmore | 66 | 2,812(2.35%)#10 | 119,836(0.06%)#275 |
| 11. | Burien | 59 | 2,812(2.10%)#11 | 119,836(0.05%)#314 |
| 12. | Spokane | 56 | 2,812(1.99%)#12 | 119,836(0.05%)#337 |
| 13. | Sammamish | 55 | 2,812(1.96%)#13 | 119,836(0.05%)#346 |
| 14. | Kent | 53 | 2,812(1.88%)#14 | 119,836(0.04%)#359 |
| 15. | Mill Creek | 45 | 2,812(1.60%)#15 | 119,836(0.04%)#433 |
| 16. | Union Hill Novelty Hill | 41 | 2,812(1.46%)#16 | 119,836(0.03%)#482 |
| 17. | University Place | 38 | 2,812(1.35%)#17 | 119,836(0.03%)#532 |
| 18. | Vashon | 38 | 2,812(1.35%)#18 | 119,836(0.03%)#535 |
| 19. | Vancouver | 35 | 2,812(1.24%)#19 | 119,836(0.03%)#574 |
| 20. | Lake Forest Park | 34 | 2,812(1.21%)#20 | 119,836(0.03%)#601 |
| 21. | Maplewood | 33 | 2,812(1.17%)#21 | 119,836(0.03%)#626 |
| 22. | Gig Harbor | 32 | 2,812(1.14%)#22 | 119,836(0.03%)#644 |
| 23. | Edmonds | 31 | 2,812(1.10%)#23 | 119,836(0.03%)#660 |
| 24. | Bremerton | 30 | 2,812(1.07%)#24 | 119,836(0.03%)#677 |
| 25. | Allyn | 30 | 2,812(1.07%)#25 | 119,836(0.03%)#691 |
| 26. | Martha Lake | 28 | 2,812(1.00%)#26 | 119,836(0.02%)#724 |
| 27. | Connell | 26 | 2,812(0.92%)#27 | 119,836(0.02%)#780 |
| 28. | Yakima | 25 | 2,812(0.89%)#28 | 119,836(0.02%)#789 |
| 29. | Richland | 25 | 2,812(0.89%)#29 | 119,836(0.02%)#794 |
| 30. | Hockinson | 24 | 2,812(0.85%)#30 | 119,836(0.02%)#842 |
| 31. | Bellingham | 22 | 2,812(0.78%)#31 | 119,836(0.02%)#886 |
| 32. | Auburn | 21 | 2,812(0.75%)#32 | 119,836(0.02%)#930 |
| 33. | Mill Creek East | 21 | 2,812(0.75%)#33 | 119,836(0.02%)#937 |
| 34. | Everett | 20 | 2,812(0.71%)#34 | 119,836(0.02%)#965 |
| 35. | Three Lakes | 20 | 2,812(0.71%)#35 | 119,836(0.02%)#998 |
| 36. | Lakewood | 17 | 2,812(0.60%)#36 | 119,836(0.01%)#1,085 |
| 37. | Longview | 17 | 2,812(0.60%)#37 | 119,836(0.01%)#1,093 |
| 38. | Hazel Dell | 17 | 2,812(0.60%)#38 | 119,836(0.01%)#1,097 |
| 39. | Country Homes | 17 | 2,812(0.60%)#39 | 119,836(0.01%)#1,118 |
| 40. | Enumclaw | 16 | 2,812(0.57%)#40 | 119,836(0.01%)#1,149 |
| 41. | Federal Way | 15 | 2,812(0.53%)#41 | 119,836(0.01%)#1,173 |
| 42. | Walla Walla | 15 | 2,812(0.53%)#42 | 119,836(0.01%)#1,182 |
| 43. | Anacortes | 15 | 2,812(0.53%)#43 | 119,836(0.01%)#1,199 |
| 44. | Selah | 15 | 2,812(0.53%)#44 | 119,836(0.01%)#1,208 |
| 45. | Brier | 14 | 2,812(0.50%)#45 | 119,836(0.01%)#1,282 |
| 46. | Lacey | 13 | 2,812(0.46%)#46 | 119,836(0.01%)#1,308 |
| 47. | Seatac | 13 | 2,812(0.46%)#47 | 119,836(0.01%)#1,318 |
| 48. | Boulevard Park | 13 | 2,812(0.46%)#48 | 119,836(0.01%)#1,347 |
| 49. | Mukilteo | 12 | 2,812(0.43%)#49 | 119,836(0.01%)#1,379 |
| 50. | Puyallup | 11 | 2,812(0.39%)#50 | 119,836(0.01%)#1,429 |
| 51. | Mount Vista | 10 | 2,812(0.36%)#51 | 119,836(0.01%)#1,524 |
| 52. | Mercer Island | 9 | 2,812(0.32%)#52 | 119,836(0.01%)#1,588 |
| 53. | Woodinville | 9 | 2,812(0.32%)#53 | 119,836(0.01%)#1,599 |
| 54. | Sudden Valley | 9 | 2,812(0.32%)#54 | 119,836(0.01%)#1,611 |
| 55. | Bothell West | 8 | 2,812(0.28%)#55 | 119,836(0.01%)#1,674 |
| 56. | Shoreline | 7 | 2,812(0.25%)#56 | 119,836(0.01%)#1,762 |
| 57. | West Richland | 7 | 2,812(0.25%)#57 | 119,836(0.01%)#1,783 |
| 58. | Freeland | 6 | 2,812(0.21%)#58 | 119,836(0.01%)#1,892 |
| 59. | Camano | 5 | 2,812(0.18%)#59 | 119,836(0.00%)#1,930 |
| 60. | Point Roberts | 5 | 2,812(0.18%)#60 | 119,836(0.00%)#1,969 |
| 61. | Pasco | 4 | 2,812(0.14%)#61 | 119,836(0.00%)#1,980 |
| 62. | Town And Country | 4 | 2,812(0.14%)#62 | 119,836(0.00%)#2,013 |
| 63. | Meadowdale | 4 | 2,812(0.14%)#63 | 119,836(0.00%)#2,018 |
| 64. | Yarrow Point | 4 | 2,812(0.14%)#64 | 119,836(0.00%)#2,034 |
| 65. | Tacoma | 3 | 2,812(0.11%)#65 | 119,836(0.00%)#2,043 |
| 66. | Pullman | 3 | 2,812(0.11%)#66 | 119,836(0.00%)#2,056 |
| 67. | Cottage Lake | 3 | 2,812(0.11%)#67 | 119,836(0.00%)#2,059 |
| 68. | Indianola | 3 | 2,812(0.11%)#68 | 119,836(0.00%)#2,070 |
| 69. | Ruston | 3 | 2,812(0.11%)#69 | 119,836(0.00%)#2,100 |
| 70. | La Conner | 3 | 2,812(0.11%)#70 | 119,836(0.00%)#2,108 |
| 71. | Concrete | 3 | 2,812(0.11%)#71 | 119,836(0.00%)#2,119 |
| 72. | Pacific | 1 | 2,812(0.04%)#72 | 119,836(0.00%)#2,218 |
Common Questions
What are the Top 10 Cities with the Most Immigrants from Ireland in Washington?
Top 10 Cities with the Most Immigrants from Ireland in Washington are:
What city has the Most Immigrants from Ireland in Washington?
Seattle has the Most Immigrants from Ireland in Washington with 357.
What is the Total Immigrants from Ireland in the State of Washington?
Total Immigrants from Ireland in Washington is 2,812.
What is the Total Immigrants from Ireland in the United States?
Total Immigrants from Ireland in the United States is 119,836.