Cities with the Highest Poverty Level in South Carolina
RELATED REPORTS & OPTIONS
Highest Poverty
South Carolina
Compare Cities
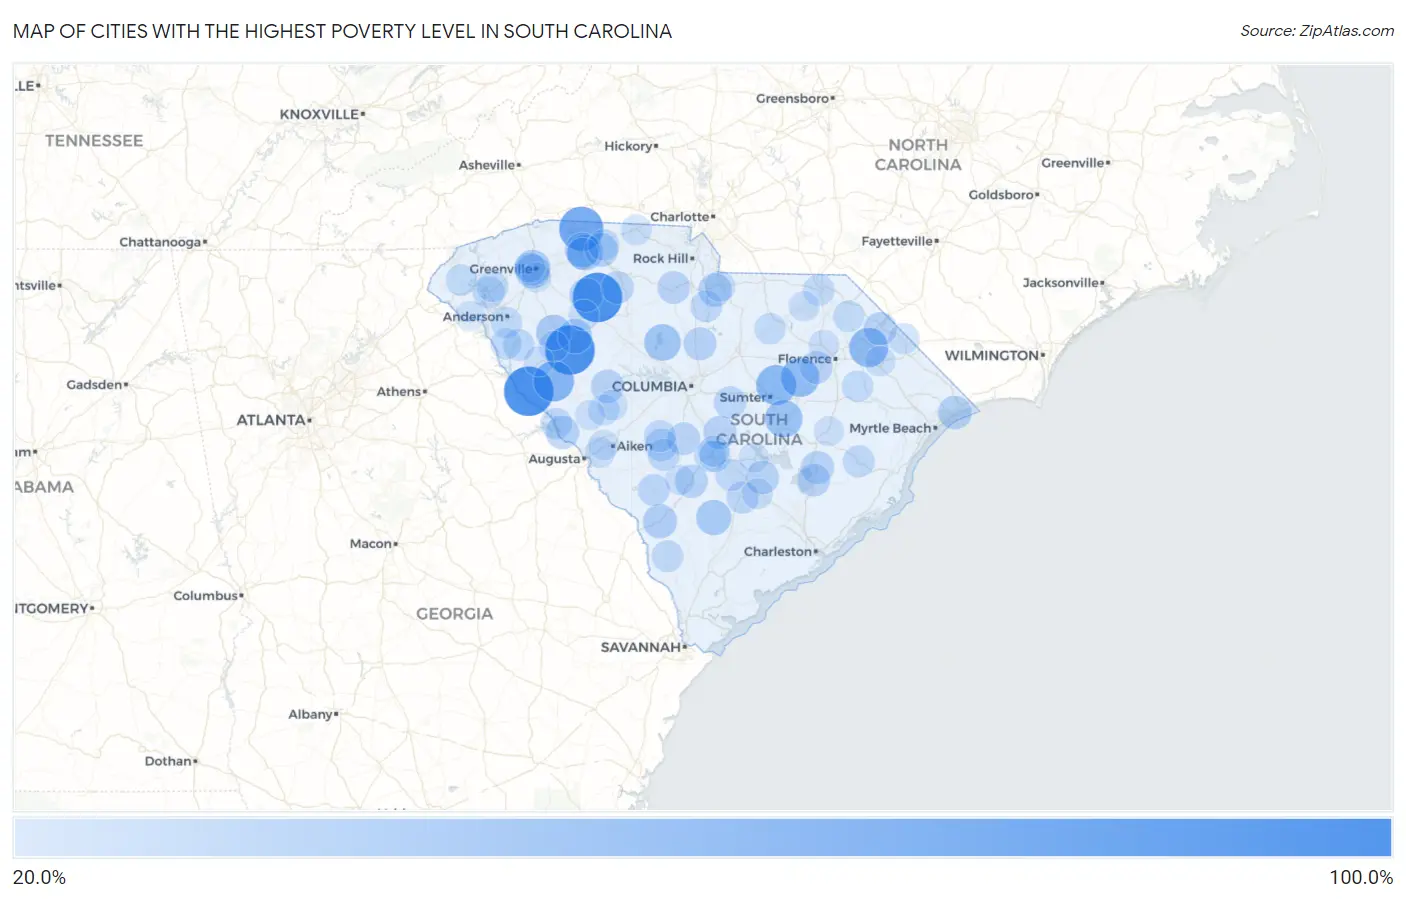
Map of Cities with the Highest Poverty Level in South Carolina
0.0%
100.0%
Cities with the Highest Poverty Level in South Carolina
| City | Poverty | vs State | vs National | |
| 1. | Willington | 100.0% | 14.4%(+85.6)#1 | 12.5%(+87.5)#33 |
| 2. | Coronaca | 100.0% | 14.4%(+85.6)#2 | 12.5%(+87.5)#63 |
| 3. | Cross Anchor | 100.0% | 14.4%(+85.6)#3 | 12.5%(+87.5)#74 |
| 4. | Coosawhatchie | 100.0% | 14.4%(+85.6)#4 | 12.5%(+87.5)#101 |
| 5. | Fingerville | 79.8% | 14.4%(+65.4)#5 | 12.5%(+67.3)#198 |
| 6. | Olympia | 74.6% | 14.4%(+60.2)#6 | 12.5%(+62.0)#245 |
| 7. | Clemson University | 73.8% | 14.4%(+59.5)#7 | 12.5%(+61.3)#253 |
| 8. | Bradley | 66.9% | 14.4%(+52.5)#8 | 12.5%(+54.3)#358 |
| 9. | Oswego | 64.5% | 14.4%(+50.1)#9 | 12.5%(+52.0)#405 |
| 10. | Little Rock | 62.3% | 14.4%(+47.9)#10 | 12.5%(+49.8)#456 |
| 11. | Sellers | 61.7% | 14.4%(+47.3)#11 | 12.5%(+49.1)#474 |
| 12. | Arthurtown | 60.7% | 14.4%(+46.3)#12 | 12.5%(+48.1)#499 |
| 13. | Lynchburg | 60.3% | 14.4%(+46.0)#13 | 12.5%(+47.8)#506 |
| 14. | Alcolu | 55.1% | 14.4%(+40.7)#14 | 12.5%(+42.5)#662 |
| 15. | Jenkinsville | 51.9% | 14.4%(+37.5)#15 | 12.5%(+39.3)#805 |
| 16. | Saxon | 48.7% | 14.4%(+34.3)#16 | 12.5%(+36.2)#987 |
| 17. | Dovesville | 48.6% | 14.4%(+34.3)#17 | 12.5%(+36.1)#993 |
| 18. | Ware Shoals | 48.0% | 14.4%(+33.7)#18 | 12.5%(+35.5)#1,026 |
| 19. | City View | 47.5% | 14.4%(+33.2)#19 | 12.5%(+35.0)#1,056 |
| 20. | Cash | 47.0% | 14.4%(+32.7)#20 | 12.5%(+34.5)#1,094 |
| 21. | Williams | 46.8% | 14.4%(+32.4)#21 | 12.5%(+34.3)#1,107 |
| 22. | Daviston | 46.7% | 14.4%(+32.4)#22 | 12.5%(+34.2)#1,111 |
| 23. | Centenary | 46.7% | 14.4%(+32.3)#23 | 12.5%(+34.1)#1,124 |
| 24. | Southern Shops | 45.3% | 14.4%(+30.9)#24 | 12.5%(+32.8)#1,229 |
| 25. | Judson | 44.8% | 14.4%(+30.4)#25 | 12.5%(+32.2)#1,267 |
| 26. | Waterloo | 44.7% | 14.4%(+30.3)#26 | 12.5%(+32.1)#1,273 |
| 27. | Allendale | 43.3% | 14.4%(+29.0)#27 | 12.5%(+30.8)#1,385 |
| 28. | Zion | 43.1% | 14.4%(+28.8)#28 | 12.5%(+30.6)#1,401 |
| 29. | Clifton | 42.3% | 14.4%(+28.0)#29 | 12.5%(+29.8)#1,477 |
| 30. | Atlantic Beach | 41.6% | 14.4%(+27.2)#30 | 12.5%(+29.0)#1,559 |
| 31. | Enoree | 41.5% | 14.4%(+27.1)#31 | 12.5%(+29.0)#1,562 |
| 32. | Irwin | 41.1% | 14.4%(+26.8)#32 | 12.5%(+28.6)#1,591 |
| 33. | Clarks Hill | 41.0% | 14.4%(+26.7)#33 | 12.5%(+28.5)#1,598 |
| 34. | St Matthews | 40.2% | 14.4%(+25.8)#34 | 12.5%(+27.6)#1,665 |
| 35. | Saluda | 40.1% | 14.4%(+25.7)#35 | 12.5%(+27.5)#1,675 |
| 36. | Holly Hill | 40.0% | 14.4%(+25.7)#36 | 12.5%(+27.5)#1,679 |
| 37. | Bamberg | 39.7% | 14.4%(+25.3)#37 | 12.5%(+27.1)#1,721 |
| 38. | Dillon | 39.6% | 14.4%(+25.2)#38 | 12.5%(+27.0)#1,733 |
| 39. | Ridgeway | 39.4% | 14.4%(+25.1)#39 | 12.5%(+26.9)#1,749 |
| 40. | St Stephen | 39.2% | 14.4%(+24.9)#40 | 12.5%(+26.7)#1,773 |
| 41. | Timmonsville | 38.9% | 14.4%(+24.5)#41 | 12.5%(+26.4)#1,805 |
| 42. | Bonneau | 38.5% | 14.4%(+24.1)#42 | 12.5%(+26.0)#1,847 |
| 43. | North | 38.4% | 14.4%(+24.1)#43 | 12.5%(+25.9)#1,853 |
| 44. | Drayton | 38.4% | 14.4%(+24.1)#44 | 12.5%(+25.9)#1,854 |
| 45. | Eureka Mill | 38.1% | 14.4%(+23.7)#45 | 12.5%(+25.5)#1,902 |
| 46. | Buffalo | 38.0% | 14.4%(+23.6)#46 | 12.5%(+25.4)#1,912 |
| 47. | Eastover | 37.6% | 14.4%(+23.2)#47 | 12.5%(+25.0)#1,968 |
| 48. | Lobeco | 37.2% | 14.4%(+22.9)#48 | 12.5%(+24.7)#2,016 |
| 49. | Salley | 37.0% | 14.4%(+22.7)#49 | 12.5%(+24.5)#2,054 |
| 50. | Hamer | 36.6% | 14.4%(+22.2)#50 | 12.5%(+24.0)#2,124 |
| 51. | St George | 36.6% | 14.4%(+22.2)#51 | 12.5%(+24.0)#2,127 |
| 52. | Clemson | 36.0% | 14.4%(+21.7)#52 | 12.5%(+23.5)#2,187 |
| 53. | Barnwell | 35.9% | 14.4%(+21.6)#53 | 12.5%(+23.4)#2,210 |
| 54. | Springfield | 35.9% | 14.4%(+21.5)#54 | 12.5%(+23.4)#2,218 |
| 55. | Andrews | 35.5% | 14.4%(+21.2)#55 | 12.5%(+23.0)#2,278 |
| 56. | Bowman | 35.4% | 14.4%(+21.1)#56 | 12.5%(+22.9)#2,300 |
| 57. | Arcadia | 35.3% | 14.4%(+20.9)#57 | 12.5%(+22.7)#2,320 |
| 58. | Antreville | 35.0% | 14.4%(+20.6)#58 | 12.5%(+22.4)#2,361 |
| 59. | Estill | 34.8% | 14.4%(+20.5)#59 | 12.5%(+22.3)#2,383 |
| 60. | Perry | 34.7% | 14.4%(+20.4)#60 | 12.5%(+22.2)#2,398 |
| 61. | Modoc | 34.7% | 14.4%(+20.3)#61 | 12.5%(+22.1)#2,405 |
| 62. | Great Falls | 34.6% | 14.4%(+20.2)#62 | 12.5%(+22.0)#2,422 |
| 63. | Central | 34.3% | 14.4%(+20.0)#63 | 12.5%(+21.8)#2,465 |
| 64. | Homeland Park | 34.2% | 14.4%(+19.9)#64 | 12.5%(+21.7)#2,483 |
| 65. | Orangeburg | 34.0% | 14.4%(+19.7)#65 | 12.5%(+21.5)#2,531 |
| 66. | Wilkinson Heights | 33.9% | 14.4%(+19.5)#66 | 12.5%(+21.3)#2,554 |
| 67. | Iva | 33.9% | 14.4%(+19.5)#67 | 12.5%(+21.3)#2,561 |
| 68. | Cheraw | 33.8% | 14.4%(+19.4)#68 | 12.5%(+21.2)#2,577 |
| 69. | Bethune | 33.7% | 14.4%(+19.4)#69 | 12.5%(+21.2)#2,588 |
| 70. | Cowpens | 33.6% | 14.4%(+19.3)#70 | 12.5%(+21.1)#2,608 |
| 71. | Walhalla | 33.5% | 14.4%(+19.2)#71 | 12.5%(+21.0)#2,628 |
| 72. | Pamplico | 33.5% | 14.4%(+19.1)#72 | 12.5%(+20.9)#2,638 |
| 73. | Brookdale | 33.4% | 14.4%(+19.0)#73 | 12.5%(+20.8)#2,645 |
| 74. | Blenheim | 33.3% | 14.4%(+19.0)#74 | 12.5%(+20.8)#2,664 |
| 75. | Unity | 32.9% | 14.4%(+18.5)#75 | 12.5%(+20.3)#2,760 |
| 76. | Johnston | 32.4% | 14.4%(+18.0)#76 | 12.5%(+19.8)#2,866 |
| 77. | Lake View | 32.4% | 14.4%(+18.0)#77 | 12.5%(+19.8)#2,872 |
| 78. | Adams Run | 31.8% | 14.4%(+17.4)#78 | 12.5%(+19.2)#3,008 |
| 79. | Lancaster | 31.6% | 14.4%(+17.2)#79 | 12.5%(+19.0)#3,068 |
| 80. | Blacksburg | 31.5% | 14.4%(+17.2)#80 | 12.5%(+19.0)#3,076 |
| 81. | Harleyville | 31.3% | 14.4%(+16.9)#81 | 12.5%(+18.7)#3,122 |
| 82. | Hodges | 31.2% | 14.4%(+16.9)#82 | 12.5%(+18.7)#3,138 |
| 83. | Darlington | 30.9% | 14.4%(+16.5)#83 | 12.5%(+18.4)#3,207 |
| 84. | Watts Mills | 30.7% | 14.4%(+16.4)#84 | 12.5%(+18.2)#3,249 |
| 85. | Marion | 30.7% | 14.4%(+16.3)#85 | 12.5%(+18.2)#3,251 |
| 86. | Grover | 30.6% | 14.4%(+16.2)#86 | 12.5%(+18.0)#3,282 |
| 87. | Patrick | 30.4% | 14.4%(+16.0)#87 | 12.5%(+17.9)#3,317 |
| 88. | Langley | 30.2% | 14.4%(+15.8)#88 | 12.5%(+17.6)#3,368 |
| 89. | Ward | 30.2% | 14.4%(+15.8)#89 | 12.5%(+17.6)#3,372 |
| 90. | Homewood | 30.1% | 14.4%(+15.7)#90 | 12.5%(+17.5)#3,391 |
| 91. | Graniteville | 29.8% | 14.4%(+15.5)#91 | 12.5%(+17.3)#3,440 |
| 92. | Abbeville | 29.7% | 14.4%(+15.4)#92 | 12.5%(+17.2)#3,463 |
| 93. | Edgefield | 29.7% | 14.4%(+15.4)#93 | 12.5%(+17.2)#3,464 |
| 94. | Fair Play | 29.6% | 14.4%(+15.3)#94 | 12.5%(+17.1)#3,489 |
| 95. | Rains | 29.6% | 14.4%(+15.2)#95 | 12.5%(+17.1)#3,496 |
| 96. | Denmark | 29.6% | 14.4%(+15.2)#96 | 12.5%(+17.0)#3,506 |
| 97. | Santee | 29.5% | 14.4%(+15.1)#97 | 12.5%(+17.0)#3,532 |
| 98. | Gantt | 29.4% | 14.4%(+15.0)#98 | 12.5%(+16.8)#3,573 |
| 99. | Kingstree | 29.2% | 14.4%(+14.9)#99 | 12.5%(+16.7)#3,606 |
| 100. | Parker | 29.2% | 14.4%(+14.8)#100 | 12.5%(+16.7)#3,616 |
Common Questions
What are the Top 10 Cities with the Highest Poverty Level in South Carolina?
Top 10 Cities with the Highest Poverty Level in South Carolina are:
#1
100.0%
#2
100.0%
#3
100.0%
#4
79.8%
#5
66.9%
#6
64.5%
#7
61.7%
#8
60.3%
#9
55.1%
#10
51.9%
What city has the Highest Poverty Level in South Carolina?
Willington has the Highest Poverty Level in South Carolina with 100.0%.
What is the Poverty Level in the State of South Carolina?
Poverty Level in South Carolina is 14.4%.
What is the Poverty Level in the United States?
Poverty Level in the United States is 12.5%.